22.1 – Beta
Over the last few chapters, we discussed various attributes of a mutual fund. We will continue the same in this chapter and focus on key risk measures of a mutual fund. Risk measures include various attributes such as –
- Beta
- Alpha
- Standard Deviation
- Sharpe Ratio
We will start with the beta.

One of the key attributes of the mutual fund is the ‘beta’ of the fund. The beta of a mutual fund is the measure of relative risk, expressed as number; Beta can take any value above or below zero. Beta gives us a perspective of the relative risk of the mutual fund vis a vis its benchmark.
I’ll not get into the details of how beta is calculated, I’ve done that in the Future’s module. Here is the link if you are interested to know the math behind –
https://zerodha.com/varsity/chapter/hedging-futures/
Section 11.5 of this chapter discusses the beta in detail. For this chapter, I’ll restrict myself to the application of beta and how you need to use this number. Have a look at the snapshot below –
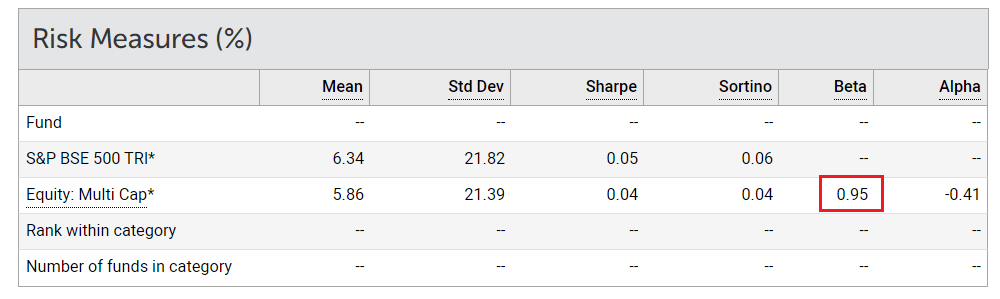
I’ve captured this from Value research; these attributes belong to Tata Multicap fund. As you can see, the fund is benchmarked against S&P BSE 500 TRI.
I’ve highlighted the beta of the fund, which is 0.95. Like I mentioned earlier, beta gives us a measure of the relative risk of the fund. In general,
If the beta of a mutual fund is less than 1, then the fund is perceived as less risky compared to its benchmark. For example, the Tata Multicap fund has a beta of 0.95, hence the fund is slightly less risky compared to its benchmark. I say slightly because it’s very close to 1. This implies, if S&P Sensex 500 falls by 1%, then Tata Multicap fund is expected to fall by 0.95%.
If the beta was 0.6 or 0.65, the fund is less risk or less volatile compared to its benchmark. Why? Because if S&P Sensex 500 falls by 1%, then Tata Multicap fund is expected to fall by only 0.65% and not 0.95%.
This is what I mean by ‘relative risk’; it gives us a perspective of how risky the fund is compared to its benchmark.
Now, if the beta of a mutual fund is equal to 1, then it means the fund is as risky as its benchmark. For example, if the benchmark falls by 1%, the fund is expected to fall by 1%. So both the benchmark and the fund are expected to have similar risk profiles.
Lastly, if the beta of the fund is higher than 1, it implies that the fund is risker compared to its benchmark. For instance, a beta of 1.2 suggests that the fund is 20% riskier compared to its benchmark. If the benchmark falls by 1%, the fund is expected to fall by 1.2%.
When you are looking at the Beta of a stock or an MF, it is very important to recognize the fact that the beta is a measure of relative risk, it tells us how risky the stock or MF is compared to its benchmark. Beta is not an indicator of the inherent risk of the stock or MF.
To put this in context, think about it this way, Ferrari is faster compared to a BMW, this comparison is like the beta. We measure the speed of car one against car two. But does this give you any indication of how fast the Ferrari is? Not really.
Likewise, while beta gives us a perspective of the relative riskiness of an asset, it does not give us the absolute or the inherent risk of the asset itself.
By now, you must have built your perception of beta. Let me ask you this – if a mutual fund has a high beta, do you think it is bad?
Well, the good, bad, ugly part of beta depends on another metric called the ‘Alpha’.
22.2 – Alpha
In the previous chapter, we briefly discussed alpha. We defined alpha as the excess return of the fund over and above the benchmark returns. Well, that is true, but we need to make a few small changes to that equation and include our newly introduced friend, beta. To understand alpha, we need to understand the concept of ‘Risk-free’ return. The risk-free return is the maximum return you can generate without taking any risk. By risk I mean – market risk, credit risk, interest rate risk, and unsystematic risk.
There are two return sources which fit in the above definition – (1) The return from the savings bank account (2) The fixed deposit return.
Of course, we can argue that the banks too are not safe and comes with some degree of risk. Understandable, but let’s keep that argument aside for this discussion 😊
Or if you are a stickler for definitions, let us stick to the treasury bills, issued by the Govt of India. The treasury bills have an implicit sovereign so its deemed safe.
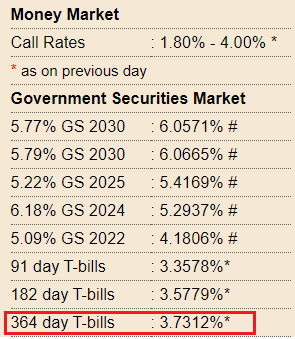
The T bill rates as of today are roughly about 3.75%, and let us keep 4% for convenience.
Alpha is defined as the excess return of the mutual fund over the benchmark return, on a risk-adjusted basis.
Risk-adjusted basis means we need to –
- Calculate the difference between the mutual fund returns and the risk-free return
- Calculate the difference between the benchmark return and the risk-free return, multiply this by the beta
- Take the difference between 1 and 2
Mathematically,
Alpha = (MF Return – riskfree return) – (Benchmark return – riskfree return)*Beta
Lets put this in context with an example. Assume a certain fund gives you a return of 10%, its benchmark returns for the same duration is 7%. The beta of the fund is 0.75. What do you think the alpha assuming the risk-free rate is 4%?
Let’s apply the for formula and check –
Alpha = (10%-4%)-(7%-4%)*0.75
= 6% – 2.25%
= 3.75%
As you can see, the alpha is not just the difference between the fund and its benchmark, which if true, the alpha would have been –
10% – 7%
=3%
But rather, the alpha is 3.75%.
Now, many of you may not find this intuitive. You may question where the additional 0.75% comes from.
Well, think about it, the fund has managed to generate a 10% return compared to the Index’s 7% while managing to stay significantly less volatile (remember beta is is just 0.75). Hence we are rewarding the fund for its good behaviour or less volatile behaviour. Therefore the alpha is 3.75% as opposed to just 3%.
Now, imagine the same fund, with the same returns, but the beta is 1.3 instead of 0.75. What do you think is the alpha?
By now, you should guess that since the beta is high, the fund gets penalised for its erratic behaviour. Therefore the alpha should be lower.
Let us see if the numbers agree to this thought.
Alpha = (10%-4%)-(7%-4%)*1.3
= 6% – 3.9%
= 2.1%
See that? While the returns remain the same, thanks to beta, the alpha is significantly lesser on a risk-adjusted basis.
To conclude, alpha is the excess return of the fund over above the benchmark returns. Alpha is a risk-adjusted. The fund is rewarded if the returns are generated by keeping a low-risk profile and penalized for being volatile.
By now, you must have realized that volatility plays an important role in measuring mutual funds performance. Beta is a measure of volatility; it tells us how risky the fund is when compared to its benchmark. Beta is a relative risk and does not reveal the fund’s inherent risk.
The inherent risk of a fund is revealed by the ‘Standard Deviation’ of the fund.
22.3 – Standard Deviation (SD)
I’ve explained the concept of ‘Standard Deviation’ in details here – https://zerodha.com/varsity/chapter/understanding-volatility-part-1/
I’d suggest you go through that entire chapter to understand the concept of standard deviation and volatility. This will help you not just in your MF investments, but also investments in stocks.
I’ll take the liberty of skipping the explanation of standard Deviation since its already explained. However, if you are in no mood to read an entire chapter to figure out the standard Deviation, then here is your shortcut –
- The standard deviation of a stock or a mutual fund represents the riskiness of the stock or the mutual fund
- Standard Deviation is a percentage, expressed as an annualised figure
- Higher the standard Deviation, higher is the volatility of the asset. Higher the volatility, higher is the risk.
For example, consider these two funds –

I’ve taken the snapshot from Value research. The funds under consideration are the Axis Small-cap fund and Axis long term equity.
The SD of the small-cap fund is 23.95% while the long term equity is 19.33%, which implies that the small-cap fund is way riskier compared to the long term equity fund.
To put this context, if you invest Rs.10,000/- across funds at the same time, then by the end of the year the profit or loss can be anywhere in this range –
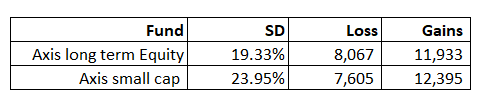
Loss = Investment * (1-SD)
Gains = Investment * (1+SD)
The larger the SD, the larger the possibility of loss or gains.
Generally speaking, the SD for mid and small-cap funds are higher compared to large-cap stocks.
Do note, volatility or Standard Deviation should not worry you. Markets are volatile, and equities are volatile, mutual funds are volatile; this is the very nature of markets. So if you can’t fathom watching your investment see-saw between gains and loss, then perhaps you should reconsider your investment decision in equities.
But if you do invest in equities, then you need to learn to manage volatility. There are two ways to deal with this beast called ‘Volatility’ –
- Diversify smartly (and not over diversify)
- Give your investment time
I think that time is the ultimate antidote against volatility. Give your investments time, and time will take care of volatility. All along with this module, I’ve stressed the importance of giving your MF investments time, and this is the reason why I’ve stressed on it.
Anyway, while at it, check the Alpha and Beta of both these funds. Few observations –
- The beta of both the funds is sub 1, which means compared to their benchmark they are relatively less risky. But how risky are they individually? We can answer this by looking at the SD
- Alpha is a positive number for both the funds, which is a good thing. The Alpha for Axis small-cap fund is quite impressive. I’d guess this is because of the low beta factor plus the low risk-free return prevailing in the economy.
I hope the risk parameters are starting to make sense to you. We will now shift focus to another parameter called the ‘Sharpe Ratio’.
22.4 – Sharpe Ratio
Sharpe Ratio is one of the most sacred formulas in Finance. It was invented by Willam F Sharpe, an American Economist in the year in 1966. He was awarded the Nobel prize in 1990 for his work the Capital asset pricing model.
Assume, there are two large-cap funds -Fund A and Fund B. Here is how they have performed in terms of returns –
Fund A – 14%
Fund B – 16%
Which of the two funds are better? Well, Fund B has a higher return, so without a doubt, Fund B is a better fund.
Now, consider the following –
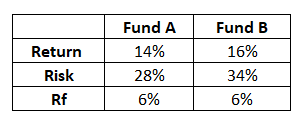
Rf is the risk-free return. Along with the fund’s return, I’ve also stated the standard deviation/volatility/risk of the two funds. Now, which of the two funds do you think is better?
I guess it gets a little complex to figure out which these two funds are better given that we have to evaluate them on two parameters, i.e. both the risk and return.
Ignoring the risk, purely on a return basis, Fund B is better. Ignoring the return, purely on a risk basis, Fund A is better. But in reality, you cannot isolate risk and reward; you need to factor in both these and figure out which of these two are better.
The Sharpe Ratio helps us here. It bundles the concept of risk, reward, and the risk-free rate and gives us a perspective.
Sharpe ratio = [Fund Return – Risk-Free Return]/Standard Deviation of the fund
Lets apply the math for Fund A –
= [14% – 6%] / 28%
= 8%/28%
= 0.29
The number tells us that the fund generates 0.29 units of return (over and above the risk-free return) for every unit of risk undertaken. Naturally, by this measure, the higher the Sharpe ratio, the better it is as we all want higher returns for every unit of risk undertaken.
Lets see how this turns out for Fund B –
= [16% – 6% ] / 34%
= 10% / 34%
= 0.29
So it turns out that both the funds are similar in terms of their risk and reward perspective. And there is no advantage of choosing Fund A over Fund B.
Now, instead of 34% standard deviation, assume Fund B’s standard Deviation is 18%.
[16% – 6% ] / 18%
= 10% / 18%
= 0.56
In this case, Fund B is a better choice because Fund B generates more return for every unit of risk undertaken.
Do note, Sharpe ratio considers only price based risk. It does not consider credit or interest rate risk. Hence, there is no point looking at the Sharpe ratio for debt funds.
In the next chapter, I’ll discuss the Sortino’s ratio and the Capture ratios and conclude our discussion on Mutual Fund risk parameters and then shift focus on building Mutual Fund portfolios.
And I promise I’ll put up the next chapter quickly 😊
Key takeaways from this chapter
- Beta measures the relative risk of the fund compared to its benchmark
- Higher the beta, higher is the relative risk
- Beta is not an indicator of the inherent risk of the fund
- Alpha is the excess return over and above the benchmark return on a risk-adjusted basis
- Higher the beta, lower is the alpha and vice versa
- The standard Deviation measures the riskiness of the fund. Higher the SD, higher is the volatility of the fund
- Sharpe ratio measures the unit of return earned for every unit of risk undertaken
- Higher the Sharpe ratio, better is the fund.
Hello Karthik,
At the outset, thanks for all the wonderful learning material. I wish I had come to know about this earlier.
I have a query about the potential loss and gains comparison you have done between Axis Long Term Equity and Axis SmallCap fund. I understand that Axis Small Cap has a greater SD and hence is riskier than Axis LTE fund. Because of the higher SD, Axis SmallCap has a higher potential gain. But, when it comes to losses, Axis Small Cap has a lower loss (7605) as compared to Axis LTE (8067).
So, does it suggest that in a downturn, you would lose less money in a fund with a higher SD? Should we consciously look for funds with greater SD?
Best Regards,
Hi K, I’ve currently being using Sharpe ranking for my momentum portfolio, how about using sharpe/beta (sharpe divided by beta) instead of just sharpe? TIA!!
In short it’ll be something like ROC/(std dev x beta). Looking forward to you input..
Yash, by dividing Sharpe by beta, you’re tilting your momentum picks away from high-beta names (i.e., those riding broader market rallies) and toward stocks that are generating alpha more independently. Maybe you can backtest this and see how it has worked in the past?
I haven’t done any backtest on either sharpe or sharpe/beta. But do you think there’s any merit in it? These 3 things because roc is its own return, SD is it own risk measure, beta is its risk measure wrt the index…in a broader sense..hence wanted your opinion on it
Intuition says this can be a good metric to separate market returns and focus on alpha. Your stock universe may shrink, though. Please give it a try before dismissing it 🙂
Thanks, K!
Happy learning!
Yes, not Morningstar but value research gave this data.Thank you so much sir. I am still wondering how AMCs give half baked details.
Happy learning, Prashant!
All the AMCs only mention only standard deviation without the average return, so the standard deviation can tell me the meximum upside and downside range. is there any way to calculate or find avg return on AMC document? The standalone standard deviation number is of no use, any thought? (Apart from comparing it with other fund)
You can check 3rd party sites like Morningstar, they do provide this detail.
Yes, it is indicating a risk. But would it be ok to say that Beta can also be used to measure return expectation? e.g. A low-beta fund is less volatile than the market, offering smaller gains in bull markets but limiting losses in bear markets. Similarly, high-beta mutual funds can outperform in bull markets but can underperform in bear markets?
Yes, it is an indicator, but you cant use that as an accurate measure, right?
I am confused why you said Beta is the measure of relative risk, it is not intuitive. I feel beta is an investment\’s sensitivity to market movements. This seems more intuitive to me as it actually tells the sensitivity of the fund vis a vis its benchmark index rather than saying it is the measure of relative risk. When we say, beta is 0.8 then it tells me if index moves up by 1% then the fund moves by 0.8%. This can be termed as sensitivity or volatility. If beta is 1.8 then it tells me if index moves up by 1% then the fund moves up by 1.8%, this is not risk to me, it is a good thing. Risk is only when the beta is negative, e.g. beta is -0.6 then if index moves by 1% but the fund is moving down by 0.6%, this can be termed as risk. Please comment.
`If beta is 1.8 then it tells me if index moves up by 1% then the fund moves up by 1.8%, this is not risk to me` , this also means when the index goes down by 1%, the fund goes down by 1.8%, which is much higher than the benchmark. This is an indicator or relative risk right?
simple explanation to understand the basics of MF investments.
Glad you liked it. Happy reading!
Thank you sir for your prompt response.
Sure, good luck Roque.
For the calculation of alpha, Which return is taken in the formula (absolute return, XIRR or trailing, CAGR) as value for funds return as well as benchmark return?
Usually the fund houses consider the CAGR returns for not just Alpha, but all other MF calculations.
Hi sir.
Do mutual funds pay capital gain tax on shares they buy and sell?
No, MFs are a pass through structure, taxation is at the unitholder\’s end.
Many of the metrics that you discussed in this module is not there on coin, why??
Can you point out which onese?
Hey,
I am new to this
If we could measure the Risk and Return for an investment, why isn\’t there a theoretically best investment?
If Risk taking ability is the concern, does that mean Sharpe Ratio is the Ultimate decider of an investment?
Risk and Return are backward looking 🙂
It is more trickier, factors published by most of the companies are for past 3y while morning star have data since last 10y segregated for our easy understanding as 3y/5y/10y. I believe considering just the past 3y data will not give us true pictures, as we are witnessing a big rally post covid. Now the real question is which should we check, companies factor or morning star factor. I hope i make some sense.
Arjun, I\’d suggest you take morning star data. It is presented in a investor friendly manner plus its comprehensive considering they do publish industry averages as well.
I wanted to invest in mutual funds I am bit confused in picking the best MF, can I you support me, my contact number is 9443690303.
I\’d suggest you speak to a registered financial advisor for this 🙂
Hi Karthik,
I have started investing in MF after going through the modules you have written. It made me confident to enter the market or more to say made me look at sharemarket as any other market of business rather than as a gambling spot.
I was recently comparing the Nippon mid cap fund fact sheet from their website and the one published in morning star. The date till the values considered, Holding % are same in both. However beta, SD, sharpe ratio differs among each other. How do we select or which should we trust among these two?
Thanks for letting me know 🙂
Thats a tricky one, I\’d say go with what the company claims.
Thank you Karthick .. This is very helpful.
Glad you liked it useful, happy learning!
Hi Karthik,
let\’s say we have invested some money 2 years back in a fund which is not doing good as of today. Its alpha is bad compared to the market averages and is performing below the benchmark for the last 5 years. After learning about the key metrics there are obviously better looking funds. So should we keep the money invested in the same fund for a long time or should we switch to a different fund immediately.
TIA!
If you are not comfortable holding the fund, you can switch. But do make sure you\’ve evaluated the fund properly over multiple years and not just 1 or 2 years.
You havent spoken about Z-distribution to build confidence intervals to understand lets say at 95% confidence level what is the lower and upper value. Is there a reason behind it?
The standard error does the same thing to some extent right?
sir, it seems to me that alpha and Sharpe ratio are both risk adjusted , is it ?
Yes, they both are.
Hi In your explanation of standard deviation for mutual funds I think the calculation is not right because you\’re not subtracting the standard deviation value from the mean instead you\’re subtracting it from standard value of 10000, kindly correct the typo
You dont subtract SD from mean, right?
Yes, I learnt about Morningstar after watching your videos. Thank you, will explore Morningstar further.
Sure, good luck!
Hi Karthik and Zerodha team, thank you for this tutorial.
Can I request you to share the different websites and tools you use to find these different MF metrices and do your research? I found most of them on valureserachonline.com but was curious to know what resources you use.
Thank you again.
Try Monringstar?
Thank you for detailing each topic with examples.
Happy learning 🙂
Hi Karthik,
Thanks for the clarification and prompt response.
I am little confused, then, the difference between Positive Beta and Alpha. While both conveys the returns, in what way Alpha would help us. Could you please clarify.
Shankar, do check this video, have explained alpha in detail – https://www.youtube.com/watch?v=thOejbtcBjo&list=PLX2SHiKfualGsjgd7fKFC-JXRF6vO73hk&index=10
Dear Mr. Karthik,
First of all, let me thank you for making Finance learning simple. I have attended quite several paid/free workshops to try and understand various aspects of investing especially Options, and it is with your explanation I have got a crystal clear understanding of what options are.
Your way of explanation is just awesome!
Now, my query here is, you mentioned Beta gives us info on the relative risk of the mutual fund vis a vis its benchmark. Now, my question here is: does it provide info about the relative return as well? What I mean here is if the benchmark moves up by 1%, does it mean that our fund, Tata Multicap Fund, here, is going to yield us only 0.95% of the return?
Thanks Shankar. I\’m really glad you liked the content on Varsity.
Yes, beta indicates that, but its on \’average basis\’.
Hi ,when we are talking about returns while calculations of Sharpe ratio are we talking about absolute returns or cagr or xirr or rolling returns?
Guide for the same.
Thanks in advance.
You can consider either, based on the time under consideration. If it is under one year, then absolute. For more than 1 year, use CAGR.
Thanks for all these lessons. You have made financial learning quite easy to understand.
The sequence of these chapters and your teaching methodology is impressive. All the topics have been covered easily in most simplistic manner and it your writing style also generates adequate interest to the reader.
Thank you so much for all your contribution.
Gaurav, thanks for the kind words. I\’m happy you liked the content. Happy learning 🙂
so how are they different in mutual fund context.
Different in a sense, there is an additional concept of benchmark returns in MF. Concept wise, they both are similar.
nah nah !! is there any difference between CAPM and Alpha as they both sound very similar by definition
They both are similar, except in MF context, we are introducing benchmark return also in perspective.
that sounds very similar to alpha, how\’s it different from alpha
Alpha is the same right?
thanks for the help but can you provide me with a basic definition for CAPM in terms of mutual funds, like what does it simply tells in terms of using it in a mutual fund
CAPM is mainly used to determine the risk premium expected by equity holders. It\’s a proxy for identifying \’expected returns\’, or the minimum return the equity investor expects.
can you please explain me the CAPM (capital asset pricing model), looking into the articles on google I am not able to comprehend what does it actually means
Check this – https://zerodha.com/varsity/chapter/valuation-part-3-risk-premium-tax-shield/ section 16.1.
and what is proprietary model
A model is is build by you/your company and don\’t wish to divulge details on how the model works.
so what would you suggest if I have to analyse a fund and have to consider the risk free rate
Take the Indian risk free rate, maybe your FD rate.
and since then they aren\’t responding to any of my mails
Predictable 🙂
yeah! your are right, I got in touch with them to know about it and they say that \”they take the FBIL Overnight MIBOR rate (as prescribed by the AMFI)\” for the risk free rate which was 4.27% (as on 31st may 2022) but if we put up this risk free rate it doesn\’t match with the data on the site it only matches when we put the rate as 2.85% as I stated above in our conversation and when I got in touch with them for this discrepancy they say that \”They can not share the details.\”
…..????🧐
Ah ok. These guys have proprietary models and it can be tricky to share details.
yes I am sure about it. And to verify it I did the math on excel, the data for different metrics like sharpe ratio, etc. only matches with the Morningstar data if we take the risk free rate as 2.85%
Ok. But it somehow feels not true. Cant seem to figure one reason why then would do that. Did they state it or you assumed it yourself?
and a more astonishing thing to know is that they are taking the 90 day T-Bill rate of US (which is around 2-3%) for analysis of a Indian mutual fund
That is quite a thing. Are you sure about it?
I asked from Morningstar and this is what I got in reply –
\”90-day T bill is the standard benchmark for comparison. Custom benchmark for risk calculation is not available on Retail platform.\”
what should be interpreted from this
Well, if they say that then there is nothing much we can do, right?
while looking for a mutual fund on Morningstar website I got to know that they are taking a 90 day T-Bill as risk free rate for analysing different metrics like Sharpe ratio, Sortino ratio, etc. while comparing funds for a period of 3 year, 5 year and 10 year isn\’t that misleading as because if we take government bond with a maturity of 10 years then that would be offering a better return than a 90 day T-Bill
I\’d agree. Maybe you should as them to understand their logic.
Sir all the effort you guys put into and the final work you guys publish they all never fail to mesmerize me.
i wish you happiness from the depth of heart , hope this work helps generations to come specially teens like myself 🙂
Thanks for the kind words, Chetan! I\’m glad you liked the content on Varsity and I hope you continue to like it 🙂
ok I get it now but what it is with sqrt(12) and sqrt(36) can you explain that part again
I\’ve done a detailed series on this, Shivansh. Start from chapter 15 – https://zerodha.com/varsity/module/option-theory/
but if I am using the STDEV() function then where does the rate come
and I am not able to comprehend what are you saying above, can you please explain it again.
Shivansh, when you use the standard deviation function, on excel you will type the function \’= STDEV()\’. But in the background, excel runs the formula.
what is \”r\” here
Rate.
I didn\’t quite get that can you please elaborate a bit
To calculate the SD in months, you have to divide the number of months by 12. So if you are looking at 3 years data, and you want to find out the monthly SD, then r=12/36.
but if we look at the formula for standard deviation then in it tells sqrt(n) where \’n\’ stands for the no. of observations and for a \’3\’ year period on a monthly return basis \’n\’ which is the no. of observations will be 36 as for three years it will count to 36 months then why are we taking 12
If you want 3 years, n will be 3. If you want in months, n = 36/12.
yes I did it and the answer\’s still not matching.
I did sqrt(36) as I was calculating monthly return for a period of 3 years but if I do a sqrt(12) for a period of 3 years on a monthly based returns then the answer matches.
what do you I am doing wrong here
It has to be 12, because a year has 12 months. You are trying to scale to yearly time frame and then from that figure monthly etc.
I have mailed the henpdesk of the mutual fund as you asked BUT …..
but I found something strange while rechecking the calculation for the standard deviation (calculating on a monthly basis for a period of three years)
therefore the formula should be in excel \”STDEV()*sqrt(36)\” using this, the answer is way off from the factsheet BUT BUT if I use
\”STDEV()*sqrt(12)\” the answer gets matched accurately with the factsheet.
what\’s this play of numbers here
Ah yes, volatility or standard deviation is proportional to the square root of time. You need to use this when converting daily to monthly etc. I assumed you had done this and still not matching.
I did as you said but no results its still the same and also tried using the tradition method of calculating it from dispersion method and then variance and then standard deviation and the result was that the SD came out to be 5.13%
So, now I have got three values :-
Factsheet – 17%
Using the STDEV() – 30.34%
using the formula – 5.13%
what do you think is the reason
Its weird. Ideally, all these calculations should match. Why don\’t you try and call the investor desk and check how they calculated this?
1) period selection – the last factsheet available was of 30th april 2022 and in it they calculated for last 3 years that would be from 1st may 2019 to 30th april 2022 (am i right or wrong in considering the period)
2) exact return calculation method – what do you mean by this
3) application of formula – for standard deviation i used the function \”STDEVP\” in excel and then multiplied it by 36 as i was calculating it for a 3 year period on a monthly basis (is this formula right)
1) Yes
2) Log or simple returns
3) Try =\’STDEV()\’ instead
I calculated a mutual fund standard deviation on a monthly basis for 3 years and its coming 30.77% but in the factsheet its given 17% and I did each and everything right and even checked twice while calculating the standard deviation. what\’s do you think is the reason behind this
Ah, there could be so many reasons –
1) Wrong data period selection
2) Exact return calculation method
3) Application of formula
so you calculate different metrics and ratios of mutual funds on a monthly return basis or on a daily return basis
I just look at 3rd party sites for values, don\’t really calculate anything. But if I had to, I\’d use EOD data.
the Vlookup function is not helping, how do you calculate the monthly returns if a mutual fund
I dont consider monthly. I consider EOD.
is there a trick or a shortcut or some kind of a formula in excel to extract monthly NAV in excel from the daily NAV data
I\’m just thinking aloud here. Maybe you can do a vlookup for dates and the corresponding values?
so where can i find out the \”monthly\” NAV of mutual funds as on the AMFI website the option is available for only daily NAV\’s.
or is there a way to download the daily NAV from AMFI website and then filter them out in excel in monthly order
If its not readily available, you need to work it out yourself from daily data.
hey! while recently analysing different ratios and metrics for a mutual fund I found out that the website on which the data is available for different ratios and they calculate every ratio for different years by considering monthly returns.
why don\’t they calculate ratios for different years on a daily return basis, I think that would give more precise data.
am I wright or wrong and If wright why the sites and even AMC\’s don\’t do it.
Monthly returns tend to smoothen out the time series so a high degree of volatility kind of gets masked. Nothing wrong with it if you have a long-term perspective on the mutual fund.
the point I was trying to make is that, I calculated alpha on paper and it was coming as 0.06% with the above data but on multiple websites the alpha was negative.
therefore I wanted to know how websites calculated it in negative, as I input the above data in excel also and I was getting 0.00% as the output.
Then, how to get alpha in negative with the above data
Hmm, not sure how these websites calculate Shivansh. Maybe you should write to them.
I was calculating alpha for a fund for 1 year the MF ret. is 15.79% and its benchmark ret. is 17.81% and I have taken risk free rate of return as 4.81% and beta is 0.84.
Now, if we calculate the alpha its coming as 0.06% but it can be clearly seen that Mutula fund has underperformed the benchmark then how to convert this 0.06% into a negative alpha
Shivansh, Alpha formula is – Alpha = (MF Return – riskfree return) – (Benchmark return – riskfree return)*Beta , so its not just the direct returns that is considered.
do websites change their data on a daily basis or on a monthly basis
As and when new MF data is available, the sites update. Once a month that it is.
I wanted to calculate standard deviation of a mutual fund I used the method explained by you and I am getting the answer as 0.98% but as I checked on website it should be 9.8% and i also used the STDEV function in excel by inputting the daily returns and still the answer is 0.98% is there something I am doing wrong
Yes, clearly something is off. Maybe you got the data period wrong or the data returns conversion wrong.
is there any other website or data source where I can find the 1 year value for sharpe ratio
Shivansh, you have to look at either Value Research or Moneycontrol. Google for it.
yeah I looked at both of them too the data available is for a minimum of 3 years,
I calculated Sharpe ratio of a mutual fund on excel for 1 year and I need to crosscheck the figures where can I do it as I am unable to find one year values for it on every website every value is for minimum 3 years, so where can I get the 1 year value
Can you try looking at Morning Star or value research?
Man this is fantastic to learn all the parameters will examples…kudos Karthik for sharing.
Happy learning!
These parameters and ratios sound much finance intensive by their name. But you have explained them so well that I understood all in just a single read. Great work man!
Glad you liked the content, Siddhant. Happy learning 🙂
Thanks, this article is very clearly explained on the topic – SD,Alpha and Beta and its applicability in EQUITY market.
suggested to include, Two more illustrations may be given on Debt and Equity market to compare and get hold on the subject please.
Regards
T R Radhakrishnan
Notes, will try and do that.
What is easier than this explanation ? infact i find it as simple as my mom. hats off….ture knowledge with no money nvestment.
thanks….a lot
Happy learning, Santosh 🙂
but sir …i am talking about the EXAMPLE ….that used there ….perhaps ,,,by that calculation (22.3) example – …HIGH SD FUND Are good (bcz losses are less gains are more)
but BY explanation LOW SD FUND ARE good ……
.(its confusing)
sir ..if you said …higher voltality higher the risk
but in calculation ..loss of lower SD fund(19.33%) is higher as compare FUND WHICH has higher SD(23.95%)… and investment amount also same…………………as shown in table
and also gains are low …..
SD is an average, just to give you a perspective of how volatile the fund is. The actual Profit or loss depends on when you bought or sold the fund.
If beta is 0.75%
And when benchmark moves 1 % down
Fund will only move 0.75% down
What if benchmark move 1% up
Fund will move 0.75% up or 1% up?
Yes, thats the expectation.
Hi Karthick
SD of 24% in Axis Small Cap means. Loss on investment can be 2400 which brings your investment to 7600 or profit of 2400 which brings the investment to 12400 right??
Yes, I\’ve stated the same right?
In the table for SD, is 8067 the total loss incurred, or is it the value of investment after loss. Which means, the actual loss is 1933.
Not sure from where you are referring to 8067.
Wow.. Brilliantly explained.. A layman like me can also become an investment champ!
I can surely do some better investment & financial planning now. Thanks so much for this article.
Happy learning, Ashish 🙂
Thanks so much for you great work.
I have a doubt regarding the implication of Standard Deviation. In the above example of Axis long term equity fund, SD is 19.33%. Hence you have stated that profit of loss of this fund at the end of one year can be anywhere between the range of +19.33% and -19.33%.
But doesn\’t SD measure dispersion from mean? For example lets suppose this fund has average annualized return of 15%. Then, the expected range of returns on the basis of SD should be +34.33% to -4.33%.
Please clear my doubts as to which is the better interpretation of SD.
Thanks.
Gopal, thats correct. When you look at long intervals of time, the mean is large and can\’t be ignored. For small intervals, the mean is so small that we can ignore it in the calculation.
What does a beta mean when we talk about an increase in price. For example you mentioned \”If the beta was 0.6 or 0.65, the fund is less risk or less volatile compared to its benchmark. Why? Because if S&P Sensex 500 falls by 1%, then Tata Multicap fund is expected to fall by only 0.65% and not 0.95%.\”
Can we also say if S&P index increases by 1% then the Tata Multicap fund will only increase by 0.65%?
Can you please elaborate the following point:-
Do note, Sharpe ratio considers only price based risk. It does not consider credit or interest rate risk. Hence, there is no point looking at the Sharpe ratio for debt funds.
Sharpe is based on price or the NAV as input. But in reality, a mutual fund has other risks such as the credit risk or interest rate risk, which the shape ratio does not really capture.
Is there any website where can I compare MF on these ratios/parameters?
Hmm, I think it should be possible in both Value research and morning star.
In any given type of mutual fund, there are so many choices offered by various fund houses. It is very difficult to narrow down from the general parameters, given that certain types perform similarly. These are the risk stat parameters ( like Alpha. Beta, Sharpe etc.) which really help to filter finely to arrive at the optimal fund. Thank you for these insights which are explained in a very crystal clear manner.
Thats right Vinod. Hopefully this module will help you narrow down your search. Happy learning 🙂
Sir, It would be helpful if you could shed some light on how to interpret the portfolio turnover ratio.
Kind regards,
Kartik Aggarwal
It just suggests the rate at which stocks are being bought and sold in the portfolio. Lower the better as it indicates less churn in the portfolio.
man you are just awesome , your whole book is much much better than my complicated CFA course book .
Love this post! Really very insightful.
Thanks for sharing 🙂
Happy reading, Priyam.
Kartik sir , you and Kamath brothers have democratized the financial realm of India. Because of Zerodha a common man can at least enter into trading. In my childhood days it was thought of that only rich people are privileged to do trading. Lots of respect to you financial heroes.
One request, pls give some guidance in NPS tier- II investment as it is performing well.
Thanks for the kind words, Jyoti. About NPS, maybe I\’ll include that in the Personal FInance Part 2.
Hi Karthik,
Can you share a good site or link where i can see the rolling returns of any mutual fund ? I tried looking through moneycontrol and morning star but was not able to find it.
Swati, I think Rupeevest had a good site for this.
Hi Karthik,
Thanks for making these concepts simple to understand.
Can you please explain a bit more on Sharpe –
\”Sharpe ratio measures the unit of return earned for every unit of risk undertaken\”
What does \’Every unit of risk undertaken\’? is this the investment amount?
So based on this definition – Small Cap funds will always be the best option to invest right? since the sharpe value will be higher compared to Large Cap?
Thanks.
Think of it as \’For every Rupee\’ of risk instead.
About small caps – they are volatile, and therefore higher Sharpe as well. As a long term investor, you need to ensure you are ok with taking on such huge risk in terms of volatility.
The 5 yr beta of the Index is 0.81 as per Morningstar. I presume they are referring to the Midcap 100 TRI index. Hence the dilemma whether the benchmark should be taken as 1 or 0.81.
Dhairya.
It should be taken as 1.
Hi Karthik,
A question about Beta.
The 5 yr Beta of the Axis Midcap Fund is 0.74, while the Beta of the Index is 0.81.
Is the fund 26% less risky than the benchmark(since in the example you have taken the benchmark as 1) or will it be 9% less riskier than the benchmark of 0.81 in this example?
Thanks.
Hmm, the beta is a measure of the fund\’s riskiness wrt to the benchmark (or index). So if the beta is 0.74, then it\’s 26% less risky compared to the fund\’s benchmark. I\’m not sure what 0.81 is here 🙂
Explained clearly…
Thanks for info
Good luck!
Excellent explaination Karthik!
Question on the Beta: In all your examples, you have mentioned the relative risk whenever the benchmark index falls. Will the comparison be also true in case of rise of benchmark? Ex: if Beta of fund is 0.95 then can we say that if benchmark (S&P 500 TRE) increases by 1% then the fund increases by 0.95%?
Thats right Pawan, beta, like SD is two-sided, but we often tend to look at it from the risk perspective.
sir if the sharpe ratio is 0.56 does that mean for every 1 rupee of risk we generate 1.56 rupee or 0.56 rupee?
Its 0.56 for every unit of risk.
Hi Karthik,
Thanks. I think then I feel you can update it to
min_predicted_value_of_investment = Investment * (1-SD)
Because calling it as loss is confusing. Since loss(estimated max loss) is Investment * SD and not Investment * (1-SD) as mentioned.
Sure, that makes sense.
Karthik,
Thanks for this useful post. I have a doubt. I think you meant
max Loss = Investment * SD
max Gain = Investment * SD
After 1 year the value of the investment is predicted to be anywhere between Investment * (1-SD) and Investment * (1+SD)
Do correct me if I am wrong.
Thanks
That\’s right Simha. But remember this is a statistical estimate.
Hello sir, thank you so much for providing the best content on the stock market.
when is the personal finance module is expected to come in pdf format?
As soon as the module is complete, still few chapters left 🙂
Hey Karthik you are doing amazing job.
I\’m reading last one year about stock market investing, that made me to like equity analysis profession.
But sadly I\’m a 4th year mechanical engineering student .
At this stage, To pursue a profession in equity analysis what can I do
Manoj to pursue Equity Research, you will have to look at professional certifications like the CFA. CFA is globally accepted and will open up doors for you.
Hi Karthik,
Eagerly waiting for your lesson on –
1. Comprehensive list of financial products available for Indian investors (with their pros & cons)
2. How to allocate capital between these products?
Noted, will try to cover this.
This is the most lucid way of explaining the factsheet ratios. I have read many books, blogs, seen videos, professional course books couldn\’t help to say that even I did learned something which I had never understood even after by hearting their theory since 5 years ago. Thank you very much for this content.
Happy reading, Sumit. Glad you liked the content 🙂
Hello Karthik,
Your content is always on point. I am eagerly waiting for the topic on building mutual fund portfolio. I understand that the kind of quality content you make takes time. Yet, can you please try to cover it up sooner? Thanks in advance
I will try, Janani.
Hi Karthik,
This module on MF is one of my favorite after the fundamental Analysis module. There\’s nothing as interesting as considering a virtual investment scenario while reading. Great work once again.
Although I hope there was information on each chapter as to on what date you uploaded them. That way we could track how much we have waited 🙂
Glad you liked it, Ajay 🙂
Upload date will put me a lot of trouble 🙂
Rightfully, you have now earned a Title Mr Karthik R – it’s Professor Zerodha.
https://www.moneycontrol.com/news/business/companies/startup-sages-meet-professor-zerodha-5928961.html
Hahah 🙂
Thank you Karthik !
I am also trying to generate a side income apart from my daily job, wanted to know which MF\’s should I target for that ?
As the market these days are too volatile and due to the Franklin Templeton MF\’s, I am re-thinking my option of investing in an Equity MF.
MFs are not trading instruments. Unfortunately, it won\’t full fill this requirement.
Hi Karthik,
CGLs are related to insurance products if I’m not wrong. I’m not a fan of dividend-paying MFs, especially if they are equity funds. In dividend-paying funds, they simply sell the units and give you dividends, which is pointless.
Thank you for the response ! Really awesome chapters on MF , makes it really easy to grasp the concepts!
I was going to invest in \”SBI Multi Asset Allocation Fund – Direct Plan – Dividend-Monthly\” .. wanted to know your opinion on the same
Thanks, Prashanth. As I mentioned, I\’m not really a fan of dividend-paying MFs, so I\’d avoid that 🙂
Alpha, Beta and Sharpe Values given by Value Research are based on fund performance in the last 3 years. Isn’t that too short a period to make any meaningful inferences about mutual fund performance?
3 years is a good starting point Sharan.
Thank you Karthik for the content of this entire module. The examples you provide make it so relatable and easy to recollect when doing the research for MF.
\”And I promise I’ll put up the next chapter quickly\”
This chapter will cover all the topics of Sortino’s ratio, Capture ratios, discussion on Mutual Fund risk parameters, focus on building Mutual Fund portfolios ?
If yes, eagerly looking forward to it and hope you can get it out quickly 😛
Working on it 🙂
Great article as always.
Karthik I have 2 questions.
1. Did SD remains the same for the fund over time?
2. And if it\’s the same then like you mentioned above that Fund B gives 16%, also there is a possibility that next yr due to high SD fund B would generate -ve or less return as compared to Fund A (14%)?
Appreciate your response on this.
1) No, they change as and when there is a change in stocks and the weights assigned to these stocks
2) Thats right. Higher the volatility, higher is the chance of the variation in returns, both +ve and -ve.
Hi ,
What are CGL\’s in mutual funds (any links that explain more on them is welcome) and how may I deem to invest in MF containing them ?
Also, which are the best Dividend paying MF? Are they dividend yielding mutual funds a good investment ?
CGLs are related to insurance products if I\’m not wrong. I\’m not a fan of dividend-paying MFs, especially if they are equity funds. In dividend-paying funds, they simply sell the units and give you dividends, which is pointless.
dear sir..it is an wonderful study tool which explains the concept very clearly, along with this is it also possible to explain us on how to do a research on the mutual funds…? Because after reading these explanations if we know on how to do research on MF it will he much more useful…
We will start doing that over the next few chapters 🙂
For investment purpose what is better NIFTYBEES or UTI NIFTY INDEX MF ?
I\’d suggest the index fund, because unfortunately, ETFs are not very liquid.
Sir
Please define my answer on NEUTRAL STRATGEY OF CURRENCY OPTIONS
(Long box or conversion).Tell with one example showing
Please,if previously I Tell something wrong please forgive me.
Please understand my feeling sir
I am not new but I am very new it is very important task sir
Please reply sir
Vishal, neutral strategies are things like long/short straddle and strangles. Iron condor also works. Also, please post your queries in relevant chapters. This chapter is about Mutual funds and their risk measure.
Hi Karthik,
Really appreciate your effort in sharing all the knowledge. It helps to understand things in our country\’s perspective.
I\’m starting out on my investment journey and I read in one of the previous chapters that you personally wished for diversified investments, that is, in equities, FDs, bonds, MFs etc.
However, I\’ve seen some other advisors say that they don\’t like MFs as you can manage your own portfolio in equity investments and they don\’t need to pay.
Would love to know if you would still recommend a diversified investments strategy?
Thanks again for the great content!
Of course, I\’d still do that 🙂
I want to invest in Motilal Oswal Nasdaq 100FOF. What is your advice? Investment amount is fifty thousand (50,000).
Depends on your investment agenda right? However, I\’ve heard its a good fund, I\’m yet to do my research on the same.
Sir, you r excellent and you made investing in simple words. God bless u sir.
Happy reading, Mandira!
If beta is a number less than zero (negative number), how do we interpret that wrt benchmark?
It means that if the benchmark gives a positive return, the fund will give a -ve return. It is very unlikely to find an MF which fits into this category.
When you start doing things in a much simpler way, after (not before 😉) learning the complex things- you know you are Genius- that defines you Mr Karthik R
Hahah, thanks for the kind words. That will inspire me to write better 🙂
Excellent explanation. You made it so easy to understand. Thanks.
Happy learning 🙂