
30.1 – Why macroeconomics?
The module on Personal Finance has come a long way with over 30 chapters. I can easily think of another 10 or 15 chapters to add, but I won’t do that 🙂
I think we have covered the major chunk of personal finance, i.e. investments (via mutual funds), and in the process, discussed a ton of other information. I hope you’ve found this module useful.
I want to end this module with a chapter on Macro Economics.
Macroeconomics in a personal finance module? Well, I’m sure you may wonder why I’d want to discuss macroeconomics in a personal finance module. After all, personal finance is related to an individual or a family’s finances. On the other hand, macroeconomics is a much wider topic related to a country’s economic well-fare.
What is the connection here?
You like it or not; your financial fortune is highly dependent on how the country as a whole does; this is especially true when you save for long and hyper long-term investment goals like retirement.
Imagine this; you set retirement as your financial goal. As a part of this, you do your bit diligently, i.e. select your mutual funds carefully, save regularly, increment your savings by the year, and stick to the course and not succumb to the temptation of pulling out the funds during the tenure.
However, the country you reside in happens to default on its borrowings and suffers from never-ending geopolitical and civil unrest.
Given the situation, do you think your savings will do well?
Or think about a situation that your country at the cusp of a big bang economic reform, with an extremely supportive demographic profile and a super-competent Government. But you fail to see through these shining opportunities and instead decide to play safe and invest your hard-earned money in gold.
Do you think you’d have taken the right investment decision here?
Hence, for this reason, I think it is very important for an individual to understand the basic macroeconomic profile of the country and map it to the past macroeconomic profile and extrapolate a bit to the future and see how the situation pans out.
In this chapter, I’ll stick to basics and help you understand the absolute essential macroeconomic principles. If the topic interests you’d, I’d suggest you pick up any good undergraduate book on macroeconomics and read through it. I’m sure you won’t regret it 🙂
30.2 – Gross Domestic Produce (GDP)
I understand this is an absolute basic metric to start our discussion, but we will start with it for the same reason. Many of you may be familiar with it; if yes, please feel free to skip this section. For those who are not familiar with ‘GDP’, let me tell you a quick story.
After my sister’s marriage in 2002, she moved to Coimbatore, Tamil Nadu. I was in my early 20’s, and I’d often make weekend trips to Coimbatore to visit her and spend a few days with her. My sister had a very interesting neighbour in Coimbatore, and she would often tell me stories about them. On one of my visits, I got to meet the neighbours as well.
The neighbour’s house had three family members – husband and wife, both in their mid 50’s and a teenage daughter. Husband managed a steel kitchenware shop, which sold household items like rice cooker, pots, and pans. His wife managed a small homemade papad and pickle business, and the teenage daughter taught classical dance to the neighbourhood kids.
All three members of the house had an economic output. Given my unnecessary curiosity, I remember trying to figure out how much money this family made. I don’t remember the exact math, but I remember these numbers; I estimated that –
-
- The husband sold goods worth 2 to 2.5L lakhs per month.
- The wife sold goods worth 25K every month.
- The daughter charged 500 per month per kid and had ten students, which was 5K per month.
Give or take, this small and admirable family’s monthly income was anywhere between 2.3 to 2.8L per month or about 34L per year on a gross basis. This family had no other source of income. In other words, 34L was the total economic output of this family after accounting for all the products and services collectively sold by this family.

In a sense, I think it is ok to conclude that the family’s Gross Domestic Produce’ (GDP) was 34L per year. If you realized, GDP here represents the total value of the economic output of the family, which includes goods sold (kitchenware), products manufactured and sold (papad and pickle), and services offered (dance classes).
Now step aside and think about the country as a whole. The country has many factories, companies, services units of various kinds; all of these collectively has an economic output. The combined economic value of all these entities (operating within the geographic boundaries of the country) represents the GDP of the country. If the companies do well and thrive, then naturally, the GDP of the country increases.
Or in other words, a growing GDP is a healthy economic sign. We all want the GDP of the country to increase.
Have a look at the Indian GDP ranking –
![]()
I’ve got this from Wikipedia, where they have tabulated the 2020 GDP rank of countries as per various estimates (IMF, World Bank, and UN).
India ranks around 6th or 5th, and the GDP itself is pegged to 2.6 to 2.9 Trillion USD. Do recollect, the collective economic output of India is estimated between 2.6 – 2.9 Trillion USD. We are just below China, Japan, UK, and Germany.
While it is great to know we are in the top 5 GDPs of the world, it is also important to understand how our GDP grows. After all, we want to be better than being in the top 5, and we want to get there as quickly as possible.
To measure the speed at which a country’s GDP is growing, we need a growth rate. The number is usually expressed in percentage terms. Hence, if the percentage is 5%, it implies that a country’s GDP grows at 5%.
The technique of estimating the GDP growth rate is beyond this discussion’s scope; we won’t get into that today but will use the widely accepted number.
Now, when it comes to measuring the GDP growth, there are two terms you should familiarize yourself with –
-
- The nominal GDP growth rate
- The real GDP growth rate
Both these growth rates measure the speed at which the GDP grows; if you guessed right, these rates are the CAGR of the GDP. Do recollect; we have discussed CAGR several times in this module.
To put this in context, take a look at this new paper headlines –

The reference point here is the ‘nominal growth’ rate.
The nominal growth rate is the absolute growth rate. While it is ok to use the nominal growth rate, it may not be an accurate representation of ground realities.
Let me explain.
Think of it as investing Rs.100 in stock. At a 10% growth rate and five years, Rs.100 grows to Rs.161/-. But is the value of Rs.161/- in 5 years the same as Rs.161/- today? Won’t it be right? And we know it won’t be the same because inflation eats into the purchasing power of money on year on year basis.
Hence to get the most accurate representation, we need to adjust the growth rate to inflation. When we adjust the nominal GDP growth rate to inflation in GDP, we get the real GDP growth rate.
Real GDP growth = Nominal GDP growth – Inflation.
Assuming the inflation at around 4.5% (ranges between 4.5% to 5%), real GDP of India –
10% – 4.5%
= 5.5%
Do take a look at this snapshot; it estimates the real GDP growth at 5% –
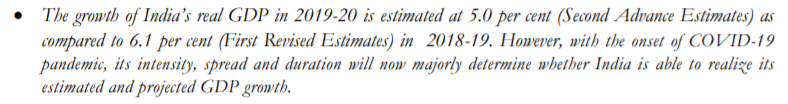
The snapshot is from the Department of Economic Affairs; you can read the entire paper here – https://dea.gov.in/sites/default/files/March%202020.pdf.
I also found this interesting chart from the same paper; I thought I’d share it here for your quick reference –
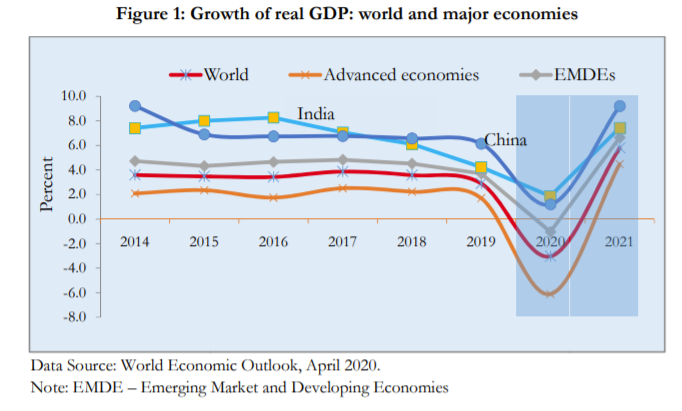
Thanks to COVID, most of the economies (from the GDP perspective) took a hit in 2020. But they are all expected to bounce back up in 2021 and perhaps 2022. Whether this will pan out as per estimates or not is an unknown. But the stock markets at least seem to factor this 🙂
Anyway, at this point, I want you to take a break and think about this –
-
- You understood what GDP is
- You understood the GDP growth rate, both nominal and real.
How is this relevant to personal finance?
30.3 – GDP and Market cap
We have discussed the concept of market cap earlier in Varsity. For those of you not familiar with market cap, here is a quick note –
Assume the stock price of a certain company is Rs.75/- per share. Further, assume that the company has only 1000 shares outstanding of this company.
The market cap of this company is –
Stock price x total outstanding shares
= 75 x 1000
= Rs.75,000/-
The total outstanding shares of this company are constant, but the stock price fluctuates daily. The higher the stock price, the higher is the market cap and vice versa.
Now assume another company has 2000 shares outstanding, and the stock price is 105 per share. The market cap of this company is –
= 105 x 2000
=2,10,000/-
Now assume (the last assumption, I promise) that the entire market comprises just these two companies. The entire market cap of this market is –
75000 + 210000
=2,85,000/-
Hopefully, with this arbitrary example, you got a sense of the concept of ‘market cap of the market’. The market cap of Indian companies (sum of the market cap of all the listed companies in the country) as of Jan 2021 is roughly $2.5 Trillion.

One of the direct established correlations is that as the country’s GDP improves, so will the market cap. If the market cap does well, then equity investments are bound to well. We have seen this happen in the past.
So when you look at the GDP data, think about how the country is placed in terms of GDP, and it is expected to do over the next 5 or 10 years.
For instance, here is a thought about the Indian GDP situation –
-
- India is a 2.6 Trillion USD GDP as of 2021
- The real GDP growth rate is 5.5%
- The countries above us in the GDP rank, i.e. Japan, Germany, and the UK, have large GDPs, but their real growth rates are lower.
Even if India did nothing spectacular or did nothing stupid to degrow, then under a decent real GDP growth rate (and slow down in developed countries), the GDP rank is bound to increase.
No think about a growing GDP plus the largest democracy globally, and top it up with a large working population; what do you expect?
Well, these are factors usually is a precursor to attracting more investment capital into the country. With these investments coming in, corporates are expected to do well, and in turn, the country’s market cap is expected to do well.
Will this happen overnight? No.
Will this happen over the next 1-2 years? Maybe not.
Will this happen over the next 8-10 years? Well, it seems likely.
Hence, the need to stay invested for a longer-term.
30.4 – India Inc
Think about a corporate entity. A corporate entity or a company usually has few sources of revenue and a set of expenses. The difference between the revenue and expense, if positive, results in a profit to the company. If the difference between the revenue and expense is negative, then that is a loss to the company.
Now think about India as a company. The company’s management is the Government, which is democratically elected. The company has a few revenue sources, mainly in terms of taxes, and the company also has expenses mainly in terms of capital and revenue expenses. If the income minus expense is positive, that’s a surplus to the country, else a deficit.
Take a look at the snapshot below; I’ve got this from the website of Controller General of Accounts; here is the link –
http://www.cga.nic.in/GlanceReport/Published/2018-2019.aspx

The data you see above is for the Financial Year 2018-19, represented in Rupee Crores. Let us break this down to understand the numbers better.
The first line here details India Inc’s Revenue; it is called the ‘Revenue Receipts’. These receipts act as the sources of revenue for the Government. There are two broad categories of revenue for the Government, i.e. Taxes and Non-tax revenue.
Taxes Revenue – Tax revenue includes all sorts of taxes that the Government collects. Broadly, taxes can be classified as ‘Direct Taxes’ and ‘Indirect Taxes’. The direct taxes include taxes paid by individuals, called the ‘Personal Income taxes’ and the corporates’ taxes, called the ‘Corporate Income tax’.
Indirect taxes mainly include the tax in the form of ‘GST’.
As you can see, India Inc collected close to 14.8L Crore as taxes in 2018-19; this includes both direct and indirect taxes.
Remember, when GST is charged, a portion goes to the state and a portion to the centre. Hence when you look at 14.8LCr, this is the ‘net to the centre’, which means that the actual tax collection is higher than 14.8L Cr. Of course, you can get the exact value by inspecting this report further, but I’ll refrain from doing so. But if I remember right, roughly 2/3rd is retained by the centre, 1/3 is distributed to states.
Non-tax revenue – Apart from the tax revenue, the Government has a ‘non-tax revenue’ as an income source. The non-tax revenue source mainly includes the dividends paid out by the PSU companies (companies like LIC, NTPCL, ONGC, NALCO etc.), where the Government of India is a majority stakeholder. Apart from dividend income, the Government also has revenue by selling stakes in these companies, often referred to as the disinvestment program. The non-tax revenue for 2018-19 was roughly 2.4L Cr.
Total revenue is the sum of these two revenue lines, which is roughly 18.2L Cr.
The Government has expenses, and these expenses can be categorized into two buckets, i.e. the ‘Revenue Expenditure’ and ‘Capital Expenditure.
Revenue Expenditure – These expenditures include subsidies across various Government schemes, salaries to Govt employees, interest payments etc. The revenue expenditure is a big bill that the Govt has to pay, and as we can see from the snapshot, this bill stood at 21.4L.
Capital Expenditure – The capital expenditure, on the other hand, is the Government’s expenditure on infrastructure; this includes things like roads, bridges, hospitals, electrical grids, transportation etc. The capital expenditure is 3.1L Crore.
Think about it, capital expenditure is 3.1L Cr, while the revenue expenditure is nearly seven times more at 21L Cr. If the Govt were to spend more on Capital expenditure, it leads to better infrastructure, spurs business growth, creates jobs, and leads to better tax collection.
As a long-term investor, you need to keep track of trends in these spend patterns and get a sense of how the country is evolving.
The sum of revenue and capital expenditure is the total expenditure of the Govt, which is roughly 24.57Cr.
So, on the one hand, Govt collected revenue of 18.2L Cr, and on the other hand, the expenses stood at 24.57Cr. The expenses are much higher than the income. The negative difference, i.e. to the extent of nearly 6.3L Cr, is called the ‘Fiscal Deficit’.
From the same report, I’ve pulled the GDP data –
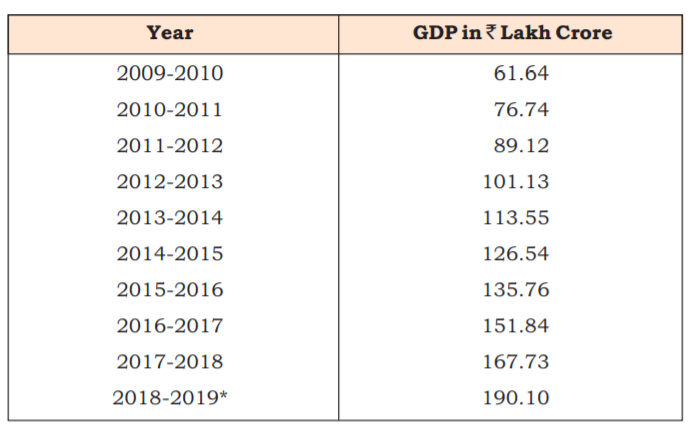
The country’s GDP as per 2018-19 data is 190.1L Crore. If you calculate the Fiscal Deficit as a percentage of GDP –
6.3L Cr / 190.1L Cr
= 3.3%
Any macroeconomic debate or discussion, this is the ratio that gets spoken about the most. The Government puts in massive efforts to contain the Fiscal Deficit to GDP ratio to sub 4%.
To put this in perspective, do check this extract from Wikipedia –

The US’s fiscal deficit as a percentage of GDP is nearly 4.7%, which is quite staggering.
While at it, we can crunch one more data point, i.e. net tax collected as a percentage of GDP –
= 17.3/190.1
= 9.1%
If we include the share of state’s, this ratio is roughly at 11-12%. Tax collection as a percentage of GDP is an important metric; remember, the higher the tax collection, the higher is the revenue, which means the probability of shrinking the fiscal deficit is higher.
So what will lead to higher tax collection? Things like newer job creation, business expansion, improvement in ease of doing business, greater compliance, etc., result in higher tax collection.
Again, to remind you, you need to track these numbers to understand how the country operates. Remember, when you invest in the long term, your fortunes depend on how your investments perform, depending on how India as a country performs.
Without a sense of these basic details, it is equivalent to investing in the dark.
I’ll end this discussion here; as you can imagine, the topic is vast, and we have only scratched the surface 🙂
With this, we are at the end of this module on Personal Finance module; I hope you’d enjoyed reading this, as much I enjoyed writing this for you.
Good luck and invest wisely 🙂
Key takeaways from this chapter
- The country’s GDP represents the country’s collective economic output; this includes all the goods and services produced within the country’s geographic boundary.
- The nominal GDP growth rate is the GDP’s absolute growth rate; it does not adjust for inflation.
- The real GDP growth rate adjusts for inflation.
- With 2.6 to 2.9 Trillion USD, India’s GDP stands at 5th/6thposition in the global GDP rank.
- As the GDP of the country expands, the market cap also tends to expand.
- India Inc’s revenue consists of tax and non-tax revenue.
- India, Inc’s expense consists of revenue and capital expenditure.
Need help in accessing the Varsity Certified Test. I have completed the payment but nothing happened after that. Have written a mail to [email protected].
Mihir, sharing your details with the team.
Thank you. Also wanted to thank you for these modules. They are really easy to understand. i believe your initiative is very important for improving financial education in India.
Another query I have is regarding where to start and how to apply the knowledge from your modules. I have read 4 modules (those under Varsity Test) and started little bit of investing – Mutual funds and few stocks. But still feel lost. How to build wealth and how to understand the markets better for limited swing trading? Should I study more (finish all modules, read books like \”The Intelligent Investor\”, etc.) or gain more experience?
Have many doubts and sorry for the long query. But if you could give me some direction I would be grateful.
Thanks for the kind words, Mihir.
There are multiple threads in the market that you can pursue. For instance, you can focus only on long term investing or you can focus only on swing trading, or you can just do F&O, or maybe a bit of all 🙂
It does get overwhelming, so the best way is to de clutter yourself and fix one specific area you want to build your strength in. It could be anything in the market. Once you do, pursue that till you develop the conviction to identify opportunities and efficiently execute. You can, from then, slowly expand your areas of strength and pick more things.
The key is to identify one thing at a time and go all in on it. This is exactly what I follow 🙂
Thank You so much. Follow up query – if one wants to get better at long term investing it will take a lot of time to see results (i assume). How to know that one is on the right track? Can one simultaneously do swing trading and long term investing or you would suggest one at a time? I am a civil servant (F&O prohibited) undergoing training so will have less time for learning after probation. Will really appreciate your wisdom on this.
Also if you could follow up with the team regarding the test. I studied for the test sincerely and was hoping to give it but now I am stuck. Sorry for pestering you with my problem.
Long term investing requires patience and commitment. Unfortunately, only time will tell you if you are right or wrong. That said, you can continuously evaluate your conviction basis which you made the investment in the first place and see if that conviction still holds. And yes, you can swing trade and hold positions at the same time.
Will follow up on the test bit.
Karthik could you please suggest me some books or material on Impact of major economies on our country economy. How are the co-related??
Like what is debt ceiling in US economy and how does it impact our economy
Ah, don\’t think there is a book on this, maybe we should create some content 🙂
SIR IT\’S SUPER AWESOME I GOT BETTER THAN MY ECONOMICS MISS TEACH\’S.PLEASE DO EXPANSION MODULE\’S ABOUT MACROECONOMICS
Thanks for letting me know, Abdulla. Happy learning 🙂
im not able to by what cen i do
Sorry, can you elaborate a bit more on this?
Is revenue receipt of the govt and gdp the same??
No, they are two different things.
GDP of india was 2.6 trillion dollars in 2020 and Indias market cap was 2.5T dollars. Does this mean that GDP growth rate or GDP depends on listed companies in india?? I mean if the corporates(only listed ones) do well only then theres chance of GDP growth?? Basically India\’s market cap and GDP both the same??
No, it encompasses all companies and manufacturing and services units.
1. Does total market cap also increases with increase in IPO listing i.e increase in total no of listed companies
2. Does GDP includes data of unorganised sector also
1) At a company specific level, no it does not impact. However, if you are looking at it at an aggregate level, then yes, new IPOs will expand the market cap.
2) No, there is no proper ways of measuring the output.
Zerodha big name . And perfect input to understand it in actual
Hi Karthik sir, Thanks again for brilliant chapter in equally brilliant module. How can we visualize relation between GDP and revenue of a country?
Can we think like this: India Inc. produces goods and services, their collective value each year is its Sales(Nominal GDP/Real if we factor for inflation) and then India Inc. makes profit(surplus)/loss(deficit) from that Sales(that is Revenue/Total receipts of India Inc.)? In a way country is like a company where its GDP is its sales and its profit/loss is revenue it collects from Tax and other sources.
Yes, macro economics becomes easy if you think about the country as a corporation but with a much higher degree of complexity 🙂
Karthik & Team,
Really appreciate your efforts in putting out such high-quality educational content for free! As someone who started earning recently with absolutely no clue about how to manage my money, these modules have been an eye-opener and have motivated me to keep learning about finance, investment & economics further.
Thanks & cheers!
Sir, module 12,13 and 14 ka hindi translation kab tak aayega??
this is the best knowledge I have ever got on internet specially in Hindi language, thank you Zerodha and Varsity Team For Spreading’s Such Type Of Knowledge and encourage people to don’t go blindly with stock market. there is lot of science and physics behind trading and Investment.
Happy learning and I hope you continue to enjoy reading on Varsity!
\”Basics of Macro Economics\” is the best among all the chapters. Thank you again Karthik sir. I don\’t think anyone else can explain these concepts to me in such simple language as you just did. I owe you.
Thanks and I\’m glad you liked the content, Sanjay! Happy learning 🙂
Sir, if you think you can add another 10 to 15 chapters to this module, please do so. I would like to understand the reassessment of the mutual fund portfolio after the money is invested. If we face losses, what should be our plan of action every quarter or every year? How should we reallocate assets etc? Thank you in advance.
That makes sense, Omkar. I\’ll try and do that, but maybe sometime next year.
Dear Karthik R.,
Got it. Thanks a million once again for compiling this treasure of knowledge. God bless you and your team.
Happy learning, Hemant!
Dear Karthik R.,
The Module 11 was an ocean of knowledge and came to an end in early 2021.
As many readers have asked, when and how can we download a PDF of the complete updated Module 11, and preserve it as Bible on MF investment?
Regards and thanks.
The PDF for module 11 is available, please scroll to the end of the chapter list to find the download PDF link.
Firstly I want to thank you and I really appreciate your efforts to simplyfy stock and financial knowledge.
I read this module and found it to be too amazing.
I\’m waiting for part-2 of this module(personal finance), when will it be released?
Thanks Harit. Part 2 will take sometime, but hopefully sometime this year 🙂
Well, the problem is \”who is a good advisor\” and risk is all mine? Besides I believe \”Learning\” is my best advisor. That\’s why I keep learning and learning and therefore I have reached to you and your dexterous creation \”Varsity\”. Ta.
I agree Mayur. Best learnings if from the markets itself. Good luck!
Hi Karthik,
In regards to Retirement Planning, Since this is long term planning for corpus accumulation can I go for NPS(National Pension System) in stand of investing in the Mutual Fund? As opting Mutual Fund I have to keep track on the Funds and do research about it which can digress me from Investment & trading.
Thanks.
YOu can Mayur. But why don\’t you speak to a good advisor and take help?
Sir i guess there would be a module on \”personal finance (part-2)\” in the near future
right sir 🙂
Thats the plan, Muthu 🙂
Sir I\’ve been reading from the absolute scratch with Zerodha varsity so what order would you suggest ?? (Continuation to those I mentioned earlier)
Chetan, all these modules are independent (although I\’d suggest you read Futures first and then move to options), but apart from that there is no sequence.
Thanks for your replies sir … Feels like real one on one teaching 😃
Sir is the impact cost really high on forex trading 🙂
Thanks, Chetan. No forex pair like USD INR is fairly liquid on NSE, you won\’t lose much to impact cost. But better to be safe by placing limit orders.
Sir an really important questions in what order should I read the modules ..
Like a few modules are way more fascinating then others ( like inner worth can\’t wait to learn them) so I read first the basics followed by TA, futures, and now I\’m in options theory so what should I study next ?
These are all independent modules, pick whatever suits your need 🙂
Sir will there be personal finance part 2 soon ? Waiting 😃
Yup, hopefully towards the year-end 🙂
Thanks for the quick reply.
5) I am not sure what do you mean?
8) But how do I find/screen them? https://www.moneycontrol.com/mutual-funds/find-fund/ This is for MF only. How do I screen debt ETF? Where is the list of their tickers?
9) I think it should happen since the coupon is paid regularly. It\’s like a stock paying dividends and losing its value? But the investor don\’t get poor since they get equivalent dividend (coupon)?
5) Mutual funds are tax efficient structure, Varun as fund houses don\’t have to pay taxes like STT
8) Look for the ISIN/symbol and type that out in your Marketwatch. Check this for the list and transaction volume – https://www.nseindia.com/market-data/bonds-traded-in-capital-market
9) Thats the nature of a bond hence the value 🙂
Just finished the module. 🙂 I was writing all my questions in a notepad, so I have many questions now together. Sorry about that.
1. How do mutual funds predict expense in advance? If they actually spend more/less, do I get a refund or have to pay more?
2. I assume mutual fund expenses include both the running costs of AMC as well as profit for the sponsor. What percent of the expense fee goes to the Mutual Fund sponsor? Is there a way to know? I notice MF in India has relatively much higher expenses than in the US.
3. Is their same tax rule for ETF and MF. ETF for an MF will be taxed the same as underlying MF? For example, BHARAT BOND will be taxed as a bond
4. Why do passive funds so have expenses higher? It should be straightforward to just reshuffle a few times a year and should just cost only flat 100 INR or similar?
5. Should I have a highly diversified portfolio of bonds (with good credit ratings). Assuming the yield is similar, isn\’t it better to have 200 companies in a debt bond with a 0.5% ratio each, rather than 20 companies with a 5% ratio of each? My reasoning is that bonds have fixed income unlike stocks so we won\’t miss anything. In case of default, now our portfolio will be down by only 0.5% instead of 5%. Sure defaults will happen more frequently but a single default won\’t be that devastating and we will get time to react to it and plan accordingly.
6. Strange question but can I buy/sell FD-like bonds in the secondary market. Suppose I am getting 6% interest from FD and now I want out. Can I transfer the FD to someone in the secondary market?
7. Many FD seems to offer better returns than ultra-short debt funds. Why shouldn\’t I go for them? They seem better in every way. Why aren\’t they more popular among HNI and corporates?
8. How to buy/sell bonds in the secondary market? I know they are available on Zerodha Kite but how do I find a list of them, their details, their tickers? (Out of curiosity)
9. All things equal, I assume bond price should fall every day over its lifetime? I think this should be the chart with price as y-axis and time left as x-axis https://i.imgur.com/ltL6peJ.png
10. Can investors force a company to declare bankruptcy and sell all its assets if its defaults on the bonds? For example Vodafone Idea?
1) No clarity on how they arrive at the TER, it differs from AMC to AMC. No refunds 🙂
2) No, no clarity on this as well. But I guess you can check the AMC\’s annual report to see if they have given the split
3)Yes, a similar approach
4) it is actually lower right?
5) Fund structure is always better, especially from the taxation perspective
6) Nope
7) FDs are popular, the only issue is liquidity. With Funds, you can sell anytime but with FDs you are locked in
8) Yeah, just like the way you add a stock on the Marketwatch.
9) No, why do you think so? That would make bond investing a losing affair right?
10) This can happen via NCLT.
sir
please provide all modules in pdf
Hello,
Great article to understand GDP, fiscal deficit etc. for people from non finance background.
I have one question though. You mentioned about increasing tax collection to reduce fiscal deficit. Why would govt then reduce corporate tax to 24%. Or is it like it would come back to the govt eventually as more tax when companies expand their business and pay higher tax in absolute terms ? Plus more foreign companies would be interested to put shops in India because of low tax regime ?
Lesser tax means more cash retained by corporates, which means more capex. Goes back to the economy in an indirect way.
Hi Sir!
For me after Prof. Walter Lewin you are the next whom I truly admire as a teacher. In-fact I should admire you more because I am just reading your notes (virtual learning), not attending your lectures (face to face learning). I just enjoy every minute spent on varsity. I truly appreciate you and your time you spent helping us learning the finance.
May the wisdom and well health goes long.
And finally a quick question. What are those 10-15 chapters you mentioned in the first sentence of the Macroeconomic chapter!! 🙂
Thanks for the kind Subhesh, means a lot 🙂
10-15 chapters are around portfolio rebalance, portfolio review, insurance etc 🙂
Thanks for this module. Can you share how frequently do you look at the macro-economic trends? And what are significant events that you watch out for. Also is Wikipedia a good enough resource to look at that frequency or is there a more standard report published somewhere?
At least once a year, Nano. Yes, wiki and few other resources (news portals) is good enough.
Hello Sir,
Can you write about Insurance, EPF, PPF, and NPS Schemes
Hopefully in personal finance part 2.
Such a great read! I felt as if I am having a conversation. Thank you for inspiring me with these modules.
Happy learning, Kaushik 🙂
Thank you Karthik and to your team as well. Writing and compiling such extensive modules requires tons of patience and hard work. Kudos for spreading this knowledge that too without charging a penny. Not everyone’s cup of tea 😊
Thanks for the kind words, Himanshu. Hope you continue to learn enjoy reading on Varsity 🙂
Respected sir,
Shall we expect a part 2 of personal finance any time ?
Later this year, after I finish the module on Financial modelling.
Got it Sir. Few More,
1. Morningstar Website Showing Load % on some MF, What does mean.
2. What is Turnover ratio, how to analyze it, does it manner while selecting MF.
3. Some particular MF having Debt on it and Negative Cash Balance, What does it mean.
4. While Sectorial/Thematic fund giving higher return among all category, what should be caution/disadvantage? Can it be topping on Plain Vanila Portfolio?
I hope no more question from my side. 🙂
Thanks for Just everything you did for us!
1) Not sure, need to check this
2) Turnover ratio tells you the extent to which the stocks in the MF portfolio is churned i.e. bought and sold. The lower the ratio, the better it is.
3) I\’ve explained this earlier in the module, request you to check that
4) Sectors can underperform for an extended period, driving the returns performance down. Getting the timing right can be very difficult, better to avoid it in my opinion.
Good luck.
Too good, Too much enjoyed and Too many questions… some related to topic, may be some not.
1. with respect to initial example of 3 girls where early investment made higher profit, it is advisable to start MF investment with initial high lumpsum investment and continue small SIP there after?
2. Can we Pause MF SIP? Where I don\’t want to redeem, Nor want to add more fund. Just want to stay invested.
3. By AMC as company structure where their earnings come from? Investing in AMC equity is like buying all the AUM they have?
4. I think we have not covered Equity SIP, Can it generate better return against benchmark if selected right equity?
5. Or as all the data available in MF Factsheet, Can we replicate it in our Equity SIP? Does it make sense?
6. Would like know more about Sovereign Gold Bond. Pros and Cons? From where/how to buy? Again SIP possible in same?
7. Last but Totally out of topic, need your personal advice, While owing long term obligation say home loan (ROI 7-8%) what should be priority, to be Debt Free by paying access saving to loan, or it should be invested where it can generate higher return.
Tons of thanks for all the wonderful modules.
Stay blessed,
1) The idea is to start, but yes, if you are willing to give that lumpsum amount a lot of time, then you can. Lot of time = 15 plus years at least
2) Yes, you can do this on Coin
3) No, its buying into the business of the AMC itself
4) Better returns are never guaranteed 🙂
5) Yes you can, but the onus of management is on you
6) SIPs is possible, but I\’d suggest you don\’t. YOu\’d rather participate in a new issue and stay invested
7) Getting debt free should always be the priority.
Good luck!
Hello Sir,
In which chapter have you discussed about Nifty TRI?
I guess I\’ve done that throughout this module, Karan. Maybe in the chapter related to benchmarking 🙂
*Its DSP mutual fund not DBS Mf.
Good evening sir,
According to the analysis thought by you, I build my own Mf portfolio-
HDFC Nifty 50 index fund- Rs. 2500
ICICI Nifty next 50 index fund-Rs. 1500
DBS/ AXIS Mid cap fund-Rs. 1000
I want your suggestions on this. It\’s for 10+ years.
Looks good, but NExt 50 and mid-cap is kind of an overlap no?
Sir how is it possible that Axis mid cap fund is better in risk management (in all parameters) and in returns compared to its peers.
Maybe they have a better risk management technique 🙂
Hi sir,
I wanted to know about Nifty 50 ETF. I researched about ETF, and got to the conclusion that
In Indian market etf sip is not possible, plus it\’s illiquid so end up paying extra bucks.
So, would it be good to go by NIFTY50 INDEX FUNDS instead of Nifty 50 ETF.
YOu can create a ETF SIP using this – https://support.zerodha.com/category/trading-and-markets/kite-web-and-mobile/articles/kite-sip-order
Sir, I have literally been your fan after reading this module. Keep doing these great work!!
Sir I have a small request if you could also add Personal Finance module 2 in which topics like- Medical insurance, Term insurance, S.G.B., etc. can be added in the same detailed manner.
Thanking you.
I will add that, Pratik.
Sir, please upload some modules on investing in Provident Funds, EPF, PPF, Gold bonds, NPS etc. so that I have a complete picture of all the investment options & can start my financial planning now. Is a part 2 of financial planning coming soon?
Yes, that\’s planned in Part 2. But that module will come up only by year-end I guess.
Hi Karthik,
Just saw your comment regarding the plan for Personal Finance Part-2, is there any tentative date for it, eagerly waiting for it?
I have read many of the modules and they were extremely helpful for me to get a good financial knowledge. Loved your work.
Thanks a lot
Mostly by the end of this year. I\’ve just started a module on Financial modelling.
Thank you so much Karthik for another insightful chapter. It was wonderful morning read. I was never able to understand deficit related news.i hope now I will.
Also I started MF investment and did all research by myself without looking star rating.thanks again goes to you.
I have a question again 🙂
What do you think about investing in invoice discounting? Do you suggest it over short term debt mutual fund ?
Thanks in advance.
-Ganesh Patel
Glad you liked the content, Ganesh. I\’ve never really explored invoice discounting 🙂
I know there are few platforms that let you do that. Maybe you should also consider the tax angle to this.
Hi Karthik,
Thank-you so much for all the effort you have put into teaching us ❤️.
As you have said that \’the module on Personal Finance has come a long way with over 30 chapters. I can easily think of another 10 or 15 chapters to add…\’ , could you please tell me atleast the name of those additional 10-15 topics on Personal Finance, so that I can Google it & learn them from somewhere else?
I\’ll try and create these chapters and put them up in Part 2 of personal finance. Topics mainly include insurance, Rit planning, NPS etc.
Sir,
Great chapter as always. Do you plan writing about other investments like VPF, NPS, etc?
I\’d probably in the Personal Finance Part 2.
Dear Karthik,
Could you write a separate module on Quantitative analysis(QA) like you did for Fundamental Analysis (FA) and Technical Analysis (TA)..?
Have explained that here – https://zerodha.com/varsity/module/trading-systems/
Thank you for your contribution Karthik. Started SIP investment in below funds:
1. Mirae asset large cap
2. Axis mid cap
3. Parag parikh flexi cap
I am thinking of selling my equity holdings in those stocks which are already covered in these funds. Is it a good idea to infuse that capital in above funds as lumpsum ? Investment horizon is at least 10 years.
Sure Gaurav, as long as you can give these funds 10+ years.
This was brilliant, gave me a good perspective on economics.
Thank you!
Good luck and happy reading, John!
I am eagerly waiting for your next module. When can we expect the first chapter to be out for public?
Thank you
Sandesh
Thanks for bearing with the delay. I hope it should be up over the next few days.
Thank you for the replies Karthik. I have analyzed the mid cap funds today and arrived at the clear winner \’Axis Midcap\’. I am still confused in the large cap segment between Axis bluechip and Mirae Asset large cap.
While Axis bluechip is better at risk management, Mirae is giving better 10 year rolling returns. The trade off seems almost equivalent. Also If I choose Axis bluechip the fund manager would be same as my mid cap fund. Is it wise to invest in different schemes under the same manager or diversify between AMCs. Also how should the SIP breakdown go ? I am planning for a total of 10000 every month for two mutual fund(one from large cap and one from mid cap). Any ratio in which I can divide this between Large cap and Mid cap funds ? Your help is deeply appreciated. Investment horizon is at least 10 years for both
I\’d suggest you go with the one which you think is better wrt risk management. I\’m not sure about the same fund manager part, need to research a bit, but I see no issues since most of the funds follow a set process these days.
But I do agree on the diversification part, always good to diversify between AMCs.
A simple 50-50 split should be ok.
Little confused between Mirae asset large cap fund and Axis bluechip fund now:
1. Mirae expense ratio is 0.54 (Slightly higher than 0.49 of Axis)
2. Upside-downside capture ratio are very good: 102 and 87 (better than Axis)
3. Standard deviation is 17.09 (slightly higher than Axis)
4. Risk is average and return is high on a 10 year horizon (Axis is better here)
How do I choose between both ?
Maybe look at rolling returns, fund history, philosophy and then take a call.
Went through all the chapter. I did a small analysis on all the large cap mutual funds. I think I will go with Axis Bluechip fund growth. Points to consider (10 year horizon)
1. Very low expense ratio
2. Upside-Downside capture ratio are 91 – 77 (Good I think)
3. Low standard deviation as compared to peers
4. Low risk to high return in 10 year horizon on morningstar
What do you think ?
Sure, Gaurav. Good luck and all the very best. Do remember to give your investments enough time to grow.
Sir, have been waiting for the financial modelling module since so long . Could you tell us the tentative dates of it coming out?
Me too Sanjana, will try and upload 1st chapter as soon as I can.
It was a wonderful experience kartik.i am a varsity reader .its been 1 year. I have read most of your modules .(1,2,3,4,5,6,7) and 11 .you explained everything in a easy language. Waiting for next module.
Happy to note that, Abhay!
it was really good module sir i have completed every module in varsity and even read all mind over markets articles also i am waiting for your next module sir. When will it be uploaded ? and also will there be any sort of notification sent when its uploaded? and also big fan of your writing.
Amazing, Rahul! So happy to hear that you\’ve completed all the modules. The next one is on financial modeling, I will try and upload a chapter soon (8-10 days).
i have posted my query in the taxation module as well but there was no reply so i am asking here that i have no any source of income and i have made a short term capital gain of 1.5k in a year? so is this small amount of 1.5k taxable or not?? plzz sir reply
i have posted my query in the taxation module as well but there was no reply sir. so i am asking you here that i am a student with no source of income. and i have made short term capital gain of 1.5k so will i have to pay tax on this short term capital gain of 1.5k???
Rahul, no there wont be any income on this.
Dear karthik sir, really liked this chapter and other chapters as well. looking forward for the next chapter. sir i have one problem regarding taxation. i am a student with no source of income and i have made a short term capital gain of 1.5k by selling shares so
1. will i have to pay tax on this small amount of 1.5k?
2. if yes then how do i do this?
Rahul, this is the last chapter of this module. About taxation, I\’d suggest you post your query in the taxation module.
Sir , I have read most of your modules and they have been very enlightening.
I just want to ask whether you have made any module / chapter on Valuation of companies/ business and if not do you intend to do so in the near future ..
Rishi, thanks. I\’m glad you liked it. The next module is exactly on this topic 🙂
I\’ve read all your modules but there\’s one thing missing. When will you upload an individual module for quantitative Analysis? I\’ve been waiting so long for this.
I\’ve explained quite a bit on the Trading systems module.
Hello sir, love your content. I appreciate your efforts to educate everyone. Just one request. Please make available PDF file of all the chapters as soon as possible. I will take printout as it is more convenient than reading on smartphone. Thanks for writing this wonderful module.
Thanks, Rakesh. Will put up the PDF soon.
please provide pdf of this module at the earliest
please give combined pdf of mobule 11 and 12 at end
We will upload PDF for 11, but no PDF for 12.
Sir, one more request, please provide download option for MODULE 12: INNERWORTH: MIND OVER MARKET.
Unfortunately, we cant put up the PDF for this module.
Sir, please provide option to download this module as pdf.
Working on it.
Hi Sir. Can I ask you what books are you reading right now? Or one or two books that you have absolutely loved in the past? May or may not be related to finance. I am free now and do not have a lot to since and since the new chapter on FM is not out, I am asking for recommendations. Thanks.
Trying to read this book called \’Finding your Element\’, its nice. But generally speaking, I don\’t read many books, which is probably not the right thing to do 🙂
Make this chapter into a pdf
Waiting for the PDF download option for the module 11. Please could you help. Thank you for the fantastic effort
Will have it updated in the coming week, thanks for the understanding.
Sir plz provide the pdf of this module.
Dear Mr. Karthik,
Went through a lot of your modules & chapters. Please accept my heartiest congratulations for this thorough work of yours characterized by unique attributes like absolute conceptual clarity, most simplistic language, and an attitude to \”Give Back\”. I have rarely come across such genuine knowledge sharing especially on this important and life-encompassing subject which ideally should be a concern of all from 16\’s to 60\’s & beyond.
Regards.
Ranjit.
Thank you so much for the kind words, means a lot to all of us in the team 🙂
Happy learning!
Hi Karthik. I read in the comments section that the new module on Financial Modelling will be out by March month end. Can you tell me when it is going to be published as I am eagerly waiting for the same? Thanks.
This got delayed a bit. The first chapter will be up in another 15 days.
Hello Mr Karthik,
Thank you so much for this great module, When can we expect Personal Finance (Part 2).
Hi Karthik Sir,
Sir desperately been waiting for the financial modelling module!
Hopefully, in the next 15-20 days I should put up the first chapter.
Hi Sir,
Wonderful module. I learnt a lot of valuable lessons.
I was wondering will there be \”Personal Finance Part 2\” anytime soon?
Thank you
Not in the near future, Sandesh. I plan to do the module on Financial modelling next.
hello sir!
since it isn\’t available, can you please provide \”Download PDF\” link at the end of this module too just the way it is available for all the other modules.
kindly do the needful. thanks 🙂
We will Anurag, please give us some time to prepare this.
Sir, Such a wonderful module. Thank you so much for sharing this knowledge with us.
Happy learning, Kaushik.
Please add the last updated (or chapter posted) dates for each chapter if possible.
Sir, when will all these modules be available in the form of cards in varsity app . Is this module complete…??
Hopefully by the end of this month.
Respected Sir,
Such a beautifully written module that explains concepts in utmost brevity! Kudos for making our lives easier. Can you let us know as to how to select funds from other markets, i.e. international investing and the points to keep in mind while doing that. You briefly touched upon investing in US bonds by govts etc. but from a retail investor perspective what makes sense and all.
Thanks,
Deep
Deep, I\’m glad you liked the content 🙂
The process I\’m guessing remains largely same. However, I\’ve never looked at funds outside India, hence wont be able to comment.
Sir Please make pdf available
Sir I recently read a book called Masterclass with Investors. They say that Top Down investing is one of the prominent ways of stock investing. Can you suggest me how to get started in that sir? Also, please suggest a book on the same. Thank you.
No particular book, Sundeep. I\’ll try and lay down a template on this one of these days.
There will be part 2 on personal finance?
Yes, but at a much later point 🙂
Hi Sir,
Really Grateful to you for all the knowledge you have ushered upon millions like me.
I request you, if you may consider fit, to kindly create a chapter explaining the Global Exchanges, the important Indices and their impact on Indian scenario.
Thanks, AShutosh. That is an interesting thought, adding it to my list. Will do.
Such a fun and interesting module to have come across. Rarely is personal finance taught with such flowy manner. I guess your way of relating things with scenarios and stories sets the material apart.
I see you have updated the module name as \”Part-1\”. Are we expecting a Part-2 as well on personal finance? If yes, by when can we hope to have another chapter?
Thanks Ajay, glad you liked the content. Thats right, when writing the closing notes for this module, I realised there is more to personal finance, chance renamed this to Part 1. Dont know when Part 2 will come by, maybe by this year end. The next module is on Financial modelling.
Hi sir,
I realise that the Varsity project was an absolute labour of love, your (and your team\’s) love to make people financially literate.
Respect
Thanks for the kind words, Hari! Hope you enjoy reading Varsity 🙂
Sir,please suggest the best book in macroeconomics.
Subash, do check these videos\’ on Khan academy – https://www.khanacademy.org/economics-finance-domain/macroeconomics
Really hats off sir.
This type of clarify I had never got from any sources. Very simplistic examples u have taken. In fact, I\’m doing research on macroeconomic indicators, still more things need to be focused by me from ur source. Thank u sir
Happy reading, Susant!
Finally the day came,I was waiting for this one from months.. fingers crossed for next module
FINANCIAL MODELLING
,I too asked 5 times when this module is going to come
Thank you sir
Hope you are having good time at Pondicherry 🌈
I remember Chandu, I hope your wait is worth its time wrt to the next module. I\’m back in Blr, Pondicherry was nice 🙂
Hi Karthik,
Thank you for this wonderful masterpiece. Understanding these concepts were never easy before but your writings made it easier. I request you to publish more modules on Macro economic factors. I didn\’t wanted the last module to end as the topics made me hooked on to read but just the introduction to Macro economic factors in the last module was just not enough 🙂
Thanks, Shwetha for the kind words, I\’ll probably add few more chapters in Part 2 of Personal Finance 🙂
Reposting the same Anurag has posted
Please suggest some good comprehensive books on macro economics
Here you go – https://www.khanacademy.org/economics-finance-domain/macroeconomics
Sir,
I never paid attention on that all the modules are being added with/updated time to time. great job sir thank you so much
Happy learning, Roshan!
Dear Sir, can You please guide us with some books on macroeconomics?
Here are a bunch of good Macroeconomic videos, Anurag – https://www.khanacademy.org/economics-finance-domain/macroeconomics
Sir finally the module I\’ve been waiting for for the last one year is on its way. Financial Modeling of course. You know I have been a long term reader of varsity and I recommend it to my friends who ask me to stock tips (which I never provide BTW). I have one question sir. Can you talk about your writing process? I\’ve always admired how you make complex finance topics very easy to understand. Where do you read stuff from? I know it\’s asking a lot to answer such question but please oblige for this is a request of your adrant fan. Take etf chapter for example what was your writing process? Where do you get the info and how do you make it simple for us to understand? Please shed some light of this. Thank you.
Sundeep, yes, I remember you talking about Financial Modeling. I\’ll start work on that starting next month and hopefully, the first chapter should be out by March end. Thanks for your patience. The ETF chapter is not authored by me, it is by my brilliant colleague, Bhuvan. That reminds me, I need to put up a note at the beginning of the chapter to let ppl know about it. Thanks!
Sir, such a wonderful module. Please provide the option to download module as pdf. Thanks
Yes, will do that.