
Please note, this is a guest chapter, and I’ve not authored this. This chapter on ETFs is authored by my colleague, Bhuvan. However, I’ll try and answer all the follow on queries that you’d post.
Happy learning,
-Karthik Rangappa.
29.1 – Overview
In chapter 7, we looked at what a mutual fund is and how it works. To recap, a mutual fund is a pooled investment vehicle that collects the money from various investors, invests and manages that money on their behalf. When you invest in a mutual fund before the order placement cut-off time, you will get the units as per the same day’s NAV which is disclosed by midnight. If you invest after the order placement cut-off time, you’ll get the allotment of units per the next day’s NAV. Basically, everything happens at the end of the day.
Now, what if those mutual funds units could be traded on the stock exchange just like stocks like Reliance or Infosys? Just like a mutual fund, an exchange-traded fund (ETF) is a pooled investment vehicle that holds a basket of securities like stocks, bonds, and commodities and trades on the stock exchanges. You can buy and sell an ETF anytime, just like a stock.
There are a few more nuances to an ETF than a mutual fund, but before we dive in, I hope you have a working idea of what an ETF is.
29.2 – History of ETFs
Mutual funds have been around in some form for well over 100-years. The first open-ended mutual fund in the US was launched in 1924 and is still in existence today. The first mutual fund in India was launched in 1964. Mutual funds have democratized access to stocks, bonds, real estate and commodities globally to common investors. Exchange-traded funds (ETF) were the next evolution of mutual funds.
ETFs, on the other hand, are relatively new. The SPDR S&P 500 trust, arguably the first ETF, was launched in 1993 in the US. Coincidentally, it is today the largest traded security in the world. NiftyBeES an ETF tracking the Nifty 50 index was the first ETF in India and was launched in 2002. It was launched by Benchmark AMC, which Goldman Sachs later acquired, which Reliance later acquired, which Nippon India Mutual Fund later acquired 🙂
29.3 – ETFs in India
Though ETFs have been around for a while in India, they haven’t really popular among retail investors. ETFs, have mostly been used by HNIs and institutions. For example, the SBI Nifty 50 ETF with Rs 89,441.55 cr is the largest mutual fund in India. This is almost entirely because this is one of the ETFs in which the Employees’ Provident Fund Organisation (EPFO) invests.
A large part of the ETF AUM growth is due to:
- EPFO investing in Nifty & Sensex ETF
- Government divestment through CPSE ETF and Bharat 22 ETF
- Introduction and the Govt push for Bharat Bond Debt ETFs. Most of the AUM in these ETFs is non-retail.
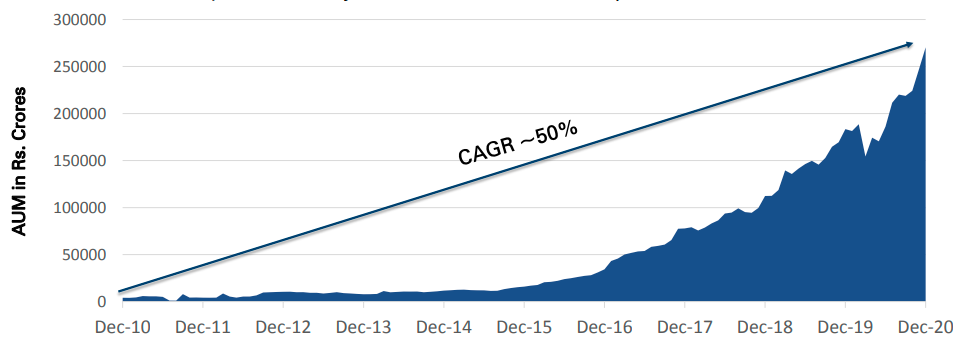
Growth of ETF AUM in India
Though still a small piece of the pie, the retail participation has been growing steadily over the years and so has the trading turnover on the exchanges.
https://twitter.com/NSEIndia/status/1347173764786577409?s=20
NiftyBeES which is 20 years old, just has about Rs 2800 crores of AUM. There are a lot of reasons for the under penetration of ETFs:
- India is still a tiny market. We just have about 1.7 crore active demat accounts, and unlike a mutual fund, you can only buy an ETF if you have a demat account.
- Investment products, be it mutual funds or ETFs are push products. One of the reasons why mutual funds are larger than ETFs is because AMCs can pay distributors & platforms commissions to sell their mutual funds. But ETFs don’t have commissions like mutual funds.
- ETFs are also relatively trickier to understand initially compared to mutual funds. But we’ll take care of that with this chapter.
- Most AMCs, rarely push ETFs because they have low margins and don’t make sense with small AUMs.

29.4 – What is an ETF?
An exchange-traded fund (ETF), just like a mutual fund is a basket of securities, but this is where the similarity with a mutual fund ends. Unlike a mutual fund, an ETF trades throughout the day on the stock exchanges. You can buy and sell an ETF anytime you want just like a stock.
For example, if you search for “Nifty ETF” on Kite, you’ll see a list of all ETFs that track the Nifty 50 index.
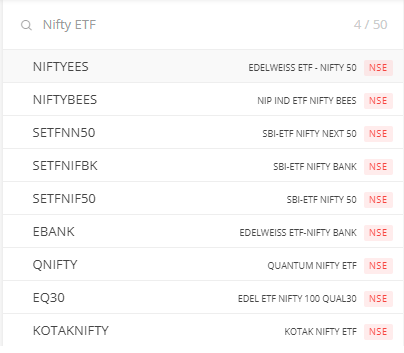
Searching ETFs on Kite
29.5 – How does an ETF work?
When you buy a mutual fund, the AMC takes money from you and buys the securities and discloses the NAV at the end of the day. Similarly, when you redeem your mutual funds, the AMC sells the securities and returns your money. This is quite straightforward. However, when you buy an ETF, you don’t really interact with the AMC most of the times because most buying and selling happens on the stock exchanges. It’s just an exchange of units between buyers and sellers.
29.6 – Creation and redemption mechanism
I said when you buy an ETF, you “mostly” don’t interact with the AMC and I’ll explain what that means. If you remember chapter 6, we discussed all the entities involved in an MF transaction — the AMC, custodian and the RTA. But what makes an ETF unique is something called the creation and redemption mechanism. But before we talk about it, you need to know a couple of things.
- NAV, iNAV, the market price
- Market makers and authorized participants
- Creation units
- Premiums & discounts
- Tracking error
Market price
When you buy a mutual fund, you look at the NAV. Similarly, when you are buying an ETF, you look at the ETF market price on Kite.
ETF prices
These prices are determined by the demand, supply and the trading activity on the exchanges. But how do you know if the price you see on Kite is the fair price you are paying for an ETF? Here’s where the Net Asset Value (NAV) comes in.
Net asset value (NAV)
Like a mutual fund, an ETF also has an end of the day Net Asset Value (NAV). Just to refresh your memory, NAV tells you the total value of all the fund’s assets and yours. The formula for calculating NAV is NAV = (Value of all the assets – the expenses)/number of shares (units). But remember, an ETF trades real-time, whereas NAVs are only announced at the end of the day. So how do you figure out if the price you are paying for an ETF is fair in real-time? Enter iNAV
Intraday or indicative net asset value (iNAV)
Given that ETFs trade real-time, you need a reference point to see if the market price you see on your trading platform is a fair one and the indicative or intraday NAV (iNAV) serves as that reference. AMCs usually calculate this every 10-15 seconds and publish it on their websites. iNAV = last traded price of all the securities in the ETF basket X number of shares in the ETF creation basket + cash component (i.e. cash which is not deployed in the ETF) divided by total ETF shares in the creation basket. Put simply; this serves as a real-time NAV so that you can use this as a fair value reference to compare it with the current market price on the stock exchanges.
Creation unit
Like buying ETF units on the stock exchange, you can also buy units directly from the AMC. I’ll explain why you’d want to do that later. But, unlike the exchanges, you cannot buy 1 or 2 units directly from the AMC. You can only create and redeem units in what’s called the creation size that the AMC defines. A creation unit is nothing but a representative basket of all the securities in the same proportion as the underlying index. For example, the creation unit size of the ICICI Nifty 50 ETF is 50,000 units, and as of this writing, it’s about Rs 80 lakhs. Meaning, you need 80 lakhs to buy all the stocks in Nifty 50 in the same weight.
Market makers and authorized participants (APs)
Unlike mutual funds, there’s another entity called market markers or authorized participants in the ETF ecosystem. The role of these guys is to provide liquidity on the stock exchanges. You don’t have to worry about liquidity in a mutual fund because there’s no real-time trading. But since an ETF trades real-time on the exchange, market makers are appointed by the AMC to provide liquidity continuously. They do this by providing continuous two-way quotes on the exchange, meaning they buy at the bid and sell at the offer, and the difference is the profit they make. Even though these are small amounts, since they keep doing this, it tends to add up.
Market makers typically tend to be large brokers in India.
Premiums and discounts
Since an ETF trades real-time on the exchanges, their price is influenced by demand and supply—the prices of liquid ETFs trade in line with the NAV of the ETF most of the time. But sometimes, particularly during volatile market phases, the price of an ETF can trade away from the NAV of the ETF. If the price of an ETF is above its NAV, it’s called a premium and if the price is below it’s NAV, it’s called a discount.
Tracking error
Tracking error is the annualized standard deviation of the difference between the ETF NAV returns and the index that it tracks. In simple terms, it shows you how closely an ETF tracks its underlying benchmark. A simple example would be if Nifty 50 returned 10% and Nifty ETF gave 9.8%, the tracking error would be 0.2%. An ETF or an index fund will have lower returns than the index because they have an expense ratio and an index doesn’t.
A lower tracking error indicates that an ETF or an index fund is tracking the index better. But this is not really an intuitive measure to understand and we’ll discuss that later.
With these concepts in mind, let’s get back to the concept of creation and redemption mechanism
There are a few reasons why the creation and redemption mechanism is important. For one, you need not always buy an ETF on the stock exchange. If you are buying in multiples of the creation unit size, buying it directly from the AMC is way better because you might face liquidity issues and impact costs when you buy large quantities on the exchange.
So, in the example I mentioned above, the ICICI Nifty 50 ETF’s creation size is roughly 80 lakhs. If you are investing in multiples of 80 lakhs, you can directly contact ICICI, and they will create units, in this case, 50,000 units and credit them to your demat. The AMC will create units at the iNAV. Similarly, you can redeem them by transferring the ETF units to ICICI, and they will credit the cash to your bank account or you can also get the underlying shares instead of cash.
The second reason why creation and redemption mechanism important is for ETF arbitrage. Like I mentioned earlier, ETFs can trade at premiums and discounts to the NAV. Market makers are essential in the ETF ecosystem because they are responsible for correcting these premiums and discounts. They do this through the creation and redemption mechanism.
Typically ETFs trade close to their NAVs. Here’s a comparison of Nifty BeEs, SBI Nifty ETF, ICICI ETF and Nifty 50.

Nifty ETFs vs Nifty 50
But during a volatile market phase, for example, like the COVID crash in 2020, there can be wide premiums and discounts. Here’s how even a popular ETF like NiftyBeEs and SBI Nifty 50 ETF, India’s largest mutual fund performed during the volatile market phase of March-April 2020.

Nifybees vs Nifty 50
Now, here’s where the market makers come in. If there’s a premium, the authorized participant (AP) will buy all the underlying securities that make up the ETF creation unit. In this case, the AP will buy all the 50 Nifty stocks of the same weight; this is also called the creation basket and give them to the AMC. In turn, the AMC will create ETF shares and give them to the AP, who will then sell them on the exchange.
Similarly, if there’s a discount, the AP will buy the ETF units on the exchange and give them to the AMC. In return, the AMC will give the underlying shares of the ETF to the AP, who will, in turn, sell them in the market. The difference between the premium, discount, and the NAV will be the AP/market maker’s profit.
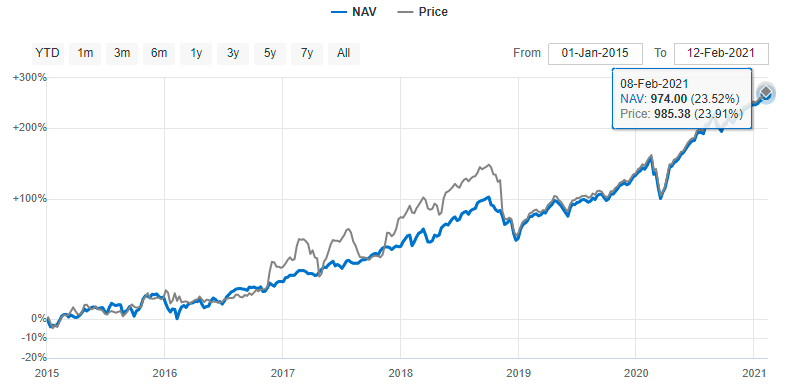
Perhaps, the best example of this would be the Motilal Oswal NASDAQ 100 (N100). During 2017-2018, the ETF was trading at a huge premium to the NAV. The premiums were as high as 20%+. This was probably because the market makers weren’t active in providing liquidity. Value Research allows you to compare the NAV and price, here’s a chart, notice the huge difference between the NAV and the price.
Someone could have taken advantage of this premium by going to Motilal AMC and asking them to create units, which happens at the NAV and sell them at the market price on the exchange. The difference would’ve been the profit.
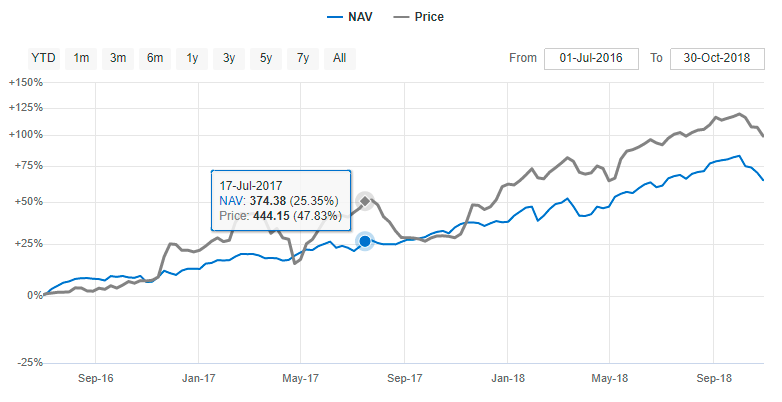
N100 ETF price vs NAV
This premium persisted for a long time. Then Motilal, If I’m not wrong, appointed new market makers and launched a fund of fund (FOF) for the ETF, which corrected the premium. So the market maker around 2018 would have created Motilal units at the NAV and sold them on the exchange at the market price and corrected the premium.
N100 ETF price vs NAV
This is how creation and redemption mechanism in an ETF is used to ensure liquidity and arbitrage premiums and discounts.
29.7 – ETF liquidity
This is the most important thing when buying or selling an ETF because they trade real-time. When choosing an ETF, most people tend to look at the AUM of an ETF and the trading volumes to decide if an ETF is liquid. Although these 2 things should be considered, the size of an ETF or the daily trading volumes alone don’t indicate liquidity.
Let’s unpack what ETF liquidity really means. It’s essential to remember at this point that even though ETFs trade like stocks, they are not the same.

Layers of ETF liquidity -American Century
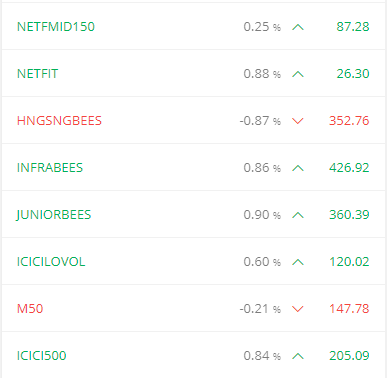
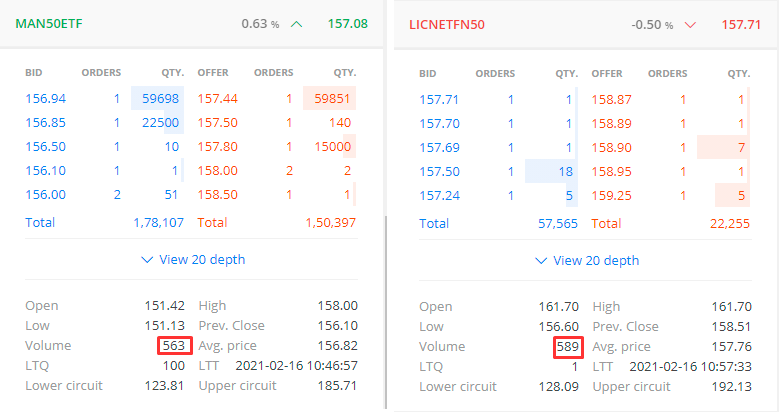
Secondary market liquidity: This is what you see on your trading platform. The spread between the bids and offers give you an idea of the available liquidity, but that’s not all. Take a look at this image, comparing Mirae Nifty 50 ETF and LIC Nifty 50 ETF. The LIC ETF has an AUM of Rs 618 crs, and the Mirae ETF has about 483 crs. As of writing this post, both the ETFs had just traded 500+ units.
Spreads
Typically, you’d ignore both ETFs assuming that they are too small and don’t trade much. But that would be an incorrect assumption because on-screen liquidity isn’t everything.
ETF market depth: If you look at the Mirae ETF, nearly 60,000 shares are available for purchase. That means, even if you place a market order, which is a really terrible mistake when buying an ETF, you will get a good fill at Rs 157.44. This is probably a market maker posting a bid and an offer. The LIC ETF, on the other hand, has no liquidity at all. If you’d have placed a market order for 100 unit by chance, your average price would have been way higher than the last traded price, given that there are no volumes and your order would’ve been continuously executed at higher and higher prices.
So, AUM and trading volumes don’t tell you everything. Market markers typically hold units that don’t show up in the market depth. If you place a limit order to buy, your order will be executed as the market makers place an order to sell. But yeah, not all ETFs have active market makers, this has to be part of your ETF due diligence which we’ll talk about in a bit.
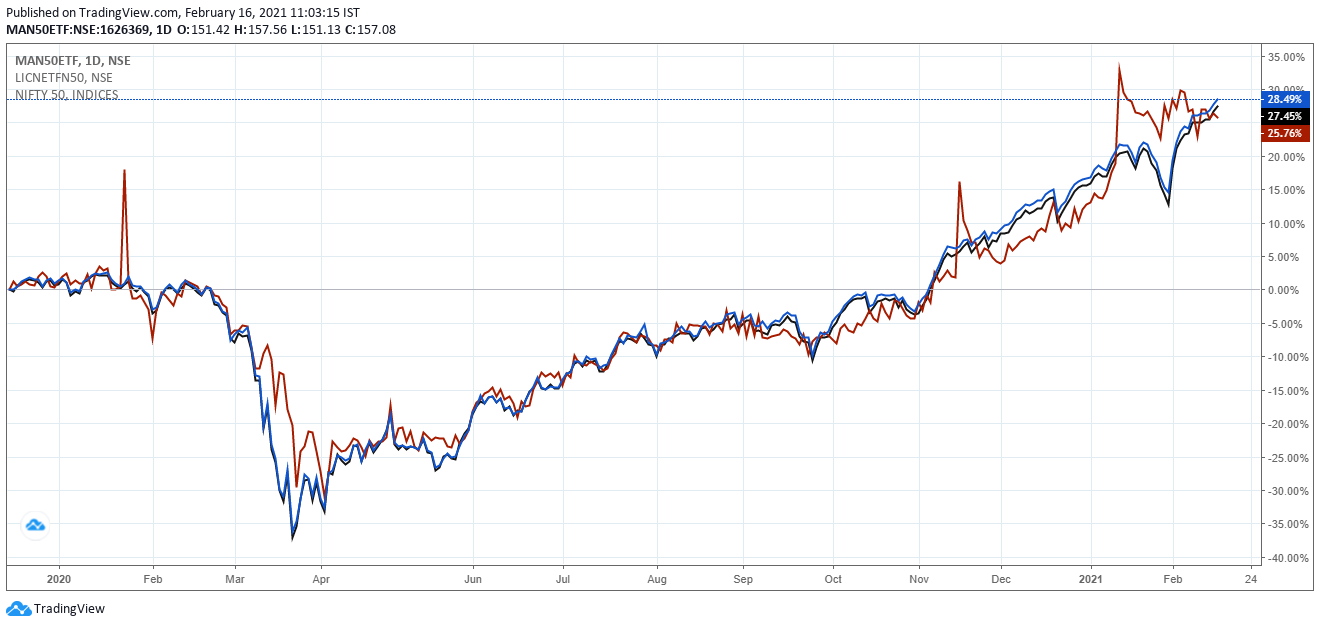
Here’s how the Mirae ETF and LIC ETF have tracked Nifty 50. While Mirae has closely tracked Nifty 50, LIC has been all over the place trading at premiums and discounts.
Mirae vs LIC Nifty 50 ETF
Primary market: The third layer of ETF liquidity is the primary liquidity. Remember, a stock has a fixed number of shares on offer, But even though an ETF trades like a stock, it’s not a stock. Market makers and investors can create new ETF units. Large institutions, HNIs, typically don’t buy ETFs on the exchange. They directly reach out to the AMC and create units that don’t show up on your trading platforms’ market depth.
Liquidity of the underlying stocks: The last and the most important layer of ETF liquidity is how liquid the underlying stocks that make up an ETF are. Remember, an ETF is just a wrapper that holds all the stocks that make up the ETF or an index. So, an ETF can only be as liquid as the underlying stocks.
This might be a little confusing, so let’s take an example. Today, in India, we don’t yet have a small-cap ETF, have you ever wondered why? In the Indian markets, the liquidity quickly starts disappearing after the 200 largest stocks. As we go down the market cap, the smaller stocks tend to have less outstanding shares, less trading volumes, and usually keep hitting upper and lower circuits.
So, assuming there was a small-cap ETF and that there was a sudden spike in demand, the market maker would have had to create units to satisfy the demand. Now if some of the underlying stocks are not liquid or have hit circuits, which is quite common in small-caps, he wouldn’t have been able to create units. In such a case, the ETF will probably trade at a premium to the NAV because there will be more demand for the existing units. Not just, small-caps, even mid-cap stocks in India have liquidity issues. So, an ETF can only be as liquid as it’s underlying stocks. But this isn’t a problem in a large-cap ETF like a Nifty 50 ETF because these are the biggest and the most liquid stocks.
To summarize, trading volumes and AUM are factors, but they don’t tell you everything about an ETF.
29.8 – ETF choices in India
Like I mentioned at the start of the chapter, ETFs are pretty new in India, we have about 88 ETFs today. A majority of them are equity ETFs. Here are your ETF choices:
- Equity ETFs
There broadly 2 sub-categories of equity ETFs. You have your plain vanilla market-cap-weighted ETFs that track indices like the Nifty 50, Nifty 100, Sensex etc. And then you have smart beta ETFs which target factors such as value, quality, low-volatility, momentum etc. - Debt ETFs
We have debt G-sec ETFs, Bharat bond ETF which just holds bonds issued by PSUs, and then you have an ETF like the CPSE+SDL ETF by Nippon which holds PSU bonds and State development loans (SDLs). - Commodity ETFs
For now, we just have gold ETFs.
Here’s a list of all Indian ETFs.
Are all ETFs passive?
This is a common question that keeps coming up. Today, the biggest ETFs we have are passive ETFs that track either the Nifty 50 or Sensex 30. But smart beta ETFs aren’t passive, even though the ETFs track an index. They are more of a hybrid of active & passive like we discussed in the smart beta chapter. Globally, 80-90% of all ETFs are passive, but we see the first traditional active ETFs in the US. Maybe, we’ll eventually see them in India as well. So ETFs need not be all passive, it’s just that they are passive today.
ETF due diligence
I know this has been a little long, but the idea was to give you the full context you need before investing in an ETF and help you avoid rude surprises. And I hope at this point; you have a clear understanding of how an ETF works and its mechanics. With that in mind, let’s now look at some things you should consider before you buy an ETF.
Always use limit orders
I cannot stress this enough but never use market orders when buying an ETF, always use limit orders. This is one mistake I see investors constantly make. We saw this earlier but let me reiterate this with an example. Take a look at the market depth of Aditya Birla Sun Life Nifty Next 50 ETF. If you placed a market order for 200 units, your order would be executed at prices starting from Rs 350, which is above the LTP, to begin with, and finally, at Rs 374, that’s 8.7% higher than the LTP. So, always use limit orders.
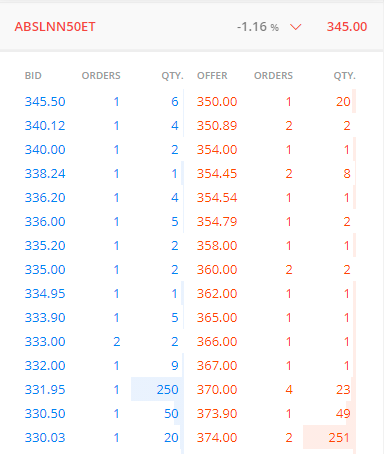
Market depth of Aditya Birla Nifty Next 50 ETF
Always check the iNAV
Always look at the iNAV on the AMC website and place a limit order at that level. Don’t just place a limit order without looking at the iNAV. The other issue is that sometimes AMC websites don’t update their iNAVs or their websites might be down. If there is a big difference between the last updated iNAV and the current market price, that’s a sign that there is something wrong. So, make sure to compare the ETF with the intraday chart of the underlying index of the ETF on Kite, and that will give you an indication if the price is correct. Check with the AMC in such a case before placing an order.
Compare the NAV and the price of an ETF and see how it has performed
You should always buy an ETF that tracks the underlying index as closely as possible. Here’s how Nippon NiftyBeEs ETF has tracked it’s NAV, it’s pretty close. You can compare the price and the NAV on Value Research; we’ll try having this feature on Coin.

Niftybees NAV vs price
Picking up on the earlier point about the tracking error, AMCs disclose the tracking error on their factsheets. But if you see a tracking error as 0.02%, it’s hard to understand what it means. Moreover, AMCs calculate the tracking error on the NAV, but you buy and sell based on the price, which can be totally different. So the best way to analyse an ETF is to look at the difference between ETF prices and the underlying index. You want the price of ETF to track the index consistently without huge differences.
Note: Always compare the ETF price with the total returns index (TRI) and not the price returns the index (PRI). The TRI includes dividends. All the index data you see on Kite is PRI. Since ETFs track TRI indices, they re-invest the dividends which reflects in the NAV of the ETF.
Look at the average volumes
Look at the average volumes over a period of time and see how an ETF has traded. You should invest in an ETF that trades regularly. You should avoid ETFs that just have a brief spike in volumes and then don’t trade. The Edelweiss ETF – Nifty 100 Quality 30 is an example. The monthly average volumes are about 150 units. You can check the average volumes by applying a moving average on the volume chart on Kite. So assuming you had bought this ETF and had to exit, you most likely wouldn’t have been able to.
Edelweiss ETF – Nifty 100 Quality 30
Avoid buying and selling at market open
Most ETFs don’t trade much for 30 mins to 1 hour of the market open. They also tend to trade at abnormal prices because of the low volumes, even orders for a few units can move prices. If you can, avoid trading in the open. And if you have to, check and verify the iNAV and use limit orders.
Is the AMC focussed on ETFs?
Today, most of the AMCs offer ETFs but doesn’t mean they are serious about them. Most of the ETF volumes are in ETFs offered by Nippon, ICICI, and SBI largely. Other AMCs like Mirae, Edelweiss with their debt ETFs do seem serious about building out their ETF offerings. So, along with the other things on the due diligence list, you’ll also have to look at whether an AMC is serious about the ETFs it offers. For example, if you look at some of the ETFs by Aditya Birla Mutual Fund, IDBI, LIC, Indiabulls etc., they have horrible tracking errors and almost no volumes.
Creating units with the AMC for higher-value investments
If your investments in ETFs are equal to or more than the creation basket value, it’s better if you approach the AMC to create units rather then buying on the stock exchange.
29.9 – ETF vs index funds
This is another question that keeps coming up. Hopefully, this table should help answer these questions. In short, if you want to have active control or if you are actively using passive ETFs, then ETFs are a better choice. But if you are lazy like me and want to make as fewer choices as possible, then index funds are a better choice.
With ETFs, you can express tactical strategies better than index funds because you can’t buy and sell index funds immediately.
Index funds |
Exchange-traded funds |
| End of the day NAV | Real-time pricing. Can be bought and sold anytime |
| No issue of spreads because execution happens at the end of the day | You might see wide spreads in certain ETFs and during market volatility. |
| Liquidity isn’t an issue and can be managed. | Certain ETFs don’t trade much, and underlying liquidity of stocks can impact APs and market-making |
| Can create SIPs | Possible with Zerodha, may not be possible with other brokers |
| Expense ratio is all-inclusive—no additional charges | You have to pay a brokerage (free at Zerodha) & other charges & taxes separately |
| Not possible to have tactical strategies. Less flexible compared to ETFs | With ETFs since you can buy & sell anytime, you can express tactical views. ETFs are much more flexible |
| Index funds tend to hold more cash and hence have a slightly higher tracking error | ETFs don’t hold much cash and hence have a lower tracking error |
| Lesser choice at-least as of now. But AMCs are launching a fund of funds for ETFs | Pretty much all of the smart-beta products are ETFs. You have a wider choice |
29.10 – Performance of ETFs vs actively managed funds
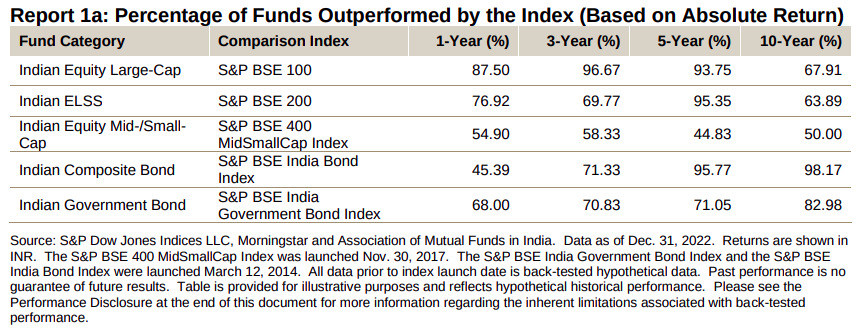
We discussed this earlier in the index funds chapter as well. In the last decade or so, index funds and ETFs have become increasingly popular around the world. One reason is that investors have increasingly realized that a vast majority of actively managed mutual funds don’t beat their benchmarks. In a developed market like the US, ~90% of active funds don’t beat their benchmarks.
The Indian markets have grown a fair bit and have become increasingly professionalized; institutional investors are a big part of today’s market. This means that most of the informational edges and asymmetries have been arbitraged away. Today, pretty much everyone has access to the same information. The odds of someone finding some piece of information that can move a stock, at least in the large-cap space, for example, is pretty much zero. But perhaps the biggest reason why active funds underperform is that they charge too much.
Actively managed large-cap funds on an average charge~1.5% whereas a Nifty 50 index fund is available for 0.10%. And we see this in the performance. S&P publishes a report called SPIVA, which measures the performance of active funds. For any period, over 70% of all large-cap funds fail to beat their benchmarks.
SPIVA India
Traditionally, the view was that the mid-cap and small-cap space was inefficient, and this was where stock pickers thrived. While this was true, it seems like this is increasingly becoming less so. In the last 5 years since the SEBI categorization exercise, active mid-cap funds have had a tough time keeping up with a broad mid-cap benchmark like the Nifty 50 or BSE/NSE Mid-cap 150 index and even Nifty Next 50 etc. Here’s a quick look, this is just for illustration, and ideally, you should look at the rolling returns.
|
Fund Name |
3 Yr Ret (%) | 5 Yr Ret (%) | 10 Yr Ret (%) |
| Kotak Emerging Equity Fund Regular Plan | 12.09 | 19.16 | 17.89 |
| DSP Midcap Fund – Regular Plan | 10.97 | 18.49 | 16.63 |
| Invesco India Mid Cap Fund | 13.24 | 18.07 | 17.95 |
| Edelweiss Mid Cap Fund – Regular Plan | 9.85 | 17.92 | 18.28 |
| Nippon India Growth Fund | 10.68 | 17.65 | 13.27 |
| BSE Midcap 150 Index | 9.07 | 17.6 | 12.94 |
| Taurus Discovery (Midcap) Fund – Regular Plan | 9.44 | 17.59 | 15.3 |
| Tata Midcap Growth Fund – Regular Plan | 11.2 | 16.91 | 16.93 |
| HDFC Mid-Cap Opportunities Fund | 8.03 | 16.44 | 17.41 |
| L&T Midcap Fund | 5.39 | 16.33 | 16.15 |
| Franklin India Prima Fund | 8.86 | 15.79 | 17.27 |
| ICICI Prudential Midcap Fund | 6.98 | 15.28 | 15.07 |
| UTI Mid Cap Fund – Regular Plan | 8.68 | 15.27 | 17.2 |
| Baroda BNP Paribas Midcap Fund | 8.44 | 14.94 | 17.59 |
| Baroda Midcap Fund | 8.52 | 14.51 | 3.73 |
| Motilal Oswal Midcap 100 Exchange Traded Fund | 5.8 | 14.36 | 12.11 |
| SBI Magnum Midcap Fund | 9.36 | 13.97 | 17.37 |
| Sundaram Mid Cap Fund – Regular Plan | 3.56 | 13.25 | 14.98 |
| Quant Mid Cap Fund | 12.15 | 13.01 | 11.29 |
| Aditya Birla Sun Life Mid Cap Fund | 2.77 | 12.28 | 12.94 |
The bottom line is that most actively managed funds don’t outperform a simple broad-market ETFs or index funds like Nifty 50, Nifty Next 50 and Nifty Midcap 150. This is due to a combination of high costs, increasing market efficiency, and internal fund mandates to not deviate too much from the indices. Moreover, it’s tough to pick those funds & managers that beat their benchmarks. And even if you figure out how to pick a winning manager, there is very little persistence in performance. The best performing fund often ends up being the worst-performing fund over a period of time.
Today, it’s a no-brainer to look at index funds in the large-cap space. There’s increasing evidence that it’s the same in the mid-cap space as well. As for small-caps, these are severely risky and buy and hold may not be an optimal strategy, and active management both in a fund and in timing is needed.
Key takeaways from this chapter
- ETFs trade real-time on the stock exchanges and you can now set-up SIPs in ETFs to invest every month
- Blindly choosing an ETF is a bad idea. ETF due diligence before investing is extremely important
- ETF liquidity is an issue in India because our markets are still small and this needs to be kept in mind when buying and selling
- Always use limit orders and compare the market price of the ETF with the intraday or indicative NAV (iNAV) before buying and selling
- You can check the iNAV on the respective AMC’s website
- Sometimes the iNAVs on AMC sites may be wrong. If the difference between iNAV and the price is huge, it’s a red flag.
- Compare the ETF price with the underlying index or check with the AMC in cases where the ETF prices are way off from the iNAVs/NAVs
- Large-cap and mid-cap Index ETFs make a lot of sense vs actively managed large-cap and mid-cap index funds
Over the past few days I have been backtesting one quant strategy. It involves rotating money between Midcap 150 and Goldbees. Back test data from March 2007 to May 2026 shows very good risk adjusted return. I did this back test with Claude. Even though backtest is very good, I wanted to ask on the execution part. I have heard in India ETF\’s are not that great. Who knows the future? Might be the case that ETF\’s become illiquid (especially the midcap 150 etf). Wanted to hear your perspective on the execution. Main risk I feel is of liquidity only. Currently the average rupee volume (20 days) for mid150bees is 23 Cr, but it can be prone to dropping in future right? Wanted to know from someone experienced. Metrics of the strategy are- CAGR||29.1%; Sharpe||1.46; Max DD||24.4%; Calmar||1.19
Hey Rahul, yes, execution risk, slippages, and liquidity could be the main blockers for the strategy. Although, personally I feel this will improve over the years and not dry up. But this is just a personal opinion 🙂
I understand that there are risks involved. But I was seeking an answer beyond that. If I were to start that strategy today, will it be prudent decision for a moderate risk investor? I am looking at a commitment for next 20 years with this strategy.
Hey Rahul, 20 years is too long for any single trading strategy to work. Also, apart from these obvious risks, I cant seem to think of anything else.
when to buy or sell an etf?
When you think the time is good 🙂
On what basis the average price of the holdings is adjusted, specifically Gold ETFs and Silver ETFs. How frequent the average price will be adjusted. Whether NAV, expense ratio, tracking errors are impacting in the average holding price?
No, they dont impact the holding prices directly as the NAV that you see is after all charges. Also, do check this – https://support.zerodha.com/category/console/portfolio/console-holdings/articles/how-is-the-buy-average-calculated-in-q
Hi, Thanks for your response. The link you shared shows the normal way of calculating average price. This is fine to me. Can you show me the average holding cost for the following scenario. This is for SILVERIETF, On 13-Jan-2026, holding details are Qty = 584, avg.cost = 211.69, after selling 127 Qty at 273.3 on 14-Jan-2026, what may be the new holding average cost for the Qty of 457. Each time after selling, next trading day the holdings shows new average cost, I couldn\’t understand here.
Hmm, your average cost should not change. Is this with Zerodha or some other broker? Regardless, please speak to the support desk to understand why its changing. Ideally, the cost of purchase is determined based on the different prices at which you\’ve bought along with the quantity. It has nothing to do with selling.
Thanks.. It is happening in Zerodha. I have raised a ticket, let me check their response and calculation.
Sure, good luck 🙂
I got it somewhat.. Because of FIFO method, there is change in holding avg. cost. Last year(2025) there is no such FIFO method of calculation for Gold and Silver ETFs. From this month(January 2026) onwards I\’m seeing this change in holding avg. cost. Pls share if any notifications or circular on this. Thanks.
I\’m not fully glued in on this, request you to kindly speak to the support desk.
Can we short sell an etf
Only for the day.
While placing ETF SIPs in Zerodha, the recommended practice is to use Limit orders to avoid price gaps. But I have a question about how this works for SIPs that execute automatically through mandate/autopay.
Since I’m not manually setting the price at execution time, does Zerodha automatically adjust the limit price based on the live market price of the ETF when the SIP triggers? Or does it continue using the static price that was defined when the SIP was created?
Also, during SIP setup we specify the quantity of units (say 100 units of NiftyBees at ₹50 = ₹5000). What happens if, at the next SIP date, the ETF price has risen (e.g., to ₹80) and my mandate adds only ₹5000 to the trading account? Will Zerodha partially execute the order for the available amount, skip the SIP for that month, or throw an error?
Basically, how does Zerodha handle both the price and quantity adjustments automatically during SIP execution when Limit orders and fixed mandates are involved?
As Stock SIPs work using baskets, it is the users choice mainly regarding which order type they want the instrument to have in basket. But yes for the SIPs to work automatically without manual intervention, the user will need to select market order in the basket.
Sir, basically, after going through all the chapters, does it mean that doing SIPs in the Nifty BeeS ETF is better than doing SIPs in a large-cap mutual fund for a time horizon of, say, 10 years? Am I correct in understanding this?
I personally prefer passively managed funds vs active one, so Nifty Bees for me.
In that case, since you mentioned we can do SIPs in ETFs through Kite and also advised to always use limit orders when buying or selling ETFs, how should we manage this situation? Or should I not worry about it when it comes to major ETFs like Nifty BeES, Bank BeES, Gold BeES, etc.?
No, it always makes sense to use limit orders. No point placing a market order on an ETF.
Can I pledge my ETF\’s on Zerodha?
What is the cost of this pledge?
What percentage of the value of the ETFfunds be available?
Till what duration can the pledged amount be retained?
Yes, you can pledge ETFs with Zerodha to get collateral margin for trading, but only specific ETFs that are on Zerodha\’s approved securities list are eligible. Check this discussion – https://tradingqna.com/t/etf-for-pledging/169178
Here it\’s mentioned to compare ETF price with its underlying index. How to do that and can you explain with any example?
Meaning if you are looking at Nifty 50 ETF, then compare the ETF with Nifty 50 index.
There are 2 indications in ETF watch list of change in the price . What does that mean
Sorry, can you please share more context?
Thank you very much for very informative chapter and clear concepts.
My question, Since ETF are traded on stock exchange like stocks. Do the candlestick patterns, S and R and other things of technical analysis work equally for ETFs like for other equities?
Thank you for simplifying finance for everyone.
I am 30 yrs old starting my investing journey now and have the following questions for long term investing with goal of retirement.
1) I have a demat account , Is it better to invest in Index fund or ETF?
2) In ETF, I am planning to invest (100- {my age i.e 30 }= 70) i.e 70% in Equity and 30% in Gold.
In ETF’s Nippon India ETF Nifty50Bees vs UTI Nifty50 ETF? They both have the same tracking error, but the volume of Nippon India ETF is more. What would you suggest?
3) For Gold: UTI Gold bees.
Request your guidance if I am on the right path or if I need to make any changes.
4) What is your opinion on long term investing in ETF Nifty Realty?
1) I\’d say yes, because I personally follow this approach.
2) I cant really comment on fund specific details, but the approach feels fine.
3) I\’m biased to say Zeordha Gold ETF – https://www.zerodhafundhouse.com/etfs/zerodha-gold-etf-ZGOLD/ 😅, but please dont take my word for it, do check once with a qualified advisor
4) Not a fan
Thank you so much for your response. Huge fan of your articles and content. 🙌🏻
Thank you for making me financially literate and will always continue to follow your content 😊
Thanks so much Rishika! Happy learning 🙂
Hi Karthik,
For (1) I do not understand your response, for long term would you prefer Index ETF, of an Index Fund ?
If possible, do explain why the choice.
Just in an Index ETF, Hitesh.
Hi Karthik Rangappa,
I understood that ETF is a pooled investment vehicle that holds a basket of securities like stocks, bonds, and commodities and unlike mutual Fund, it trades on the stock exchanges.
The fund manager of a MF can alter the portfolio of the Fund anytime.
Can the fund manager of an ETF alter the portfolio of that ETF after it is listed on the exchange?
ETF follows an index, so unless the index changes, ETFs wont.
Hi Karthik,
It would be of immense help if you can share cheatsheet for ETF as you did for mutual funds.
Hmm, noted. Let me see what I can do. Thanks.
How to choose which index\’s ETF to invest in?
I mean there are so many index, and there are no place to actually compare two index broadly, in such case, what stratergy can we use to select an index and its ETF in turn?
Hmm, perhaps I will make a video on this. I personally prefer the UTI Nifty ETF 🙂
Hi Sir,
This is SASIKUMAR G am stuided ur option,futures, coins,commodities, personal finance.
Really Thanks for written this all books. I get good knowledge
Am nearly 3 yrs following you but I don\’t know why texted you.
Thank You Sir,
Sasikumar G.
Thanks for the kind words, Sasikumar. Happy learning 🙂
If there is a big difference between the last updated iNAV and the current market price, that’s a sign that there is something wrong. So, make sure to compare the ETF with the intraday chart of the underlying index of the ETF on Kite, and that will give you an indication if the price is correct.
I read this article and saw the price (165.00)& inav (146.22) price for Motilal Oswal Nasdaq 100 ETF. There is a big gap . Is it a arbitrage opportunity or incorrect/not latest price on zerodha/kite for the inav ?
Can you please help me on my confusion ?
Ah no, pls check this thread – https://x.com/ZerodhaVarsity/status/1875168185307308423
Hello
Section 16 of the Central Civil Services(Conducts) Restricts any government employee to trade in stock market, share, or other investment.
A government employee can invest in the market but not trade as an investment is considered to be for a longer duration of time whereas trading is for the short term and is deemed as speculative by the government.
Is monthly sip in nifty etf considered trading/allowed for a government employee? Or are funds better option for them?
Monthly SIP is not considered trading, it is considered as a long term investment.
These modules are really helpful and straightforward. Thanks alot!
Onto the next ones.
Glad to know that Mansi. Happy learning!
One of the most comprehensive precise material for ETF in Indian Market context. You have immensely helped many, like me in this topic. Thanks a Ton sir.
Thanks, glad you liked it. YOu can check this as well – https://www.youtube.com/watch?v=DeGzj9BJmcY
Hi
The above article attracted my attention as someone madeq a quote on a para from the above.
Quote
Perhaps, the best example of this would be the Motilal Oswal NASDAQ 100 (N100). During 2017-2018, the ETF was trading at a huge premium to the NAV. The premiums were as high as 20%+. This was probably because the market makers weren’t active in providing liquidity. Value Research allows you to compare the NAV and price, here’s a chart, notice the huge difference between the NAV and the price.
Someone could have taken advantage of this premium by going to Motilal AMC and asking them to create units, which happens at the NAV and sell them at the market price on the exchange. The difference would’ve been the profit.
Unquote
Is this the right example to give when someone new is reading about ETF. The NASDAQ 100 at a premium is a RBI issue where they put a restriction on limits. This forced the respective AMC not to issue new units. THIS IS A EXception than the rule. No one could take advantage of the premium by going to the AMC direct as the AMC would not be able to create the units. This is not a correct statement. People may think this is the norm for all ETF when in fact it is not.
Even now the same ETF is traded and those who own the ETF can sell at the price decided by the seller as the AMC cannot create new units to balance the market price to iNAV.
So please remove this from the article as this is not the norm.
This is no longer the norm, I think the author stated this to showcase the mispricing anomaly. Let me check though.
A few of the charts for example in section 29.7 – ETF liquidity, the graph comparing how Mirae vs LIC Nifty 50 ETF track the underlying index, there is no legend explaining which color line represents which ETF. This problem exists in a few other graphs in this module too.
Thanks to varsity for making me realise I was brainlessly investing in the highest return small cap funds and helping me create a portfolio taking into account my goals future plans.
Thanks Gaurav for pointing that out. Will try and fix. I hope you continue to enjoy learning on Varsity 🙂
Thanks for looking into it, Karthik. I got curious on how price is working for MON100, read this whole article, but still wondering 🙂
Ah ok. I hope its clear now. Else, please do feel free to post an elaborate query, will be happy to share whatever I know.
How does price for an NSE/BSE ETF tracking NASDAQ100 work?
\”If there’s a premium, the authorized participant (AP) will buy all the underlying securities that make up the ETF creation unit.\”
But the underlying securities are traded during NASDAQ working hours, but the ETF trades on NSE/BSE in their working hours. So how will AP buy underlying securities?
Aayush, good question. I\’m not sure about this, let me get back back.
1. why does commodity ETF\’s don\’t have tracking error?
2. as commodity ETF\’s don\’t have tracking error should we compare just on the basis of expense ratio?
3. should we also look at AUM wile comparing commodity ETF\’s
1) Ah, not sure about this. Need to research.
2) Yes, this is a good way. But are you are about this? No TE for commodity ETFs?
3) Yes, that helps.
I was looking at Silver ETFs and noticed that, on a day-to-day basis, they don’t always move in the same direction as silver prices. Even when they do move in the same direction, the magnitude of the movement isn’t the same. For example, on November 28th, when silver was down by only 0.5%, the ETFs dropped by 1.5-2%. Similarly, on November 29th, when silver rose by 0.7%, the ETFs increased by 1.5-2%. I have noticed this discrepancy on many occasions. There are even days when silver is up by 0.5%, but the ETFs are down by 0.5%.
Hmm, please do check the tracking error of these ETFs before you purchase.
Yes that clears it up, Thank You!
Happy learning 🙂
Hey Karthik,
I wanted to understand whether an ETF like Nippon Nifty Bees distributes dividends or reinvests them. It tracks the Nifty 50 TRI and therefore I assume it reinvests them and that is then reflected in the iNAV/NAV. I have been unable to find a concrete answer online and was hoping for some confirmation/clarity regarding this.
The document for Nifty Bees mentions the below lines.
\”Dividends (if any) are ASSUMED to be reinvested at the prevailing NAV.\”
\”For Exchange Traded Funds of Nippon India Mutual Fund, performance is provided at Scheme level using Dividend Reinvestment NAV’s, since there are no separate plan/option under such Schemes.\”
This has left me confused as to whether the AMC itself reinvests the dividends and then calculates the NAV, or it distributes the dividends and assumes reinvestment to present it\’s return performance. The two would be significantly different due to different taxation.
Thank You for your time and patience!
The AMCs receives the dividends and then reinvest at the prevailing NAV. Hope this helps.
Hey Karthik,
This was a truly helpful article informed me of the in-depth concepts involved! I\’m looking to invest passively over a time horizon of 15 to 20 years. ETFs seem to have lower expense ratios than Index Funds. I wanted to know, once all costs and factors are considered, which of the two is better from a cost perspective.
In the current markets, what size of AUM in your opinion would be large enough to not worry about liquidity in ETFs. I\’m asking this since I\’m considering investing in broader indices like Nifty 100 or Nifty 500, whose index funds/etfs are relatively newer and smaller compared to those of Nifty 50.
I understand that the weight of the lower companies would be very small, however I still want exposure to them in case some of them start doing well, which would get reflected in my portfolio since it\’s market cap weighted.
Thank You!
From costs perspective, its always the ETF. I dont have a backetested answer for you, but if I were to guess, something like 10K Cr AUM?
Sir/mam, is that possible we can do intraday or btst with etf like stocks
You can, but why? 🙂
Hi,
ETFs are traded based on the equity market, and gold ETFs are traded according to the commodity market. How is the price of an ETF adjusted?
Thanks
Sorry, can you please eloborate your query. What price adjustment are you referring to?
Hi,
I was looking at GoldBees today i.e. September 6th. Gold Bees is up by .18% while BSLGOLDETF is -.04%.
What could be the reason behind this?
There could be minor supply demand mismatch leading this.
DP charged are pain for small investors, investing in mutual funds is better as we do not have to bother about charges for SWPs
Sure 🙂
Can I pledge etf ? if yes then let me explain charges.
Example I have bough Rs. 1 Lakh etf and then I pledge it.
Assume 20% haicut. I can able to buy more etf of Rs. 800000 without paying any interest or I have to pay interest on 80000
Yes, ETFs can also be pledged. Based on the type of the ETF, it can either be part of cash or non-cash component.
Mainly Pledged collateral, the margin received from it, can\’t be used for Equity buying or even option buying. That margin can only be used for meeting margin obligation for FNO positions.
Hi,
Thanks for the wonderful lesson. I have 1 doubt.
I can see a contract in statements: \”ETFs trade real-time on the stock exchanges and you can now set-up SIPs in ETFs to invest every month.\”
AND
\”Always use limit orders and compare the market price of the ETF with the intraday or indicative NAV (iNAV) before buying and selling.\”
please help explain, is it better to do SIP or put into ETFs monthly by seeing the NAV as limit order.
I\’d suggest you invest regularly by seeing NAV, but the only drawback is that you may give yourself reasons why you should postpose the decison of doing SIP. So if you are doing this, then best to ensure discipline.
Practically are ETFs traded at a higher price than NAV in a rising market and at a discounted price in falling market?
If the above statement is true, does it make sense to buy Index funds than ETFs?
Well, both have its advantages and disadvantages. I personally prefer a fund at this point.
Why Zerodha not listing \”Mirae Asset Nifty EV & New Age Automotive ETF\” wherein I could see ICICI Securities provides the option to invest under NFO.
Mubarkar, I\’d suggest you please reach out to the support desk for this.
supar
Happy learning!
1. Zerodha nifty 100 etf aur 2. Zerodha nifty midcap 150 etf ka common application form bhejiye
There is no application. Its all online right?
Sir,
how to do SIP in ETF can you share the steps? and how to do SIP with Limit order in ETF?
Check this Ravi – https://support.zerodha.com/category/trading-and-markets/kite-web-and-mobile/articles/kite-sip-order
In the tracking error section you said \”An ETF or an index fund will have lower returns than the index because they have an expense ratio and an index doesn’t.\” But index returns don\’t include the bonus, dividends and splits that the ETF or a fund gets so returns of ETF or a fund should be greater than that of an index. Even if we take expense ratio in consideration then the excess return should compensate it and the net return should be equal to or greater than the index? Please share your thoughts on this!
The benchmark is the total return index, Chandan, which factors all these.
Iam new to the investment ecosystem and this article is really well put. thanks Bhuvan and Karthik
Glad to note that, happy learning Vignesh!
You cannot purchase any ETF units directly from the AMC. You can only purchase on exchange.
And always place a limit order. Never place a market order for ETFs since liquidity is low and you\’ll lose a lot of money with a market order
Thanks for clarifying that 🙂
Respected Karthik Rangappa,
I wanted to invest in Zerodha Nifty 1D Rate Liquid ETF, LIQUIDCASE. I wanted to create units by purchasing 5,000 units directly from Zerodh AMC. I have quarried about the process of creation of units through Ticket #20240229996153. Zerodha representative replied that creation of units is a theoretical concept, it has no practical application. It is not possible to purchase units from Zerodha AMC directly rather than from exchange. Please let me know the correct information.
Regards,
ANU SAHA
Hi Anu, I\’ll get this ticket checked. You will have to buy this via a broker only since its an exchange product.
Sir,
What is the best possible option for investing in Govt bonds for pledge to get margin ?
1) Buying it directly
2) Investing it through gilt mutual fund
3) Investing in through gilt etf
And Another question can I use the margin to create option spreads like iron condor and bull call spread with Zero funds?
I think SBGs are best way to gain exposure to gold and of course, you can pledge them for margins.
Hi Karthik,
When we buy ETFs through smallcase, What do you think my smallcase manager is going to put, a market order or a limit order.
Thanks,
Srinadh
I\’d suggest you redirect this question to the smallcase team, Srinadh.
Sir,
May i know how SIP works in zerodha for ETF? What are the external and internal charges applied on purchasing of etf using kite?
Check this – https://support.zerodha.com/category/trading-and-markets/kite-web-and-mobile/others/articles/kite-sip-order
Can we switch between 2 ETF\’s of Same AMC
Not sure, request you to please check with the AMC if they permit this.
Large-cap and mid-cap Index ETFs make a lot of sense vs actively managed large-cap and mid-cap index funds.
Can you please elaborate on this why ETF makes a lot more sense vs index funds?
Its the same returns with lesser cost, that\’s the big advantage, Mihir.
Great and very easy to understand way of explanations. Keep it up. ! Thanks
I am planning to invest a significant sum of amount in NIFTY 50 Index Fund and I am debating between Index Fund vs. NIFTYBEES. Given the investment amount is large and is to be kept over a horizon of 30+ years, NIFTYBEES are coming out to be significantly cheaper than Index Funds (BEES are 33% of total Index Fund expenses). This includes buying, holding, and selling charges.
1) Would you recommend Nippon India NIFTYBEES over Index Fund in this situation? What would you select as of 2024?
2) Do you still see issue of slippages in NIFTYBEES – Nippon NIFTY 50 ETF excluding COVID period?
3) As of Nov \’23, the AUM of NIFTY 50 BEES is INR ~17,000 CR while that of UTI NIFTY 50 Index Fund is INR ~13,000 CR. Does this indicate that NIFTY BEES are in preference over Index Funds lately and do not indicate issue of liquidity?
4) If you had to invest 1 CR in NIFTY 50, do you think doing SIP in NIFTYBEES via Zerodha over the period of next 12 months would be the right choice? How would you go about investing 1 CR in NIFTY 50?
1) Cant really advice funds, James. I\’d suggest you speak to a professional financial advisor once. But that said, opting for an index fund/bees is a good option given the 30+ time horizon
2) Not really
3) In general, bees are better as they are cheaper while offering the same risk profile.
4) Split that into equal parts are SIP it in your preferred fund or bees over 4-6 months. I\’d do that 🙂
What is the cost of etf compared to mutual funds? Are there any expense ratio in case of etfs?
Yes, but generally the expense ratio in an ETF is much lesser.
Nippon Silver ETF FoF Growth has an expense ratio of 0.27% and Nippon Silver ETF Growth has an expense ratio of 0.56%. Similar for other Silver ETF mutual funds. Doesn\’t that mean the mutual fund is better in terms of cost?
2. Also, do ETFs have both expense ratios & the normal equity charges like brokerage, GST etc or it\’s just expense ratio like mutual funds?
Thanks in advance!!
Yeah, it does 🙂
ETFs have other costs as well.
Hi how does the price of the etf is calculated, how it rise and low….is it depend on the shares that etf has? If the shares prices are rising the etf price will rise …is it work like that?
Thats right, the easiest way to think about it is like how an index works.
Thanks Karthik, just on the hedge again, if the fund in question is the N100 then would it still work?
Yeah, why not 🙂
How can I hedge a fund, say a sectoral fund, that i hold with its ETF, assuming the sector is in for a short to medium term downtrend and i intend to hold the fund long term. Thank you
You can always hedge it with a Nifty PUT option.
Hi Team,
Have a question regarding bulk buying in any ETF\’s…say like 5000(ETF Shares at once).
Do I have to buy at once if the share are available at one price point.
or directly buy and keep limit order.
or it can be only done through Iceberg order and keep limit.
Please suggest, thanks.
Always use limit order, irrespective of what you buy or sell.
Hi,
is ETF or index funds or FOF, which will get more returns.
please let me know risk on these 3 investment strategies and which is better
how much time to consider on these
I\’d suggest you consult a financial advisor for this 🙂
1. Where can I find the price of total return index (TRI) to compare the ETF price
2. How and when is expense ratio charged in the ETF\’s
1) NSE
2) Similar to how MFs charge
Do we have paper copy of this content. If not ,any other paper book with similar content ? Please suggest
Nope, no paper copy of this Ruchi.
how and when expense ratio is charged on ETFs. Does price of ETFs adjust daily for expense ratio at EOD
Yes, they do.
Hi,
Can you name a few nifty small cap etf that I can buy on Coin?
Thanka
I did not get below line:
Large-cap and mid-cap Index ETFs make a lot of sense vs actively managed large-cap and mid-cap index funds
Isn\’t index fund supposed to be tracking index and hence not actively managed? Am I missing anything?
It does, but since its an index fund and the job is only to mimic the index, you don\’t really need an active management of funds.
Sorry misspelled my name, its Mrinal 😅 ………..
And also one more query, i cannot place limit order on the ETFs in a Smallcase when I invest or do an SIP in it, so how do I go around that?
I stand corrected too, Mrinal 🙂
All your questions are specific to Smallcase, i\’d suggest you ask them these questions please 🙂
I have observed that most of the ETF\’s within smallcases are from Nippon. Can I assume the smallcase manager to have selected the ETF from the right AMC(Nippon in this case)? Can I assume this for all smallcases that have ETFs in them ?
Also since a manager manages that smallcase, those that comprise of ETFs (for example Equity and Gold Smallcase by Windmill Capital), does it make that Smallcase an index fund or is Smallcase a unique product in itself that cannot be categorised under any traditional fund? (Sorry if this question seems stupid)
Asking not just because this chapter is about ETFs but also cause smallcase comes under zerodha products. And I sort of blindly trust anything that has Zerodha in it 😬
Mirbal, these questions are best answered by Smallcase only as they would know the rational for selecting instruments 🙂
Where can we find the TRI index to compare with the ETF performance. Could only find NIFTY TRI index through google search. Could not find Nifty Pharma TRI index or NIFTY IT TRI index. Would it be possible to add the different TRI Index to zerodha. So we have use it for comparison to etf.
How to we know ETFs are not cheating on dividends.
Adding TRI will be tricky since this not traded on the exchange, like Nifty Futures. For other TRIs, you can check this – https://www.niftyindices.com/
Are ETF SIPs available on Zerodha?
Yeah, that\’s possible. Check this – https://support.zerodha.com/category/trading-and-markets/kite-web-and-mobile/articles/kite-sip-order
Yes
Kudos to the Varsity team for this amazingly detailed article on ETFs! 👏🏻
I have the below doubts when considering ETFs from a long-term (5+ yrs) perspective:
1. ETFs are dependent on ACTIVE market makers appointed by AMCs which act as a support system to provide liquidity for ETF units. AMCs don\’t advertise ETFs and their main focus is funds. There\’s also a very less expense ratio associated with ETFs compared to index funds. Are all of these indicators of unstable liquidity? AMCs and market makers have very less incentive to focus on ETFs. Can this be a problem if I consider monthly SIP into ETF for let\’s say 5 years only to face liquidity problems when I actually need the money (Since I am a passive investor, I might miss out on checking the trading volumes and other indicators which were clearly pointing to a degrading ETF)
2. In the long term (3+ or 5+ years), would it matter if my monthly SIP orders are executed as \”market orders\” instead of \”limit orders\”? If yes, this should be mentioned in the All Weather Investing smallcase info.
1) Yes and no. While AMCs make most of their money from active funds, they\’ve also realized that a lot of investors prefer passive funds and ETFs. In a sense, if an investor wants to sell active funds of an AMC and invest in passive funds, they\’d rather the investor invest in their own passive funds than some other AMC. So it\’s in their interest to ensure ETFs have good liquidity and low tracking errors. So, it\’s better to stick to ETFs that have a long track record, good volumes and low tracking. If you want to avoid worrying about liquidity, stick to index funds instead of ETFs.
2) Best use limit orders always.
What is liquidbees? how it works? n why its avg buy prices reduces?
Think of it as a liquid fund\’s ETFs. PLease do read through this chapter and you\’ll get an understanding 🙂
Why expense ratio of Motilal Oswal NASDAQ 100 ETF is higher (0.58) then
Motilal Oswal NASDAQ 100 FOF (0.1)?which one is good ?Thank you in advance sir.
Not sure why the TER is high for one fund compared to the other, you will have to check with them only. As fast as which one is better, please do check the earlier chapters on how to analyze funds.
Can I sell ETF today and buy it tomorrow?
What is the taxation for SBI Nifty50ETF?
Same as the taxation for equities.
Sir, Who can advise me correctly what comes to the investor and what goes to the AMC. The confusion is when you check the Profit and Loss account, Dividends is one of the item. At the same time, Under expenses, the entire expenses is accounted for. So I feel the net profit comes into the NAV. I wrote to SBI MF but they are silent. Sir, Dont you think a Unit holder should know what comprises the NAV. Everyone only talks about dividends which gets reinvested. Absolutely Lost.
Dividends belong to the unitholders in the same proportion as the investment. Btw, AMC is also a company which needs to generate a Profit. So the P&L you see, is from the company\’s P&L perspective. This I guess is very different from what the unit holders get. Unit holders get the NAV which is net of all expenses required to manage the fund.
Hi, I have used my username which I use in Tradingqna.
I do understand that dividends and corporate actions get reinvested and this is shown in NAV. I am invested in SBIETF Nifty 50. They publish their annual reports for each and every scheme. The Income, for this scheme is from the following: Dividends, Interest, Profit on sale of investment, profit on derivative transaction and the sum total is 1,117,382,452 as at 31.03.2021.
Does this mean, that after expenses, the net profit is reinvested and will be part of the NAV and we the unit holder of the ETF gets the benefit. Net income as a % of the AUM is 5.79%, it claims.
Experts only talk about dividends which gets reinvested, but the annual reports says, Dividends, Interest and profit and sale of investments is also being reinvested, after all expenses. Is my understanding correct or is it that only dividends gets reinvested and all other income goes to the AMC?. This is the burning question.
I had raised a query in TradingQna, but did not get a satisfactory reply. The link is
https://tradingqna.com/t/total-dividends-received-by-sbi-etf-nifty-50-from-their-underlying-companies/128547/2
It would be appreciated if you could please advise me on this.
Neha, I think this is at the aggregate AMC level. Broadly speaking, you will get the benefit minus the expense ratio part.
What if i miss my sip in etf die to shortage of funds
No, it won\’t. You will have to top it up at the next given opportunity.
What is generally the difference in expense ratio of an ETF and Index Fund, assuming both are tracking Nifty 50. Just trying to figure out which one is more cost effective. Thanks.
Have not checked the ratio, but ETF is lower.
Thanks for checking it. I really appreciate it. I checked the tracking error and it was reported to be the same for both.
Yes, that is one of the major reasons why such underperformance exists.
Thanks Karthik Rangappa for this whole series. It has helped me a lot to understand about personal finance. I\’ve a question regarding ETF. After studying the modules, I decided to invest in either index funds/ETFs for now.
I looked at the ICICI Prudential nifty 50 ETF and the same ICICI Prudential nifty 50 Index fund. Since both are offered by the same AMC and track the same index, I expected the returns to be around the same. However the ETF has a CAGR for 1 year at 6.8% and the index fund has a CAGR for 1 year at 7.2%. The expense ratio for the ETF is actually lesser too.
I understand CAGR for 1 year is the same as absolute returns, but i want to understand the reason for the difference in return.
I need to check this and figure why. But if I were to guess, this is because of the of the tracking error of the ETF. Lack of liquidity, too, can be an added factor. But as I mentioned, I need to double-check this.
for a lazy investor like me passive funds are increasingly becoming my go to way of investing. I have invested in multiple passive funds of abslmf http://bit.ly/3BqXACf
Nice. But why multiple?
Can someone explain the cost involved in zerodha when investing in etfs like nifty 50
No brokerage for investments, but you can check here list of all other charges – https://zerodha.com/charges/#tab-equities
WHAT HAPPENS TO THE DIVIDENDS OF THE UNDERLYING STOCKS OF ETF ?
DOES UNIT HOLDER RECEIVE IT OR IT GET REINVESTED IN ETF ?
Gets reinvested in ETF.
Not etf
CAN SOME ONE WHO IS VERY WELL VERSED WITH INDEX TRADED ETFs CAN LIST MOST LIQUID ETFs SUITABLE FOR HOLDING AND SWING TRADING. Awaiting for the reply
Nice explanations but I found it to be a little difficult to follow. I think Kartik makes explanations easier. Some parts were sort of vague. But overall had a good idea about ETF\’s.
I use KITE on web. I want to know full form of ETFs shown on ZERODA kite, so that I can select correct fund. Where can I get a list of MFs and ETFs with shortform/Code and Full name.
ETF = Exchange-traded funds.
I am Interested
ETF brokrage charges? 1 shear
No brokerage.
Thanks for such a comprehensive and in depth article team!
Karthik, in one of the comments you have given a link for the charges applicable for ETF transactions. Few questions:
1) Do we have to look under the \’Equity delivery\’ column for ETF charges?
2) If yes, do ALL the listed charges apply i.e. STT, stamp charges etc.?
3) Also, is taxation treatment for ETF same as for listed equity shares?
1) & 2) I need do some research. I think ETFs, like MFs don\’t really have to pay STT, but let me confirm.
3) Yes, they are taxed as equity.
How to sell the icicib2inv held in my demat account, not shown in my stock list ,but shown in details of securities held by me.
Great experience learning with varsity
Great job!!
well donee
Happy learning!
How niftybees etf opening prices were dicided when there is NO AMO ORDER ALLOWED AND NO PRE OPENING ORDERS ACCEPTED?….🔥🔥🔥
There\’s no pre-open session for ETFs. The open price is calculated similarly to F&O. The price of the first trade will be the open price.
What would be the fees of buying and selling, like do amc charge entry load, exit load, expenses, etc??
Please share with example..
You can check this – https://zerodha.com/charges/#tab-equities
After reading this article, it seems little hectic to invest in ETFs so simply I Just want to know that if I want to invest in nifty 50, nifty next 50 , midcap 150 index and corporate & PSU banks debt for over 15-20 years period. What should I go for either sip in index fund or in passive etfs to minimise cost and taxes after redemption. Please suggest me.
I\’d suggest either, but personally, I go with Index funds.
Just to clarify. I downloaded the historical NAVs for Niftybees ETF from Nippon AMC and the NAV for 15/2/21 is 163.6023. This is indeed much closer to the price 163.93 for that day. Just wondering if you would know where did the value 1886.97 as reported by Value Research come from. It kind of threw me off for a while, but given that the graphs for NAV and price are closely tracking each other, I wonder if this could be a glitch in the Value Research chart. Will appreciate your thoughts on the same.
Btw, you truly have done an amazing job at explaining stock and MF concepts here. For a complete newbie like me, this is the resource that I have kept coming back to again and again.
Its not really a glitch. Maybe you are expecting the NAV and price to be very similar, but that\’s not always the case. As long as the ETF price tracks the NAV closely, its fine.
In the comparison chart that you have shown for NiftyBeEs ETF and how it has tracked it’s NAV, I am confused about the NAV. For ex, the NAV is 1886.97 in the chart you have given, while the price is 163.93 as of 15/2/21. Where is this NAV value picked up from? I checked the Nippon AMC website to look up the NAV, but doesn\’t like that\’s the place from where the NAV is taken.
This was picked from Value research if I\’m not wrong.
Can you provide some concrete reasons on why should we use limit orders specifically for buying/selling ETFs? Most of reasons that I have read just point out normal differences between limit and market orders and do not help in anything regarding ETF orders.
Its just that with limit order you will know the specific price at which you are buying the ETFs. So yeah, it is for the normal reasons why you place limit order to buy ETFs.
this is the best, most comprehensive, most detailed, most insightful tutorial I have read on ETFs. eg. author has taken extra effort to highlight the importance of using \”limit price\” instead of \”market price\”, summarized comparisons of performance across classes, distilled essence. excellent job by the author, much thanks for the help and hand-holding for a newbie like myself.
Happy reading 🙂
Thank you Karthik for your quick reply. Indeed , pls check with team and let all of us know about this SIP route for ETF.
I think at present only realistic option as below for a monthly SIP
1. Each month on the preferred date , login to kite manually,
2. Go to the respective amc web site to check iNAV
3. Place a limit order with iNAV value in kite
4. Wait for some time to see if order is getting executed or not.
5. If not , because market price changed , go back to amc web site again to see the iNAV again and modify the limit order in kite with new INAV
Indeed , it is too hectic for the people prefer SIP route for automatic investment .. it is even more hectic than buying normal share.
Yes, that sounds right. But let me check with the team if there is an alternative.
Hi Karthik, Any update on the above issue?
In this Chapter, we learnt that SIP is possible in ETF but author also suggested to use Limit order always. Even if we can use Limit Order in SIP technically, How is it possible practically for anyone to guess the price for next one year for a monthly SIP?
Since in ETF, we cannot make fixed amount SIP just line mutual fund, we need to mention fixed unit
Since in ETF, it is always advisable to use limit order , we must use fixed price
So, these two conditions above making the SIP route for ETF impractical. Is it correct understanding ? or Am I missing something ?
There is no guessing required. Every time you buy (monthly), place a limit order. But yeah, I get your point. Let me check with the team.
I have applied for motilal oswal s&p 500 low volatility mutual fund in etf. 4 units are credited. Does again next month 4 units or xxxxx units are credited again? Like a sip?
It depends on what you have bought and for how much you have bought.
If I start SIP for 10k in ETFs for eg- 30 years, would there be enough liquidity while disposing the SIP
Tricky question, but I\’d say yes. You can sell it back to the AMC directly.
Kya ETF me BTST kar sakte hai ?
Which ETF should be bought looking at the current situation and how to check the i nav of the ETF ?
Viral, not sure about which. You can check the iNAV on the AMC\’s website itself.
Are all ETFs available in zerodha kite? Asking bcoz I couldn\’t find any result by searching ICICI PRU ALPHA LOW VOL 30 ETF in my kite watchlist. If one has to consider this etf how can one do? Also any comments how to decide whether the benchmark NIFTY ALPHA LOW VOL 30 ETF is better or the ICICI PRU one? Thanks.
Deb, ICICI Pru Alpha symbol is – ICICIALPLV.
I think the easiest check is to compare the stocks and the respective weightage 🙂
I have noticed that usually when market opens, the ETFs open at a higher price and then just keep dropping..all this happens in just couple of seconds.. however everything happens so quickly that orders do not get execute. Do we know why this happens?
Not sure, but I guess its about investors trying to exit at higher prices at the start of the day matching with a market order and then the market course-correcting or something like that.
if i want to buy small cap etf of axis how to search? zerodha doesnt show it
Jeet, you can type axis in your market watch and select the ETF from the drop-down display.
I want to invest 10000 per month in index. But I am not sure whether to go for index MF (ex. having 0.2% as expense ratio ) or Index ETF ( ex. Having 0.06% as expense ratio ). Because, even if expense ratio is less in ETF, it will cost me additional charges delivery,etc charges n taxes every month.
The only problem with ETF (as of now) is the slippages. Hopefully, this will improve over time. For this reason, I personally do index funds.
A great article on ETFs. Solved all my queries.
Happy learning!
Sir, thank you for this module! 1 doubt. In the summary\’s last point – \”Large-cap and mid-cap Index ETFs make a lot of sense vs actively managed large-cap and mid-cap index funds\”…. How can there be \’actively managed\’ large cap and mid cap index funds? Index funds are passive by nature right?
I must have meant large-cap funds, actively managed is a typo 🙂
ETFs vs Index Funds – which one is better for investors in terms of cost (fees) in the long run, if redemption/ selling is done, say, 4-5 times over a period of 10 years? Since brokerage is 0 in zarodha, are ETFs more cost effective even if we consider DP charges, taxes, etc?
ETFs, Narayan. But only after the liquidity improves.
Do the expense charges, we have to pay for intraday trade also ?
If yes, how much it will be ?
Dont think you can do an intraday trade with ETFs.
When the ETF units will be reflected in demat if subscribed through NFO? I have applied for kotak nifty alpha ETF and still could not see then in my demat
Not more than 15 days, Ram.
Hi. Very nice and informative article. Can you please elaborate on whether the expemse ratio of an ETF works exactly like that of the index fund or other mutual funds? ie as yearly percentage of AUM
It does, but the expense ratio is lesser compared to a regular mutual fund.
Pls help me with script name for Axis heath care etf
Check this – https://www.nseindia.com/get-quotes/equity?symbol=AXISHCETF
Can we say that Index ETFS for example Nifty ETF is a kind of future contract of nifty,except the expiration and price… Because nifty ETF will track the movements of nifty as it is comprising of stock in the same proportion and it will be traded just like future contracts which will decided the NAV.
Not really, Gaurav. Think of the ETFs as Index funds. These ETFs have no expiry.
Hi, I don\’t have clarity about the Expense Ratio of ETFs. At what step in the process do the AMCs take their cut?
On a daily basis, just like in the other types of funds.
How do i identify Expense ratio of any ( all) etf, mutual fund has better coverage online and by other websites but seems all AMC are not transparent on their Expense ratio they charge for their ETF
They are mandated to be transparent, Mayank. Not sure which AMC you are referring to here.
I see your point about the volume of comments. Do you think it would be viable to move Varsity\’s comment section to TradingQna for discussions? Or link Zerodha accounts with Varsity so that a user can track their own comments and replies, apart from learning journey?
We have evaluated that as well, there were few technical challenges with it. Let me revisit this with the team again. Thanks.
Thanks for the fantastic learning, as usual, Karthik, Bhuvan and Team Zerodha and Varsity!
I have two questions and a suggestion.
Question – Would a passive fund tracking an index like get rebalanced when the index itself undergoes changes? Are actively managed funds/Mutual Funds superior to passive Funds from a taxation on rebalancing perspective?
Suggestion – Can commenters get an email notification when their comments are replied to? It becomes quite challenging to locate one\’s comments after it moves down the \’latest\’ list on the homepage.
Thanks, glad you liked the content.
1) Yes, it does. Taxation wise, they are all the same. Fee wise, passive fund is cheaper.
2) Not possible, there are so many comments that flow in that it gets spammy at some point 🙂
Is investing in an NFO for ETF a good choice
Depends on your overall portfolio situation. But generally, it\’s good to avoid.
i wanted to know as i am a beginner at what price should we place the limit order.How much difference should be between the inav and the price for which we put the limit order?
Not more than 1 t 1.5%.
How do we get to know the lot size?
Its available here (below the security name) – https://zerodha.com/margin-calculator/Futures/
Hi @Karthik, thanks for this detailed chapter.
What are your thoughts on the pros and cons of the Mirae Asset Financial Services ETF NFO that closes on 29th July\’21 ?
Best Regards,
Siddhesh
I\’ve not really looked into that, Siddhesh.
Hello Team, it would be nice to have this module made available on the Varsity mobile app!
We are working on it, will be done soon.
What happens to corporate actions like share splits, bonus shares ?
Can ETF\’s be bought and sold same day (CNC) ?
I dont think so.
How is a new ETF introduced into the market, Does it also have something like an IPO?
Also if I buy a mutual fund unit from an AMC will I be able to sell it on the market as an ETF?
Yes, usually it comes in via a new etf offer, just like an IPO. If you buy MF online, then you can sell it online
Can we trade ETF\’s intraday like we trade equity/futures/options intraday ?
Yes, you can. But why ETFs for intrday 🙂
Hi Karthik, Thanks for reply.
This article gives a strong sense and feeling that long term investment in ETF is ideal for wealth generation.
Going by that I have created a basket in kite app with Niftybees, JuniorBees, NETFMID150 & MN100 with 30,40,15,15 split respectively.
As recommended, I went on to execute the basket with limit order ( limit price been close to iNAV).By the time it got placed, price moved up slightly and non of the order got executed. So I went on to manually modify each order with best possible price as per market depth for getting units
1. Now since I want to start SIP of the basket every month, how can we still place limit order so that SIPs are executed and the price we get is also best at that timetime or close to iNAV?
2. Any indicators Which can be used to asses the market next day so that we can place limit order one day before SIP execution.
3. Can we see iNAV along side other prices in zerodha kite app.
1) Unfortunately Equity SIPs are market orders, cant really have a limit since it is not possible. Its best you place this manually, meanwhile I\’ll check what else can be done for this
2) Not that I know about 🙂
3) Not possible since this is not available at the exchange.
Easily one of the best articles explaining ETFs in India. Kudos Zerodha and Varsity team. Thank you for clearing so many doubts.
Thanks. Credit goes to my colleague for this!
Hi Karthik,
By far it\’s one of the complete and well organized article on ETFs. Kudos for your effort.
1. As you mentioned that to create liquidity, Market makers buy at the bid (buy price) and sell at the offer (sell price).Since Bid price Conventionally is lower than offer price, the difference is the profit they make.
In this process, from whom they buy and to whom they sell ? If they buy from AMC, it will be done at NAV price, sellers in secondary market won\’t sell below Offer price and buyers in secondary market won\’t but above bid price…. Hence the question.
2. Limit order during buy…. Does this means that Limit order should always be placed at current prevailing or below iNAV?.
3. I feel investing for 7+ years in combination of Large cap, Mid cap and foreign index ETFs in certain proportion should be good. Owing to liquidity, should we keep Mid cap and N100 ETF out of portfolio?
4. Is it possible in zerodha to place SIP order of already created ETFs basket such that the order would get triggered only when the market price is equal or near to iNAV (limit price).
1) They buy it from market participants. So if you place a buy or sell, on the other side is the market maker filling your order
2) It can be in and around the iNAV
3) You can consider a next 50 fund instead, not a bad alternative
4) YOu can use an equity SIP here – https://support.zerodha.com/category/trading-and-markets/kite-web-and-mobile/articles/kite-sip-order
Sir,
I have read the personal finance chapter. my question is if I want to invest money like there are many schemes like those
which have been explained in the personal finance chapter like MF, Bonds, Debt, ETF, SIP, Index, and Arbitrage funds. etc.
can I have a in a nutshell like a pdf or a image which specifies and explains which is better according to the different personal requirements like low risk, high risk, long term, short term etc. Instead of me looking and considering into all scenarios just for a common layman. you have posted one image in this chapter but that specifies only equity and debt. Thanks I would be pleased if you could help
I think there is a summary sheet in MF portfolio page. PLease take a look at that.
Any guiding material on creating scanners and also creating strategies for trading liquid ETFs at NSE using Zerodha streak etc which can give insights similar to stock trading.
Not for now. But will pass this as feedback.
*15.93 /-
Great article. A question on charges – If ETFs are traded like stocks on exchange, does it mean DP charges are applicable on selling ETFs ? It is 15.3 /- currently for selling stocks.
Thats right, Sachin.
BTST IS POSSIBLE IN BANKBEES OR NIFTYBEES PLZ REPLY
Yeah, no problem.
Sorry, but I really don\’t get the part where you have mentioned, all dividends in an ETF are reinvested and this adds to the NAV of the ETF. My question is NAV of TRI or PRI? Coz per PRI NAV is what we buy from secondary market. I apologize for being so derailed oriented. Coz every now n then i see multiple companies announcing their Dividend payout, but still the PRI NAV doesn\’t go up even a paisa. I really want to talk to someone who is well versed in this area. Please help.
Rahul,
1) When the portfolio companies of ETF pay dividends, the dividends are received by the AMC (ETF company)
2) Dividends received goes back to the funds
3) NAV tracks TRI
4) Dividend payout or PRI increasing is not related.
Hi Karthik,
Thanks for your reply. You have provided me info on TRI and Tracking error, and I have got it. Sorry, but you haven\’t answered my larger question though. That is how do I benefit from the dividends \’actually\’ received by these ETFs? Let\’s assume, I purchased 1 unit at Rs.50 per PRI and at that moment TRI was also Rs.50. Then 1 year later, PRI has increased by 10% to Rs.55 which follows/tracks the underlying benchmark Index, which has also increased by 10% at that time; whereas TRI would have grown by 20% to Rs.60 due to Dividend received/reinvestment. So how do we retail investors get the share of that Rs.5 seen in TRI. Request you to either explain in detail or please share a reference website or document that clearly explains this subject. Appreciate your patience, since this is really important for me.
Thanks
Rahul V M
Rahul, Since all ETFs have to track the total returns indices, all dividends in an ETF are reinvested and this adds to the NAV of the ETF.
Hi Kulsum,
Is there a way I can track ETF to TRI? and is it available on Tradingview? And how will retail investors benefit when the index data you see on Kite is PRI and based on which we invest? And if TRI keeps going up and up due to Dividend reinvestment how and when do we see the increase in our NAV or how do we benefit? or TRI is notional?
I also want to know where can I get the tracking error data?
Apologies for so many question marks. I hope you will answer to all my questions one by one. Thanks!
TRI is not notional, its just that the exchange does not stream it, which means no broker can. You can download the historical and daily data though from the exchange site. Tracking error data is published by websites like Morningstar and value research. I guess the AMC too publishes this.
Hi,
If I do pick up an FOF which invests in ETF, will the liquidity risk goes away? and will I be charged a dual TER (one from the MF and the other from the ETF)?
It reduces. No dual TER.
As you have mentioned creation of SIP for ETF is Possible with Zerodha, please let me know how to set this up in Kite / Coin?
PLease check this – https://support.zerodha.com/category/trading-and-markets/kite-web-and-mobile/articles/kite-sip-order
Why is there difference in closing price and opening price in ETF\’s. Same like stocks. do ETFs has pre market session?. If yes, what are its timings?
The overnight demand-supply makes a difference in prices.
We can check Total Returns Index to see the dividend adjusted value of an Index. How can I do the same thing for a single stock? Like I want to track the past 10 years performance of TCS keeping in consideration its dividends are re-invested, then how can I do so? Is there any website where we can see this chart?
Unfortunately, that\’s not available Vidit or at least I\’m not sure about where this is available.
Hey, looking at a horizon of 15+ years.
I guess index is the way to go.
Should I be looking at index funds or etf? Considering ETFs have a lower expense ratio.
Also what allocation would you suggest for nifty50, next50 and midcap?
I\’d suggest funds for now.
Excellent flow of content. Very useful
Thanks, How do i check the slippage .Can you explain a bit.
Basically the amount of money you\’d lose if you were to buy and sell the ETF at market. The higher the amount you lose, the higher is the slippage.
\”Always use limit orders and compare the market price of the ETF with the intraday or indicative NAV (iNAV) before buying and selling \”
I am using smallcase All weather investing for my long term goals, this smallcase always BUY/SELL by Market order only and it has 4 ETFS in the basket. Since i do not have control on Market orders, Is it advisable to stay invested with this smallcase.
I think smallcase has mostly liquid ETFs, should be ok. Maybe you can check how much you lose by slippage.
Best material on ETFs for Indian context. One doubt sir, in the market maker section, it is said that market makers buy at bid and sell at ask. How it\’s done.
They keep placing matching orders, Aniket. So they are constantly buying and selling.
Almost all the ETFs can be pledged. You can check the list of securities and the haircut here : https://docs.google.com/spreadsheets/d/1vRI4NKpJ-3mnOWxUhSRMSQD5txy8QNumzSQrdfGKyL0/edit?usp=drivesdk
I have 2 questions:
1) Suppose the LTP of ETF/Equity is 300 and the offer price is 305. And if at that time I place buy request in open market without keeping any limit price then will my order execute at 300 or 304?
2) Can I keep ETFs for more than one day after I purchase it?
1) 305
2) Yes, you can.
Is it ok to buy when price of ETF is 1 or 2 rupees higher than current iNAV? I checked always current price is always 1 or 2 rupees higher than iNAV.
If you have a long term play, then it should be ok, Naresh.
\”Large-cap and mid-cap Index ETFs make a lot of sense vs actively managed large-cap and mid-cap index funds\”. Karthik Can you explain this?
Sure, which part is confusing you Abhishek?
A perfect must read before ETF investing. Thanks a lot.
Happy reading!
I am having some units of SBI Nifty50 ETF for which dividend was credited to my bank account recently. This somewhere contradicts with the claim that AMCs reinvest dividends. How to find whether AMC reinvests the dividends or not? Also, what are the implications from taxation point of view in both the cases of dividend credit and reinvestment? Could you please clear the doubt.
Hey Devendra, it\’s weird because the TRI index includes dividends which means an ETF has to reinvest the dividends. But according to reports, SBI issued these dividends to help EPFO
Is the pdf for personal finance part -1 module available?
Hopefully this week.
सर आपने बहुत अच्छी जानकारी दी है। ईटीएफ मार्केट ऑर्डर में बाय करने की गलती इससे पहले मैंने की है। लेकिन ऐसी गलती आगे मैं कभी नहीं करूंगा। जब भी मुझे ईटीएफ खरीदना होगा तब मैं सबसे पहले ईटीएफ की रियल टाइम nav की जांच कर लूंगा और उसके बाद ही लिमिट ऑर्डर लगाकर परचेज करूंगा,धन्यवाद।
आपका अभिनन्दन है। 🙂
In performance comparision table,BSE Midcap 150 TRI Index can give a better picture than simple BSE Midcap 150 Price Index.
Yeah, TRI is always better.
Hi
I have been investing in Motilal Oswal Nasdaq 100 Fund of Fund since few years.
Will it be wise to switch for Motilal Oswal Nasdaq 100 ETF, since there is some expense ratio(although quite low for direct plan .1%) and I am looking this as a 10 year investment.
Also, as you mentioned the price of this ETF trade at premium, does Motilal Oswal purchase this ETF at base price since it might be trading this in large quantities. Do let know your views…….
I\’d suggest you stick to FOF, way easier and you don\’t have to worry about anything else.
How do you I mean at what price you execute my SIP for ETFs. Do you directly create units with AMC
No, all ETF transactions are on the exchange directly.
I received dividend amout in my bank ac today.
Hi,
I had invested in SBI Nifty 50 ETF and have just received information that dividend is declared and it says \”the NAV of the scheme would fall to the extant of payout and statuary levy\”. Doesn\’t it contradicts the above statement of kulsum in which she said that dividend would be reinvested and NAV would be added ?
Not really, dividends are reinvested.
Hey Vaibhav, it\’s weird because the TRI index includes dividends which means an ETF has to reinvest the dividends. But according to reports, SBI issued these dividends to help EPFO
Sir, the download as PDF option on the most of the new chapters is unavailable.
Could you check on that?
Thank you
Its not updated yet as the module is not complete.
Hi,
I wanted to understand what is the general investment horizon one should look at while investing in ETF\’s.
Reading all of your Personal finance module gave me a very deep understanding of how to select MFs. I have created my portfolio of debt and equity funds but now unable to understand if ETFs should be a part of it, if yes, what advantages I have while investing in ETFs over regular equity index funds?
Saurabh, regardless of which equity-oriented instrument – ETFs or funds, you need to have a long term horizon. So I\’d suggest you look at something like 5,8, or even 10+ years of investment horizons when evaluating ETFs.
The tracking issue mentioned in this chapter can be seen by entering this in tradingview
=N100/(NDX*USDINR)
Sure, checking this.
I\’d like to share my personal way of checking how well an ETF is tracking it\’s index. Try entering the following 2 examples tradingview:
=NSE:NIFTYBEES/NSE:NIFTY
=NSE:BANKBEES/NSE:BANKNIFTY
This plots how well an ETF is tracking it\’s index. An ideal ETF in this regard would give a flat line.
Let me know your thoughts on this approach. 🙂
That works too, more of a visual approximation.
Have a \’NEXT\’ button after each chapter.
We do right?
Is Collateral from Bharat bond ETF considered as cash component in zerodha?
Keshav, do check this thread – https://tradingqna.com/t/do-zerodha-accept-bharat-bond-as-cash-component-is-if-pledged-for-margin/80289/2?u=bhuvan
How dividends, bonus, stocksplits and rights issue impact the ETF price
The additional units are added back to the pool.
Is GOLDBEES are good for long term investment?
Yes, if you believe in the long term prospects of Gold 🙂
Why my query is not answered?
Keshav, you can check the entire list here – https://docs.google.com/spreadsheets/d/1vRI4NKpJ-3mnOWxUhSRMSQD5txy8QNumzSQrdfGKyL0/edit?usp=sharing
Excellent write up. I have always wondered why there no ETFs in mid and small cap space. Found the answer here. Thank u so much.
Good luck and happy reading!
Hi Karthik,
Thanks for explaining every fund in detail and sharing your expertise cum experience.
Wanted to know if there be would be a chapter on REITs as well.
We dont have a chapter on REIT yet, will try and upload a chapter sometime on this.
How realtime NAV,s of the ETF are calculated? Is it based on the prices of the stocks which contains in the ETF portfolio, or just like a stock suply and demad basis.?
Yes, it is based on the underlying stock prices.
Which are the ETF I can pledge in zerodha? And what\’s the percentage of hair cut?
What happens with the dividend and how to check the impact of dividend on pricing?? Any comments..
Shubham, Since all ETFs have to track the total returns indices, all dividends in an ETF are reinvested and this adds to the NAV of the ETF.
Sir this chapter is easily the most comprehensive material on ETFs available in Indian context. It cleared up lots of doubts I had. Thanks a lot sir.
What is the next chapter going to be on sir?
Thanks, Sundeep. The next chapter is on Macro Economics (basics).
While investing in ETF , How dividend is treated in Nifty 50 , whether dividend is distributed to retailers or AMC kept with them.
Where can v track such things ?
Thanks
Ah, added a note Alpesh. Since all ETFs have to track the total returns indices, all dividends in an ETF are reinvested and this adds to the NAV of the ETF.
Is there any process to find good ETF & starting investment
This module and this chapter, Harsh 🙂