24.1 – Recap
I’d like you to take a moment and reflect upon the last 23 chapters in this module. I want you to recap the things we have discussed so far mentally.
In a nutshell, here is what we have discussed –
-
- Identified that investment is a key part of personal finance
- Identified various assets which can help us move closer to our retirement goals or any other financial goals
- Figured that Mutual funds are the primary financial instrument which will help us plan our financial goals better
- After establishing the above, we figured that it is important to focus and learn more about mutual funds
- We started by understanding what a mutual fund is followed by the importance of the mutual fact sheet
- We identified the most popular categories of mutual funds and discussed the same
- In the process, we explored various types of funds across both equity and debt categories
- Discussed the Index fund
- Most recently, we discussed the various performance and risk attributes of mutual funds.
We are now at an interesting junction as we steer our way to the final leg of this module, i.e. to figure ways to build mutual fund portfolios to help us achieve various financial goals in our lives.
If you think about it, building a mutual fund portfolio has three parts to it –
-
- Identify a financial goal (it can be any) and translate that financial goal in terms of time and corpus. For example here is a financial goal – 40 lakh (in today’s terms) for my 10-year-old kid’s Post-graduation degree in the US. If you break this down, it translates to a requirement of Rs.40L (adjusted to inflation) in 15 years
- Identification of funds to help you achieve the financial goal
- Periodic review and maintenance of the portfolio.
In my view, the first and third point is fairly easy. It’s the 2nd point, i.e. the actual act of building a portfolio is the tricky bit. If you isolate just the 2nd point, then you will realize that it is made up of three things –
-
- Analyze funds, pick the right ones and avoid investing in the bad ones
- Figure the portfolio composition – just equity, just debt, a mix of equity and debt etc.
- Once the portfolio is identified, figure how much to invest across each of these funds
Again, in my view, one of the key element is the fund analysis. You need to get this right and ensure that you have partnered with the right fund house and the right fund to help you achieve the financial goal you’ve set aside.
In this chapter, we will discuss a simple technique using which you can analyze an equity mutual fund. Think of this as a template; you can apply the same to all equity funds. Of course, there is no right or wrong technique; what I discuss below is from my own experience. You can develop your template as you gain more experience with mutual fund investing.
So let us get started.
24.2 – Hygiene check

I’ll pick an Equity mutual fund and set out the process to analyze the fund. As I mentioned, there is no guided path to analyze a mutual fund. You need to develop your method to do that. While few investors like to focus heavily on the fund manager and the quality of stocks the fund manager has picked, others like to look at only the historical returns.
I like to keep the process simple and stick to things that I’m most concerned about, i.e. the fund’s ability to manage risk and generate returns.
Alright, so let us get started on fund analysis.
For the sake of this discussion, I’ve picked the Kotak Standard Multi-Cap Fund (Growth, Regular). Do not treat this as a recommendation of any sort 😊
Remember, direct funds are relatively new and may not have the necessary historical information; hence we are looking at the regular funds.
The first step is to run a few basic hygiene checks, which includes some of the good to know information about the fund. Usually, this information is available in the fund’s fact sheet. The first thing to note is ‘about the fund itself’, take a look at the snapshot below –

From the note above, I develop an orientation for this fund –
-
- It’s a multi-cap fund, which means the fund can invest across various categorization.
- Since it’s a multi-cap fund, I’d expect the fund benchmark’s itself against a diversified index, which means Nifty 50 TRI may not be its benchmark
- I look at the fund’s inception date, in this case, its 11th Sept 2009, so not a very old fund, but old enough to give me ten years of history.
- The fund manager has remained the same, which is fine. If you belong to the fund manager cult, then you can dig deeper into who the fund manager is, his background, credentials, track record etc. I prefer to skip that bit.
I dig further in the fact sheet and get other important information about the fund –
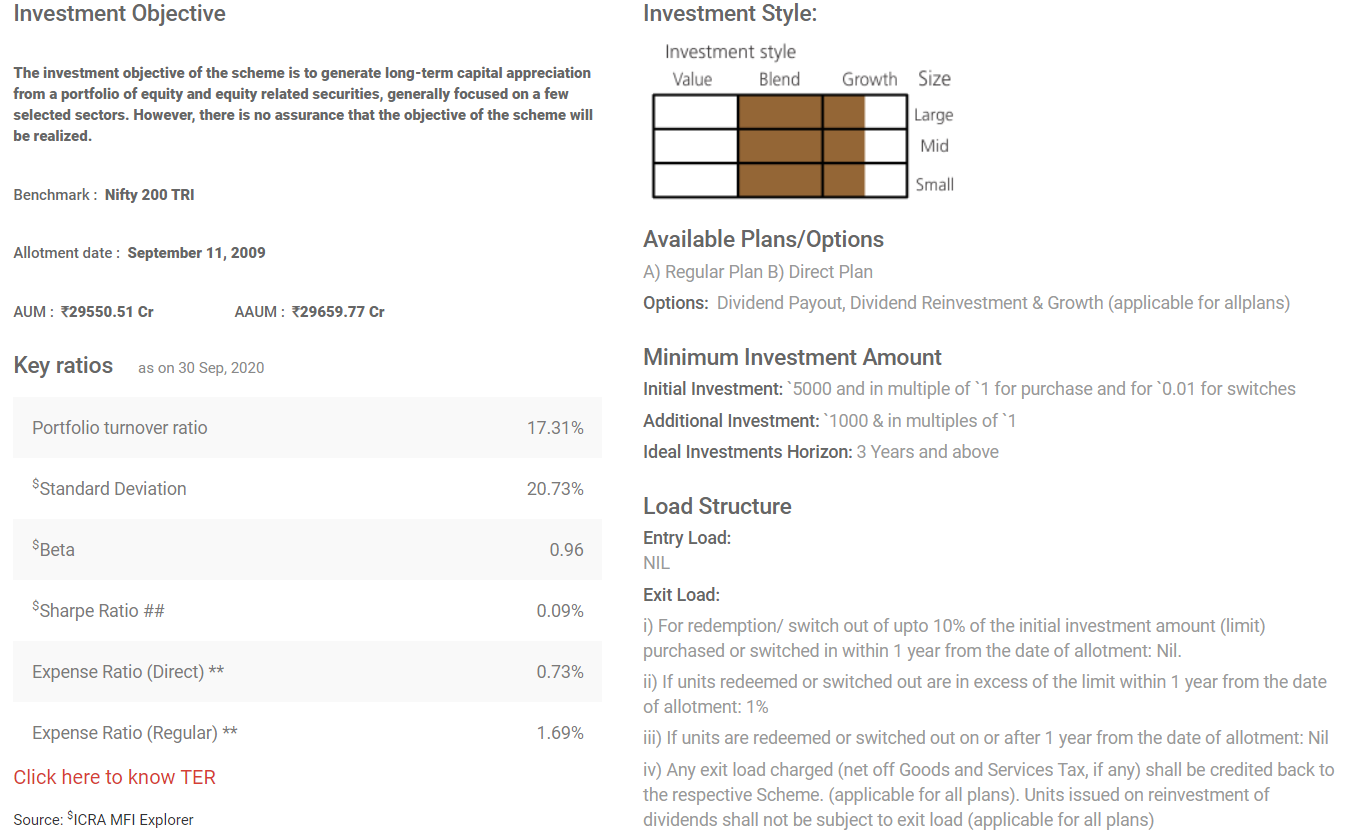
You can read through the investment objective, you will get valuable insights from this at times, especially when looking at debt funds. You will figure that this fund is not restricted to any particular market capitalization. The investment style grid suggests that the fund can invest across the market and has a blended approach to growth and value style investing.
If you dig up the portfolio details, you will figure that the fund has the majority of its investment in large and mid-cap stocks. Given this, the benchmark for this fund is Nifty 200 Total Return Index, which is fine.
I know many MF investors dig into the portfolio details and start to sweat over why the fund manager has invested ‘x’ amount in Stock A versus ‘y’ amount in stock B, and in the process, think they carry out ‘a through’ mutual fund research.
Nitpicking on the Equity fund’s portfolio is not research. I mean, think about it, if you could figure out which is a good stock and which is not, then you may as well invest in the stock directly right?
This is as good as sitting on your couch with a tub of popcorn and passing serious, opinionated comments on how Virat Kohli should bat in International cricket.
Anyway, the fund has an AUM of Rs.29,500 Cr, which makes it a large fund. From the AMC perspective, how large is this fund? To figure out that, you need to look at the AMC’s overall AUM.
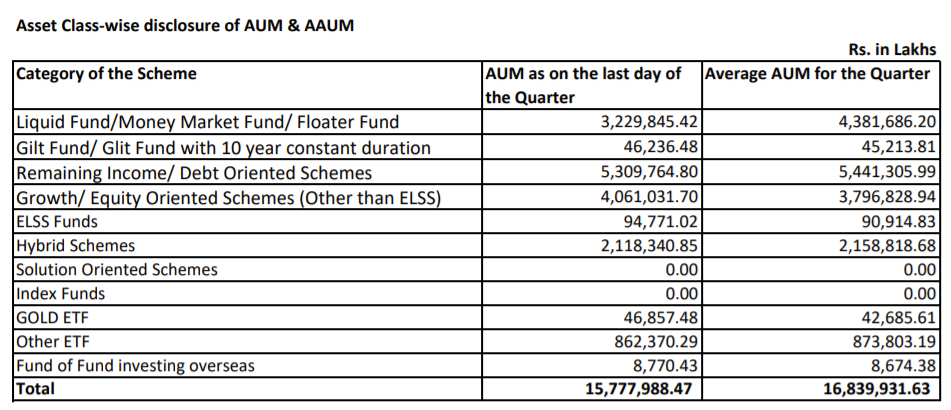
The AUM information is updated on the AMC website regularly. As you can see, Kotak AMC has an AUM of 1.5L Crore, which makes the standard equity fund about 18% of the overall AUM.
However, suppose you look at the Equity category. In that case, the AUM is about 40,000 Crore, which means the Kotak Standard Equity Fund is nearly 72% of the category AUM, which implies that this is one of their flagship funds for the category.
Why are we digging into this information? Well, we need to know how the fund is positioned within the AMC to get a perspective. It is also expected that the AMC would be extra cautious not to mess up their flagship funds.
While at it, do you think funds with large AUM is a problem?. I know many folks fret about ‘large AUM’ problem, the rationale being that the fund manager may find it difficult to manage the funds as the opportunity shrinks.
If the fund flow is steady and the AUM increases gradually over time, then, in my opinion, it should be ok. However, if there is a drastic increase in AUM, maybe because of aggressive marketing campaigns, then that could be a problem and usually results in a slight lag in the performance.
Smaller funds do have an advantage in terms of nimbleness.
Apart from the AUM size, we look at the expense ratio of the fund, direct is at 0.73% and regular is at 1.69%. Not surprising at all 😊
Since you are reading this, I hope you won’t consider regular funds ever again in your life 😊
Moving ahead, I’d like you to look at a few other metrics, these are reported in the factsheet and also on 3rd party websites like Morningstar and Value Research.
The snapshot below is from Morningstar.
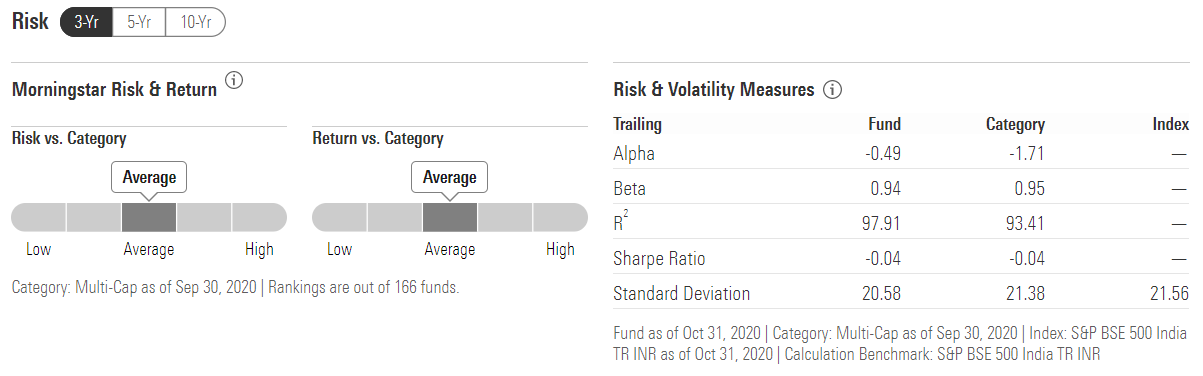
The fund’s standard deviation (on a 3-year basis) is 20.58%; this suggests the fund can fluctuate 20.58% up or down over a 3-year basis. The standard deviation of the category is 21.38%. If you look at it from a risk perspective, this is nice since it indicates that the fund is slightly better compared to the category.
If you switch to the 5 and 10 years period, the fund’s SD is 18.39% and 17.42%, while the category’s SD is 19.12% and 18.4% respectively. For now, this is a good sign as it hints that the fund is good at managing the risk.
Do look at the Sharpe ratio as well. In this case, the Sharpe ratio is negative, which means either the risk-free return is higher compared to the portfolio’s return or the portfolio’s expected returns are negative. Either way, this is not conclusive. Hence we can ignore the Sharpe ratio.
Check the Alpha and the beta of the fund to get a sense of fund’s performance compared to the category. Of course, you need to do this across 3, 5, and 10 year period.
Usually, the fund’s hygiene check ends at this point. All that we do in this stage is to gather a few important ‘good to know’ data points.
24.3 – Rolling returns check
You must have heard the line ‘past performance is not an indicator of the future performance’, while this is true, there is no better alternative to this. By studying the past returns and its behaviour, we would at least know what to expect.
By past returns, I don’t mean 1,3,6 or 12 months returns. In fact, in my opinion, anything less than three years return is pointless when it comes to Equity returns. Three years itself is an ok time frame, I’d suggest five years or higher, but three years is a good start.
We start by looking at the rolling returns. By the way, I hope you know what rolling returns mean, else I’d suggest you look at the chapter and familiarize yourself with the same.
I’ll post a series of rolling return snapshots sourced from Rupeevest website. Hopefully, soon we will have Rolling returns of funds on Coin, our mutual fund platform.
Here is the three-year rolling return of the Kotak Standard Multi cap fund –
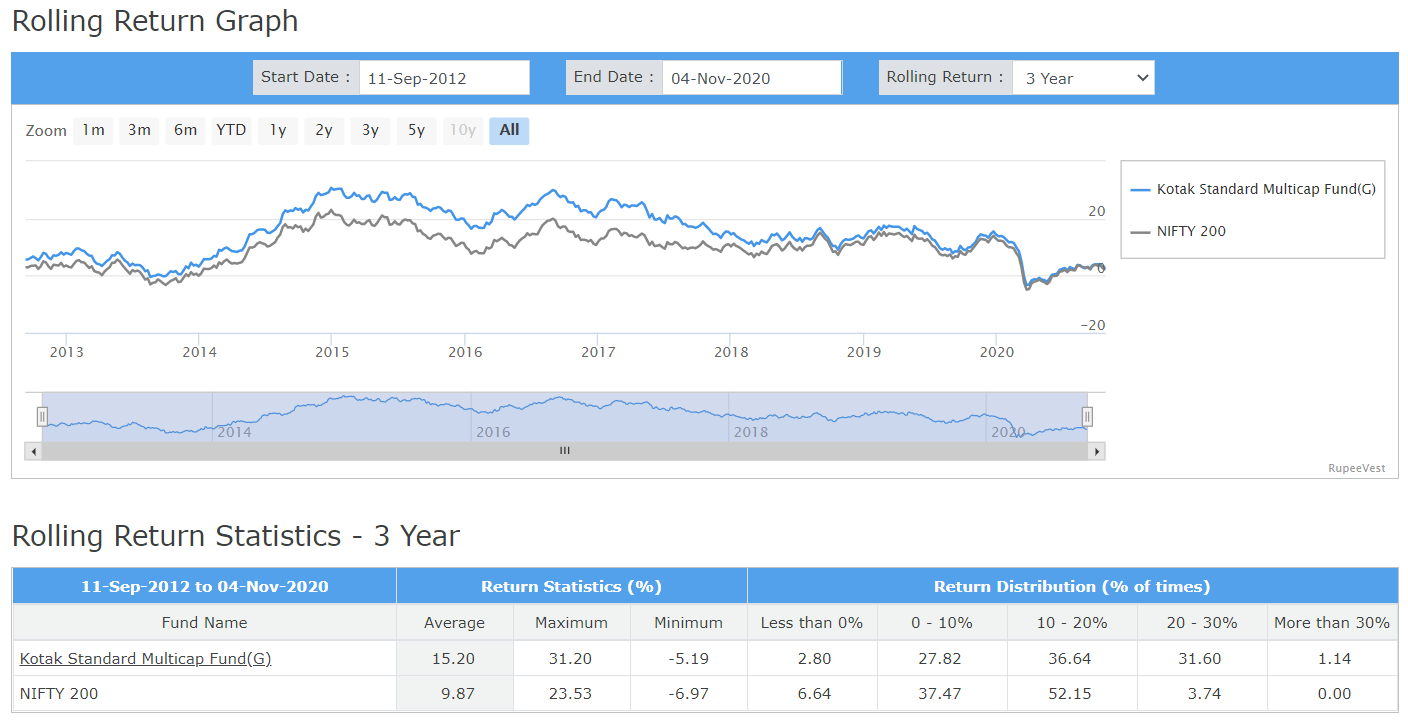
As you can see, I’ve got the 3-year rolling return from Sept 2012. The blue line is the fund’s three-year rolling return, and the grey is the benchmark’s rolling return.
The first thing that will catch your attention is the spread between the two rolling returns. The blue line is consistently above the grey line, indicating that the fund has delivered better returns compared to its benchmark.
In the three years, the fund has delivered an average return of 15.2% while the benchmark has delivered 9.87%.
The moment you see such an outperformance, rather than getting excited, you need to pause and ask yourself – how is this fund pulling this off. Is the fund taking in more risk compared to its benchmark?
We will figure that out soon.
While the spread between the fund and its benchmark was significant in the initial years, it has shrunk since mid-2018.
Is the fund losing its sheen? One probable reason for this could be the rapid rise in its AUM.
Apart from average returns, look at the minimum and maximum returns to get a perspective on the dispersion of returns.
The fund’s 3-year min and max is -5.19% and +31.2%, and the benchmark’s min and max are – 6.97% and +23.53% respectively. This fund stands impressive at this point.
It is important to understand that you are looking at the 3-year data, but just the 3-years data is not sufficient for analyzing an Equity mutual fund, we need to look at five and 10-year data as well to get a perspective.
Here is the 5-year rolling return of the fund and we compare that to its benchmark, the Nifty 200 –
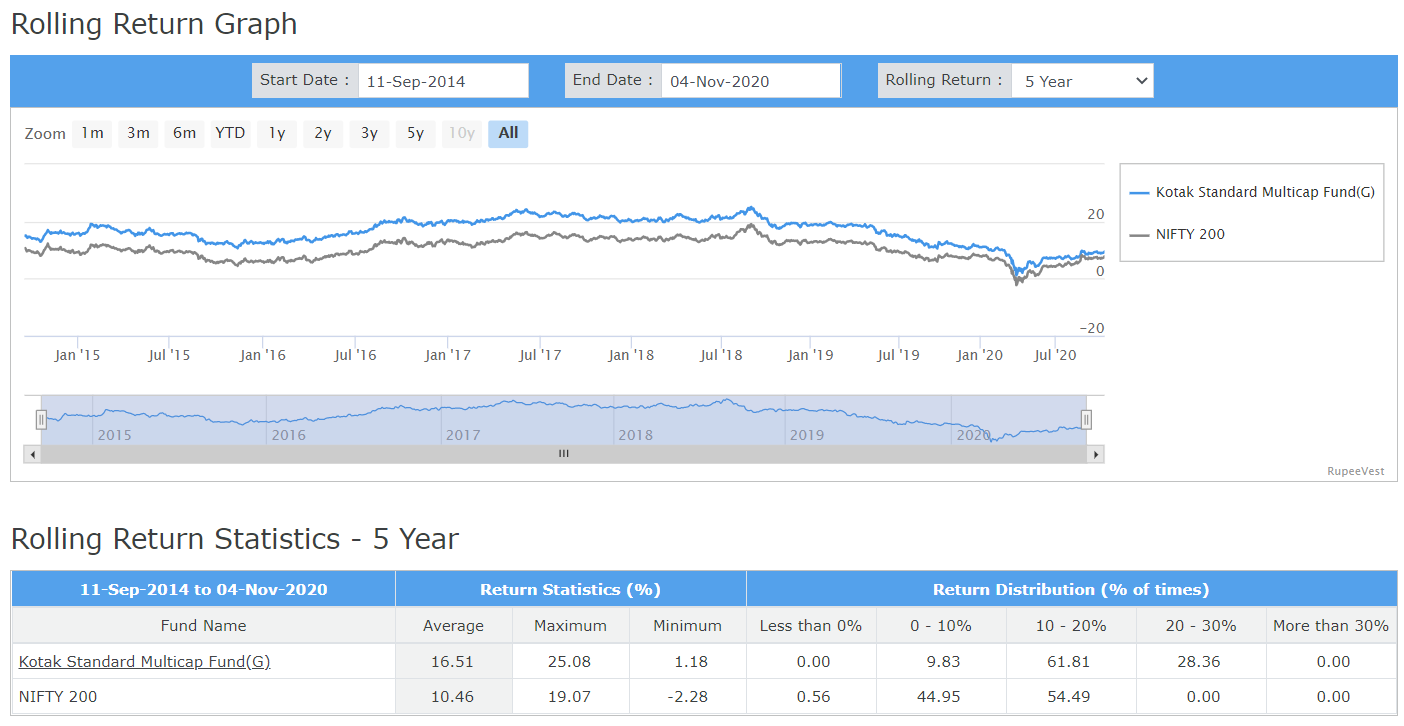
Again, on a 5-year basis, the fund’s outperformance to the benchmark is quite impressive. While the fund’s average is +16.51%, the benchmark is +10.46%. Note, this is still very similar to the 3-year data.
The dispersion in returns when looked at the minimum and maximum returns are also quite interesting. The fund’s minimum is still a positive 1.18% while the benchmark is -2.28%.
However, the spread has narrowed down towards the extreme right, similar to how it does for the 3-year rolling return.
Lastly, let us see how the fund performs on a 10-year rolling return basis. Note, there may not be many data points for the 10 years –
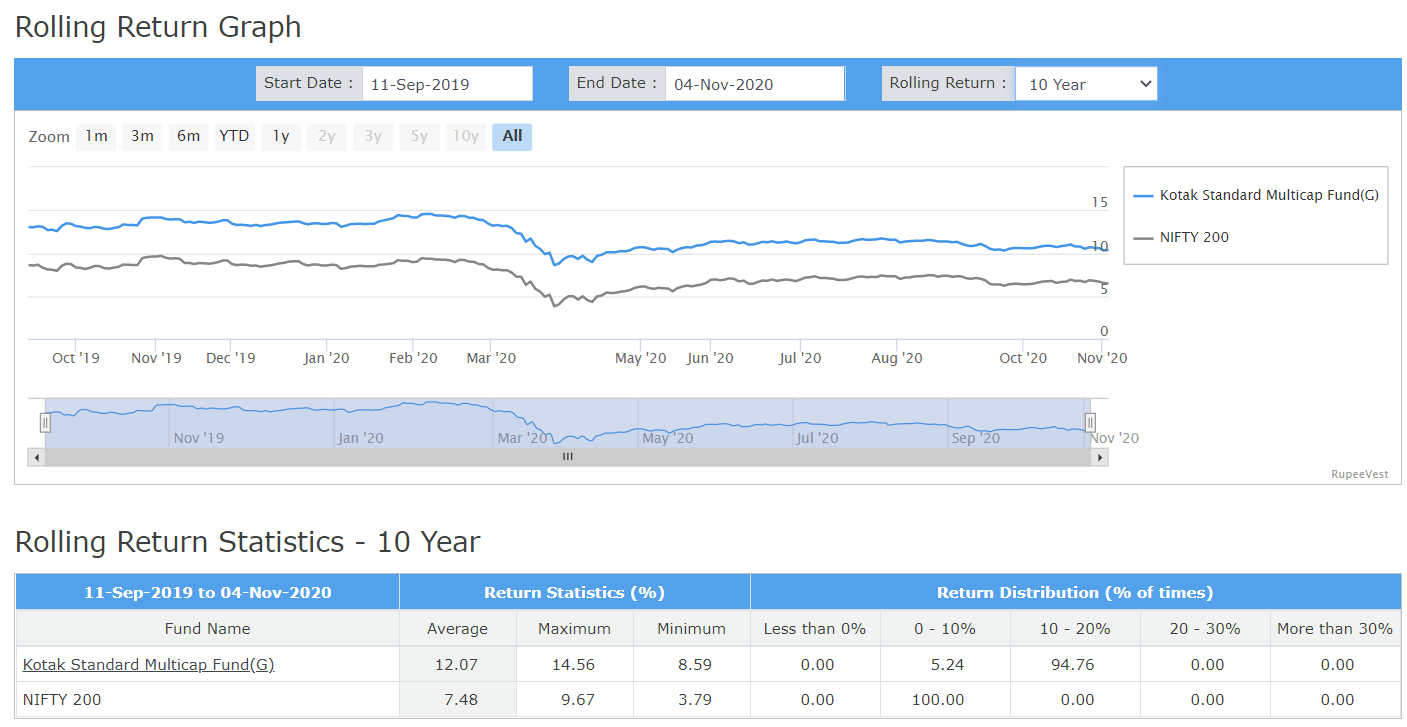
The average 10-year rolling return is 12.07% versus the benchmark’s 7.48%, quite remarkable in my opinion. While the fund’s minimum is 8.59%, the benchmark’s minimum is 3.79%. On the positive returns side, the fund has put up an impressive 14.56% versus the benchmark’s 9.67%.
Based on the rolling return data, there are a few apparent things –
- Why is the spread shrinking? Is the fund losing its sheen?
- While the returns are impressive, is this coming at the cost of higher risk?
The answer to the first question is tricky. There is no fund manager change, so its unlikely the investment style has changed. Is this because the fund has a large AUM? Well, this is a tough call to make, but my gut says this could as well be the reason.
Have a look at the trailing returns as on date –
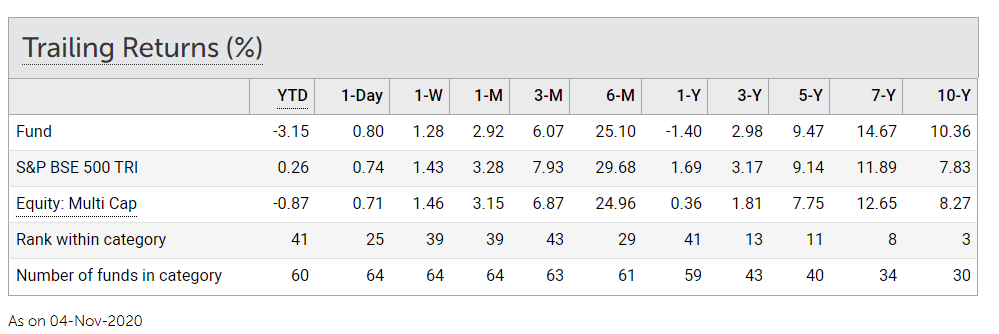
We can see the fund has underperformed the benchmark on a 3-year basis, while it is at par on a 5-year basis, and on the 10-year basis, it still has a slight outperformance.
All in all, it gives me a perspective that the returns were great in the past years, but will that continue is the question. However, the interesting bit is that the performance has been better than its peers look at the Equity Multi cap category performance.
As far as the 2nd concern goes, let us focus on the risk metrics of the fund, perhaps the most crucial bit of our analysis.
24.4 – Risk – Return matrix check
I find the risk-reward matrix published by Morningstar quite useful. Have a look at this –
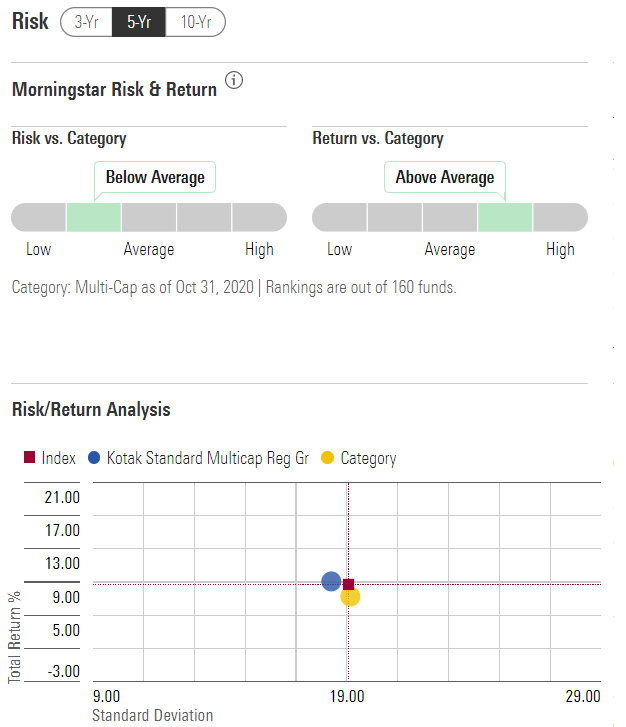
I can choose to view this across 3, 5, and 10 years period. I’ve selected for five years.
The initial bit highlights the fund’s risk versus the category and the fund’s return versus the category. We know the returns have been great, so no point looking at it again. Risk versus the category risk is ‘below average’, so that’s encouraging. For more details, I now look at the matrix.
The Y-axis of this matrix is returned, and the X-axis is the risk. If you have read Varsity’s Module 9 on ‘Risk Management’, then this matrix is already familiar to you. If not, all you need to know is that the higher you move on the Y-axis, higher is the return, and the further you traverse on the X-axis, higher is the risk.
Anyway, ignore the blue and yellow button and start with the red square, which is right at the centre of the matrix. The red square belongs to the benchmark, and from its positioning in the matrix, we can conclude the benchmark has generated a return of 10% by taking the risk of 19%.
Now, look at the yellow button; it belongs to the category. We can see that the yellow button is on the same vertical plane as the red square. Hence we can conclude that the average category risk is similar to that of the benchmark’s risk, i.e. 19%.
Unfortunately, for 19% risk, the category’s return does not match upto its benchmark, as it is slightly below the benchmark’s return.
So if you were to choose an investment between the category and its benchmark, it does not make sense to invest in the category since for similar risk, the benchmark offers better returns.
What about the fund in perspective?
Well, the fund has a better risk-reward ratio compared to the benchmark. It seems to have generated similar returns like the benchmark by taking on lesser risk, which in my opinion is good.
Remember, you are paying the fund manager for active management. Active management does not necessarily mean generating better than benchmark return. I think its job well done if the fund manager can generate similar returns like the benchmark by taking on lesser risk (at a lower cost hopefully).
So on a 5-year mark, this is looking good. Shifting gear to the 10-year window –
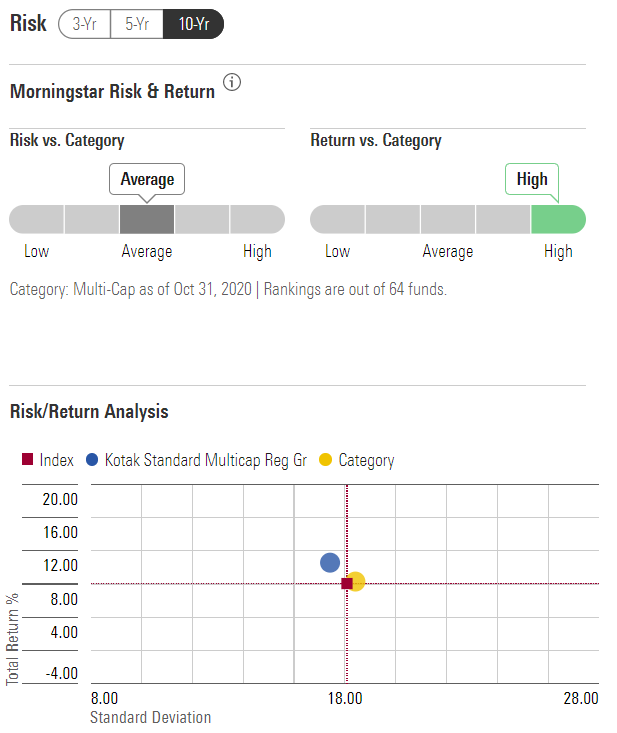
It gets a bit more impressive on a ten-year basis, while the category and benchmark have a similar risk-return profile (18% risk, 12% return), the fund has slightly lesser risk and higher return profile.
So at this point, I know that the fund has exhibited a decent track record in terms of risk and reward profile. As the last step, let us look at the capture ratios.
24.5 – Capture ratios
We discussed the capture ratios in the previous chapter. I hope you are familiar with it by now. Here is the capture ratio on a 5-year basis –
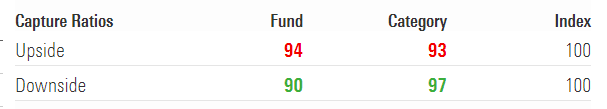
Look at the downside capture ratio; the fund has managed to capture 90% of the benchmark’s downside, which is good. Again, this is a reflection of better risk management at the fund house.
The capture ratio gets better on a 10-year basis –
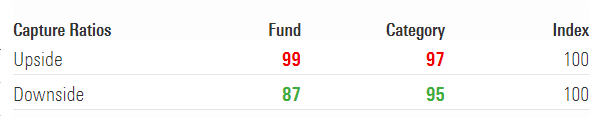
The fund has captured almost 100% of the benchmark’s return while capturing only 87% of the benchmark’s downside returns. Contrast this to the category.
All in all, our quick analysis shows that Kotak Standard Multi-cap fund is good. Does that mean you should invest in it right away? Well, we will discuss this next chapter.
Lastly, I want you to recognize the fact that we have not looked at fund ‘ranking’ given out by agencies. Looking at fund ranking to make an investment decision is quite useless since you can do a better job yourself.
Key takeaways from this chapter
-
- You can start the equity mutual fund research with a basic hygiene check to familiarize yourself with the fund
- Know the size of the AUM, its investment objectives, a bit about the fund manager, and its benchmark
- Look for the rolling returns of the fund on 3,5 and 10-year basis.
- Look for the average, minimum, and the maximum returns to get a sense of the dispersion of the return
- Compare the rolling returns with its benchmark rolling returns
- If there is excess return, check if this is coming at the cost of additional risk
- Look for the risk-reward matrix and understand the risk-reward profile on 5 and 10 years basis
- Check the capture ratios
Hi Kartik, thanks for these wonderful modules on personal finance. Never thought these topics can be explained in such a lucid language.
I had a doubt in procuring data for direct funds. You mentioned that direct funds are relatively new and not as much data is available for analysis. Can the data for regular funds act as proxy for analysing the direct funds? Apart from expense ratio, is there any other difference between them? From what I have learned in this module, both have the same fund manager, hold the same portfolio, follow the same investment strategy and have similar risk profiles, so just for analysis purposes, regular funds should also work.
Thanks Swapnil, glad you liked the module 🙂
We now have decent amount of data for direct. Else, you can consider regular fund\’s dad as proxy.
Hi Karthik
Is there any reliable app which analyses your mutual fund investment?
By the way , I have noted and liked key takeaways mentioned above and started working on it.
Sure. Happy investing 🙂
Not sure, Jeevan. What sort of analysis are you looking for?
hi karthik,
i really appreciate your simplest way of explaining concepts. thank you for your effort!
my doubt is that i have noticed the risk parameters values being different in morning star and value research website. so which one should i consider? difference is quite big in few cases.
Thanks, Prasanna. Really not sure what Value Research folks are suggesting. But as far as risk goes, each pattern comes with its own stop loss points, right?
I\’ve noticed that the returns for funds is highest after 5 years (say 29%) but its only (say 20%) after 10 years- does this mean its more profitable to withdraw from the mutual fund after 5 years, rather than stay in it for 10 years? I\’ve noticed this trend for many of the funds- wanted some clarity.
I\’ve not really noticed this. By the either of the returns seems abnormally high 🙂
https://www.moneycontrol.com/mutual-funds/performance-tracker/returns/small-cap-fund.html
This is a table of historic returns.
Why is the 5Y returns higher than 10Y returns?
Does it mean if we withdraw after 5Y we get higher % returns than after 10Y?
Well, there is no such thing 🙂
@Karthik sir, Let say this holds true for timebeing..what is the ideal thing to do in the given situation?
Thumb rule in EQ investing – longer the tenure, lower the volatility.
What about Beta, alpha and Sortino Ratio? Don\’t we have to consider them or they don\’t matter much?
Also we looked at average rolling returns in above MF selection. Why not CAGR/XIRR?
We have discussed CAGR and XIRR too. By the way, rolling returns also measures CAGR, but in a different way.
It does, we have discussed these ratios too.
Hello kartik !!!
I\’m invested in the small cap fund of nippon india.This fund has AUM around 58000 crores as of now.
Suppose one scenario where there is large redemption request in this fund (may be bcoz of war or anything) and since its holding are not that liquid bcoz of small cap holdings, they couldn\’t liquid their holdings as fast as the speed of redemption.
So what could be the consequences?
Is my money in danger?
Usually the fund houses buffer for these situations and will also have a line of credit handy to address such situations.
Hi karthik Sir,
Thanks for sharing these valuable module and I don\’t think in today\’s world any is offering these kind of learnings for free. God Bless you with good health and more success and keep share sharing the knowledge with all of us.
My question is,
1. If we select the Top 5 mutual fund with highest AUM, for e.g. Parag Parikh Flexi cap which is top among its category in terms of return, risk, standard deviation, sharpe ratio, upside and downside ratio and other factors mentioned in this module. (I learned from this module and able to analyse the funds, Thanks) but the AUM has increased beyond its category and do you think it is advisable to invest because based on past performance you cannot expect the same return in future. Even fund manager has not changed yet, Can you guide here please?
2. Can you share the website to analyse the rolling returns compared to its benchmark as you suggest the Rupeevest, sometimes it does not show the index with TRI. For returns and Risk, Morning is good.
Thanks for the kind words, Sandeep!
1) It should not matter. You can still go with it.
2) I heard Morningstar and Primeinvestor has started giving rolling returns. Please check.
Good luck!
hello Karthik, where can I find the downside and upside data? I didn\’t see it in Morningstar tools tab. Correct me if I\’m wrong.
Also how do I change the ratio calculations from 3 year (by default) to 5 or 10 year time frames while comparing on Morning Star?
Did you see the individual fundsheet? These capture ratios are usually mentioned there in individual fund pages. About changing on Morning star, I think you will have to contact them, I\’d not know 🙂
Hi Sir,
Namaste !!
Where We can find the Asset class wise disclosure of any AUM, Can you please send the Link so it would be helpful to see actually where it is ? and Do we need to check this as well and what if it is not a flagship of its AUM ?
Sorry, I dint get this query. Can you please share more context?
Hi Karthik,
Hats off to you for creating such amazing modules! I have one doubt, which seems to be a common question in the comments section, but I couldn’t find a clear answer.
If I want to invest in just one fund from any segment (say, a large-cap fund), I come across numerous funds from different AMCs under the same segment. How do I go about shortlisting a few funds (say, 5 large-cap funds) for analysis?
For example, in this chapter, you selected the Kotak Multicap Fund for analysis. Similarly, how should I select 5 funds from the same segment for comparison and analysis?
I’ve written the exact same question someone else asked previously, to which you responded with a YouTube link. However, this specific aspect hasn’t been discussed in that video. Could you please provide detailed clarity on how to approach this?
Thank you!
Ajit, glad you liked the content. For your query, here is what you can do –
1) Pick 5 funds based on the largest AUM and from top names – Kotak, HDFC, ICICI, etc etc
2) Keep few parameters in perspective – AUM, SD, Rolling return, capture ratios, expense ratio etc
3) Rank each fund based on the parameter
4) The one with the highest rank qualifies as your fund to invest
I\’m not suggesting that this is the approach to take, but this is one of the ways you can get started. Of course, you can course correct as you go ahead.
Namaste ! Karthik
Thanks for this module.
One question here, I saw in money control about analysis of funds, in that a Portfolio turnover mentioned. What is it ? and how it can be used for analysis? or it is really worth looking at it?
Thanks !
Looking to partner with you one day and I started preparing as well. Hope i can meet you soon.
Namaste! Assume I have a 2 stock portfolio. After 10 days, I sell both the stocks and buy another 2 stocks. In this case, I have done a turn over of 1 time, meaning fully sold and rebought stocks. For a MF, the portfolio turnover should be less, you dont want the fund to be churning stocks frequently.
top 10 in terms of their AUM?
AUM, P&L, number of years of operations etc.
Hi Karthik, as usual great content. Thanks for sharing.
What I want to ask is, after all the analysis let\’s say we arrived at a fund to invest. Once we know the fund and it\’s portfolio composition, one can directly invest in those stocks as per the fund\’s composition right so that we can avoid TER and exit load as well.
Do you think this has any benefits and what factors/pointers one should keep in mind if he/she were to take this path?
There is no advantage of doing that – MF is a far better in terms of tax efficiency, management (remember it also gets rebalanced), and day to day ops. Also, why do you want to take the headache when the same thing can be achieved easily via a fund?
Could you please shed a light on which AMCs to avoid and which ones to prefer? Are there any parameters to look at?
I\’d suggest you stick to the top 10 names 🙂
Hey Karthik,
Thank you for the great content! I had a query regarding taxation on AMCs with high turnover. I\’ve heard that a mutual fund with a high turnover can lead to lower returns due to higher costs and lower tax efficiency. Is this applicable in India, do AMCs get taxed whenever they sell some stock to readjust their portfolio? If yes, am I right to assume that this must be getting reflected in the daily NAV, and hence all I really need to look at this the final returns of the fund (since it includes all the costs, like Expense Ratio, etc.)
Thank You!
Higher costs yes, but lower tax efficiency I\’m not sure as MFs are a pass through structure and the taxes are at the hands of the investor and not the AMC.
Is there any website/ tool where we can check rolling returns for SIP in a fund
I think morning star has recently started giving RR. Please check that, I could be wrong though. If not, the fund\’s fact sheet usually does.
Where do we find alpha, standard deviation,beta ,portfolio turnover and other ratios required to compare mutual fund\’s? I went through few factsheets but did not get all the data.Can you suggest any other website or any way to look for this ratios?
These are mandatorily stated in the fact sheet, surprised you dint find it.
Thank you once again for this wonderful gift you are giving to the community in the form of Varsity!!
I would like to know currently which is the best website in your knowledge to do a full comparison and analysis of mutual funds available in the market?
Ayush, thanks. You can check Coin itself to start with.
What are your thoughts about NFO’s? Would you suggest a way to assess the funds?
It depends on your portfolio and the portfolio need, Shivraj. Dont invest just becuase the NAV is at 10 🙂
Thanks you so much for sharing your knowledge and experience for free and that too of top notch quality. People like you who help others are needed in this world full of greed where nothing is for free. If I become successful in Life (which I will; not doubt) then I promise you that I will also share my knowledge and experience with people who need them and want to learn something and change their life\’s. Thank you so much sir 🙏🙏
Thanks for letting me know, Rishi. Wishing you the best, and I do hope you find success in whatever you are doing 🙂
Sir,when the 10-year returns are say 10%,does it mean the CAGR is 10% or avg returns?
Yes, its safe to assume its CAGR 🙂
Hi, Karthik
Thank you so much for this wonderful module.
I have a doubt i.e. how to check whether the aum of the scheme has drastically been increased? I can\’t find any graph to find the change in AUM size.
Tyagi, you can check this on the AMC\’s monthly disclosures.
Sir After reading many Chapters I feel little Lost.
Can you Help me with a Query?
While deciding to Invest in a mutual fund
say for example ICICI Bluechip Direct Growth Plan
I know the fund outperformed the Benchmark
But how do I find out if it beat the Benchmark after considering Expense Ratio?
I want to Compare the extra Risk I have taken for minimal Outperformance.
Thank You for the Content I am really learning a lot here.
The analysis is based on NAV, and NAV is declared after factoring in the expense ratio.
Is it necessary to have a paid membership of Morning Star India or Value Research to obtain the above information for comparing the Equity Funds ?
I think most of the information is available online for free. Don\’t know if a paid subscription is needed.
Thanks for replying!
I understand the source of my confusion now. If we look at the Morningstar\’s definition of the Standard Deviation: https://awgmain.morningstar.com/webhelp/glossary_definitions/mutual_fund/mfglossary_Standard_Deviation.html
They are calculating the SD of the percentage returns itself. I was assuming that the the SD is calculated on the actual NAV.
Ah yes, perhaps.
You mention that \”The fund’s standard deviation (on a 3-year basis) is 20.58%\”. What does it mean for the Standard Deviation to be in percentage basis? Shouldn\’t a SD of 20.58 reflect the deviation in price instead?
No. Think about it, of the SD of a 50 Rupee stock is 25, does that mean it move by 25 rupee daily? SD is a percentage.
Thanks, Karthik. I have been leaning towards the midcap index since it was a no-brainer. But I will also speak with an RIA before that.
Sure, please do. Try and get a low cost exposure to midcap fund 🙂
Thanks for this wonderful module Karthik. I was recently reviewing the lacklustre performance of Axis Midcap Fund and want to move to a better fund. So I ended up devouring your entire module.
I have a question though: Axis Midcap has been underperforming the index over the last several quarters and I wanted to know where else I can move my funds.
I shortlisted the following options:
1: ICICI Nifty 150 Midcap Index: No brainer but I wonder if I\’ll miss out on alpha generated by the other funds or a turnaround in Axis Midcap later. But has the lowest tracking error amongst its peers.
2: Motilal Oswal Midcap – Has amazing alpha, sharpe ratios, and capture ratios across 3/5/10 years. Best in class ratios but the 7-year rolling returns since inception have been largely below the benchmark. I\’m surprised that a fund with such good ratios can have below-average rolling returns. I thought they were correlated.
2: Edelweiss Midcap Fund – Has good 7-year rolling returns but pales in comparison to Motilal Oswal\’s alpha, beta, sharpe, and capture ratios.
Out of the above options which one sounds better to you? Or should I wait for a turnaround in Axis Midcap?
Rakesh, you should be talking to a good RIA about this 🙂
But here is the thing – stick to the fund which manages risk better well, rather than the one which gives you higher returns. After-all, we all want to sleep well at night.
Hi Sir,
Thanks for such a valuable lesson. You have mentioned under Hygeience check (24.2)- \”we can ignore sharpe ratio and In this case, the Sharpe ratio is negative, which means either the risk-free return is higher compared to the portfolio’s return or the portfolio’s expected returns are negative. Either way, this is not conclusive. Hence we can ignore the Sharpe ratio.\”
Query- you wrote about expected returns.
So, are you saying that in Sharpe ratio we are using expected returns and not past returns? If yes, then how can we calcualte expected returns?
No, sharpe considers historical returns and not expected returns.
Sorry sir, I think I shared the wrong link. Sir, I expected the beta of the index to be 1 since we calculate the beta wrt to an index. So how is it possible for the beta of the index to be 0.67 as reported in the link below? Also, sir the capture ratios reported for the upside in the index column is 80. Shouldn\’t the capture ratios of the index the fund is tracking be 100 since even that is defined wrt to itself. Here is the correct link: https://www.morningstar.in/mutualfunds/f00000pdm3/axis-bluechip-fund-dir-gr/risk-ratings.aspx
Ansh, these are the parameters of the fund with the index right? These are not the parameters of the index. Unless, I\’m missing something obvious.
https://www.morningstar.in/insurance/f00000h396/HDFC-Standard-Life-Blue-Chip-Wealth-Builder/risk-ratings.aspx Sir this is the link, should I ignore the alpha, beta and capture ratios reported for index column?
Hmm, but why would you want to ignore?
Hello sir, I was analysing a mutual fund on Morningstar and it reported the beta of the index as 0.67. How is this possible? Shouldn\’t the beta of the index be 1. Here, I\’m tracking the Axis Blue Chip Fund (Direct-Growth).
Hmm, yes. Maybe its the beta of the fund with the index?
Thanks for writing this guide on Mutual Funds, Kartik. I have few questions on tracking error & difference:
1) Can you please provide detailed understanding of how tracking error vs. tracking difference eat up your returns in Index Funds?
2) For example, Index Fund 1 has an expense ratio of 0.32%, tracking difference of (1.7%), and tracking error of (0.58%) since last 1 year vs. Index Fund 2 which has an expense ratio of 0.14%, tracking difference of (2.2%), and tracking error of (0.34%). Which Index Fund would you ahead with and why? If you can help understand the rationale in detail, that would be helpful.
1) Tracking error is basically caused due to slippage in execution. Slippage is kind of a fee you pay for stocks not having adequate liquidity. Higher the slippage, higher the cost of execution and hence higher the tracking error. Higher the tracking error, lower the returns. So when picking index fund, its important to ensure the tracking error is low.
2) Ensure the tracking error and expense ratio is low, that should be good.
Sir,
1. Could we find the factsheet of the respective funds in zerodha coin? If yes, could you share in the link? If no, where to look for the same?
2. Do Zerodha coin floats for both open and close funds for investment? If yes, how to know which is open/close?
1) You can scroll through to the end of the page and find the scheme document. Here is an example – https://coin.zerodha.com/mf/fund/INF204K01XD4
2) Most funds are open ended. YOu can check the scheme document for details.
Sir,
All the investment options those are showing in Zerodha coin for Index funds/ Smart beta/MF etc. are all for direct investment and nor regular. Right?
If the above is yes, do zerodha even facilitates for regular option investment?
Yes, on Coin they are all direct funds. We dont really show regular funds on Coin.
Sir,
In case a broker withdraws its operation, we know that a direct share purchased earlier through that broker safely resides with CDSL.
Now, similarly, if an AMC withdraws its operation, what is the lock & key feature of any MF investment made earlier through that AMC? How will our investment money is protected?
Please advise.
An AMC cant shut down just like that. They will have to give enough time for investors to redeem the units.
Sir,
(i)I want to start invest in Nifty 50 index fund for growth and direct option. So, will the investment in \”HDFC Index Nifty 50 plan\” which is showing in zerodha coin serve the purpose?
(ii)I want to start invest in Nifty 150 midcap index fund for growth and direct option. Wil the investment in \”HDFC Nifty Midcap 150 Index Fund\” which is showing in zerodha coin serve the purpose?
(iii)I want to start invest in Nifty 250 smallcap index fund for growth and direct option. Wil the investment in\”HDFC Nifty Smallcap 250 Index Fund\” which is showing in zerodha coin serve the purpose?
(iv) What is \”HDFC NIFTY50 Equal weight Index Fund\”. Is it like all the stocks of Nifty 50 get equal weightage irrespective of market cap to change the index value?
Yes to all queries, it should. Ensure you are selecting growth option.
Hi Karthik, I couldnt find the rolling returns data on Coin. Has it been introduced already?
Its not available yet, but I guess AMCs have started publishing that data on fact sheets of the funds. You can check that.
Sir,
(i)Suppose someone is investing in MF (SIP/lumpsum) of Rs. 100 and at that time the NAV for that particular fund is Rs. 10. Then he should get 100/10 units=10 units shares of that fund. right?
(ii)Also, if someone is investing Rs. 95 in a lumpsum or SIP, then how will that be accounted for that NAV. Is there a concept of partial share in MF like the Direct share purchase in US? I am confused here.
1) Yes, thats right. Basically the amount you want to invest divided over the NAV.
2) You will get partial units. In this case it will be 9.5 units.
Sir,
(i) I am looking to start investing in midcap MF in HDFC AMC for a direct growth plan . Meanwhile, I am a little confused since Zerodha is showing two options under this- One is growth and the other is IDCW. Please confirm which should be the one I should invest?
(ii) Also, in morning start there are two such funds showing- \”HDFC Mid cap opportunities fund growth\” and the other as \”HDFC Mid cap opportunities fund -Direct plan-growth option\”. What is the difference between the two?
1) Go for growth option, Anirban.
2) Direct is without the distributor commission. I\’d suggest go for direct-Growth.
Hello Karthik, thanks for all the modules.
I wanted to ask for the 5year risk return graph, we see the return is similar to index. Considering this 5year metric only, fund seems to be discouraging, because the expense ratio will be higher for this fund, than the index funds. Making overall returns lesser than index fund. Should the risk return metric be plotted considering expense ratios as well? Or I am missing something.
Thanks,
Aditya
Its just that factoring in expense ratio cab be a bit cumbersome. But for longer term investment horizon, index funds do just fine 🙂
Thank you kartik sir for these modules. I have learnt a lot.
Just one question.
I have decided to invest in nippon india MF for small cap segment via SIPs but they are not taking any new funds in lumpsum bcoz their AUM has gone very large though they are open to SIPs.
So should I invest right now via SIPs ?
I mean if they are not taking any new funds in lumpsum, is this negative point for new investors who wish to invest via sips ?
Will new investors returns be impacted ?
They could have stopped for operational reasons. New investors wont be impacted.
sir
it is possible small cap fund in majorly 50-60% invest in mid cap stocks …
and in small cap nearly 10%-20% invest, remaning in other large cap,cash etc
i check all the funds, shockingly every fund have major part in invest in mid cap of small cap fund
like-nippon india,axis,quant etc
i think SEBI mandate 60% invest in small cap…but fund donot do it ….
but why sir any i looking ri8 ya wrong sir
No, this wont be possible after the SEBI\’s reclassification of schemes.
sir
invest in new offer fund or old fund which is bettter ?
Depends on your objective and tenure of investment.
Amazing content Karthik! It was super helpful. Thank you.
Happy learning Kaivalya 🙂
\”Since you are reading this, I hope you won’t consider regular funds ever again in your life 😊\” comedically threatening lol
Not threatening 🙂
But I do hope people reading this get the point.
Thanks Karthik.
Sorry, but the videos still don\’t answer my question.
My question is;
If I were to plan on investing in 1 fund of any segment; say 1 large cap fund. I would find so many funds from different AMCs under this segment. How do I select a few funds from the same segment (let\’s say 5 large cap funds) for analysis?
Like in this chapter; you selected Kotak Multicap Fund for analysis. Similarly how do I select 5 funds from the same segment for the analysis.
I hope I have articulated the question properly this time.
Ah sorry, I\’ve actually addressed this in this video – https://www.youtube.com/watch?v=k6wLmbWgies&list=PLX2SHiKfualGsjgd7fKFC-JXRF6vO73hk&index=11 while this video is for analysing EQ funds, the next one is for debt funds.
Hi Karthik,
I have a question. How do I go about selecting a few funds for the analysis.
For example, if I wanted to analyze some funds from the midcap segment. There are so many of them from different AMCs. How do I filter them out and maybe take 5 funds from them for the analysis?
Should I be falling back on the rankings from different websites? Or rather, how do you generally do it?
Please advise.
Anish, do check this – https://www.youtube.com/watch?v=6sq2o1atWLY&list=PLX2SHiKfualGsjgd7fKFC-JXRF6vO73hk
This playlist will help you with this.
Do you suggest to invest in a new fund which just launched? if so, how to analyze such funds as we don\’t have historical data for rolling returns, beta and alpha etc..
Not a big fan of NFOs 🙂
Hey, i have doubt that why would we even invest in fund with a negative sharpe ratio rather than just investing in G-Secs
Not sure why people would do that. But remember, you can invest when ratio is +ve, but the Sharpe ratio can go -ve as the market conditions change.
hey, may u explain in simple terms how the size of the AUM affects the returns of the fund
The larger the fund grows, the smaller the opportunity set for the fund, Tejas. Liquidity becomes an issue.
and also the [BARODA BNP PARIBAS Corporate Bond Fund – Defunct Plan – Growth Option] still exists
Yeah, please see my previous comment.
many funds are still active and there NAV\’s are also updating daily like:-
– Franklin India Debt Hybrid Fund – Plan A
– Franklin India Corporate Debt Fund – Plan A
– Aditya Birla Sun Life International Equity Fund – Plan A
– Aditya Birla Sun Life Banking & PSU Debt Fund – retail
If these funds don\’t exist then how are they still running
If its an old plan, then it will continue to run. New subscriptions maybe closed.
and also what is a defunct plan like BARODA BNP PARIBAS Corporate Bond Fund – Defunct Plan – Growth Option
I think the fund no longer exists.
while looking at some mutual funds I saw that there are other options other than direct and regular like (Aditya Birla Banking and PSU fund had a direct plan, regular plan and a retail plan) so what are these \”retail plans\” and why these plans are not available on coin to buy
Like this only I found that many had mutual funds plans like Plan A, Plan B, Plan C etc. So what are these funds.
Some funds had these institutional and retail plans. There\’s no such thing now. Maybe you are looking at old details.
Thank you sir, I figure Pid none of the free software have the plan.
My best bet is to email fund houses and try to get the data.
Another question please, what’s the best way to invest a lump sum into MFs?
Example: I have a sip of 100000 currently, I define anything above this amount as lump sum.
I invest my lump sum amount in a liquid or arbitrage fund and STP it over 6 months to the fund I want to invest in.
How to I decide the number of months to split my lump sum amount ?
Please advise!
Yes, you can park the excess in an arbitrage fund and invest that in EQ funds.
Hello Karthik Sir,
Love your content, I would need a small help here if you can.
From the past few weeks, I have been trying to find a software that is able to give me data on a mutual fund\’s history of market cap weighted distribution of its stock portfolio.
The ones that give me such data such as finalyca cost upwards of 100000 per year. The free ones like morning star and advisorkhoj show only the present data, not the past.
Would you please help me out with a few software suggestions, if you any idea?
Thanks for the time!
Suhas
Suhas, your best bet is Morningstar or ValueResearch. Else, you will have to compute this manually by looking at the portfolio disclosures, which I think will be a painful task.
Great content and amazing piece of writing. Learnt a lot from the chapters. But I am more subjective to analyse mutual fund rather being highly focused on numbers and ratios. So I would wish to know that how one can analyse fund manager\’s past and current performances?
In that case, you will have to dig in more about the fund manager\’s past, all the funds he/she has managed, the performance of that and stuff like that. Basically the qualitative aspect of fund management.
Sir,please can you make a small video on how to construct the volatility cone which is in Options Theory for Professional Trading Chapter 20
Noted, will try my best.
Hi..
Creation of a pension plan is central to most of the discussion / advice here on this site and on other similar sites…. can you include a chapter on mutual fund portfolio creation for people whose pension is assured (government employees including defense services). The salary structure for this group is generally stable in terms of nominal increase (DA) of salary once/ twice a year, mandatory savings like PPF (1.5 lakhs a year), compulsory departmental insurance (for defense services) etc …
That makes sense, Pranay. I will try and add that topic soon.
I have a question. Although I feel as a beginner one should not invest in equity fund that is 1-2 years old. But still if I want to invest in it then which factors should be considered? I feel any numerical information about fund will be useless as its very new so we are only left with knowing the history of fund manager.
And one thing that attracts new funds is they have low expense ratio initially.
What are your opinion on this? and also is the criteria same for New fund offerings that are yet to come.
Anyways thank you so much Karthik sir for providing valuable information.
Like you mentioned, I\’d not suggest EQ if its just 1-2 years 🙂 But if you insist on doing it, I\’d suggest an index fund.
Hii, sir
First of all, thank you very much for such a legendary resource. I have never seen anything like this before in my whole life. The amount of simplicity and detail it offer is wonderful. I love you sir and each and every person who is behind this project.
Second thing is where do we check the historic returns of atleast 10 years given by various indices like nifty 50, sensex, nifty next 50 and others. Is there any website, I did\’t find it in a fruitful manner. I tried to google it or maybe i don\’t know what to search for. Hope you can tell.
Third thing is can you make a similar guide for selecting right index fund as well. This chapter was more on selecting active mutual funds not on passive.
Fourth thing is what are some of the best resources you have came across in your life of any subject area under the sun, simliar to zerodha varsity of any other subject, which you personally like. You can tell us your favourite info binge read / watch type blogs, channels books. Name of authors, writers and some other peoples whose work you consume mindlessly because they are so great and you want to consume every thing they have to offer. One such person in my life is Karthik Rangappa sir.
Give us some books, blogs, authors and writers to read recommendations.
Fifth thing is what is your secret of writing in such an elegent manner. The kind of simplicity you offer is something of a very rare writing skill. What is your secret sauce if you want to tell us. You really amaze me many a times in your writing and i hope to become better at writing.
Thanks for the kind words, Vipin. It means a lot 🙂
I think 3rd party sites like money control should offer the returns data. Else, you can easily calculate this by applying the CAGR formula.
About index funds – primarily, the thumb rule is to opt for the fund with the lowest tracking error and expense ratio.
I am interested in non-finance topics – from photography to amateur star gazing. I follow and watch a ton of videos on Youtube 🙂
About secret sauce, I really don\’t know. But one thing I consciously try and do is to not use complicated jargons 🙂
Thanks dear Karthik.
Dear Karthik R.,
Once again thanks for your prompt response.
Before I take a call whether or not to consult a RIA, one last query (probably).
In your reply to me on 27.8.2022, you had advised to identify best funds in large cap. How does one do it?
Regards and thanks.
Few parameters – portfolio, fund size, fund house, 10-year rolling returns, risk parameters etc 🙂
Dear Karthik R.,
Thanks for your very prompt response.
To figure out the best Large Cap or any other category funds, is it advisable to look at their star ratings given by say Crisil, Morning Star, Value Research, Rupeevest? Or any other?
Should we restrict ourselves to 5* and/or 4* and/or 3*?
Or you would suggest a better way to initially figure out the best performing funds?
Regarding identifying few AMCs I can trust, I wish to submit that there was a time when I trusted HDFC MF and Franklin Templeton MF when I started investing in MFs, many summers ago. Now both have failed me.
Currently I have exposure in 9 AMCs. Because I am a retired person and am scared of keeping all my eggs in very few baskets.
My present interest is to weed out the under-performers and shift the proceeds to top-performers in the same category. This is where I am putting your suggested methods to use. I very much wish to adopt your teachings, as I am thoroughly impressed with your infinite knowledge and the way you disseminate it for good of all, but the scale daunts me.
Please guide,
Regards,
Hemant.
Blindly going by star ratings may be futile as they may give more weightage to recent performance. Exposure to 9 AMCs is quite a bit, assuming 9 funds minimum. If you find it daunting, then maybe you should consult a paid advisor to help you navigate this. Check out prime investor, I\’ve heard good things about them.
Dear Karthik R.,
Firstly, allow me to register my great appreciation of what you have done by compiling this exhaustive, detailed and analytical Module 11. This selfless service to the entire community of MF Investors (existing and would-be) rendered by you is beyond any amount of words of appreciation. Kudos.
Pardon me if I have missed the relevant portion while raising my query, which has been already addressed somewhere in the module. Please guide me to that section.
My query:
As per a simple Google search and information available on AMFI website, there are 44 AMCs, 12 Equity-oriented categories/ sub-categories (as you prefer to call them), 365 schemes.
In the above Chapter 24, you have very well explained how to do fund analysis (which is the critical activity to segregate the good tomatoes from the bad ones).
But I could not comprehend form where to start, when you have 44 AMCs, 12 Categories and 365 schemes amongst them?
I am sure you didn\’t want an investor to put all the 365 schemes to test.
Please enlighten.
Thanks in advance.
Thanks Hemant. YOu can start the reverse way – for example if you are interested in investing in large cap, figure which are the best funds in largecap. Automatically you will weed out 50% of the funds, and narrowing it down becomes more manageable. Or even better, identify few AMCs that you want to deal with, whom you trust more. You can then explore funds from those fund houses only. Basically, you need to figure a method to eliminate it.
yeah ! they can\’t be considered safe as they also invest in equities but what I was concerned was that, on that site they were placing and comparing index fund along with the active funds isn\’t that just unfair and a wrong way to rank or analyse a fund
Yeah, some separation in categories will be good.
I recently landed on a website which gave ranking to mutual funds using their own methods \”as they claim\” but what I found confusing while exploring was that when I filtered equity funds with large cap funds and set my risk appetite as \”very high\” , they were also showing index funds in that category.
I found it weird as index funds are considered a safe form of investment, am I thinking wrong
Index fund is not really safe. It still have risks right? Its just that an index fund is a cheap form of gaining large-cap exposure.
Hi Karthik sir,
What is portfolio turnover ratio.Mentioned 8n face sheet of Fund.
The rate at which stocks are bought and sold in the portfolio. Lower the better.
should the AUM size be considered while investing in a mutual fund
sorry, I meant that \”the fund\’s AUM size should be considered while investing in a mutual fund or not\”
Yeah, its good to take a look at the fund size.
so the fund should be considered while investing in a mutual fund or not
Yes, it should be, right?
why is there a general believe that when the assets under management increases it negatively affects the fund returns
Because it is really tough to allocate money in markets 🙂
You mentioned that the in the 3 year rolling return the fund has consistently outperformed the benchmark. That means either fund is taking unnecessary risk or it is compared to wrong benchmark. How did you rule out the possibility of wrong benchmark?
You can compare the fund\’s portfolio (and its mandate) with the benchmark and figure out if its the correct benchmark or not.
where can I get the past NAV\’s of a mutual fund scheme I searched it on the AMFI website they don\’t have an option to select a particular scheme of a mutual fund and the maximum period which can be selected is 90 days
Best bet is the AMFI site. They may have changed the location. Else try Morningstar.
I bought the subscription. don\’t think its very helpful. haha.
Dear Karthik. For example in this case, both Nippon Sensex Index Fund and HDFC Sensex Index Fund have very limited info.
ONLY 3yr info available on SD/Beta/Alpha on Value research.
NO capture ratios on Morning Star.
(ps: I have tried getting this info for the regular plan, but no luck there either).
Will the premium subscription of value research be helpful in getting additional objective info? (not their analyst rating/reco)
Thanks in advance 🙂
I\’ve actually not used the premium service, so don\’t really know 🙂
Dear Karthik – I\’m finding it very difficult to collect the information (which you have described in this chapter) even using multiple sources. For example, an 2013 index fund – SD is available but its category avg is not (across 3-5-7 yrs). Sharpe, Beta and Alpha only available for 3yrs period. capture ratios and Return-Risk matrix not available at all (actually morningstar website seems to be very bug-sy).
Could you suggest a 1-stop/single source to get data, even if it requires subscription?
Abhinav, usually between value research and morning star we pretty much get everything that is required. Not sure which sources you are looking at.
Hi Karthik,
This is very useful read. I am investing in ELSS for tax saving since 4 years.
Some of the units are avaialble for redemption.
Does it make sense to redeem that and invest in Large Cap or Midcap funds ?
Also i have started investing in Midcap funds . I am 28 and have a goal around 16 years from now
Yeah, but mine is a personal opinion and I\’m not a big fan of ELSS funds. Do check with your advisor once 🙂
Amazing article Karthik!
Happy reading, Anupam!
Thanks, Karthik.
Good luck, Anish.
Thanks, Karthik. Also looked in the COIN app. It is indeed 8.75% of TREPS and 1.3% of Fixed Deposits which forms the debt allocation.
Sure, TRESPS are safe, both on credit and interest. Its almost like cash.
Thanks for the explanation, Karthik.
Wont stress on CRISIL for EQ.
Also. I did check the debt allocation and it is around 10% -> https://www.valueresearchonline.com/funds/15690/axis-midcap-fund-direct-plan.
Anish, debt is usually to the extent of servicing redemptions. 10% is slightly high, but I guess its worth it to take a look at what sort of papers these are. CRISIL ratings for these papers is worth checking.
Hi Karthik,
I was doing this exercise of finding a mid-cap fund for my goals by following the steps mentioned in this chapter. I selected two funds Axis MidCap and PGIM India MidCap.
The hygiene checks, rolling returns, risk/return matrix, and capture ratios all pointed me to lean onto Axis MidCap. For all these checks I used valueresearch and morningstar.
But when I checked moneycontrol the crisil rating for Axis MidCap is 3* but the PGIM India MidCap is 5*.
At the risk of sounding stupid, I have a few questions for you on this:
1. Should I be worried about this crisil rating and is it because of the stocks that are held in the Axis Fund portfolio.
2. Both these funds and a few more have some debt ratio to them. Axis fund has about 10% including FDs in their portfolio. Why do Equity MFs have a debt to it?
3. Is this the reason that Axis fund has performed better than the benchmark in the risk/return and capture ratios.
I am sorry if I have overlooked any discussions on these, if posted, earlier. Please do throw some light on it and thanks a lot for such a vast but simple finance curriculum.
Thanks,
Anish
1) I don\’t think CRISIL ratings would matter much for EQ fund, don\’t stress too much on this.
2) The debt component is mainly to the extent of servicing redemption. By the way, 10% sounds a bit too much for an equity fund. Maybe you should check this again.
3) Could be because of a variety of reasons, I guess it is fair to attribute it to bull markets and I guess the fund manager\’s skill 🙂
Good luck and happy learning 🙂
Hi Karthink Sir,
I am planning to invest some amount in pure Equity funds too but for a different financial goal.
For this particular financial goal, I would prefer the investment to experience less volatility hence thinking about a hybrid mutual fund. Please suggest.
Sure, Kulbir. You need to align your financial goal with the right fund with the right risk exposure.
Category average – Value Research way of finding the category average vs Morning star is totally different. I tried comparing the values given. Does not match. Similarly i checked in other third party sites. Looks like there is no standardization to find category average.
Ex- Morning star to find category average for Large cap includes 258 funds (all options type). Whereas in Value research website, it is shown as around 70 large cap fund types. Bit confused.
Pls explain or clarify this.
Possible, Ravi. There is no standardization of reporting, but think of it, if there were standardized, we\’d not need so many platforms 🙂
You need to figure which one represents your needs better and stick to that platform.
Hi Karthik Sir,
I am planning to invest some amount each year in a Hybrid Mutual Fund(with an investment time frame of 10 years) with a distribution of 25% for Equities and 75% for Debt. As Hybrid funds tend to be less volatile and are more consistent in terms of returns, hence I am planning to opt for it. Another advantage that I see with Hybrid funds is that they try to capture the best of both, the Higher Returns that come with Equities and the Lesser Volatility that comes with Debt.
I am certainly planning to use the analysis techniques suggested by you to filter out funds. Please suggest your opinion on Hybrid Funds in terms of Expected Returns, Risk Associated, Positives & Negatives.
Kulbir, just that when you have 10 years as time frame, why not consider pure equity funds?
When investing in an index fund, how important is the fund AUM (relative to AMC AUM)?
The reason for asking is that I\’ve identified a great index fund (low expense ratio, low tracking error, fair returns) but the fund aum is quite small (above 100 cr but about about 0.16% of the amc aum in equity category). How should I approach this?
It helps to check the AUM, I\’d avoid very low AUM funds, but in the Indian context anything higher than 1000-1500Crs is good enough.
Sir the fund I invested was first in risk metrics,ratios and returns now in every parameter it is last
Index funds are supposed to behave similarly. Do try and investigate why the lag in performance.
Sir started SIP in ICICI sensex index fund in february,risk parameters are not good compared as it was 8 months back to other funds and underperformed index,should I consider to change the fund.
Did you check how other funds have performed? Chances are all these funds would have behaved similarly.
What is Portfolio Turnover Ratio in the fund sheet example?
The number of times the stocks are bought and sold in a portfolio is indicated in the portfolio turnover ratio. Lower the better.
Sir,
Can you explain what is meant by the term \’category\’ while doing comparisons.
Equity, Debt, Hybrid etc.
Hi, Thank you for such knowledgeable content.
One doubt:
You have written that \”The fund’s standard deviation (on a 3-year basis) is 20.58%; this suggests the fund can fluctuate 20.58% up or down over a 3-year basis.\” But isn\’t the SD mentioned on an annulised basis? So won\’t it mean that the fund can fluctuate 20.58% after a year?
Yes, but you can extrapolate it to whichever time frame you\’d want.
Hi Karthik,
Today, I have applied everything that you have taught on picking equity MF and picked \”Mirae Asset Large Cap Fund\” and \”Axis Bluechip Fund\” are the first two choices for me while buying \”Large Cap Fund\” for long term wealth creation.
Thank you for your lessons.
Sandesh Shetty
Wishing you all the very best, Sandesh. I hope these funds create the long term wealth that you aspire for. Good luck!
Sir, this is great content. There is a small correction. The point where you compare 3-year returns and say the fund underperforms, there the benchmark is S&P500 TRI whereas the fund\’s benchmarks in NIFTY 200 TRI. So it is not a fair comparison. I believe the site from where you picked your screenshot has got their data incorrectly.
Thanks!
Ah, let me check this. Thanks for pointing out Jaskaran.
I also had the same query. So how do we analyse?
1. Should i consider the 10 year returns or rolling returns while accessing a MF?
2. If 3,5,10 year returns is greater than the index, shouldn\’t the rolling returns also be greater than the index? How is being lesser a possibility?
1) Yes, please do, it gives you a good perspective
2) No, the way these two returns are measured is different, hence you\’ll get different returns.
Hi Karthik,
If I see Axis blue chip fund\’s 10 year returns, it is higher than the index – nifty 50 tri. But when I compare rolling returns between the two for 10 years, index seems to outperform the fund.
Why is this discrepancy happening?
It is not a discrepancy. This is exactly what the rolling return aims to unravel for you 🙂
Thanks Karthik for the response & clarification.
1. That\’s very useful
2. yeah, Coin data is matching with fund\’s website date.
Sure, good luck, Praba.
Hi Karthick & Team,
Thanks for sharing your wisdom & financial knowledge. This chapter helped me to analyze mutual funds, but I have couple of queries.
1. I was trying to rank ELSS mutual funds but there are many MF\’s and analyzing all may take time, how can we do the elimination?
2. Looks like the Expense Ratio is not matching between Coin (0.72%) and MF Fact Sheet (1.85%) for Axis Long term Equity fund as per morning star (https://www.morningstar.in/mutualfunds/f000005ntx/axis-long-term-equity-fund-growth/fund-factsheet.aspx), Can you please confirm if the value mentioned on Coin is correct?
Thank you,
1) Not an easy task. But you can start by using capture ratios
2) Let me check this
3) We get the data from a vendor, I guess this is correct. But you can always cross-check on the fund\’s website directly.
hello sir , sir in other modules we have an option of certificate in mobile app . But this module is not there in mobile app so no certificate option . When will this option be available ?
We are yet to upload this on the app, Rajat. We are working on it.
hello sir ,
when an AMC benchmark NIFTY 50 and try to outperform it but it is hard to do so , as you said . so sir why we should invest in MUTUAL FUND of any AMC , why don\’t we directly invest in NIFTY 50 , after all NIFTY 50 investment will even save us from heavy charges of AMC
The idea is to invest and try and generate alpha. I know its easier said than done 🙂
Very informative. Loved the approach as well. Would also like to see how to compare 2-3 mutual funds and decide. Also when to periodically review the fund in which we have invested and how.
Thank you.
Good luck and happy investing, Umang.
Hi, You have analyzed that has 10 yrs worth of historical performance data, however most of the direct funds don\’t have more than 5-8 yrs worth of data for analysis. As you have said looking at data for 5+ yrs is more credible, how do we conclude on whether to in a particular direct fund or not? Thanks in advance.
You can look at the data for regular funds, you can easily profile the fund with the regular fund data.
Thanks for taking your time to reply my query.
Good luck, Ashok.
Hi Karthik , I have one doubt if i can ask. I am putting money monthly into my 401K(retirement plan) through my employer. By default, they have a fund like it will invest 90% into stocks and 10% into bonds(corporate bonds and US treasury bonds). After 2026, annually they will start reducing the stock allocation and increase bond allocation and it will continue until 2046 – 2050, because fund target 2050 retirement. But what i did is, i changed the default plan they gave and started putting all the 100% into the index fund which tracks S&P 500. I want to ask your suggestion, is that the move is good or should i return to default fund which they assigned me initially or i should choose something else other than these two funds ?
Ashok, the Index fund is fine, especially if you have a hyper long term investment horizon. By hyper long term, I mean at least 15 years plus.
I see. Thanks for the prompt replies Karthik! 🙂
Good luck, Ayush!
Hey Karthik, I still don\’t understand how having a smaller AUM enables a fund to take positions quickly. Can you explain it a bit?
Imagine there are shares worth 1000 Rupees in the market. There are two people wanting to buy these shares, one person wants to buy for 100 Rupees worth of shares and the other guy wants to buy 800 Rupees worth. Who do you think can easily get what he wants without disrupting the market dynamics? The smaller guy right?
When you talk about smaller funds having an advantage in terms of nimbleness, what do you mean by nimbleness?
In terms of quickly taking on positions and exiting the same.
Sir should we need to fill e madate form for sip in coin
E mandate is good (not mandatory) as it makes you commit a certain amount of money every month.
Sir ICICI sensex index fund has done well but the fund was started in 2017 more data available for this but 5star rating other metrics like beta,alpha..or better compared to other funds which have low sip facility
Since the date available for this fund his only 3years should I ignore this
Its ok, you can ignore these for Index funds.
Sir as I told I\’m student I don\’t have any income source I decided to do sip for 100
While I was looking at funds which have low sip facility I found some funds
UTI Mastershare fund largecap when compared to similar funds belonging to this category I choose uti\’s scheme interesting but the UTI scheme is underperformed the benchmark senxex100 tri for 3,5,7years but did well compared to other funds like ABSl frontline equity..other funds similar to this
Finally I found icici sensex index fund metrics were gud when compared to other funds, but the fund was started in 2017 I got only 3 years returns is it ok sir
Any suggestions sir however my time horizon is for long term say
It does not matter since when the Index fund was started, the job of the fund is to track the index, so as long as it does that, its good enough 🙂
If fund is performing bad then benchmark should it be concern for someone
But the fund is doing well compared to other large cap funds
Sorry, dint get that. Can you elaborate a bit?
Sir risk and performance ratios are not same on each website, it\’s differing from each website I most reliable I found out value research is good but for risk ratios it only gives 3years data
It gives 5 years data if the fund is older than 5years. Do check for that once.
Sir it\’s large cap fund benchmark against nifty50tri where the index beta is 0.84
Where I assumed when fund has beta of 0.94 is more volatile then index
I found for more funds like this in morning star
Ah ok. I\’m not sure what that really means. I need to check as well.
Sir for beta in morning star they have mentioned beta for index as 0.84 it must be 1 right
And fund has beta of 0.94
Depends on which index. The beta of Nifty 50 and Sensex is 1.
The most useful article on mutual fund on internet. Thank you, sir
Sir, Between large cap fund and Index fund which is better for long term investment ?
Both.
Good morning sir,
I have a doubt regarding Short sell,
Lets saý I have 1000 Rs in my Demat a/c. When I want to buy any stocks for intraday, i can completely utilize my capital. But when I want to short a stock, Is it mandatory to have enough margin in account for exiting the trade (buy) ??
Example – If I want to short XYZ stock, then Can I utilize entire 1000 Rs. capital for it or I can only use 500 Rs. for selling and remaining 500 Rs. for exit (buying) ?
(Ps- I am asking this Because recently i faced similar situation, where the zerodha portal showed Insufficient margin For closing my short trade, So I had to add funds to the account in order to complete the trade)
Thank you,
YOu can short to the extent of the funds available to you.
Hii sir,
You mentioned, \”Check the Alpha and the beta of the fund to get a sense of fund’s performance compared to the category\”.
Here, what exactly the category refers to ? Is it equity/debt category or Market-cap based category ?
Yes, the category is the one to which it belongs. For example – Equity Fund (main category), within which you are looking at a multi-cap fun. So here the category is – Equity/Multicap fund.
Hi Karthik,
I have been investing in Mutual Funds for the past five years through Regular plans via SIP. Most of my funds are performing below average. Thanks for your course material I was able to figure it out. I have couple of questions
1) Is it good to withdraw the funds from the current plan and invest the corpus in new funds and start SIP for the new funds?
2) Shall I start SIP with new funds and keep the existing funds as such?
1) Yes, but before you do that make sure you are doubly sure that it is fund specific underperformance and not
2) No keeping underperformers 🙂
Thank you kathik for your valuable inputs; now it will be easier for me to understand the MF before investing. TBH earlier I had a different perception on \”how to analyze a fund\” now I have a completely different understanding.
Hope this new understanding is better and makes more sense 🙂
Hi Karthik
First of all let me thank you for wonderful material that\’s present in the platform, it\’s absolutely amazing to learn.
Next up, a question
I recently started my career and I\’m looking to save money for my higher studies which I will be using let\’s say in 2 years from now. Which type fund do you think should I go for considering taxation, short period of time etc?
Since you need the funds in 2 years, there is no question of a pure equity fund. I\’d suggest you look at short duration funds or arbitrage funds.
Hi Karthik,
Loved reading this module too.
I had so much misunderstanding about mutual funds. There is no better content anywhere else regarding finance and the share market. Thanks to you once again for being a gem in helping us create a better future.
Looking forward to learning more from you. hopefully will try to see you live someday at any conference or meet.
Thanks again !!!
Thanks for the kind words, Ganesh. I hope you continue to like the content here 🙂
I had purchased SBI Nifty index fund lump sum and sold after 2 months, with a gain of 23k rupees. Will it be considered for STGC or counted as income as other sources this attracting income tax? If STGC, it should be exempted as the gain is below 1 lakh?(assuming no other redemptions this year).
That\’s right. Please do get an opinion from your CA once.
My biggest goal is to be rich enough that I can afford Supercars\’ to gift my friend on his birthday without thinking so much.
Thank you so much for encouraging me to start trading. I am feeling like a Superhero😎.
May GOD bless you😊.
Good luck and I hope you get what you want!
As you know(maybe) I have 3 lakh and I am about to be 18. What would you do if you were in my place? Please elaborate and I have an extra 60 thousand to trade but I am going to trade with only 10 thousand(I will open my brother\’s account in Zerodha😊 in 2-3 days). I have been learning the stock market for the last 4-5 months and I have read your Introduction, technical, fundamental, future, market, and taxation, risk management, and trading psychology, 7 chapter\’s form trading system, personal finance, and finally going to read inner worth. I am going to start my career as a Trader. What do you think? Is it a good decision.
What you need to do, depends on your financial goal 🙂
If you have no goals at this point, then perhaps retirement is a goal. If I were you, I\’d invest the money in maybe an index fund. As far as your approach to trading goes, yes, start with 10K, don\’t risk more. Keep learning and analysing your trades. Markets will eventually show you way 🙂
Good luck!
The fact the such quality content is available is really surprising. Thanks a ton guys. Will always be indebted!
Happy reading!
Hi Karthik,
Thank you for this exciting chapter. When can we expect the next chapters? 🙂
By mid-next week, hopefully 🙂
Hey… what an amazing chapter… how many chapters left in this module and when will the pdf be realeased
Couple of more, Yashas 🙂
Chapter 24: How to analyse an Equity Mutual fund?
This chapter has been euphoric moment for many of your follower.. I am sure next chapter would be orgasmic..!!!
The simplicity in your explanation of complex statistical parameters and common sense approach to short-listing of mutual funds is absolutely amazing and praise-worthy. Hats off, Karthik.
Jatin, thanks for the kind words. I\’m glad you liked the content. I\’ll try my best to put up the next chapter as soon as possible.
Hi, A super informative module.
Is there any website/ tool where we can check rolling returns for SIP in a fund?
Thanks.
Hmm, that will be really nice. Not sure where that is available.
Thanks for your hard work Karthik sir.
We can rank MF\’s ourselves now. Though the fund rankings does help in filtering out terrible ones.
I agree 🙂
How can a biggner learn about mutual,Is any book if yes then plz suggest the name??Relavent YouTube channel??
What else would you like to learn?
How does the increase in AUM effect the return or funds performance as a whole? Can you shed some light on it?
It is expected that as the fund size increases, it becomes difficult for these funds to identify opportunities and invest. Market size is shallow. Hence the drop in performance.
negative alpha.. beta 0.95..
isn\’t this indicative of benchmark hugging?
Isn\’t the shrinking of outperformance also indicating the same?
Shouldn\’t an investor just go for a cheap index fund rather?
Yes, makes sense to own an index fund at a cheaper rate.
Finally a new chapter and I believe one of the most important ones of the module at that. I hope the next one comes out even sooner 😉
I have a question though not specific to this chapter, If you are investing lumpsum in a MF, is it more logical to add additional funds to the ongoing holding of the same fund(say adding 50K more after a year to that holding) or is it logical to start a completely new holding of the same fund(say invest afresh in the same MF from scratch with the 50K and keep the earlier ongoing investment as it is)?
Ajay, it depends on your financial goals. Say you started \’Portfolio A\’ in Jan 2020 with a specific financial goal in mind, and start investing systematically in this portfolio every month. In Jan 2021, you have a lump sum to invest, but there is no new financial goal, then you may as well plough this money in Portfolio A and accelerate your investments to the financial goal. Alternatively, if you have figured a new financial goal after starting portfolio A, then you may want to divert this new funds to either portfolio A or the new portfolio.
Sir I know mf module is a big hit, but I\’m eager to know what the next module is going to be on sir. I have taken a few very good positions on equity based on your research methodology. So I\’m not very excited about this module sir. I hope you don\’t take it the wrong way. Could you let me know what the next module is going to be on? Thank you.
The next module is about building an integrated financial model, its very useful in business valuations. I\’m very excited about it. But I can start work on it only after I complete this module gets completed 🙂
Great content!!! I have been waiting for this. Thank you so much 😊
Hope it was worth your wait, Mukta 🙂
Where can i find the fact sheets of all mutual funds? And can you guys integrate them with coin?
You will need to visit the fund\’s page on coin or the AMC\’s website directly, Anurag.
Finally it\’s here!! Was waiting desperately.. Thank you so much Karthik sir
Hope you liked it Ketan!