
21.1 – TER savings
I probably should have discussed this in the last chapter itself, but don’t know why (and how I missed it). While we discussed TER, Direct, and Regular plans, I should have perhaps given you an indication of how much one can save by opting for a direct plan. So before we discuss mutual fund benchmarking, lets quickly address the savings bit. Also, this is my last attempt to convince you to switch to direct MF investment as opposed to regular MF.
You can do this little experiment yourself.
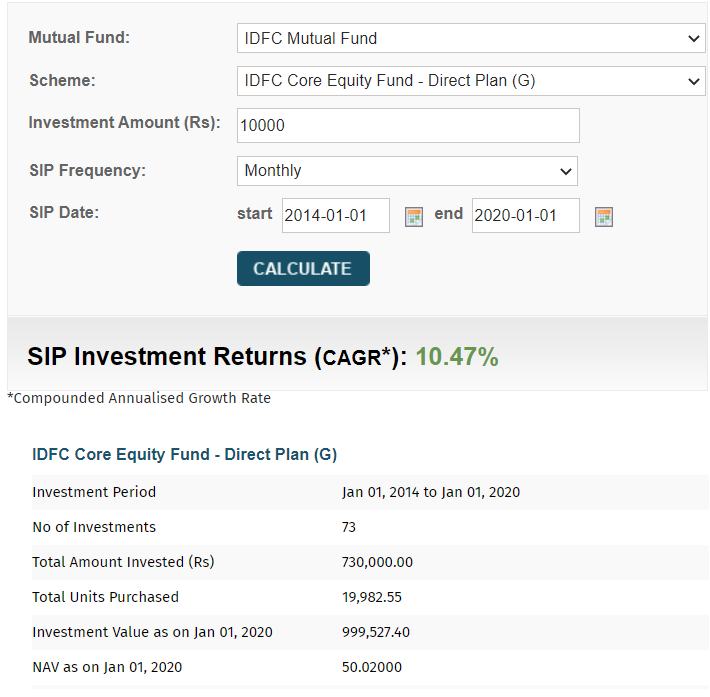
Pick any Mutual fund of your choice. I’ve picked IDFC Core Equity Fund, Growth. Arbitrarily assume a starting date and a SIP amount, I’ve picked Rs.10,000/- as the monthly SIP amount, starting from 1st Jan 2014. I further assumed that the SIP is continued over five years, i.e. till 1st Jan 2020.
I’ve used a standard SIP calculator (I’ve used the one on Moneycontrol) to see the performance of the SIP in this fund. Here is the result –

There are a couple of things you will notice here –
- The CAGR (or XIRR to be particular) is 8.84%
- The total amount invested is Rs.7,30,000/- across 73 months.
- The total number of units acquired is 20,772.43
- The value of the investment after 73 months of regular investment is Rs.9,52,000/-
This is a reasonably standard SIP performance. Now, repeat the same activity with the same fund, but in the direct option, i.e. IDFC Core Equity Fund, Direct, Growth.
Here is how the performance looks like –
Compare the performance of the direct option with the regular option. I’ve tabulated this for you so that it’s easy for you to compare –
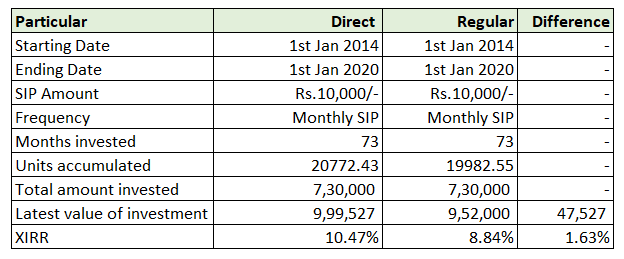
In the direct fund, you would have accumulated 19,982 units, slightly lesser than regular funds. But do recall from the previous chapter, the value of units in direct funds is always much higher compared to the regular fund.
As you can see, the investment value in direct is Rs.9,99,527/- versus the value of Rs.9,52,000/- in the regular fund.
The difference is Rs.47,527/- or about 6.51% when compared to the initial investment amount. Where do you think this money is going?
Well, the money is going to the distributor for having advised you to start a 10,000/- SIP five years ago.
Now obviously in the direct fund, the distributor does not make this commission. Hence the returns are higher, this is quite evident when you look at the XIRR as well – 10.47% Direct Fund XIRR versus Regular plan’s 8.84%.
Which implies, that every year you end up paying 1.63% of your investment value as commissions.
Do yourself a favour, and please switch to direct funds 😊
21.2 – Benchmarking and TRI
Moving forward, I guess we need to spend some time to discuss the concept of ‘Benchmarking’, in mutual funds.
Benchmarking, in the mutual fund world, is used to measure the performance of a fund. To put this in perspective, think about an aspiring athlete, say a runner named ‘X’.
X is practising hard for an upcoming running event. X’s main plan is to not only win the 100 meters race but also beat ‘Y’, another aspiring runner from the neighbouring town.

Now, in the practice run, X clears the 100-meter track in 14.5 seconds. Do you think he is in a good position to win the race?
It would be hard to say unless we know how much time Y takes to clear the same track, right? Assume, Y takes 13 seconds.
Now, who is likely to win the race? Y, right?
We were able to answer (or predict) this because we could benchmark both X and Y against each other. If we knew the speed of X or Y without knowing the other person’s running speed, then we couldn’t estimate who is likely to win the race.
This is called benchmarking. Benchmarking allows us to measure performance.
The same goes with Mutual Funds.
Every mutual fund sets itself against a benchmark and aims to beat that benchmark in terms of returns generated.
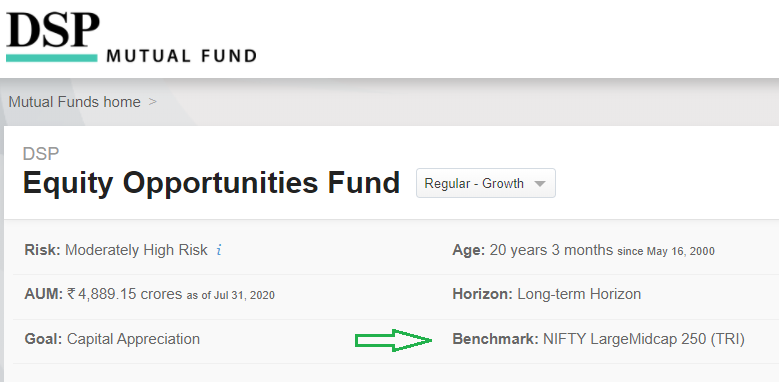
In the snapshot above, we can see that DSP’s Equity Opportunity Fund, benchmarks itself against Nifty 250 Index (TRI).
For example, a large-cap equity fund benchmarks itself against the Nifty 50 Index. The idea here being that the large-cap fund should beat the index in terms of returns generated on any timeframe you choose to measure – it could be 3, 5 or 10 years. In general –
- The MF generates higher returns than the benchmark; then the fund is said to outperform
- The MF generates lower returns compared to the benchmark; then the fund is said to have under-performed
To put this in context, assume an Equity fund generates 12% CAGR across three years while its benchmark, i.e. Nifty 50 generates 10.5% for the same period. In the case, the fund is said to have outperformed. The excess return with respect to the benchmark is called the ‘Alpha’.
In this case, the Alpha is 1.5% i.e. 12% – 10.5%.
By the way, in the snapshot above, you must have noticed the ‘TRI’bit. TRI stands for Total Return Index. The total return index includes and factors in for dividends as well. Remember, when you buy a stock of a company, there are two sources of income –
- Price appreciation or capital gains
- Dividend income
Now, think about the regular index chart that all of us check. This chart captures only the price appreciation of the index. It does not capture the dividends issued by the index constituents. To get a sense of real returns an investors earns, one has to factor in for the dividends received by the company. The total returns index (TRI) captures this. So when we look at Nifty 50 chart, we are essentially looking a just the price appreciation chart, but when we are looking at the Nifty 50 TRI, we are looking at both price appreciation, and the dividends received.
Have a look at a comparison of Nifty 50 and Nifty 50 TRI, the blue line is TRI and red is Nifty 50 –
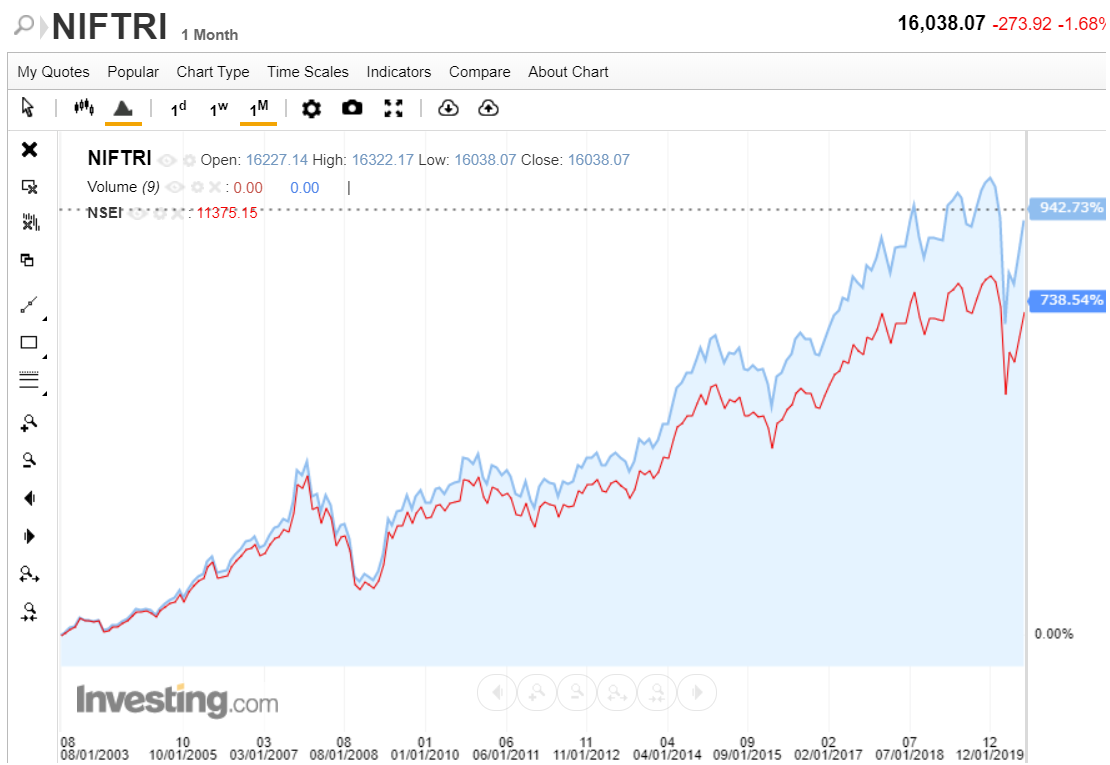
For the same period, TRI has posted an absolute return of 942% while the Nifty 50 has posted 738%. The reason why I’m talking about this is to let you know three things –
- For an index, its TRI avatar is always more valuable since it factors in dividends.
- MF’s use TRI as a benchmark; this is a recent phenomenon though. Earlier, MFs were benchmarking against just the price appreciation chart.
- It’s not easy to beat the TRI index. 😊
Alright, now that we have laid a foundation for our discussion for benchmarking, let’s take this discussion a bit deeper.
21.3 – Weights matter
Consider this, there are two mutual fund managers, A & B.
A manages a large-cap fund and benchmarks his funds with Nifty 50 TRI. B manages an Equity multi opportunity fund and benchmarks his funds against Nifty 500 TRI.
Which mutual fund manager here do you think will have a tough time beating their benchmark?
Nifty 50 has 50 large-cap stock, while Nifty 500 has not only the 50 stocks from Nifty 50 but an additional 450 stocks.
Intuitively, it feels as if beating the Nifty 500 TRI seems like a more challenging task. After all, Nifty 500 is diversified, has more stocks, lesser volatility, and therefore drawdowns are contained.
Well, but it’s not. The reason for this is interesting. Let me explain this.
Imagine you have created an imaginary index, call it the ‘High 5’ index. High five consists of the top 5 stocks across five different sectors. The constituents of the index are as follows –
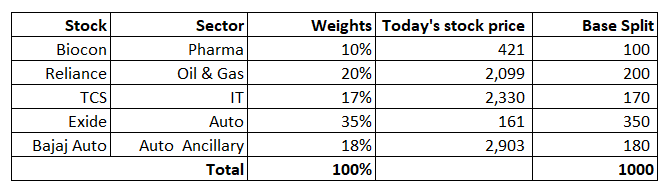
Each stock has a certain weight in the index. The starting value of the index is 1000; the Base Split column shows you the split of 1000 according to the weight of the individual stocks in the index.
With this, assume you start your index. After a few days, the stock prices have changed, which means the index value also varies. I’ve randomly assigned stock price values to the High five index stocks –
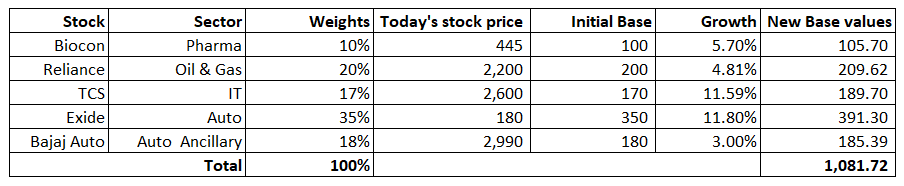
As a virtue of the change in stock price, the individual base values change, hence the entire index changes. Given the stock price changes, the overall index value changes, and as you can see, the index changed from 1000 (starting price) to 1,081.72, representing an absolute return of 8.17%.
Now, let’s not change anything in the high five indexes, let the stocks remain the same, the reference stock prices will stay the same, and even the starting value of the index remains the same.
We will only change the weights assigned to individual stocks and see what happens to the index values. Have a look at the snapshot below –
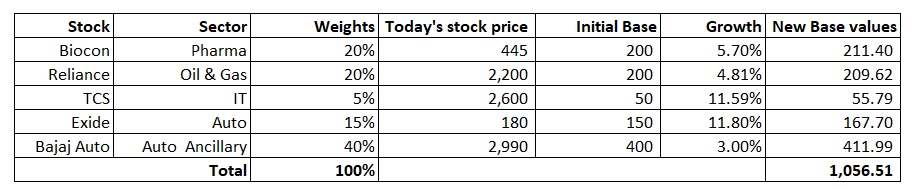
As you can see, the weights have changed. For example, initially, the value assigned to Biocon was 10%, which is not increased to 20%, Bajaj Auto was changed to 40% from 18%. Likewise for other stocks as well.
With the change in weights, look at the new base value, that too has changed from 1,081.72 to 1,056.51. With no shift in stocks, but with a change in weights, the returns have decreased to 5.65% from 8.17%.
What does this mean?
This means that the weights you assign to the stocks within an index matter the most. Whether you have 50 stocks or 500 stocks in the index is pointless, what you need to look at is the weights assigned to each stock.
For example, in Nifty 500, the top 10 stock has a weightage of nearly 45%, the top 25 has a weightage close to 65%, top 50 has nearly 85-90% of the weightage.
The rest 450 stocks exist, for the sake of it. 😊
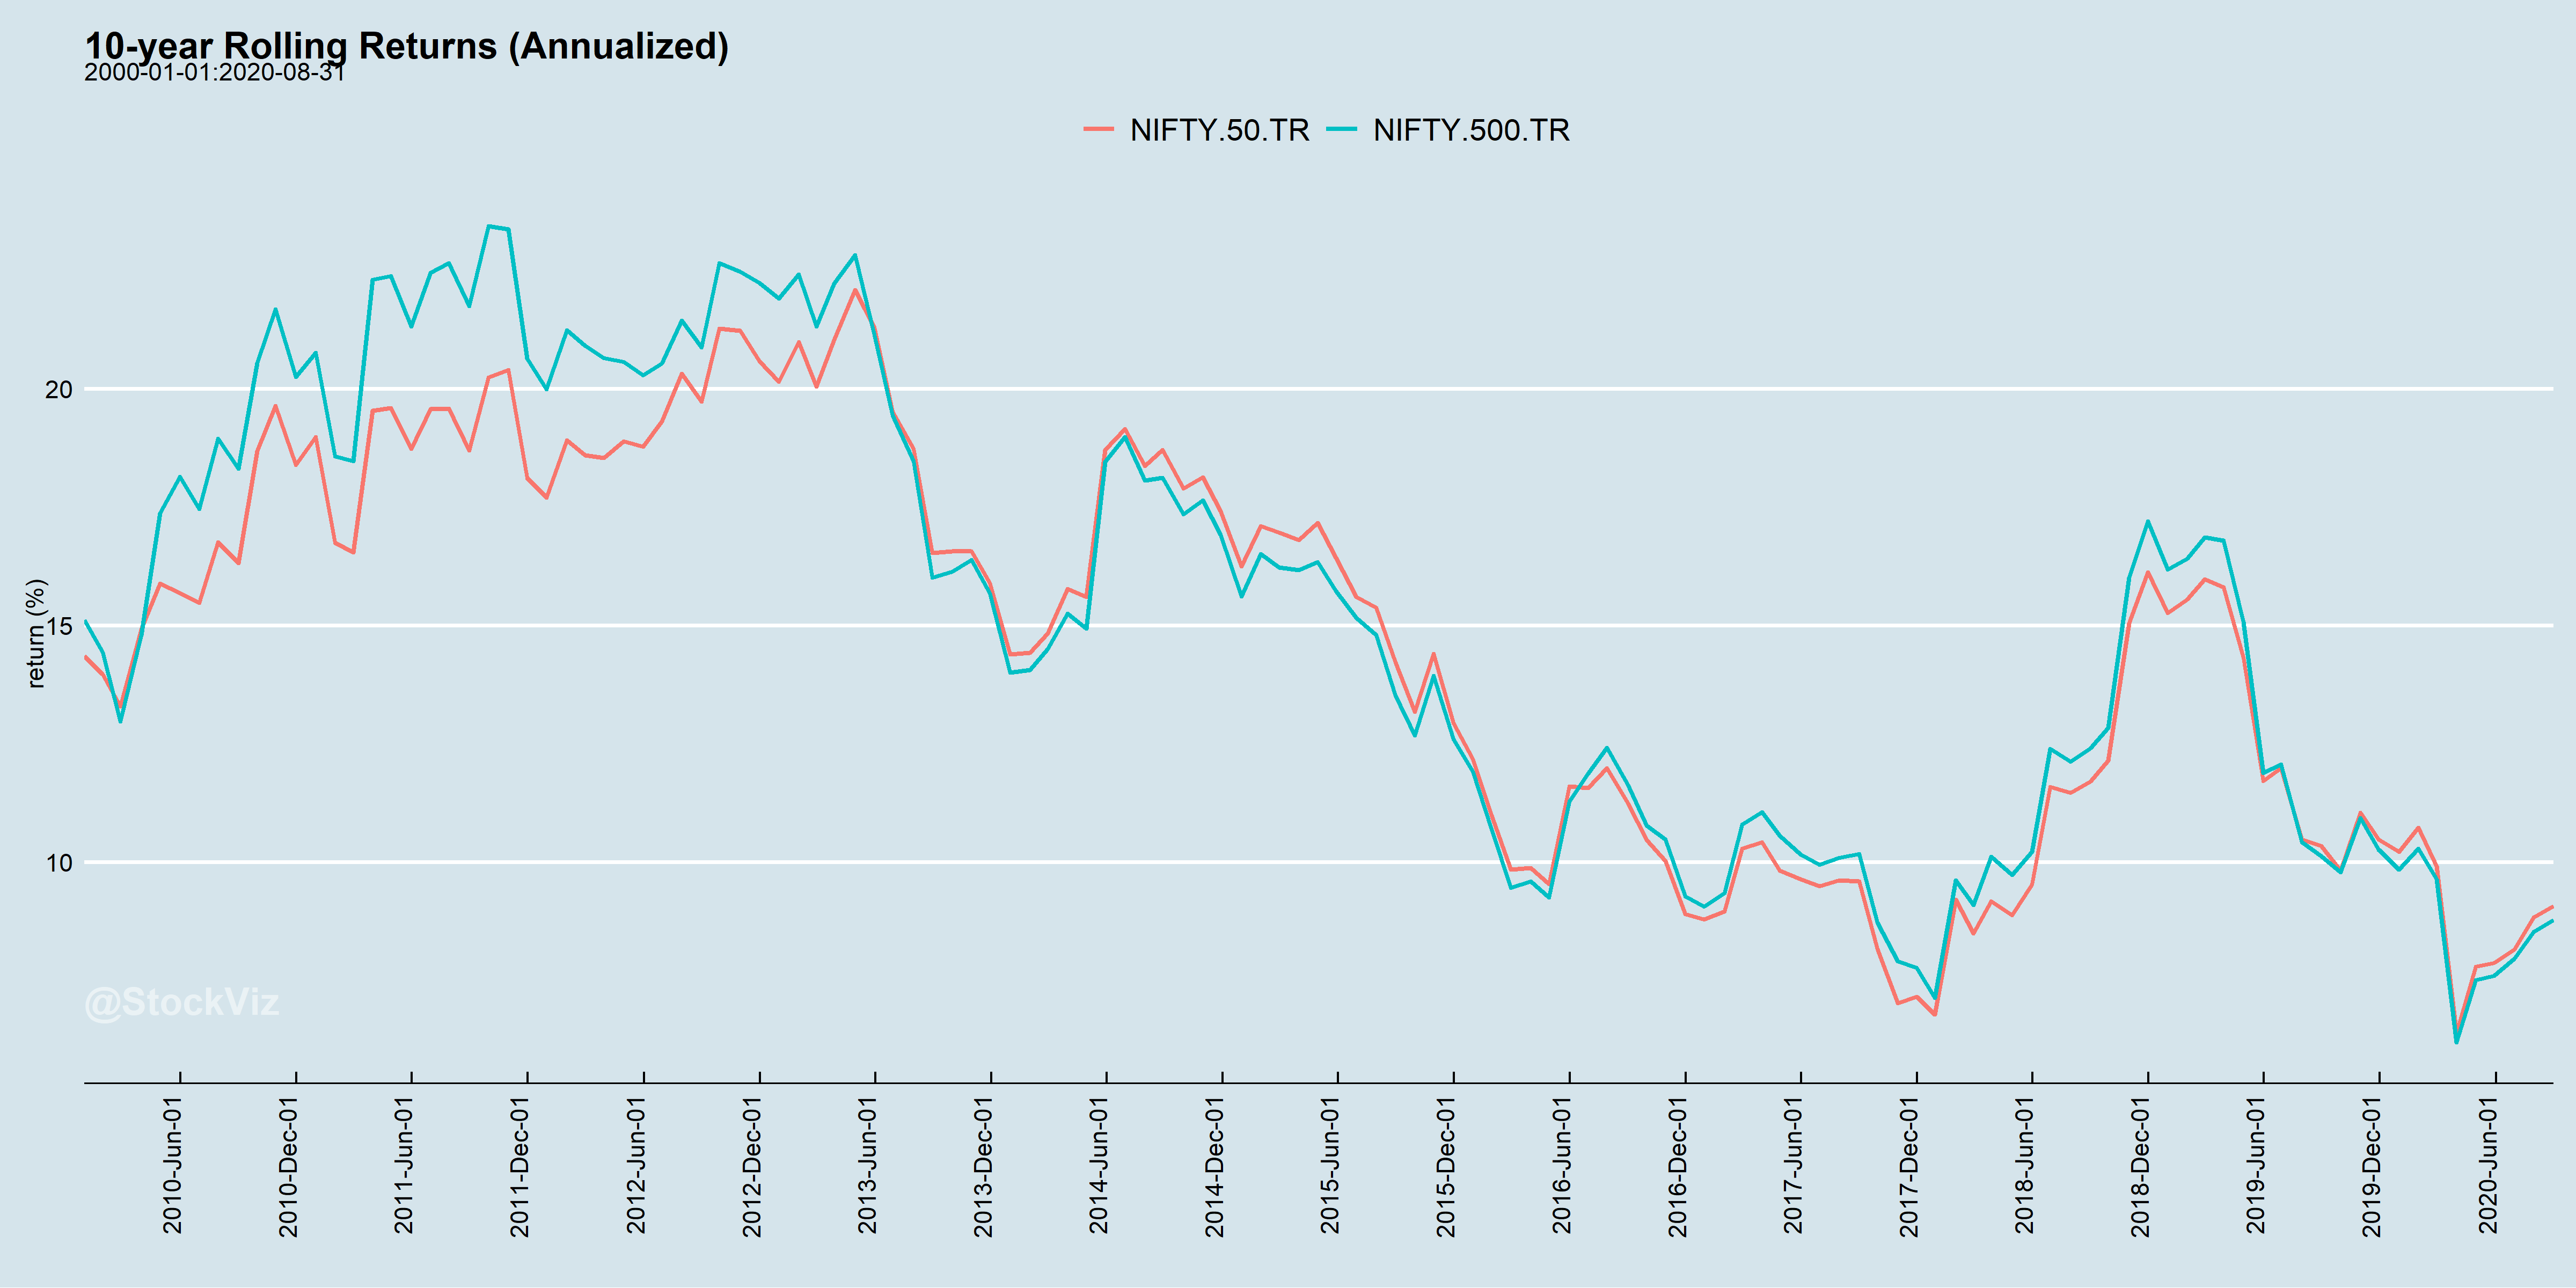
To put this in a more meaningful context, do check the rolling returns of Nifty 50 TRI and Nifty 500 TRI.
The chart below is the 10-year rolling return of both Nifty 50 TRI and Nifty 500 TRI starting from 2005 –
And the one below is the 5-year rolling return –
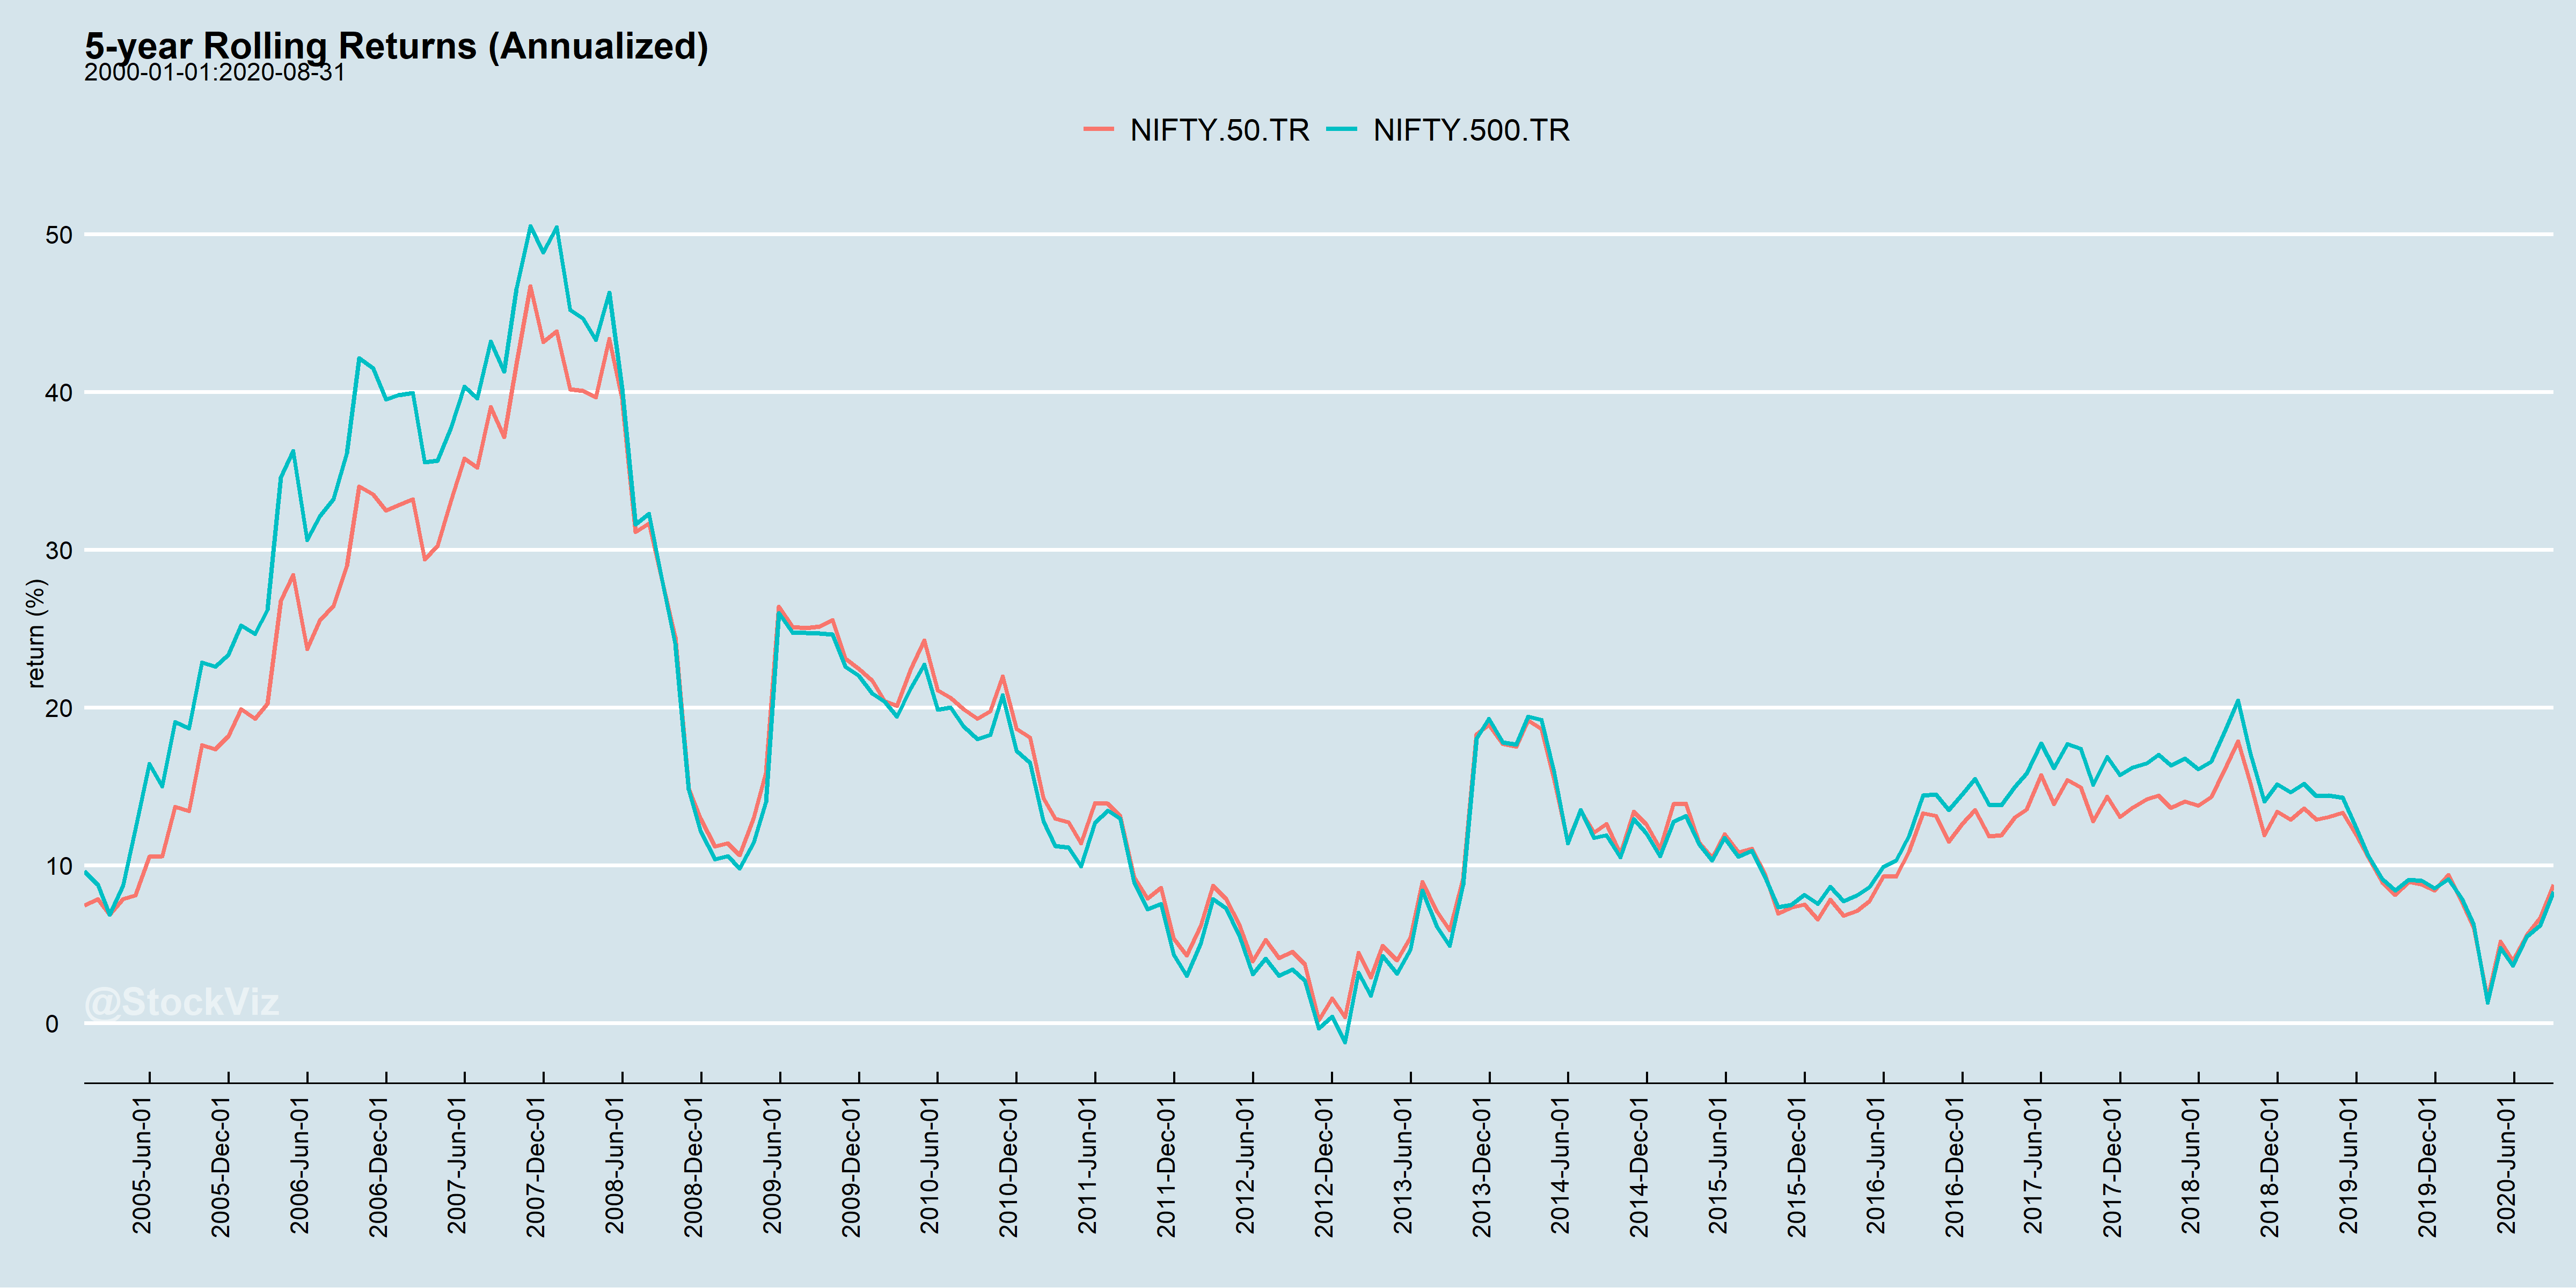
The graphs are generated by my good friend, Shyam from Stockviz.
It’s remarkable how similar these return/drawdown profiles are. There was some divergence between Nifty 50 and Nifty 500 from 2005 to 2007, but that quickly disappeared. Since then the returns have been relatively similar across both these indices. Again, indicating the fact that the additional 450 stocks in Nifty 500 make very little difference.
While I’ve not discussed other indices such as Nifty 100 or Nifty 250, you can expect something similar.
So the question is – what difference does it make if the benchmark is Nifty 50 TRI or Nifty 500 TRI?
Well, nothing.
What does this mean to you as a mutual fund investor? I suppose some of you are reading this may have figured this out already.
Don’t worry too much about MF benchmarking. You as an investor, should develop a sense of realistic return expectation from your MF investments. That realistic return expectation should serve as your benchmark for the investment and not the one assigned by the AMC.
Everything else is noise according to me.
Naturally, this further boils down to setting realistic return expectations in life. For example, if you’ve predominantly invested in a large-cap fund, then you should expect large-cap kind of results and not small-cap kind returns. 😊
Having said that, if the fund you’ve invested in is under-performing the index consistently then that is not a good sign either. Under such circumstances, you may want to consider a review or even change of fund.
Your ability to analyse a fund and set realistic return expectations from your investment eventually defines you as an MF investor. The focus over the next few chapters will be on his, i.e. to identify your personal financial goals, build an MF portfolio, and set yourself a realistic expectation.
The next chapter, we will try and conclude our discussion on Mutual fund metric and then proceed to goals and portfolios.
Stay tuned.
Key takeaways from this chapter
- Benchmarks help you get a perspective of performance.
- Most mutual funds benchmark themselves against TRI, which is the total returns index.
- TRI captures the effect of dividends.
- The returns of the index largely depend on the weights assigned to each of the index constituents.
- TRI returns of Nifty 50, and Nifty 500 is mostly similar.
- You need to set realistic return expectation and set that as a benchmark.
Hello karthik
Where can i find tri for nifty small cap 250
Hi Karthik, thank you for bringing such a good topic.
Though I have the following doubt. I want to understand \”The chart below is the 10-year rolling return of both Nifty 50 TRI and Nifty 500 TRI starting from 2005\”.
If the data is from 2005, how do you make a chart with 10 year rolling returns? From the previous chapter what I understood was that, if you want to calculate rolling returns you need to have \’n\’ previous years data.
For example, in the previous chapter you calculated 2 year rolling return from 2015 so the starting point was 2013. In the same manner, if you are calculating 10 year rolling returns from 2010, wouldn\’t the starting point be of 2000?
Please clarify if I misunderstood this. Thanks.
Yes, if you want to report a 10-year rolling return as of 2010, you need data from 2000 to 2010. Similarly, if the data begins from 2005, you cannot calculate any 10-year rolling return until 2015 (i.e., after having 10 full years of data: 2005 to 2015). Once you have this data you move one day/week/month forward, calculate again — that\’s \”rolling\”.
My friend invested in Direct fund, but through some broker(I think they\’re not distributer). In the monthly portfolio report, it is shown has direct fund. Shouldn\’t it be regular fund as it is invested through broker?
Not really, for example, Zerodha is a broker and we offer direct funds only.
Hlo sir,
Too much interesting topic.
Editing team have made One mistake, change the accumulated units in the table of direct and regular fund comparison.
Thank you for your valuable efforts.
Ah, thanks. Will take a look at this.
Hey Karthik,
Thanks so much for educating us in such a simple language.
I would like to understand the remedies on how to undo the wrong i have done which is at the start of my SIP journey approximately 30-36months starting off with a distributor.
Recently, the new SIPs i have started on Coin app direct plan. What do you suggest i shall be doing with the regular plans because i plan on investing long term and i would want to maximise my returns
It is not really wrong to be with a MFD, as long as the MDF gives you confidence and supports you during your investment journey. After all we are humans, we need reassurance every now and then. But if your didtributor is not doing that, then think of switching and moving out and going for a direct platform.
Dear Karthik
I just wish to express my sincere admiration and gratitude for this great service you have done to all those who have studied or would study this wonderful content you have created.
Excellent Work
God Bless You !
Shitanshu
Thanks for the kind words, Shitanshu. I hope you continue to learn and enjoy reading on Varsity, Happy learning 🙂
Excellent module, Karthik Sir. I have two questions:
1) How long should an investor wait before considering switching to a different fund if their current investment is underperforming ?
2) What should be the ideal time window to analyze MF portfolio to check if any fund is underperforming.
1) I\’d say at least 6 months, but then it really depends on market cycles.
2) I\’m guessing you are talking about EQ Funds, which by default is for long term. So, I\’d say at least 1.5 yrs minimum.
ok sir was able to find only raw index data like nifty 50, nifty 500 but not nifty 50 TRI or nifty 500 TRI
Ah ok. Please check on Niftyindices website as well.
Where to get historical data of NIFTY 50 TRI or other TRIs?
You can check the NSE website for this, else please do contact an exchange authorized data vendor.
Hello Karthik
First, thank writing these articles in simple to understand language, excellent Stuff.
Second: Query: if I already have Mutual Funds (Regular), is it possible to switch these to Direct?
Thanks Sudhir. Yes, you can shift, but that means you will have to sell the regular funds and then make the switch to direct funds.
Sir, There is a small typo in the document. This line `For example, initially, the value assigned to Biocon was 10%, which is not increased to 20%` should be `For example, initially, the value assigned to Biocon was 10%, which is now increased to 20%`.
Ah, ok. Thanks, will look into that.
Thank you sir for providing such simplified content.
I already have all mutual funds in regular plan. Would it be recommended to exit and move all the funds to direct plan now or start investing in direct plan from now on?
I did that for myself Pooja. Go ahead and do it, but please ensure you give your investments a lot of time 🙂
Sir,
(i) Where can I get to watch the TRI graph for Nifty 50/Nifty 150 midcap/Nifty 250 small cap?
(ii) The graphs that we get to see for different growth funds of AMCs in Zerodha coin, do they represent based only on price appreciation or for they account for dividend as well?
1) Please do check the index provider\’s website – Nifty indices dot com
2) They do represent just the price.
Sir, if I have a goal of 25 years of investing in MF , does it need reviewing the portfolio within this period ?
Once in a year should also do.
Thanks, Karthik for the prompt reply. So I guess we will also incur tax on the realized profit once we sell the Regular MF. I was researching if there is an easier way to switch and found the following advice on a tax filing website.
\”Login to your mutual fund account – either the AMC provides it, or you can access it via agencies like CAMS or KARVY. Visit the transaction page, where you can buy, change, or redeem your fund units. Select the ‘switch’ option and then click on the respective fund name. It will have a ‘Direct Plan’ option; click on it and follow the steps displayed. It will take about four working days to reflect the change\”
So would the above process also involve selling the Regular MF (to switch) and accordingly incur exit load and tax on realized profits?
Thanks in advance for all the help!
Not sure about this Pankaj, let me check once with my team if this works.
Hi Karthik, Thanks for all the wonderful lessons on Mutual Funds. We just realized that we have a good amount invested in a Regular MF through a bank manager. How do we convert it now to a direct MF? 🙂 Do we need to sell the Regular MF and pay the exit load and then buy the same Direct MF on Zerodha?
Thanks Pankaj. Yes, thats the only way for now 🙂
Dear Karthik,
Is there a tool available for the investors to compare the performance of their investment in the fund with that of investment in the Benchmark index itself? Specially since almost every actively managed fund has now got its passive cousin in the form of Index Fund or ETF it becomes imperative to know how well the fund manager managed investors money vis-a-vis similar investment in a passive fund which charges around one-fifth of an Active Fund. How to know what the value of investment would have been had one invested the exact same amount on exact same date and for the exact same period in the real or hypothetical Index Fund/ETF following the same benchmark?
Not for now, but this is something we keep talking internally as well. Hopefully we have something soon 🙂
Sir, great articles as usual, i was doing a bit of application to what i have learnt here.
from what i have understood nifty 50 index fund risk is low, as it follows/tracks the nifty 50 index?
then why does the risk parameter on coin show as very high for the UTI Nifty 50 index fund? I dont know whether i have got it all wrong?
TIA
Its not low risk right? Its just that these are large-cap stocks and volatility is low, but the market risk persists.
So in a nutshell Benchmarking is an important parameter to compare the funds performance with the benchmark to get a sense how effective the fund is performing.Just as we do in ratio analysis (comparison) same we do here with benchmark index and fund itself.
Right?
Yeah, dont ignore the benchmark completely 🙂
So as explained above we should not bother much about benchmarking but all the ratios explained are focused on the MF returns compared with the benchmark.So my question was should be bother or not about the benchmark index?I didn\’t got the context of the Nifty 50 TRI and Nifty 500.
Guide for the same.
Thanks in advance.
Paras, its good to know. Dont ignore the benchmark. Always check how the fund has performed in relation to its benchmark and the sector as such.
In short what I got to know is benchmarking is too standardized concept, just as we talked in case of index, the returns of the portfolio created by different fund managers will vary depending on the allocation made my them. As the returns vary drastically using a standardized benchmark would not serve the purpose in real terms hence we tend to estimate the realistic return and set it as a benchmark of the same depending on the various funds which we analyse.
Do guide for the same,
Thanks in advance!
In other words, benchmarking is the process of comparing the MF\’s return with a standard index.
Thank you.
But I can\’t find tri historical data for sensex on bse website.
Ok, maybe they have changed the site. YOu should check with BSE once.
1. I can download nifty or other index tri historical data from nse website but there is no tri historical data available for sensex or other index managed by bse on their website. So where from we can get that data?
2. For historical gold price what I need to follow: mcx gold index or gold etf? Why choose one over the other? Where will I get that data? (Historical daily data)
1) Rahul, if I remember right, BSE site has this somewhere. You need to dig it up 🙂
3) I\’d suggest Gold Index, ETF has a cost baked into it.
What about sensex and other index managed by bse?
Sorry, what about that? Can you please share the context?
I can download historical data for nifty or other index from nse or bse website. But where can I get total return index for nifty or other index? Do I have to manually calculate it? If yes, any procedure?
Check this – https://www.niftyindices.com/
I see so I can plot monthly or yearly return as absolute change in NAV value in % vs NIFTY value change in % for corresponding year or month. And then plot the graph for mutual fund performance against NIFTY. This is an example.
And for computing rolling return of NIFTY, I should take the daily change of NIFTY value (%) and then calculate the rolling return. Right?
Yes, but you can easily check this on 3rd party sites like Morningstar.
For example on 09/12/2022 NIFTY closed at 18,496.60. So can we say the nav value of NIFTY is 18,496.60?
But I doubt that. And when I talk about NIFTY I don\’t mean any Index mutual fund. I simply mean the index.
If I compare a mutual fund with NIFTY or any benchmark index for that matter, I need to have the NAV of both NIFTY and the particular mutual fund.
So Nifty is an index. It does not have a NAV. The index has a numeric value. In comparison, a mutual fund has NAVs. So what you need to look at is the overall performance of Nifty and the MF under consideration i.e. if you are looking for return-based performance.
Karthik how and where to get the historical NAV value of these benchmark say for example NIFTY next 50 etc?
Either on the fund\’s or on the AMFI\’s website.
So does it even make sense to invest in a Nifty 100 versus Nifty 50 index funds. By this logic it does not matter. But if its a Nifty Next 50 it would make sense. I mean if risk appetite for higher returns is there. Is this correct?
Yeah, Nifty 50 and Nifty next 50 is an excellent options to cover the entire market.
This is the most detailed explanation i have ever read.
I have below question in my mind though – can the direct or Regular Mutual funds be pledged as collateral to sell derivative contracts?
where can I find the BSE indices as they are not there on the nifty indices website
Agencies like CRISIL manages these benchmarks. Do check on their site once.
the BSE indices are not available
are these benchmarks TRI indices.
and where can I find the bse indices
I think both varients are available on Nifty indices.
But the nifty chart doesn\’t include the TR which mutual funds take and what about other benchmark like one fund I was looking at took s&p bse 100 as its benchmark where to fund these indices and that to the TRI
You can find all benchmarks here – https://www.niftyindices.com/
where can I find benchmark returns for specific period of time like if I want from a particular date to another particular date
You can look it up on Kite. For example, Nifty chart is available on Kite and Nifty is used as a popular benchmark.
Hello Karthik, I have a question. I recently received my mutual fund returns and they\’re in an XIRR format as I have made SIPs. Now say I want to compare them with the returns of the benchmark index, how can I do it ? I\’m asking as it\’s relatively easy to calculate the CAGR, but how do I calculate the XIRR? (I understand the use of XIRR in Excel)
Kush, the correct way to do that is as follows –
1) Download index data for the same period
2) Assume investments made in the index on the same dates as your SIPs
3) Calculate XIRR
But this is elaborate and time-consuming. Instead, you can compare your XIR with index CAGR to get a sense of how both have performed, this should do.
Very good article. Looks like \”Units Accumulated\” values in the table got interchanged between direct & regular plans under the title \”Compare the performance of the direct option with the regular option. I’ve tabulated this for you so that it’s easy for you to compare\”.
Thanks Naveen. Will check.
Hey Karthik,
Amazing article once again! Just a small correction in the direct vs regular comparison sheet – the units accumulated section is swapped 🙂 – direct one has 19,982 units
Ah, let me check this Suraj. Thanks for pointing out.
Sir, Units accumulated is interchanged between direct and regular plan in tabular column. Please change it
Checking on this.
Hi Karthik
Thanks for educating us!!
One correction in the paragraph below the comparison table between direct and regular MFs- Direct fund has accumulated 20772 units not 19982…
Ah, let me check this. Thanks 🙂
Sir
In the table you compare IDFC direct and regular fund, units purchased for direct fund is 19982 but in the table it is 20772 and unit purchased for regular fund is 20772 but in the table it is 19982
Must have been interchanged, let me check.
Sir
The table where u compare direct and regular fund unit accumulated is I think mismatch
Can you please point to the mismatch, Rahul. It will help me correct the same. Thanks.
Hi Karthik,
First of all, thank you for sharing this information. This module has been an amazing read and I am looking forward to the next 10 chapters.
Secondly here you mentioned \”CAGR (or XIRR to be particular)\”. Are these terms (CAGR & XIRR) interchangeable. So in the coin platform if CAGR is mentioned is it really XIRR?
Think of XIRR as a special case of CAGR, Anurag.
Over the past 5 years I have been investing in Regular Mutual Funds and now want to switch over to Direct Mutual Funds. Will I lose on the time advantage by switching over to Direct fund now? Also, I want to make some changes to my portfolio – will that affect my time advantage and long term returns? Please advise. Thanks!
Its a one-time affair. I\’d suggest you sell and buy it back at the same time and don\’t delay as it will cause complications. Also, its not a major disadvantage since you are deploying back the funds.
Hello sir,
First of all, thanks for this great personal finance series it has cleared my many doubts regarding mutual funds and has given me enough idea to choose best MF suitable to my risk profile on my own.
I just want to add to this that in table of direct vs regular IDFC Core Equity Fund units accumulated is interchanged.
No, why do you think so?
Hey Karthik, thanks for your great efforts and helping us understand everything in a simple way 🙂
I have a question: Is it even matter whether to choose an index fund tracking Nifty50 or an index fund tracking Sensex? As Nifty 50 has 50 companies and Sensex has 30 but in the end, weights matter the most not the quantity. They will perform likewise, right?
They perform alike, it does not really matter. But I prefer Nifty 50, maybe because it is more diversified.
Hi,
Please provide info on NPS TIER 2. Is it similar to MF investment?
Plan to do that in Personal FInance Part 2.
Hi Karthik,
On a lighter note, all MF distributors & distribution network would hate you as you vouch for direct plans against regular ones 🙂
And, the sketches here are very good. Please reveal the artist and give a shout-out on our behalf.
Thank you & the varsity team.
They all hate us for this and a lot of other reasons anyway 🙂
Will let the artist know, thanks 🙂
Sir, in the TER Savings unit, the values in Units Accumulated tab in last table have been switched by mistake. Please fix it. : )
And thanks a lot for \’Personal Finance\’ module. It is great :))
Thanks, Siddhant, let me check that. Happy learning 🙂
Once again an excellent piece @Karthik.. I have a query – What if I invest one equitable weight basis in the Nifty 500 stocks? (Theoretically) whether will it give me more returns by managing risk better (due to diversification) or will my returns drop due to iver diversification?
Would love to read any article on the same if there are any. Thanks in advance 🙏
More returns depend on which benchmark you are comparing with, but it certainly won\’t be tax efficient.
Great Article!! Loved it. Pls could you advise how can a new investor identify funds or fund managers who have been consistently delivering alpha? Is it possible to identify and shortlist such funds pls
I\’d suggest you look at the subsequent chapters on identifying EQ and Debt funds. These chapters will give you a lot more insight in picking MFs.
Hi. While you\’ve urged your readers to move to Direct funds, from personal experience I know that many of them are not equipped to do so. And they land up buying underperforming/risky/wrong funds. Direct is good for those who understand MFs and how to measure risk/returns.
I agree. This module is to help people understand MFs better so that they too understand and move towards direct funds.
From where I can download PDF of this entire module?
This module is still work in progress, PDF will be done once its complete.
Can we get a RSS feed or AWS SNS to get a notification about every new article in this segment ?
Passing on the feedback to the team.
Sir, in your opinion, what\’s the best mutual fund to buy right now?
I want to start my investment journey.
Depends on your end objective right? Also, you should not look at what\’s best now, you should look at what you are comfortable holding for a long time.
Are the present 2 REITs – Mindspace and Embassy worth consideration for investment by a retail investor? Would be great if you could share your thoughts.
I\’ve not really thought much about these options, Sharan. Need to do a bit of research.
Hi Karthik, All your chapters in this module are so informative. Your effort to each every individual to inculcate personal finance is well received. Eagerly waiting for your next chapters. When can we expect the next chapter ?
I\’m working on it, Nitin. The next chapter is about MF risk measures. Hopefully, it should be up and about by mid next week.
Dear Karthik
I really Appreciate your efforts… great stuff.. enjoy reading it …great keep going …eagerly waiting for the next one…
Happy reading. Next chapter should be up by next week 🙂
Hi Karthik,
Can you please share your views on NPS tier -2.
As per NPS site tier-2 behaves like a normal mutual fund and charges are way less than even index funds.
So why are these not so popular? Should we invest in them?
NPS is an elaborate topic, I\’ll probably do that in the NPS chapter?
Although i knew about Varsity from long time as i am using Zerodha since 2014 but read Varsity only now.
I was googling for types of mutual funds, read many articles but the best was from my own broker 🙂
I think the best part about your writting is when you over simplify things so that people with no knowledge can understand.
I have multiple friends who park all their wealth in FDs and some even in SAs, even i used to do it sometime back. I think after reading your articles i will be able explain them better that why MFs is a important part of the portfolio
I have only read \”personal finance\” till now, but will read all now.
Happy to read that Manu, good luck and happy reading 🙂
Sorry for off market question, where can I order The Rupee Tales book for kids? As on zerodha its showing out of stock.
The books are out of stock, Priyank.
Please provide some insights into Quant Funds. Are they worth investing at this stage or should we stick to traditional mutual funds.
Thanks.
Will try and do that in of the upcoming chapters.
Is there a way I can get notified for new chapters in this module? I am eagerly waiting for them.
We usually announce on social media. Please do follow us on Twitter – @zerodhavarsity.
Hello sir
Can you do series on insurance also why insurance companies like LIC don\’t provide Direct plan but mostly focus on field agent.
Will try, its not really something I understand well 🙂
Phew! I read from module-1 to module-11 in a week. Glad I did it. Ha!
Woah! Really? Hope you liked the content 🙂
Dear Karthik,
But when i look in to percentage increase of NAV of Nifty Fifty index fund (daily basis) generally it is exactly same as Nifty 50 (No tracking error).
If dividend is re-invested , in that case % increase should be higher than Nifty 50.
PS : i have not tracked it for all days.
Ajay
That\’s right. But do look at gold funds. The TE is quite high.
Thank you sir for your valuable command. Sir, I want to invest in index fund and there are many option available in the market. I came to know about tracking error criteria for selecting index fund. But what is a tracking error I did not understand. Sir, can you please elaborate more on the topic.??
Tracking error is the difference between in returns between the fund and its benchmark. Higher the TE, the more difference, hence not a great fund.
Man, had thought in investing in multicap funds but SEBI threw a bomb 🙁
Ah, but in the long run this is a good clean up of the system 🙂
Sir, we must thankful to you for your valuable contribution regarding the topic. Sir, how free float market capitalize index are formed? Plz give some examples,
Free float is basically the number of shares outstanding in the market multiplied by their share price, that\’s it. Nothing more to it 🙂
Excellent quality stuff. Really great.
Happy reading, Abhijeet!
Dear Kartik,
One question pops up in mind after looking @ TRI.
What happen to dividends when we buy nifty 50 index fund. Is it pass on to index buyer mean to NAV? or NAV is just indication or price performance of stocks?
Ajay
The dividends get reinvested and reflect in a higher NAV.
Very good article giving greater insights of mutual funds. Can you just suggest ( of course not as recommendation) best Alpha funds of different segments.
Alpha funds?
Hi Karthik, as expected great article.
If I am not wrong then Nifty 50 TRI is for the large-cap fund and Nifty 500 TRI is chosen because fund is multi-cap and as per SEBI fund managers have to choose benchmark according to fund.
Eagerly waiting for the next articles.
Thats right Rohan. But the point is that it does not matter 🙂