
19.1 – Point to Point return
The previous chapter gave us a perspective of how returns are calculated given the time frame under consideration. So, now if I were to provide you with the following data point –
Fund – Aditya Birla Frontline Equity
Starting date – 2nd January 2013
Starting investment value – Rs.1,00,000/-
Starting NAV – 100.83
Ending date – 2nd January 2015
Ending NAV – 161.83
And asked to find out the returns, you’d probably do it with ease. Let us do the math –
Number of units = 1,00,000/ 100.83
= 991.7683
The ending value of investment = 991.7683 * 161.83
= Rs.1,60,497.9
The growth in this lumpsum investment over two years can be calculated by applying the CAGR formula –
= [160497.9/100000]^(1/2) – 1
=26.69%.
Which as would recognize is a phenomenal growth rate.
Now, let us say you are mighty impressed with your investment, and you start to propagate the fund. A friend walks up to you asks for the performance, and you proudly declare the 2-year growth rate is 26.69%.
Your friend is impressed and decides to invest.
Now, I want you to think about this for a moment. What do you think is the fundamental flaw here?
Did you lie about your investment to your friend? – No
Did you lie or mislead your friend by letting him know the returns you’ve enjoyed? – No
Well, then what do you think is wrong here?
The growth rate of 26.69% is a massive generalization of two-year growth rate. When you mentioned this return to your friend would believe that this is the kind of performance even he is likely to enjoy.
The 26.69% return is valid when the money is invested on 2nd January 2013 and measure its growth on 2nd January 2015. In other words, the growth rate is really only for this starting and ending points; it is right for these exact two dates. It is a very personalized experience.
If I were to invest and measure the returns on any other dates, then the profits will be different.
So, whenever you measure returns or growth between two dates, the value you calculate is only valid for the two years under consideration. Hence, such a measurement of returns is also called the ‘Point to point’ return.
To get an accurate representation of how the two-year return (growth rate) looks, you need to calculate the ‘Rolling Returns’.
19.2 – Rolling Return
The rolling return gives us a perspective of how the ‘n years’ return (growth) has evolved over the last ‘n years’. Sounds confusing? I’m sure it is, so here is what we will do.

We will take up an example and figure out the rolling return calculation. I’m sure understanding the rolling return concept becomes much easier if you know the math behind.
By the way, many websites publish the mutual fund’s rolling return, so it is not essential to remember how to calculate the rolling returns. However, by knowing the rolling returns math, you will understand the concept of rolling return quite easily.
So let us get started.
I’ve got the historical NAV data of AB Frontline Equity Growth-Direct. The starting date is from 2nd January 2013, and I’ve got this till 2nd January 2020, that’s about seven years of data.

My objective here is to find out the 2-year rolling return for this fund. To do this, I’ll have to start in 2015.
I take the NAV on 2nd January 2015 and the NAV 2 years ago, i.e. on 2nd January 2013 and calculate the return between these two data points. Next, I move the date by one day, i.e. between 3rd January 2015 and 3rd January 2013, take the NAV for these two dates and calculate the return between these dates. I’ll again move the date by one day, i.e. 4th January 2015/2013 and calculate the return.
So on and so forth, such that I have a time series of 2-year return.
Let us calculate the first rolling return –
NAV on 2nd January 2013 – 100.83
NAV on 2nd January 2015 – 161.83
Since its two years, we apply CAGR –
[161.83/100.83]^(1/2)-1
26.69%
The 2nd rolling return in this series would be –
NAV on 3rd January 2013 – 101.29
NAV on 3rd January 2015 – 161.45
=[161.45/101.29]^(1/2)-1
26.25%
I suppose you get the sequence. I’ve stacked up the data side by side on excel, and this is how it looks –

The starting date is 2nd January 2015, right up to 2nd January 2020.
As you can see, I have the latest date and NAV (shaded in blue). Next to this, I have the date and NAV for two years ago (shaded in pale yellow). I have calculated the CAGR against these two NAVs. If I do the CAGR across all the dates, I get a time series of the daily 2-year return starting from 2nd January 2015.
Before we proceed, let us look at this statement about rolling return again – ‘Rolling return gives us a perspective of how the ‘n years’ return (growth) has evolved over the last ‘n years’. Does this sound confusing now?
I hope not ☺
Anyway, one minor thing to note here – look at the 2nd data point, I have NAV for 5th January 2015, but I don’t have the NAV for 5th January 2013, but instead have the NAV data for 3rd January 2013, which I’ve used. As you may have guessed, this happens due to the weekend factor. So I’d suggest you ignore this bit.
Also, at this point, you should realize that if my objective were to calculate the 1-year rolling return, my starting point would be 2014, and if the objective is to estimate three years rolling return, then I would start from 2016.
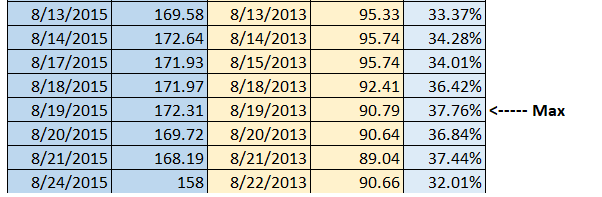
Now that we have the Rolling Return time series starting from 2015, I can do a couple of things with the data. To begin with, we can calculate the range of returns for the time series we have calculated. To estimate the range, we simply have to calculate the max and min.
Here is the max –
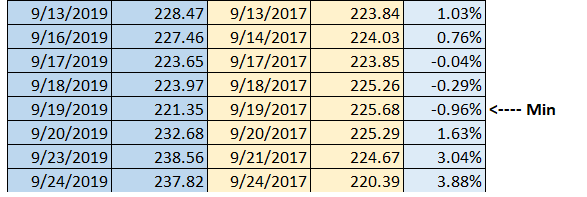
And here is the min –
What does this mean? Well, assume two people invested in the AB Frontline Equity fund. The lucky person invested on 19th August 2013 and pulled out his investment on 19th August 2015. This person makes 37.76%.
The unlucky fellow also invested for two years, but he/she invested on 19th September 2017 and stayed invested till 19th September 2019. Unfortunately, this person lost money!
The point that I’m trying to make is that no two, 2-year returns are the same. The returns change depending on when you choose to invest and when you decide to pull out your investment.
Here is a graph of the rolling 2-year return starting from 2015.
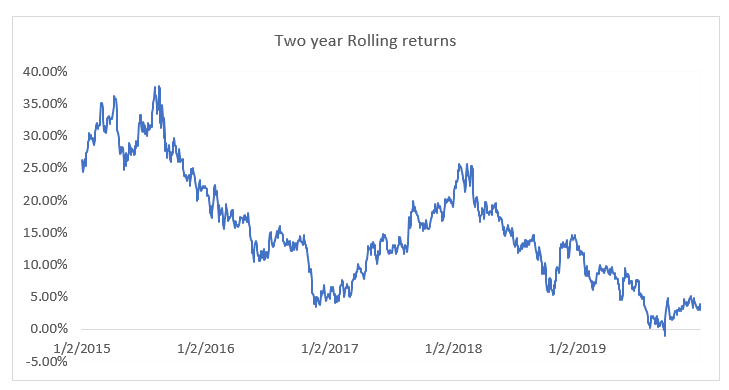
And as you can see, the two-year returns have ranged from 37% to nearly -1.0%. If you were to invest for two years, then your return could have been anywhere within this range.
To get a perspective of the likely 2-year return, you can take an average of the rolling returns; this is called the ‘Rolling Return Average’.
The average is 15.35%.
So as you can see, the rolling return gives us a lot more insights compared to a point to point return.
So the next time you want to invest in a mutual fund, as a part of the analysis, include these two things –
- Identify the period you are interested in investing
- Find out the historical rolling return min, max, and average for the period
For example, if I’m looking at investing in a large-cap equity fund for seven years, I’ll check the historical 7-year rolling return for that particular fund. By doing so, I will get a perspective of historical return range plus its average.
In my opinion, this is much better than looking at a point to point return. By the way, I’ve used 2 years rolling return as an example. If you are looking at investing in EQ funds, then please consider at least 5 years rolling returns or higher.
In the next chapter, let us discuss other MF metrics that matter.
Key takeaways from this chapter
- Point to point return gives a perspective of the return only for the two days under consideration
- Point to point return should not be taken as a generalization of return
- The rolling return gives a better perspective of the return
- Rolling return average is a better representation of the returns one can expect
Also, If I compare 2 funds, Canara robecco large cap and Nippon large cap. Canara has an 5 year rolling return average of 15.87% while Nippon has 14.71%. But if we compare current 5 years CAGR, lately canara is not performing good. Nippon has 17.85% and Canara has 9.53%.
So according to this, is it correct to think that canara has a good average because of it\’s past years performance but if to invest today it is not a best option? and nippon should be given preference?
Jus confirming the thought process…
Why dont you evaluate basis risk as well? Also, your numbers seems a bit off. Not sure that is the case really.
Sure sir
I compared Rolling returns from the way we calculated here, from mfonline calc and from primeinvestor calc as well. I checked for nippon large cap 5 years rolling return.
Few values like avg and max come close by but min has a diff of 5%. Likewise few values match few don\’t. Why is it the case? Does every website calculate differently?
Which value to consider correct then? I would be much confident to which I calculate learning from this article.
Ideally it should not. Stick to a trusted source, I think Primeinvestor is good 🙂
So Basically, It is concluded that rather than checking 3,5 and 10 Year CAGR of funds Check 3,5, and 10 Year Average rolling return it gives the better perspective. Am i Correct Sir ?
BAsically Rolling Return > regular returns for Mutual Funds.
Sir for eg If i want to get the historical Data of Any Company or Nifty 50 then i Go to investing.com or NSE or BSE
IF i want to get the Historical NAV for any mutual Fund Like you have the data which you used while explaining The concept where can i Find that Data? Any free Resource?
You can check the AMFI website for this, Harsh.
In the above example in rolling returns, why did u take 2- year rolling returns though you stayed invested for close to 7 years?
Like I said, longer tenure is good. Also depends on context and availability. If 5 years is available, then opt for it.
is looking at 5 year rolling return better than 2 year rolling return? Can u help me understand how the 2 are different, apart from the time duration taken and why it matters?
Its just that 5 year return comparison is better than 2 years 🙂
Hi Sir I have confusion in rolling returns. Here its said that to tell friend that 2 years I earned returns 26% which is not good as in future same return will be generated is not sure then after calculating rolling returns or its average how this can be sured that in future same returns will be generated ?
There are no guarantees for future returns, Harsh 🙂
All return parameters are just indicative of the past returns.
I was thinking about SIPs. Is rolling return the reason why SIPs are better than lumpsum?
Say a rolling return is negative for a specific period, lumpsum definitely must have caused a negative return, but if I had invested that over multiple periods – there wouldn\’t be a complete negative return.
Am I thinking in the right direction?
No, SIPs are preferred because the cost gets averaged out over time plus its easy on most people\’s wallets to save small bits every month.
Also, negative returns really depend on your time horizon, there could be periods where (over the time period selected) could post a series of negative returns.
Kindly suggest me the website, from where we can get rolling return?
Someone mentioned that Morningstar has started giving out rolling returns. Please do check there.
Hello Karthik,
Big fan of your work. Thanks for all the efforts.
I do see in the comments section that this would soon be coming on Coin (but these comments were from few years ago)
What is the major challenge in showing Rolling returns in Coin? XIRR has been added recently, kudos for that!
Aakash, this has been going through constant changes and updates. I think this will happen soon.
Hi Karthik,
Thank you for explaining the concept of rolling returns. I was comparing a few funds from the same fund house – ELSS, Large cap, Large and Mid cap, Value funds. Interestingly, the rolling return graphs followed a very similar path except the percentage values were different. I understand each of the funds I mentioned have a very different purpose and timeline to keep in mind. But does this provide some insight on how the fund house is managing their funds? Meaning, would you suggest looking for funds with a dissimilar rolling return graph while considering investing in?
Looking forward to your response.
End of the day, they are all linked to markets, and they all follow a similar pattern. What differs, like you mentioned is the percentage values. Its like looking at buildings – they all look vertical, some taller than the others 🙂
Plus, the risk aspect as well. They differ too.
Thanks Karthik, I really appreciate your time you bring to help us with the queries.
I don\’t prefer CAGR because the yearly number we get is not something what the Investment actually generated.CAGR simply depicts that if the price of any security is say Rs.160 in 4 years from Rs.100 initially then at what rate it would have grown (~12.47% in this case), but the reality is that it would have gone in negative as well as different than 12.47% in some year, it doesn\’t seems good to me using this. Therefore, I would use Real Return for comparison as well because this is what security actually generated in any given period.
But here I\’m not at all saying that CAGR is bad or not worth using, it just that I won\’t use this in this scenario.
I would be happy to know if I\’m following anything wrong here. Thanks
I get that Kumar, the trick is to not look at CAGR as an indicator of fast or slow your money is growing over prolonged period. Faster the better, right? Yes, if you want to know how much, in absolute terms your money has grown, then perhaps real return is better.
Insisted of using CAGR, can\’t we also use absolute return of two periods for calculating the Rolling returns. For example- I would calculate the Absolute return from 1st Jan 2020 to 1st Jan 2022 and move the day by one every next time as you did in your example.
Hmm, but why do you want to do that? CAGR gives you better insights especially when you want to compare two funds right?
Hi,
How can I get NAvs for these many years? If I want to invest tody from what to what date I should consider the data.
Regards
Please check the AMFI website, or perhapse the AMC\’s investor relationship desk?
So how can i get the 12 month Rolling return, and If I do 12 month gap between two data points, i Don\’t need to annualized roght?
Yeah, for 12 months, you dont really have to do that.
Thanks for writing this chapter, Kartik. This is helpful. Could you please answer following questions:
1) Could you please state where can an individual investor find rolling returns of an Index Funds such as NIFTY 50 and NIFTY 150?
2) Would it be fair to assume that rolling returns of NIFTY MidCap 150 would be higher than NIFTY 50 Index?
Looking forward to hearing from you.
1) Can you check with Tijior Finance, I think they do.
2) Ah no, you cant generalize this. This really depends on market cycles. There could be times when largecaps could perform way better than mid caps.
@Zerodha – You had NAV for Fri 4\’th Jan 2013 and yet for 5\’th Jan 2015 you used NAV for Thu, 3\’rd Jan 2013. Any reason for not choosing Fri 4\’th Jan 2013? Kind of similar pattern where you haven\’t used NAV for other Fridays like Fri 11\’th Jan 2013, Fri 18\’th Jan 2013…
Is it an oversight or any reason for skipping Fridays in \”2 Years ago\” calculation?
Are you sure? There is no reason to skip Friday NAV, must be an oversight.
Happy New Year, Kartik!
Out of the 28 active MidCap funds, I wanted to review 6 MidCap funds after applying all the hygiene criteria\’s. Out of these 6, Kotak/ Edelweiss did publish rolling returns on their website (differs from what 3rd party like ET Money published) but I could not find anything for SBI Magnum/ HDFC MidCap/ Quant MidCap either on their website or on 3rd party site such as Value Research/ MorningStar. ET Money do publish the rolling returns for all the funds but I am not sure how credible that data is!
Happy New year to you as well. One thing you can do is to speak to the investor relation cell of the AMC and ask for the rolling returns. Most of them acknowledge it I guess.
Thanks, Kartik for writing this chapter. Unfortunately, not all funds publish this information. How do you track this information for the funds that do not publish it? In addition, how do I find latest rolling returns of NIFTY Indexes? For instance, NSE published rolling returns of NIFTY MidCap 150 in September 2021 through Whitepaper but nothing after that.
Rujul, I did notice few AMCs publish rolling returns and assumed its a standard effort. Did you check thrid party sites like Morning star and Value research?
Sir,
Is there any source from which I could get the ready data for various periods of average rolling returns of different funds.
I think the fund houses have started publishing this data themselves in the fact sheet, you can check that Anirban.
What are the screening tools for 5yr/10yr rolling return? Is the filter available in Coin?
No, but I think AMCs have started reporting this as well.
Could you please help me find a page that offers more detailed information for comparing different mutual funds? I\’ve been using Money Control, but I\’m having difficulty understanding the example they provide.
You can use this as well, Vinoth – https://coin.zerodha.com/mf/invest
Is there a source where we can calculate the rolling returns for the stocks as they occur, similarly to how we calculate the returns from mutual funds?
Is the rolling return shown by the SMA and EMA in stocks?
Rolling returns are published by the AMC\’s fact sheet itself. Even the returns are calculated by the AMC or 3rd party sites like value research.
Please ignore you already answered it,thanks.
Good luck!
Sir, how did yo arrive at 15.35% as Rolling Return Average?
Its based on the calculation, which we have discussed in the chapter.
Sir,
Rolling returns of same mutual fund for same time period for same time interval is showing different on different websites. Please advise which website to follow for the same.
Ashutosh, i think the AMC website itself provides the data now. Look for the rolling returns in the fact sheet of the scheme you are interested in.
Hi!
Thanks for explaining this concept so well. I just had this one doubt that, how does one time the market well enough, to know that the market is approaching a low or high? How can someone time the market well enough, so that one can make the maximum advantage out of a lumpsum investment?
Aryan, that\’s an answer I\’ve been trying to find for myself for the last 18 years 🙂
Very insightful chapter Karthik, thanks a lot team!
Do we show rolling returns of mutual funds as a metric on Coin or we have to check it with AMC issuing the fund?
I can see CAGR but not rolling returns.
The factsheet provides this, Saurab.
Hi Karthik Sir, I believe more than just average. The average and distribution around it maybe even more important and insightful. For example we can have wide distribution of average 18%, but has rolling returns distributed from -1% to 37% it maybe less desirable than say rolling returns which are only 15%, but returns are tightly distributed from 10% to 20%.
Yup, you do have a point.
Sir, from which website we can get data about rolling returns of a particular mutual funds
Rishik, if I\’m not wrong I\’ve mentioned the website which has the rolling return detail. Can you please double check?
Thanks for this. If not anything, the rolling return trend of a MF might point to the competency of the Fund manager (for the duration of him/her managing the fund. Is there a site that helps sort MFs by their rolling returns? I couldn\’t find any or I am bad at looking. Moneycontrol has only a CAGR option. Thanks!
Not many out there, Ananth. A site called Rupee Vest used to publish this data, you may want to check their site once.
in rolling return ,let assume for 5yr we calculate
period is 2015-2020
start with 1-1-2020/1-1-2015
1-1-2019/1-1-2016
end with 1-1-2018/1-1-2017………..is right?
period for 5 yr calculation for 2015-2025 is right ?
which one is right?
AND also expln how to calculate average rolling return ?
THANKS
You can move the starting and ending dates by 1 day, and you will get the rolling returns, Nikita.
so ideally choose those funds which have less rolling return spread?
Yeah. Less is relative to your risk appetite 🙂
I have done it, I have removed all the dates in which there was a weekend or a holiday but then to this problem is there.
how can I resolve it
I have done it, I have removed all the dates in which there was a weekend or a holiday
Ah, ok. Then have you cross-checked if the dates are exactly the same for both arrays? These two things is where most go wrong.
I was calculating rolling return for a fund over a period of 5 years but due to weekend factor the difference in dates by the time I have reached \”8 Apr, 2022\” has gone upto 3 months the 5years ago NAV for the latest date is \”30 Jun, 2017\”.
so is this normal while calculating rolling return or there is some another way to overcome this huge gap
No. Why don\’t you clean up the data series and remove the weekends?
what\’s the difference between \”trailing returns\” and \”annualised returns\” as I looked for it, I am not able to find the difference between the both I am finding them the same.
Annualised return is the return (or growth rate) measured on a yearly basis. Trailing returns is similar but the time duration can be defined to anything – quarterly, half yearly, yearly etc.
I understand the rolling returns graph as way to understand how returns (CAGR) changes over time. But what would an average rolling return tell me? Please clarify.
In a sense yes. It gives you a quick perspective on how returns were for the two dates under review.
Thanks Karthik for good lessons.
Please share some online rolling returns calculator links. I got this from Google https://www.miraeassetmf.co.in/calculators/rolling-return-vs-benchmark
Regards,
Sunil
I think Rupeevest is the other source, not many out there.
Hi Karthik,
Great explaination!
Curious to know how can get rolling returns indicator on a stocks chart? Something similar to line chart of Simple Moving Average/Exponential Moving Average?
Can you point out any such performance indicator for a stock which is similar to rolling returns supported either by Tradingview or ChartIQ chart on Kite platform?
Thanks in advance
I\’m not sure if this is available on either of the platforms, Nipun.
Sir can you tell me in brief about what rolling returns are ?
You tried very well but I couldn\’t understood the same .
That\’s the best I could explain in 🙂
Can you tell me which part is confusing? Maybe I\’ll try and explain just that bit?
What is the minimum number of samples one should look at and does this change for different year returns ?
This is good – thanks a bunch.
Good luck and happy trading!
For a while I am inclined to move to index funds given it has more more clarity and the fact that most fund don\’t end up beating it. But when I tried to use this rolling rate concept to index fund (HDFC nifty 50) vs say Axis focused 25, my average return are coming in much lower (14% vs 21%). I have used the daily NAV data from 2013 onwards. Based on this my Axis focused fund look more promising. I am missing something in my understanding and analysis?
Not really, probably Axis manages the tracking error better which may result in higher returns. But please do double check.
Please ignore you already answered it, rupeevest.com has it
Can some one please suggest the best reliable online platform/website to calculate the rolling returns?
thanks
https://www.rupeevest.com/Mutual-Funds/Rolling-Return
I had used this. Pretty good.
Yeah, they are.
Is the rolling returns concept useful just for lumpsum investments? How would it work with SIPs?
RR gives you a good perspective on the return profile. You can use that for either lumpsum or SIPs.
What if I have invested in a Eq fund for one year and then before the maturity date I would want to extend it by another 6 months , can it be possible.
Yes, you can.
Which websites can I refer to in order to check rolling returns of a MF fund?
I think Rupeevest used to have this, Manish. PLease check their site. Thanks.
How to find graph of rolling returns of some particular MF of particular rolling period? Q2. Best way to get historical data?
YOu can get that on few websites that I\’ve mentioned in the chapter itself.
Hello Karthik,
Thanks for the prompt revert.
Would you mind elaborating on the monthly returns point I had asked in my previous comment.
I am having a little trouble understanding it
For monthly, you need to define the OHLC first –
O = OPening price of the first day of the month
H = Highest price during the month
L = Lowest price during the month
C = Closing price on the last day of the month
Once you have this for all the months across all the 10 year data points (120), then you proceed to calculate the Rolling return the way you described in the first part of your question.
You may also use \’=Googlefinance\’ function in google sheets to get NAVs of any MF for any date ranges. Really nice feature of Google Sheets, I\’m using it for maintaining all my investments MF, Stocks, Indices at one place
Ah, I\’ve not used that. Let me check, thanks for letting us know.
Where can I get historical NAVs data to put them in an excel sheet?
AMFI website.
Hey,
Why don\’t we talk about the rolling returns of shares ( stock market)?
There was no context for it, but anyway, for a share, it may not make sense since its lot more volatile compared to a portfolio.
Please correct me if I am wrong or explain where I am getting wrong conceptually.
1. If I want to analyze 5 year rolling returns and I have data for 10 years from 2010-2020. Will my starting point be some what like this:
end value(1/1/2015)-(1/1/2010) beginning value
end value (2/1/2015)-2/1/2010)…. and so on.
2. How can I calculate 5 year rolling returns, with a monthly frequency.
Please correct me if I am wrong in the first point
1) Thats correct.
2) 5 yrs is 60 months, so assuming you have 10 yrs data i.e. 120 months, then you calculate the rolling 60 months returns.
Thanks Karthik for demystifying the concept of rolling returns for so many! Please confirm if the returns zerodha coin app show for 1,3 & 5 years for each fund are rolling or point to point returns? Plus, how to normalize the returns with the help of standard deviation to identify the scheme with highest risk adjusted returns! I hope coin will have this! (morning star and moneycontrol do present more details about mutual fund schemes and as a zerodha enthusiasts, I would like to have this info in coin too!)
Darshan, the returns shown on Coin is a simple point to point, we don\’t have rolling returns. For now, you can look at SD, shape, and capture ratio to get a sense of how risky the fund is. Unfortunately, we don\’t have these on Coin, but we are trying to bring out a new version with these.
Karthik, many thanks for the materials. What is the time period i.e. start date and end date that we should typically look at for 1/3/5 year rolling returns.
At least 3 yrs or more, Varun.
Thanks for detailed explanation on topic!! It really helped me to understand this concept.
Happy reading!
Thanks Karthick for introducing this concept. It looks like our SIP date also makes an impact on the returns. Is there a way to find a best date to start SIP?
I checked the historical NAV of few funds and I can see NAV is lower on the 25th or 20th of month compared to 5th of month in most of the cases. Is it because many SIP\’s starts at the beginning of the month which may influence in increase of share price& NAV? Can you please let me know if my assumption is correct?
I\’m really not sure (and I believe it does not matter), all my SIPS are on 5th of every month 🙂
Thanks, got it! Just one side query: Will the Coin users be notified via email about significant changes in a mutual fund they are invested in via SIP?
For eg: let\’s say the expense ratio of the Fund is increased or if the Fund Manager is changed. These are some significant changes that can occur in a fund, and if that is so, its important that the investors are made aware of the same. So will Coin or the AMC notify via email? Do you know any good website/platform which provides this notification service?
No, we don\’t have this feature Mohit. Also defining \’significant\’ can be a very tricky affair 🙂
Hi Karthik sir,
Can you give some insight as to is there a metric like rolling XIRR to find/compare out the historical rolling SIP min, max, and average for a period?
Like we have the concept of rolling returns to analyze mutual funds when we want to invest in lumpsum to finally receive an absolute return for the investment tenure, I wonder if there is a similar concept of rolling XIRR returns to analyse/benchmark mutual funds when we want to investas SIP?
If not, how can we use the concept of rolling CAGR itself to compare with the XIRR data?
No, XIRR is based on your actions, so a rolling XIRR will not be available. You can compare XIRR and CAGR to get an estimate of how the fund has performed during a given period versus how you have performed (assuming you are doing a SIP).
Great chapter and beautifully explained.
Happy reading, Nitin!
Thanks for this crystal clear explanation. In some websites that compare the returns of various mutual funds, I see the term \”Annualized returns\”. Can you please explain how different(or similar) it is to CAGR/XIRR?
It is the same as CAGR, Andrew.
Please tell which website shows rolling return of mutual funds . Thanks
Have mentioned the same in this chapter right?
Explained very well in an easy to understand way.
In the first key takeaways, it was written two \”days\”. I think it was meant to be \”years\” as per the case studied.
Ah, thanks. Let me check on this.
What do the historical returns stated for a MF when we use websites like valueresearchonline signify? Is it the point-to-point return for that particular day on which we are checking the returns or is it some other form of return?
I guess some of these sites provide you with a variety of returns such as – calendar returns, point to point, FY returns.
So sir if I were to invest for next five years, I should look last 10 year historical performance, starting 2011from 1st jan 2015 and 1st jan 2011 I need to calculate so on and so forth
Am I correct sir
That\’s right, both risk and return should be evaluated 🙂
Hi Karthik,
Great article! Thanks for simplifying concepts with math and real-world data 🙂
You mentioned \”many websites publish the mutual fund’s rolling return\”, Can you please name a few such websites?
I looked at the Value Research website, they provide 1Y, 3Y, 5Y returns. They don\’t explicitly mention that it\’s a rolling return but it is right?
Nipun, thanks for the kind words. I think folks at Rupeevest provide the rolling returns.
But , what type of returns are published on website ? Where to look for rolling return?
We will soon have this on Coin as well, but check Morningstar for now.
Hey Karthik,
I could write a blog thanking you for your service in form of Varsity 🙂 For now, it\’s a big Thank-you 🙂
regarding my question is there a place where I can find rolling returns data for a mutual fund?
Thanks Prateek, this means a lot to us 🙂
Check Rupeevest website, they give out the rolling returns.
I have a small doubt – the spread ranges from 37% to -1%, and as we can see from the graph, return rates are declining post 1/2/2018.
As a novice investor, should I consider investing in a fund that is on a declining rolling return rate from past 1/2 years? In this example, the fund had phenomenal gains from 2013 to 2015, and 2017-2018 but the return rate is declining post 2018.
Also, just a curious thought, can the rolling return curve be used as a rough estimate to pull out from the fund (if we see a consistent decline for an year or so)?
Doubts aside, absolutely love the Varsity modules! Thank you for spreading this knowledge free of cost 🙂
Aditya, when you look at rolling returns, look for two things –
1) Consistency of returns
2) Compare it with other funds of similar nature, this gives you a perspective of how the fund is performing on a overall basis.
Yes, if the returns are declining over the years (while other funds are performing), you may want to relook at this.
Glad you like Varsity 🙂
So Weights and biases are something that is extensively used in Machine Learning models, Weights are something that keep changing as a model learns to predict the outcome, on the other hand, Biases are constants that remain the same over multiple iterations of the model (Constants).
Lets take a simple equation say y= b0 + b1x +b2x
here b0 will be your constant, such as an intercept, and b1 and b2 are weights that change over iterations to better fit a model.
The idea behind it is that certain features are more important than others, say in recognizing a Face, the prominent features would be the Eyes, Nose, Ears, Mouth, etc, and hence would have greater weight as compared to other features such as say freckles, the difference in the shape of the face from one person to another, Eyebrows, Eyelashes, etc. As the prominent features make predicting a face much easier and generalized.
The bias, in this case, would say be faces of a particular race, could be due to facial color.
So, my null hypothesis is, in ideal conditions, your SIP\’s profit/loss per month over a span of say 5 years will be distributed normally, (so no profit-no loss / negligible profit/loss), but this usually isn\’t the case, most times you experience a significant percentage of profit or loss. (-10% ,+10%).(where standard Hence not normally distributed.
Now hence if we have higher weights to the Tails (Ends) of this distribution (say 2.5/5th and 95/97.5th percentile), where again the 2.5/5th percentile (Loss) has a higher weight than 95/97.5th percentile (Profit) and lower weights elsewhere. What this would do is make a conservative calculation of your overall profit.
As to how to go about assigning weights, it\’s an interactive process, basically trial and error (either manually or machine learning) till your start getting numbers that you think are good.
Could be as simple as say 1.5 for 2.5/5th percentile, 1 for 95/97th percentile, and 0.5 for rest.
https://www.researchgate.net/profile/Caio_De_Oliveira2/publication/317371065/figure/fig3/AS:638065001385993@1529137959645/Comparison-between-a-t-distribution-with-n-10-and-a-normal-distribution-The-area.png
I hope I\’ve expressed myself in an easy to understand manner. 😅 I could be totally wrong in my assumptions though, hope someone could correct if I am.
Regarding the podcast here\’s the Link of Episode 1: https://www.youtube.com/watch?v=KW2sdHBGzCI&ab_channel=HonestlybyTanmayBhat , It\’s had a total of 3 episodes so far.
Here as Simha said having a range of -1% to 37% and averaging it to 15% would be a foolish thing to do, So in this case, wouldn\’t it be better to have weighted rates, as on the basis of frequency of that rate/ rate range? and rather than just having a single weighing factor, we could have -ve or lower returns (say 0-7%) have a greater importance/weight than higher returns (7+), Wouldn\’t this method of calculation project a lower than actual rate of return, but would be conservative in a good way, that it\’s taking into account a worse possible case?
Would love to hear your opinion on this @karthik as this is an assumption I\’m making from my recent exploration into data analysis as a student still in his undergraduate programme. 😅
Also, I wish I knew about Varsity 2-3 years back, great material, written beautifully, recently found out about this via Tanmay Bhat\’s stonks podcasts. I\’ve always felt quite intimidated with posts on other sites, but Varsity does an excellent job breaking it into smaller easier to understand and digest chunks.
Danish, can you please give more context to the weighted rates? The question is, how will you assign weights? Nice to know about the podcast. Can you share to link please?
Where can I get the 10Yr NAV data to calculate the min/ max/ avg rolling return for few MFs I am planning to choose from? Or is there a website that lists that?
Try the AMFI website.
Where can i get rolling retrun data availabe. I mean i dont want to calculate it
I saw Rupeevest has a nice portal to check RR I suppose.
Thanks for all information abour rolling returns and it is worth of knowledge. But still I am not convinced if this method is helpful in evaluating individuals investment return. Suppose I invested 2000/- on 1st of march 2015 and if I want to withdraw amount on 1st of march 2020 then I will definitely look for point to point return (CAGR) instead of rolling returns. Also, i guess, since benchmark returns are also calculated with point to point method, rolling return method won\’t help to compare with benchmark returns.
Maybe rolling returns method is just another parameter (secondary) to track MF performance?
Yes, the point of return is for measuring your returns, but the rolling return is to get a perspective of the past returns. In my view, rolling return is much better than regular looking at point to point return.
On which website can we get the rolling returns of mutual funds
Do check this – https://www.rupeevest.com/Mutual-Funds/Rolling-Return
This is great!
Happy learning!
Thanks Karthik for this article. It is really insightful about the returns generated by MFs and why we shouldn\’t look at the point to point returns. Rolling returns gives us clear idea about how the fund is performing. Although the risk of fluctuation of returns -1% to +35% is really big and one should only look to MF investment for long terms (as you said for 5 years atleast).
It\’s always good to read an article in Varsity. Keep publishing such content.
I really noticed one thing in the Varsity that although the Varsity works under the Zerodha Brokerage firm, you don\’t promote or advertise any of your product unless there is necessary to understand anything about when you explain it.
Thanks for it again 🙂
Thanks for the kinds words, Vicky. Yes, we don\’t intend to clutter it with promotional stuff. Our idea here is to share whatever we know, and we will stick just to that 🙂
Happy learning!
Is there some place where rolling return for equity funds can be viewed?
Amit, I\’m not sure about this. Maybe you should check the screener.in or Tijori Finance for this.
Where to find the data on Rolling Returns? Averages generated by online portals are either based on annual returns or CAGR. Even the Coin App shows just CAGR of the fund.
I think Moneycontrol has this, remember seeing it.
Sir I am a pretty decent 2d animator and I am planning to convert Varsity content into short videos. I of course plan on giving Varsity and Zerodha its due credit. Do I have you blessing to move forward with this? Thank you.
Please do go ahead. It should be ok as long as you give Varsity and Zerodha due credit. Also, share the links here so that other people can also benefit. Thanks.
karthik sir please tell me how to make trading strategies?? what to look for in stock before selecting for trade?
Please do take a look at the trading strategy module.
how can I download CHAPTERS 11 & 12??
PDF is not read yet.
Where can we find rolling returns data for different mutual funds?
I believe Morningstar or Value research provides this.
Got glued to this personal finance materials and dint get bored at all. Finished all 19 chapters today itself. How nicely you explain such complex things! Fabulous!
Thanks, Nischal. Thats a lot of reading for 1 day 🙂
Hi Karthik, Quick Question – Are rolling return and trailing return both same?
No, Trailing returns are based on point to point measurement.
Please make a downloadable PDF version of this wonderful Module
PDF will be available after the module is complete.
This, something so basic yet never came across such valuable information.
Thanks
Happy learning, Rasik!
Thanks Sir
Welcome!
Hello Karthik Sir,
Thanks for explaining the basics of mutual funds in a simplified manner. I am eagerly waiting for the next chapter on analysis and selection of mutual funds. When can we expect it to be published?
Thanks and best regards!
Hopefully by next week 🙂
Sir
Thank you for clarifying this concept of rolling returns.
In the above example, you have calculated two year rolling average return as 15.35%. Sir how you arrived at this figure? As per my calculation, its coming out to be 18.4% (Max(37.76)+Min(-0.96))/2).
Thanks
This is the average of all the data points, that\’s how the average is calculated. Max+min/2 gives you the \’Mid-range\’, not average 🙂
Thank you, Sir, for bringing this topic to us. The concept you explained is neither new nor complicated but still overlooked by a novice MF investor like me. This concept has triggered a doubt that when I see CAGR on the Zerodha Coin while investing, how does it gets calculated?
For say, if I am looking at ABSLLDF 5 years CAGR today i.e. 01/08/2020, it is 8.63%. https://coin.zerodha.com/funds/14057710.00206600/aditya-birla-life-duration-fund-direct-plan
So what is the period behind this calculation is it 01-08-2015 to 31/07/2020? I mean that the CAGR appearing on the coin or other platforms is rolling one or it is calculated at a particular day of every year.
Bhuvan, on coin it is point to point. It refers back to the same data \’n\’ years back and does the CAGRM math.
Wonderful write up…u guys have made finance so easy for some one like me from non finance background. Right from investing to derivative trading. U guys were one of the trigger for me read and invest rather than blindly investing based on news or advice. I owe u a lot…Thank u
So happy to hear that! Good luck and happy reading. Hope your investing journey is successful.
Sir, please explain me the procedure to have my data inputs in hand, for eg : if i want to roll 7-years return, what years range should be in hand atleast to calculate. I mean, do i need 7 years data to roll 7 years? I am confused at this point. Also, we are seeing it on daily rolling basis. How to do it – may be weekly or monthly ? And is it useful?
For example, if you want to stat from 2010, then need to have the data starting from 2013.
Karthik,
In varsity the login and signup is not working. I used to have an account here. Now when I try to login it doesn\’t work(even coming here from kite doesn\’t work). So I tried to create a new account but it says new account creation is disabled. I am not able to reply to a comment. It only creates a new separate comment. With account probably it is possible since you are able to reply.
Simha, we have disabled login and kept it open for all without login. You can read and comment freely without the headache of remembering login credentials :).
Extremely useful knowledge tip provided. Thank you Zerodha team…
Happy reading!
This is really an attempt to confuse. Its plain timing the market/ buying low selling high concept. Mathematically it appeals. If its known before hand what is low one can wait
to buy low. But even buffet can not tell as to which is going to be lowest.
Certainly not an attempt to confuse people. Everyone knows about timing the market, but we all know its easier said than done. The real message of this chapter is to help people understand that you should consider a wider set of data points to be aware of the range of returns that are possible. Also to drive home the fact that Eq funds can be risk if investments are made for short duration.
Totally agree. Your explanation of rolling returns just nailed home the equity volatility risk for short term. Understand that you took 2 yr example to make us understand the concept. But as a byproduct the equity volatility risk realization dawned upon me. Though I was aware of it before. -1% to 35% really drives home the point.
That was the point, to explain Rolling returns and also highlight the risk of Eq returns over short duration of time. Happy reading 🙂
Nice .. tell me the methode how to pull out money from mf when market is rooling down side. Correct procedure to withdraw money..
You just have to place a withdrawal request on the terminal.
Thanks for this insightful chapter on rolling returns. This is somewhat new to me.
Seems rolling returns average also doesn\’t fit. Since if I invest based on rolling returns average of 15%. But my actual return can be anywhere from -1% to 37%. So the 15% also kindof has no meaning. Seems the investment is very risky indeed. I agree that if the return is say between 8% and 25% with average of 15% then it makes sense. Probably 5/7 yr rolling returns might have lesser spread and be more meaningful. This probably also explains the fact that equity investments is for long term.
This is most insightful. Thanks!!
Thats absolutely right. 2 years of data is pointless when you look at EQ funds. But it is convenient to convey the point of having a widespread and explain rolling returns. For this reason, if you look at the last line, I\’ve mentioned that you need to take at least 5 years of data for EQ fund.