
23.1 – The Sortino’s Ratio
In this chapter, we will discuss two other ratios related to the mutual fund performance/risk measures, i.e. the Sortino Ratio and the Capture Ratios. These are fairly easy to understand, so we will try to keep this chapter as a short note.
We discussed the Sharpe Ratio in the previous chapter. The formula, if you remember looks like this –
Sharpe ratio = [Fund Return – Risk-Free Return]/Standard deviation of the fund
I want you to think about the denominator. The denominator has ‘Standard Deviation’, which, as you know, is an assessment of risk.
What sort of risk?
Well, we are talking about the risk of the returns varying from the average expected returns. Read that line again; we are defining risk as to the variation (or the variance) from the average expected returns. The variance can be both positive or negative.
Let me explain, have a look at the image below –
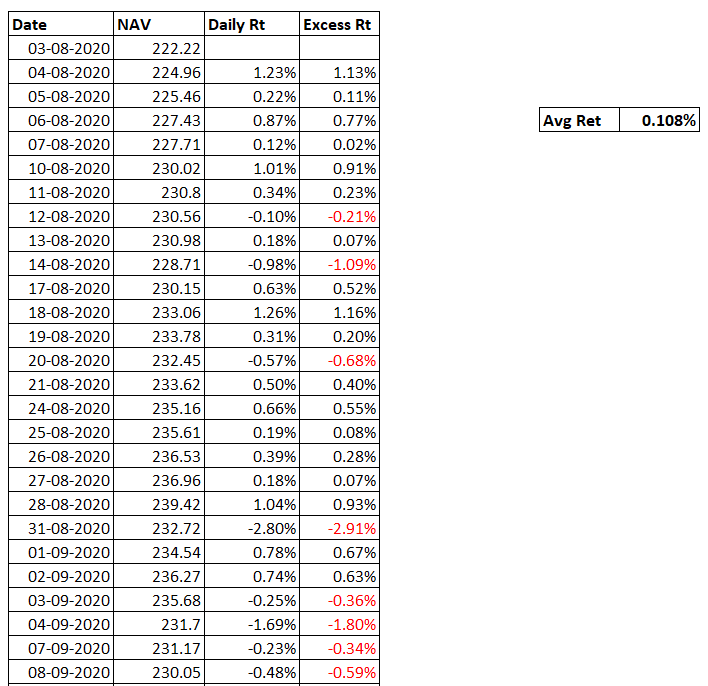
This is the sample daily NAV data for a Mutual fund. I’ve calculated the daily return for the fund for the time series, and I’ve also calculated the average daily return for the time series.
The average return is 0.108%.
Further, I calculate the excess return by subtracting the average return from the actual return. For example, the daily return for 4th August 2020 was 1.23%, the average return is 0.108%.
Hence, Excess Return –
= 1.23% – 0.108%
= 1.13%.
Of course, you square this return to get the variance, from which you further calculate the standard deviation or the risk.
The point that I want to make here is that when you take the excess return, you get both positive and negative values. A positive value indicates a profit and negative value indicates a loss.
Now, let us look at the Sharpe ratio again –
Sharpe ratio = [Fund Return – Risk-Free Return]/Standard deviation of the fund
By, using the ‘standard deviation’ in the denominator, we try to adjust the returns per unit of risk. However, the risk contains both positive and negative returns.
After all, we do not want to penalize the fund for a positive return; we need to scrutinize it for only the negative returns.
The Sortino’s ratio helps in this regard.
The Sortino’s ratio is an improvisation over the Sharpe Ratio, wherein the denominator has only the negative returns or the ‘downside risk’, is considered.
Hence, the Sortino’s Ratio is –
= [Fund Return – Risk-Free Return]/Downside Risk
The objective of Sortino’s ratio is to estimate the excess return adjusted for only the downside risk. Like the Sharpe ratio, higher the Sortino’s ratio, better it is.
Apart from this one change, there is not much difference between the Sharpe and Sortino’s Ratio.
23.2 – Capture Ratios
I find the capture ratios very interesting. In my opinion, the capture ratios overshadow all other metrics and get straight to the point.
Before I discuss these capture ratios, let me tell you a quick story from my college days.
We were a group of friends in the first year of Engineering; we were young, restless, and misguided in life. 😊
We were about 8-10 of us, always moved around in a group. Played cricket all day long, missed classroom sessions, and would sit in the parking lot spending hours talking about useless things in life. I must agree; it was a lot of fun 😊.
So much fun that we at times ignored exams around the corner, to the extent that most of us would barely manage to get a passing mark.
But there was this one guy in the group who was a little different. He would spend time with the rest of the gang, hang out, chit chat, play cricket, and go back home late. He would have all the fun the entire group had. However, around exam time, he would go back home to study and managed to do better than the rest of the group. Not that he scored great marks, but he certainly did better than the rest of us.

And we would all wonder how this guy did it. Sounds typical right? I’m sure many of you reading this may have come across similar situations in your college life.
But why am I telling you this story? Well, there is a reason for it.
Please think about this smart friend of mine. While he had 100% of the fun with the group, he knew when to cut the slack. He knew it was too risky to not study for the exams.
It may sound weird, but let’s extend this to mutual funds. Imagine this friend of mine as a mutual fund and the rest of us as the mutual fund’s benchmark.
When the group (or the benchmark) was having fun (or let’s say generating positive returns), so did this friend of mine(the mutual fund) to his full capacity.
When it was time to study, the group (benchmark) suffered (think of it as a negative return), but this friend had good risk management practise, he scored better than the group.
If we were to summarize his performance, he had max fun, but managed risk well, and fared slightly better than the rest.
The summary is nothing but the ‘Capture Ratio’.
The capture ratio tells us, for a given period, to what extent did the fund capture the positive returns of its benchmark and also to what extent it captured the negative returns from the benchmark.
Here is an example –
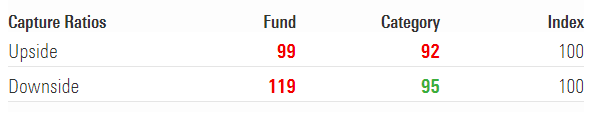
This is the capture ratio of HDFC Top 100, Direct, Growth fund on a 3-year basis. I’ve taken this from Morningstar India website.
The fund has an upside capture ratio of 99, which implies that the fund has managed to capture 99% of the Index’s upmove.
Likewise, the downside capture ratio is 119, which means that the fund has captured 119% of the downside returns of the Index.
The math behind capture ratio is elementary, but I’ll skip that since as an investor, you’d not need it.
All I want you to remember is that that the upside capture ratio conveys the extent to which the fund captures all the positive returns of its benchmark. The downside capture ratio indicates the extent to which the fund captures (or rather avoided) the negative returns of its benchmark.
Given this, ask yourself, what should be the ideal capture ratio of a mutual fund? Well, we would want the fund which captures 100% of the upside if not more. At the same time, we would want the downside capture ratio to be as low as possible.
Well, this is not easy 😊
A fund will either have a great upside or a great downside capture ratio, but not both.
A fund either has a great upside capture ratio along with a disappointing downside capture (like this HDFC fund) or you will find the other way round, where the upside capture is low and so is the downside capture.
Check this –
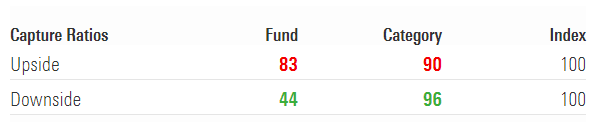
This is the capture ratio for the Parag Parikh Long term equity fund on a 3-year basis. While the upside is not impressive at all, the downside capture ratio is quite impressive.
So the point is that it is always a trade-off. You, as an investor, need to be clear on this – do you want the fund to be aggressive in chasing returns or do you want the fund to have a great risk management practice?
I prefer to look at the latter. I like funds which manage the risk better, and I evaluate this by looking at the consistency of the downside capture ratio, over many years.
If you look at HDFC Top 100, Regular Growth fund, the downside capture ratio on 3, 5, and 10 years are 120, 119, and 111 respectively. I like the consistency in risk management here, and I’d value this far higher than the upside capture ratio.
By the way, the 3, 5, and 10 year upside capture ratio is 98, 103, 104 for the same fund, which is not bad at all. Also, it does not matter if you choose to analyse the upside or downside capture ratio; what matters is the consistency. Hence it’s important to look at capture ratios across multiple years.
I usually check the capture ratios on the Morningstar India website. I’m not sure if these ratios are listed anywhere else.
And with this and everything else we have discussed in the previous chapter, I hope you’ve got a sense of all the different mutual fund metrics.
The next few chapters will focus on analyzing a mutual fund and building a mutual fund portfolio for specific financial goals.
Stay tuned.
Key takeaways from this chapter
- Sharpe ratio measures the return per unit of risk by considering both the positive and negative returns
- Sortino’s modifies the Sharpe ratio and includes just the downside risk
- Upside capture ratio gives you an estimate of how much of the Index’s upside the fund has captured
- Downside capture ratio gives you an estimate of how much of the Index’s downside returns the fund has captured.
- Look for consistency in capture ratio
Hi, you write…
\”we would want the fund which captures 100% of the upside if not more. At the same time, we would want the downside capture ratio to be as low as possible.\”… and further down….
\”… If you look at HDFC Top 100, Regular Growth fund, the downside capture ratio on 3, 5, and 10 years are 120, 119, and 111 respectively. I like the consistency in risk management here, and I’d value this far higher than the upside capture ratio.\”
Isn\’t there a contradiction between these two statements?
So, what is actually preferable with the Downside Capture Ratio? The less the better or just the consistency in Downside Capture Ratio, across years (\”Also, it does not matter if you choose to analyse the upside or downside capture ratio; what matters is the consistency\”).
I am a bit confused here. Would you please elaborate on this? TIA
I see these numbers on Morningstar for a Quant Small Cap mutual fund-growth option.
Upside capture ratios:
Investment:96
Category:81
Index:66
Downside capture ratio:
Investment:86
Category:67
Index:11
On this data, I have questions:
1) How come an index have an upside or downside capture ratio, what can be its benchmark index? – NIfty 50 or broader small cap index like nifty smallcap 250?
2) if small cap index moves UP by 66% then investment moves UP by 96%, is this interpretation correct?
1) Funds tracking index do. Index does not.
2) Ah no, capture ratios is an indicator of risk, not returns.
If MF is reinvesting the gains to increase the NAV is it good for investors or bad?
Well, the investor wants higher NAVs (after making an investment), so its good right 🙂
Where to get Sortino Ration and Sharpe ratio of particular mutual funds? any website?
Please do check the factsheet of the mutual fund scheme.
Hi karthik Sir,
Please say is this understanding right?
If the upside is more (positive returns) then the downside will also be more (negative returns). But we have to consider only the consistency.
This means the range between the either the upside or the downside should be within the closer value bound. ie,.. Upside – 90, 110, 70 (not good because of more fluctuation)
downside – 95, 98, 103 (is good because of less fluctuation).
Please correct me if i am wrong…..
Thats right, consistency matters Prashanth and that\’s what you need to look at.
Great content Mr. Karthik. I had a question, i see alpha of all Nifty 50 Index funds as negative (around – 1.5 for all), i understand Index funds will not generate excess returns, but why is it negative? Is it to account for expense ratios? Thanks much in advance.
Thats right, one cant expect alpha from index fund, and its -ve because of the tracking error.
You mentioned:
If you look at HDFC Top 100, Regular Growth fund, the downside capture ratio on 3, 5, and 10 years are 120, 119, and 111 respectively. I like the consistency in risk management here, and I’d value this far higher than the upside capture ratio.
But lets say a fund\’s downside capture ratio is 44, 91 and 73. Is that bad compared to HDFC Top 100? As in is consistency better than having a lower downside capture ratio?
Kapil, yes, as a thumbrule, consistency in stock markets is always better instead of short duration impressive numbers.
Sir, in the capture ratio table what does the column \’category\’ means? Like in Parag Parikh Long term equity fund it is written 90 for upside and 96 for downside
It means the category of the fund, like large cap, small cap etc.
Hi Karthik,
I am confused about how the capture ratio is different from the beta. Beta also tells how the stock will move based on the movement in the market. For example, for the beta of 1.2, if the market moves up by 1%, the stock moves up by 1.2%, and if the market moves down by 1% the stock moves down by 1.2%. So, beta sort of shows how the stock captures the upward and downward movement of the market. Similar to the way the capture ratio shows how the MF captures the upside and downside. So, why do we need capture ratio and increase one more indicator in our analysis?
There is a slight difference in both the ratios. Beta gives you the measure on an average basis what is the likelihood of the underlying moving as per the market. Capture ratio gives you a sense of how many of the up days and down days were captured by the underlying.
So if we look at Morningstar website, their the index portion in capture rations does not have a value =100 , but either more than 100 or even less and it changes as you move from 3,5,10 year frame. Am I missing something or should this be 100 for us to compare against it ??
100 is the reference value, anything more or less than 100 indicates the deviation from 100% of the movement.
Sir,
1. Is it the volatility which is understood by the risk here?
2. Regarding returns, can the midcap index fund expect to give better returns than the largecap 50 index fund considering good length of time?
1) Yes.
2) Hard to say 🙂
Sir,
You have nicely proved that the rolling retuns for Nifty 50/500 are more or less similar over time.
Meanwhile, for people who would be looking for higher rolling retunrs that Nifty 50/500, what would be the suggestion. Will the Midcap 150 index fund give moe rolling retuns over good period of time. What about the smallcap 250 index fund/smallcap 50 mutual fund?
N.B:
1. I shall not take this as investment advice, rather, will just look to learn things.
2. Can bear high risk,Can bear length of time for 20-30 years, only thing that capital should not loss.
Generally speaking, the higher the risk, the higher the return. This translates to all sorts of returns – XIRR, CAGR, Rolling Returns, or even absolute returns. So you will have to internalize the risk aspect. That said, the only thing you can use to mitigate the volatility is to give your investment a lot of time.
Like Rolling Returns, is it not possible to get Rolling Downside Capture Ratio or similar thing which may be better than point to point data.
Your Valuable Comments Please.
Regards.
Better, as the spotlight is just on the risk, do you mean? Perhaps, but I\’m not sure if such data is available.
Thank you!
Thanks a lot for this material. It\’s really helpful.
Some things I learned about Index funds:
1) They are passively managed so they have less expense ratio.
2) Talking about S&P 500 or NIFTY 50, they track the top companies for their respective indices and countries, so mostly signifying how the market is performing and conservatively speaking the return in any given year.
3) Most of the MFs are benchmarked against these indices and picking a mutual fund beating the benchmark is very tricky as not every mutual fund out there can beat those returns (I agree that they probably can lessen the losses but then not every time as we learned in this chapter).
If let\’s say we keep diversification out of the picture (which shouldn\’t be the case at all but just want to understand the importance of MF), then why should someone go with MF let\’s say Long Term Equity MF and not NIFTY 50? What should be the key reasons? I might be missing some context here, but I would really like to know your thoughts about this.
Thanks a lot.
1) Yes, that is correct
2) Correct
3) True, especially as markets become bigger or the fund becomes bigger
With the hope that the large-cap fund can outperform the index. This is easier said than done, but many funds in India have done it in the past. The question is, do you expect the same going forward? BAsed on that you can choose between IF or a largecap fund.
then when will you be able to tell me
how is capture ratio calculated I tried searching google but there is no definite formula different websites have different ways of calculating it
Need to check myself.
for calculating the standard deviation for -ve returns for sortino ratio, the number of observation for which the square root will be taken will be the number for which only the -ve returns were there or all the number of observations
eg:- if a fund has total number of observations as 30 and in it the -ve returns were for only 7 days, then for the calculation of downside risk sqrt of 7 will be taken or 30
YOu need to take 30.
2 questions:
1) When looking at Sharpe and Sortino ratios for comparing funds, say fund A has a better Sharpe ratio, while fund B has a better Sortino ratio. Which should be given more importance when selecting the fund? I am facing this situation for Axis Small Cap Fund (Fund A) and Quant Small Cap fund (Fund B). From Value Research, the Sharpe ratios are 1.17 and 1.15 for Funds A and B respectively, while the Sortino ratios are 1.03 and 1.47 respectively.
2) I have often found conflicting data on different websites such as value reaseach, morning start, advisorkhoj when it comes to the risk ratios. Is looking at the factsheet for these ratios supposed to be the gold standard? And when ratios such as sharpe, sortino, capture are not found in the factsheet, what should one generally trust?
Thank you. Just for your note, I have begun to use a lot of the techniques you mention here for comparing funds, and I sincerely thank you for the hard work you have put in.
1) Both are different ratios and both focus on the return profile. You can choose either and go ahead. I\’d probably pick Sortinos.
2) I\’d suggest you pick most of the data from the fund\’s fact sheet, but for ratios, maybe Valueresearch?
Happy learning!
if I want to calculate the fund return for any mutual fund for the calculation of Sharpe ratio and sortino ratio then the fund return would be calculated by the two NAV\’s .
like eg. – if I want to calculate 1 year return for a fund then the NAV on 1 may 2021 is 42.84 and on 29 April 2022 NAV is 48.02
then the return would be (48.02/42.84)-1 = 12.09%
is this method for calculating fund return correct or is there any other way
Yes, but the NAVs dont vary so much on a daily basis. I supposed that is just for the illustration you\’ve used.
I don\’t get it. Why is consistency the thing to look for in case of capture ratios? Suppose a fund\’s downside ratio was to go down considerably, wouldn\’t that be a good thing?
That\’s because you dont want your long-term investments (things like retirement corpus) to have volatility.
Thanks for the prompt reply 🙂 I will be going through rest of the chapters shortly
Sure! Happy learning 🙂
Why is \’consistently\’ high downside capture ratio good? Doesn\’t it mean that risk management is relatively poor, consistently?
And how to choose between the 2 funds in your example- Hdfc and Ppfas? Beyond \’personal\’ preference for return v/s risk management, isn\’t there a more objective metric?
Context-
\”If you look at HDFC Top 100, Regular Growth fund, the downside capture ratio on 3, 5, and 10 years are 120, 119, and 111 respectively. I like the consistency in risk management here, and I’d value this far higher than the upside capture ratio\”
Not high as such, but I like the fact that the capture ratio especially on the downside is consistent. Consistency gives you a send of \’what to expect, in terms of risk. The other chapters give you a sense of how to objectively select a fund.
Hello Sir,
I completely understand returns.
What I don\’t understand is how they calculated the risk and found the volatility to be 27%
Risk is measured in terms of standard deviation. So when you apply the =STDEV() function on the return series, you get the risk of a stock.
Hello Sir,
I hope you are doing well.
How does one find the risk adjusted for stocks.
For example HDFC bank has an absolute return of 35.73%(YOY), while the risk is 1.31% and volatility is 27%.
I found this stat from market mojo website. How does calculate and understand this?
I\’d suggest you take a look at the mutual fund returns chapter, have put up content on this. The same techniques can be applied to MFs.
Can upside capture ratio be greater than 100?
I guess so.
Sir I have following doubts:
1. What is the basis of giving the names SHARPE and SORTINO ?
2. What is turn over ratio in a mutual fund?
3. Why rating (like 5 star, 4 star etc.) on funds investing in international markets (like Nippon India US Opportunities fund etc.) not easily available?
4. I have seen many multicap funds of different fund houses have shifted to flexi cap funds. Why?
Regards
1) These are the inventors of the ratio
2) The rate at which stocks are bought and sold
3) Not sure
4) Name change I suppose.
Sir, then –
Downside Risk = SD / 2
Yes, many consider that way as well.
Hi Sir, Kindly clarify if I\’m right –
Downside Risk = Square root of ((Sum of squares of all negative returns) divided by (No. of such entries))
While in Standard deviation, we are taking –
Standard Deviation = Square root of ((Sum of squares of all the returns – whether positive or negative) divided by (No. of all entries))
Std deviation includes both positive and -ve returns, whereas downside risk is just the risk of prices going down. Hence dividing SD by 2 should be good enough.
If you don\’t mind, I would like to ask what engineering course did you do that you mentioned in this article?
And how did you get into finance, trading and investment?
🙂
Telcom 🙂
My facination to markets, drew me closer to this world 🙂
Assuming that the benchmark moves from 100 to 120 and the upside capture ratio being 90; does it imply that the fund is able to generate a return of (90% of 20)?
Also, is there any relationship between beta and capture ratio?
Thats right. Hmm, about beta and capture ratio, I don\’t think so.
Hi Karthik,
Does the below downside capture ratio is not looking bad apart from being consistent in range ?
“ If you look at HDFC Top 100, Regular Growth fund, the downside capture ratio on 3, 5, and 10 years are 120, 119, and 111 respectively. I like the consistency in risk management here, and I’d value this far higher than the upside capture ratio.”
That\’s right, Ashok. Consistency matters.
Thanks a lot. Unfortunately their numbers also don\’t match with each other 😀
The fund itself publishes these in their fact sheet right?
I am fan of varsity. All the modules and articles are amazing.
I have a question. I looked at Mirae Asset large cap fund – G (Direct) on money control, value research and morning star. All 3 websites provided different numbers for the ratios discussed in article. If as an investor I cannot calculate these, is there any dependable site which can be trusted for these ratios?
Not sure why, I\’d suggest you consider either Value research or Morning star.
Got it sir👍
Good luck, Avi.
Hi sir,Sir what value did you take for downside risk
And how to calculate
Have mentioned that in the chapter itself, Avi.
Yes sir i agree
Sir i have zero knowledge on excel do l need to learn excel to calculated the ratios
And
Can one invest starting from 100 in coin by Zerodha
I think 500 is the starting point.
Sir Hdfc downside capture ratio is 119 which means that fund has given more negative returns than the benchmark
And upside 93 is also in Red
Then how can it be good
Bharath, as I mentioned in the chapter, what matters is the consistency of risk management, you need to rate that.
Sir, I was asking about G-Sec. I am not able to find those on Coin app. The link you pasted opens up web login. So do I need to login through web everytime.
Thank you!
On the web, yes.
Thank you Sir,
Is it available through Coin App. Because I am not able to find it on app. Link opens web login.
Do you mean these ratios? No, these are not available on Coin.
Thank you very much Sir for this enormous and important information. I would like to convert my existing regular funds to direct plan. Is there any procedure to do this without redeeming/switching existing funds?
I would also like to know, whether we can invest in Government instruments like T-Bills, Bonds or G-Sec directly from various Zerodha Platforms?
Thank you once again, awaiting most important part of this topic i.e. selection of MFs.
Nilesh, unfortunately, the only way to do this is by selling regular and reinvesting the same in the direct funds.
Do check this for Govt Securities – https://coin.zerodha.com/gsec
I am so glad all this is free. Thank You 🙂
Happy learning!
Hi Karthik,
How many chapters would you say might be left in this module?
At least another 5-6 I guess.
Hi what does a 120 downside capture ratio mean vis a vis a index 100 ? Does it mean that the fund has captured 20% more downfall than the index ?
Not the index, but its benchmark. Thats right, 120 means, 20% riskier compared to its benchmark.
Sir, when will the complete pdf for personal finance will be available?
Once the module is complete.
The downside capture in Parag\’s fund is impressive because it is 44. But then, why is HDFC100 impressive when the downside is more than 100. Isn\’t the downside more than 100 quite bad sign?
You cant get best of both worlds. Do check PPFAs upside capture ratio as well.
Hi Karthik,
Thanks for all the material. It was really amazing.
Any update when the next module will be out.
Next module will take time, I\’m yet to finish this module 🙂
Sir, according to AMFI, now we can place equity MUTUAL FUND orders upto 3PM for getting same day NAV benefit. But zerodha coin is accepting orders upto 1.30PM from 19.10.2020 onwards. Why is there the time difference?
Subhadip, prior to April, we kept our cutoff at 1:30 pm as it was 3 PM for all schemes and followed the same time difference once the cutoff was revised to 1 PM. However, we are working on extending our 1:30 PM cutoff for equity schemes close to the prescribed 3 PM cut off in the next few weeks.
Sir,
If upside capture ratio is max ie.95 to at least 100 or above is better.And downside capture ratio should be minimum say below 50 is ok.So from above given two examples,we have to sell sell out
HDFC & also Parag Patil from our portfolio.Is this ok?
Please give more examples of mutual funds ,explaining how they are giving good return\’s .
Ah, please don\’t take decisions based on just these parameters. You need to look at it from a holistic approach. Capture ratio is just one of them. Btw, both these funds are good 🙂