
18.1 – Striking it right
The last couple of chapters have given a basic understanding on volatility, standard deviation, normal distribution etc. We will now use this information for few practical trading applications. At this stage I would like to discuss two such applications –
- Selecting the right strike to short/write
- Calculating the stoploss for a trade
However at a much later stage (in a different module altogether) we will explore the applications under a different topic – ‘Relative value Arbitrage (Pair Trading) and Volatility Arbitrage’. For now we will stick to trading options and futures.
So let’s get started.
One of the key challenges an option writer always faces is to select the right strike so that he can write that option, collect the premium, and not really be worried about the possibility of the spot moving against him. Of course, the worry of spot moving against the option writer will always exist, however a diligent trader can minimize this.
Normal Distribution helps the trader minimize this worry and increase his confidence while writing options.
Let’s have a quick recap –
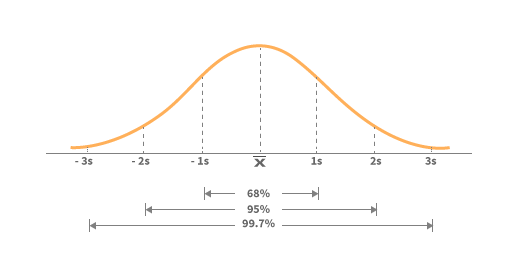
The bell curve above suggests that with reference to the mean (average) value –
- 68% of the data is clustered around mean within the 1st SD, in other words there is a 68% chance that the data lies within the 1st SD
- 95% of the data is clustered around mean within the 2nd SD, in other words there is a 95% chance that the data lies within the 2nd SD
- 99.7% of the data is clustered around mean within the 3rd SD, in other words there is a 99.7% chance that the data lies within the 3rd SD
Since we know that Nifty’s daily returns are normally distributed, the above set of properties is applicable to Nifty. So what does it mean?
This means, if we know Nifty’s mean and SD then we can pretty much make an ‘educated guess’ about the range within which Nifty is likely to trade over the selected time frame. Take this for example –
- Date = 11th August 2015
- Number of days for expiry = 16
- Nifty current market price = 8462
- Daily Average Return = 0.04%
- Annualized Return = 14.8%
- Daily SD = 0.89%
- Annualized SD = 17.04%
Given this I would now like to identify the range within which Nifty will trade until expiry i.e 16 days from now –
16 day SD = Daily SD *SQRT (16)
= 0.89% * SQRT (16)
= 3.567%
16 day average = Daily Avg * 16
= 0.04% * 16 = 0.65%
These numbers will help us calculate the upper and lower range within which Nifty is likely to trade over the next 16 days –
Upper Range = 16 day Average + 16 day SD
= 0.65% + 3.567%
= 4.215%, to get the upper range number –
= 8462 * (1+4.215%)
= 8818
Lower Range = 16 day Average – 16 day SD
= 0.65% – 3.567%
= 2.920% to get the lower range number –
= 8462 * (1 – 2.920%)
= 8214
The calculation suggests that Nifty is likely to trade anywhere in the region of 8214 to 8818. How sure are we about this, well we know that there is a 68% probability for this calculation to work in our favor. In other words there is 32% chance for Nifty to trade outside 8214 and 8818 range. This also means all strikes outside the calculated range ‘may’ go worthless.
Hence –
- You can sell all call options above 8818 and collect the premiums because they are likely to expire worthless
- You can sell all put options below 8214 and collect the premiums because they are likely to expire worthless
Alternatively if you were thinking of buying Call options above 8818 or Put options below 8214 you may want to think twice, as you now know that there is a very little chance for these options to expire in the money, hence it makes sense to avoid buying these strikes.
Here is the snapshot of all Nifty Call option strikes above 8818 that you can choose to write (short) and collect premiums –
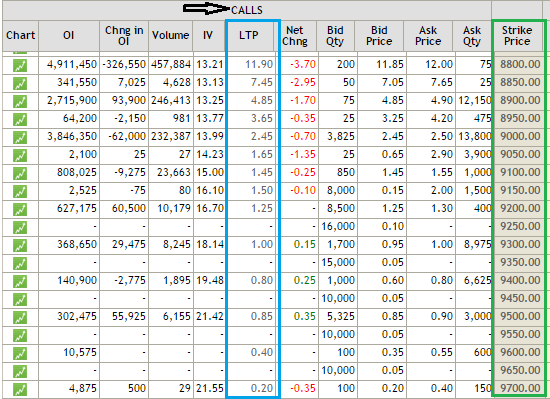
If I were to personally select a strike today it would be either 8850 or 8900 or probably both and collect Rs.7.45 and Rs.4.85 in premium respectively. The reason to select these strikes is simple – I see an acceptable balance between risk (1 SD away) and reward (7.45 or 4.85 per lot).
I’m certain many of you may have this thought – if I were to write the 8850 Call option and collect Rs.7.45 as premium, it does not really translate to any meaningful amount. After all, at Rs.7.45 per lot it translates to –
= 7.45 * 25 (lot size)
= Rs.186.25
Well, this is exactly where many traders miss the plot. I know many who think about the gains or loss in terms of absolute value and not really in terms of return on investment.
Think about it, margin amount required to take this trade is roughly Rs.12,000/-. If you are not sure about the margin requirement then I would suggest you use Zerodha’s margin calculator.
The premium amount of Rs.186.25/- on a margin deposit of Rs.12,000/- works out to a return of 1.55%, which by any stretch on imagination is not a bad return, especially for a 16 day holding period! If you can consistently achieve this every month, then we are talking about a return of over 18% annualized just by means of option writing.
I personally use this strategy to write options and I’d like to share some of my thoughts regarding this –
Put Options – I don’t like to short PUT options for the simple reason that panic spreads faster than greed. If there is panic in the market, the fall in market can be much quicker than you can imagine. Hence even before you can realize the OTM option that you have written can soon become ATM or ITM. Therefore it is better to avoid than regret.
Call Options – You inverse the above point and you will understand why writing call options are better than writing put options. For example in the Nifty example above, for the 8900 CE to become ATM or ITM Nifty has to move 438 points over 16 days. For this to happen, there has to be excess greed in the market…and like I said earlier a 438 up move takes a bit longer than 438 down move. Therefore my preference to short only call options.
Strike identification – I do the whole exercise of identifying the strike (SD, mean calculation, converting the same w.r.t to number days to expiry, selecting appropriate strike only the week before expiry and not before that. The timing here is deliberate
Timing – I prefer to short options only on the last Friday before the expiry week. For example given the August 2015 series expiry is on 27th, I’d short the call option only on 21st August around the closing. Why do I do this? This is to mainly ensure that theta works in my favor. Remember the ‘time decay’ graph we discussed in the theta chapter? The graph makes it amply evident that theta kicks in full force as we approach expiry.
Premium Collected – Because I write call options very close to expiry, the premiums are invariably low. The premium that I collect is around Rs.5 or 6 on Nifty Index, translating to about 1.0% return. But then I find the trade quite comforting for two reasons – (1) For the trade to work against me Nifty has to move 1 SD over 4 days, something that does not happen frequently (2) Theta works in my favor, the premiums erode much faster during the last week of expiry favoring the option seller
Why bother ? – Most of you may have this thought that the premiums are so low, why should I even bother? Honestly I too had this thought initially; however over time I have realized that trades with the following characteristics makes sense to me –
- Visibility on risk and reward – both should be quantifiable
- If a trade is profitable today then I should be able to replicate the same again tomorrow
- Consistency in finding the opportunities
- Assessment of worst case scenarios
This strategy ticks well on all counts above, hence my preference.
SD consideration – When I’m writing options 3-4 days before expiry I prefer to write 1 SD away, however for whatever reason when I’m writing the option much earlier then I prefer to go 2 SD away. Remember higher the SD consideration, higher is the confidence level but lower is the premium that you can collect. Also, as a thumb rule I never write options when there is more than 15 days for expiry.
Events – I avoid writing options whenever there are important market events such as monetary policy, policy decision, corporate announcement etc. This is because the markets tend to react sharply to events and therefore a good chance of getting caught on the wrong side. Hence it is better safe than sorry.
Black Swan – I’m completely aware that despite all the precaution, markets can move against me and I could get caught on the wrong side. The price you pay for getting caught on the wrong side, especially for this trade is huge. Imagine you collect 5 or 6 points as premium but if you are caught on the wrong side you end up paying 15 or 20 points or more. So all the small profits you made over 9 to 10 months is given away in 1 month. In fact the legendary Satyajit Das in his highly insightful book “Traders, Guns, and Money” talks about option writing as “eating like a hen but shitting like an elephant’.
The only way to make sure you minimize the impact of a black swan event is to be completely aware that it can occur anytime after you write the option. So here is my advice to you in case you decide to adopt this strategy – track the markets and gauge the market sentiment all along. The moment you sense things are going wrong be quick to exit the trade.
Success Ratio – Option writing keeps you on the edge of the seat. There are times when you feel that markets are going against you (fear of black swan creeps in) but only to cool off eventually. When you write options such roller coaster feelings are bound to emerge. The worst part is that during this roller coaster ride you may be forced to believe that the market is going against you (false signal) and hence you get out of a potentially profitable trade.
In fact there is a very thin line between a false signal and an actual black swan event. The way to overcome this is by developing conviction in your trades. Unfortunately I cannot teach you conviction; you will have to develop that on your own J. However your conviction improves as and when you do more of these trades (and all trades should be backed by sound reasoning and not blind guesses).
Also, I personally get out of the trade when the option transitions from OTM to ATM.
Expenses – The key to these trades is to keep your expense to bare minimum so that you can retain maximum profits for yourself. The expenses include brokerage and applicable charges. If you short 1 lot of Nifty options and collect Rs.7 as premium then you will have to let go few points as expense. If you are trading with Zerodha, your expense will be around 1.95 for 1 lot. The higher the number of lots the lesser is your expense. So if I were trading 10 lots (with Zerodha) instead of 1, my expense drastically comes down to 0.3 points. You can use Zerodha’s brokerage calculator to get the details.
The cost varies broker to broker so please do make sure your broker is not greedy by charging you ridiculous brokerage fees. Even better, if you are not with Zerodha, it is about time you join us and become a part of our beautiful family ☺
Capital Allocation – An obvious question you might have at this stage – how much money do I deploy to this trade? Do I risk all my capital or only a certain %? If it’s a %, then how much would it be? There is no straight forward answer to this; hence I’ll take this opportunity to share my asset allocation technique.
I’m a complete believer in equities as an asset class, so this rules out investment in Gold, Fixed Deposit, and Real Estate for me. 100% of my capital (savings) is invested in equity and equity based products. However it is advisable for any individual to diversify capital across multiple asset classes.
So within Equity, here is how I split my money –
- 35% of my money is invested in equity based mutual funds via SIP (systematic investment plan) route. I have further divided this across 4 funds.
- 40% of my capital in an equity portfolio of about 12 stocks. I consider both mutual funds and equity portfolio as long term investments (5 years and beyond).
- 25% is earmarked for short term strategies.
The short term strategies include a bunch of trading strategies such as –
- Momentum based swing trades (futures)
- Overnight futures/options/stock trades
- Intraday trades
- Option writing
I make sure that I do not expose more than 35% of the 25% capital for any particular strategy. Just to make it more clear, assume I have Rs.500,000/- as my capital, here is how I would split my money –
- 35% of Rs.500,000/- i.e Rs.175,000/- goes to Mutual Funds
- 40% of Rs.500,000/- i.e Rs.200,000/- goes to equity portfolio
- 25% of Rs.500,000/- i.e Rs.125,000/- goes to short term trading
- 35% of Rs.125,000/- i.e Rs.43,750/- is the maximum I would allocate per trade
- Hence I will not short more than 4 lots of options
- 43,750/- is about 8.75% of the overall capital of Rs.500,000/-
So this self mandated rule ensures that I do not expose more than 9% of my over all capital to any particular short term strategies including option writing.
Instruments – I prefer running this strategy on liquid stocks and indices. Besides Nifty and Bank Nifty I run this strategy on SBI, Infosys, Reliance, Tata Steel, Tata Motors, and TCS. I rarely venture outside this list.
So here is what I would suggest you do. Run the exercise of calculating the SD and mean for Nifty, Bank Nifty on the morning of August 21st (5 to 7 days before expiry). Identify strikes that are 1 SD away from the market price and write them virtually. Wait till the expiry and experience how this trade goes. If you have the bandwidth you can run this across all the stocks that I’ve mentioned. Do this diligently for few expiries before you can deploy capital.
Lastly, as a standard disclaimer I have to mention this – the thoughts expressed above suits my risk reward temperament, which could be very different from yours. Everything that I mentioned here comes from my own personal trading experience, these are not standard practices.
I would suggest you note these points, understand your own risk-reward temperament, and calibrate your strategy. Hopefully the pointers here should help you develop that orientation.
This is quite contradicting to this chapter but I have to recommend you to read Nassim Nicholas Taleb’s “Fooled by Randomness” at this point. The book makes you question and rethink everything that you do in markets (and life in general). I think just being completely aware of what Taleb writes in his book along with the actions you take in markets puts you in a completely different orbit.
18.2 – Volatility based stoploss
The discussion here is a digression from Options, in fact this would have been more apt in the futures trading module, but I think we are at the right stage to discuss this topic.
The first thing you need to identify before you initiate any trade is to identify the stop-loss (SL) price for the trade. As you know, the SL is a price point beyond which you will not take any further losses. For example, if you buy Nifty futures at 8300, you may identify 8200 as your stop-loss level; you will be risking 100 points on this particular trade. The moment Nifty falls below 8200, you exit the trade taking the loss. The question however is – how to identify the appropriate stop-loss level?
One standard approach used by many traders is to keep a standard pre-fixed percentage stop-loss. For example one could have a 2% stop-loss on every trade. So if you are to buy a stock at Rs.500, then your stop-loss price is Rs.490 and you risk Rs.10 (2% of Rs.500) on this trade. The problem with this approach lies in the rigidity of the practice. It does not account for the daily noise / volatility of the stock. For example the nature of the stock could be such that it could swing about 2-3% on a daily basis. As a result you could be right about the direction of the trade but could still hit a ‘stop-loss’. More often than not, you would regret keeping such tight stops.
An alternate and effective method to identify a stop-loss price is by estimating the stock’s volatility. Volatility accounts for the daily ‘expected’ fluctuation in the stock price. The advantage with this approach is that the daily noise of the stock is factored in. Volatility stop is strategic as it allows us to place a stop at the price point which is outside the normal expected volatility of the stock. Therefore a volatility SL gives us the required logical exit in case the trade goes against us.
Let’s understand the implementation of the volatility based SL with an example.
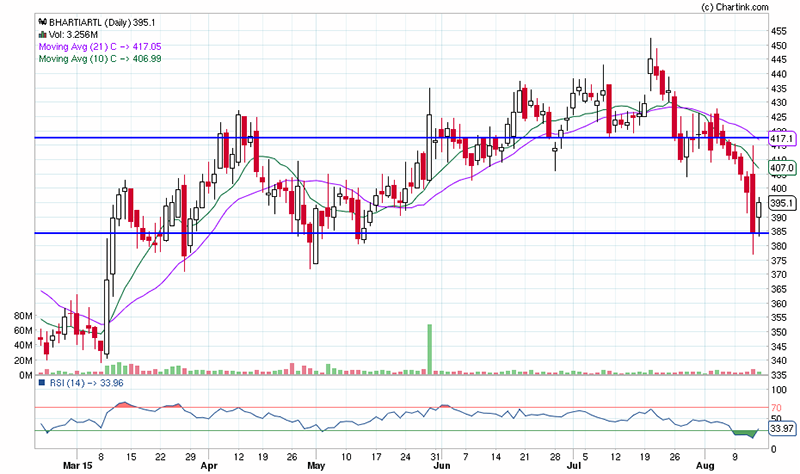
This is the chart of Airtel forming a bullish harami, people familiar with the pattern would immediately recognize this is an opportunity to go long on the stock, keeping the low of the previous day (also coinciding with a support) as the stoploss. The target would be the immediate resistance – both S&R points are marked with a blue line. Assume you expect the trade to materialize over the next 5 trading sessions. The trade details are as follows –
- Long @ 395
- Stop-loss @ 385
- Target @ 417
- Risk = 395 – 385 = 10 or about 2.5% below entry price
- Reward = 417 – 385 = 32 or about 8.1% above entry price
- Reward to Risk Ratio = 32/10 = 3.2 meaning for every 1 point risk, the expected reward is 3.2 point
This sounds like a good trade from a risk to reward perspective. In fact I personally consider any short term trade that has a Reward to Risk Ratio of 1.5 as a good trade. However everything hinges upon the fact that the stoploss of 385 is sensible.
Let us make some calculations and dig a little deeper to figure out if this makes sense –
Step 1: Estimate the daily volatility of Airtel. I’ve done the math and the daily volatility works out to 1.8%
Step 2: Convert the daily volatility into the volatility of the time period we are interested in. To do this, we multiply the daily volatility by the square root of time. In our example, our expected holding period is 5 days, hence the 5 day volatility is equal to 1.8%*Sqrt(5). This works out to be about 4.01%.
Step 3. Calculate the stop-loss price by subtracting 4.01% (5 day volatility) from the expected entry price. 395 – (4.01% of 395) = 379. The calculation above indicates that Airtel can swing from 395 to 379 very easily over the next 5 days. This also means, a stoploss of 385 can be easily knocked down. So the SL for this trade has be a price point below 379, lets say 375, which is 20 points below the entry price of 395.
Step 4 : With the new SL, the RRR works out to 1.6 (32/20), which still seems ok to me. Hence I would be happy to initiate the trade.
Note : In case our expected holding period is 10 days, then the 10 day volatility would be 1.6*sqrt(10) so on and so forth.
Pre-fixed percentage stop-loss does not factor in the daily fluctuation of the stock prices. There is a very good chance that the trader places a premature stop-loss, well within the noise levels of the stock. This invariably leads to triggering the stop-loss first and then the target.
Volatility based stop-loss takes into account all the daily expected fluctuation in the stock prices. Hence if we use a stocks volatility to place our stop-loss, then we would be factoring in the noise component and in turn placing a more relevant stop loss.
Key takeaways from this chapter
- You can use SD to identify strikes that you can write
- Avoid shorting PUT options
- Strikes 1 SD away offers 68% flexibility, if you need higher flexibility you could opt for 2SD
- Higher the SD, higher is the range, and lower is the premium collected
- Allocate capital based on your belief in asset classes. It is always advisable to invest across asset classes
- It always makes sense to place SL based on daily volatility of the stock
Hello Sir,
Thank you for creating the financial educational content which is comprehensive and yet, easy to understand.
In the calculation above I am unable to understand how the annualized numbers were arrived.
Daily Average Return = 0.04%
Annualized Return = 14.8%
Daily SD = 0.89%
Annualized SD = 17.04%
However, as per my calculation Annualized Return is .04*252 = 10.08% and Annualized SD = .89*sqrt(252) = 14.12%.
Is my calculation correct or I am doing something wrong?
That is correct, but instead of 252, some prefer to take the full calendar year as opposed to just the number of trading days.
Dear Karthik Big fan of yours, please can you adjust the calulations to identify the strike based on the new exiry days regime. Now as we have expiry on Tuesday for Nifty, it will be better you can explain that from this perspectove
Thanks, Ramen. Its just the day shift, nothing changes.
Hi Karthik I have question regarding expiry, let suppose i sold many OTM call to receive the premium, so to get exit out of the trade on expiry day, do I need to exit before 3:30 PM or leave them, and broker will settle them automatically in CASH?
and let suppose there is seller when we want to square of the position. then how we will buy back? and if we were unable to do so, then what will hapen?
It depends, if there are buyers, your order will go through, else it wont.
You can leave it to expiry, the option will expire worthless anyway. Problem is if it turns ITM, then there will be settlement basis the price.
hi karthick sir
i have calculated the nifty daily mean/average for 18.09.2024 to 17.09.2025
the value is -.008%
is that correct or not sir
what to do if the value is negative sir
If Nifty has trended down during that period, it could be -ve right?
Hi Sir,
Can I use Volatility based targets for stocks that only have a support and no resistance, to Calculate if the RRR values are greater than 1.5, as they are near their all time high.
Of course, you can. Vol based SL has nothing to do with support and resistance levels, you can treat them independently.
Hi karthik in current chapter example we are multiplying 2SD
volaitlity normal distribution
Average + 2 SD (Upper Range) and Average – 2 SD (Lower Range)
= 1.15% + 2* 5.73% = 12.61%
= 1.15% – 2* 5.73% = -10.31%
but in previous chapter
ie;(volatility-applications) example why are we adding 1 to 4.215% it should multiply
Upper Range = 16 day Average + 16 day SD
= 0.65% + 3.567%
= 4.215%, to get the upper range number –
= 8462 * (1+4.215%)
= 8818
Hi karthik in the below chapter ex we are multiplying 2SD
volaitlity normal distribution
Average + 2 SD (Upper Range) and Average – 2 SD (Lower Range)
= 1.15% + 2* 5.73% = 12.61%
= 1.15% – 2* 5.73% = -10.31%
but in below example why are we adding 0ne it should multuply for 1SD
volatility-applications
Upper Range = 16 day Average + 16 day SD
= 0.65% + 3.567%
= 4.215%, to get the upper range number –
= 8462 * (1+4.215%)
= 8818
Dorry, not sure if I got your query fully, but for 1 SD, the co efficient is 1 right?
do we have to calculate daily and annualized value for average and standard deviation manually everytime. OR we can just get the data from nse website. I have been able to find daily and annualized volatility of nifty contracts but not averages. Can we have this data over nse?
For quick reference, you can always take it from the website.
Dear Karthik,
First of all, thank you for the excellent content. I tried applying these principles for identifying the strike price of Nifty 50 but got few questions here.
1. I have downloaded the Nifty50 historical data on 27-Jun-25
2. Calculated volatility (Standard deviation) whose value is 0.86%
3. Daily average = -0.02%
4. SPOT of Nifty 50 = 25,620
5. Date of Option expiry = 3-Jul-25
6. Days to expiry = 4 days (Not counting Saturday and Sunday)
Calculations:
4 Days SD 1.72%
4 Days Average -0.10%
Upper Range 1.62% and strike price = 25621
Lower Range -0.88% and strike price 25621
Here I am confused. The Upper range and Lower range are same. The strike price is just 1 point above the spot. Am I doing something wrong? Can you please comment on this?
I guess I found the mistake. I am multiplying the SPOT value with logarithmic %. I should first convert them into exponential and them multiply with SPOT.
But I would like to hear from you (Karthik) if I have missed anything.
Ah ok. Glad you figured 🙂
I think you subtracted volatility and added average incorrectly (or vice versa). Can you please double check?
Hi Karthik,
Let\’s say we have a two year daily closing price data of nifty. Starting from the 2nd year if I find out the natural log of the yearly returns and then standard deviation, does this standard deviation approximately equal to the yearly standard deviation using square root method?(daily std dev * sqrroot(252))
Thanks,
Siva
Yes, on approximation, it does 🙂
At the bottom in \”note\” section where we calculate 10 days volatility, why we have multiply it with 1.6 instead of 1.8??
Probably some error
Dear Mr Rangappa,
Thank you very much for the entire Zerodha Varsity series. The entire series is an outstanding compilation and most of my knowledge of trading and investing is from the wonderful, lucid chapters that you have written. I cannot thank you enough for the same.
After going through this Chapter, I was wondering how to estimate the time that I \”expect\” (5 days in the chapter above) to hold the position. In the aforesaid text, it is one of the inputs based on which we are computing the volatility. How do I form this kind of an expectation.
Kindly guide me.
Kind regards,
Thanks Barun for the kind words, and I\’m glad you liked Varsity.
These expectations can be draw by looking at historical volatility and comparing with the present day volatility.
Hi karthik, first of all i would like to thank you for writing such great modules in a simplified manner.However just wanted to clarify that in the last topic of this chapter \”volatility based stoploss\”, you have directly subtracted the standard deviation of 5 days from the expected entry price instead of subtracting it from 5 days average & then converting it in exp(%) to get the range of the stock price for next 5 days.could you please provide the rational behind it…as same was not exercised in the previous chapters.
Here is the exact calculation for determining the price range:
Calculate daily log returns.
Calculate the mean and standard deviation (SD) of the log returns series.
The 68% confidence interval is:
Current Price × exp(mean × time ± SD × √time)
The 95% confidence interval is:
Current Price × exp(mean × time ± 2 × SD × √time)
This process involves computationally intensive tasks such as calculating log returns and exponentials.
Under the following circumstances, the above calculations can be approximated with simpler methods:
Short time periods: When the time period is small, the term (mean × time) becomes negligible compared to (SD × √time). That is, mean × time << SD × √time.
Small daily movements (<10%): When daily percentage movements are less than 10%, percentage returns and log returns are nearly equal. Since percentage returns are computationally faster to calculate than log returns, they are often used as an approximation.
A computationally faster approximation method is:
Calculate percentage returns.
Calculate the mean and standard deviation.
The 68% confidence interval is:
Current Price × (1 ± SD × √time)
The 95% confidence interval is:
Current Price × (1 ± 2 × SD × √time)
I might have switched between the approximate and accurate methods in different chapters.
If you are implementing a system, a good rule of thumb is:
Use the simpler method by default. If the calculated price range exceeds 20%, recalculate using the accurate method. Otherwise, proceed with the approximation.
In last but 2nd para airtel volatility is 1.8*sqrt of 10 for 10 holding days right?
It is mentioned 1.6
Ah, need to check. Will get back.
Hey Karthik, I think something is wrong with the video, as it runs only 41 seconds. Could you help me out with this?
Thank you
Ah, I think there was one more. Will share.
Thanks a lot
Happy learning!
Hello Karthik, Excellent Module on option trading.
I have a doubt, How can I use Volatility based stop loss for trading options?
Found an old video, please excuse the quality, but the concept stays intact 🙂
https://www.youtube.com/live/IrSZBgFCf00?si=yHpYjy69YKRnL8wl
the video lasts 41 seconds
Hello Karthik,
I have a doubt, Last chapter you have taken exponential to convert the LN % to regular % for calculating range , and In this Module here you have added and subtracted 1 from the (avg+sd & avg-sd), which one is correct.
Can you please clarify on this? Are both the same?
These are two different techniques, Arun. I\’ve explained this in earlier comments.
Just Gone through Nassim Nicholas Taleb\’s framework on building a barbell portfolio.
Where 90% of the assets are parked in a safest side(Hyperconservative) like t-bills and 10% of the assets are parked in speculative bets(Hyperagressive) like option portfolio, high beta stocks.
I think it\’s an amazing approach to apply in real life to deal with randomness and black swan events.
The payoff graph in sensibull (\”Unlimited Loss\”) might give crazy amount of anxiety while dealing with selling overnight strangles. 🙂
Hahah, sure. This has been practiced for a long time now. The core and satellite approach to portfolio building also works on similar lines.
hi, sir can you please also explain what to do if i get a negative average/mean value.
Its possible, especially when the returns are trending down. Maybe buy puts 🙂
when will you make a chapter on \”volatility arbitrage\” as you said at the starting of this chapter there\’s already one on pair trading
Ah, check option strategies. Straddle, strangles etc are all part of Vol arb.
No worries, but can you please clear out a few points for me?
1. To calculate daily average for a year, I should divide the daily returns by 252? Is there any website where the daily average is available?
2. For the SD, I can refer the NSE website, right?
3. If I use the ln(y\’day\’s price/today\’s price), the calculation for the range for the next 7 day is
=((daily average * 7)(-/+)(SD*sqrt(7)))
This would be really helpful, thank you:)
1) No, you need to multiply daily return with 252.
2) Yes, you can.
3) Yes.
Hi Karthik, can you please confirm if the following calculation for Nifty sep 19 expiry is right?
spot: 25388.9
days: 7
dailyAverage: -0.000927225
dailySD: 0.0087
AvgForGivenDays(7): -0.006490578
SDForGivenDays(7): 0.023018036
Lower Range 24639.70875
Upper Range 25808.514
Thanks a ton:)
Ah, wont be able to do that Dixit 🙂
Since there is a higher chances that the data lies in the range, so we can make more accurate decisions?
Makes sense to think of this in terms of range, as opposed to a specific value.
In the 1 example; why did you select 1SD and not 2/3 SD? since 2 and 3 SD are more accurate than 2sd right?
What makes you say that?
Hello Karthik Garu…you changed my views on seeing option trading…still in progress but would like to appreciate the way you put all things together and explain it in awesome manner. Thanks again sirji…No questions right now…
Thanks for the kind words, Suresh. I hope you continue to enjoy learning on Varsity 🙂
Thanks for clarifying.
hello sir, i have a confusion in last chapter u have taken exponential to convert the LN % to regular % for calculating range , and here u have just added and subtracted 1 from the (avg+sd & avg-sd), whichich is correct. can u please clarify on this? i mean the last step of range calculation is different in previous chapter.
They are two different methods, Manohar. Either is fine.
Sir, I am asking this.. In the volatility application section, you have explained how to predict the total price movement
of a stock/index by adding/subtracting daily volatility to the previous day closing price. But my question is instead of using the closing price of the previous day, how can we predict today\’s price range by using the yesterday\’s price range of a stock/index? I hope I am able to make you understand my question now.
Kindly help me with this sir.
Got it. But developing a sense of where the volatility is heading on a daily basis is as good as getting a perspective of the daily range. Stock returns is a good is a better input for this than the previous day\’s range.
Hello Karthik sir,
You have explained how to today\’s price movement by adding/subtracting daily volatility from today\’s opening price.
But I have a slightly different query here. Instead of using opening price, if I consider yesterday\’s range. Suppose
yesterday\’s range was 500 points. How to predict today\’s price range using yesterday\’s range (500). Please help me
with this sir.
Regards
Sandeep.
Sandeep, slightly confused with this. Can you pls add more context?
While calculating the range of Nifty, can\’t we just directly add or subtract the Std. Deviation from the spot? What significance does the mean add in the calculation?
Yes, you can.
In the example you have shown this.
Upper Range = 16 day Average + 16 day SD
= 0.65% + 3.567%
= 4.215%, to get the upper range number –
= 8462 * (1+4.215%)
= 8818
What if I use exponential feature of Excel via results IS not same
Ah, not sure. Can you double check the formula you have used in excel once?
Hi Karthik
In the lower and upper bounds calculation, since 4.215% is the log value, the lower bound should be 8462*exp(4.215%)=8826 and not 8818.
Checking on this, Yaqoot.
sir. here what is meant by daily average is that
Daily avg of the price change.
Noted. Thanks much!
Sure, happy learning 🙂
Hi Karthik,
Thank you for first of all for detail explanation. I had a small question.
In your example for you quoted Current market price as \”Nifty current market price = 8462\” , so my question is :As the prices keep changing by the second , do we take the lowest or the highest price of the day the underlying is trading at or average of the both to calculate upper/lower for the next 16 days.
In most cases, you take the closing price of the day, Deepen.
Hi Karthik,
This chapter was great, especially the option strategy you talked about.
Thank you very much.
Thanks, happy learning Rajol!
😊
sorry i has a correction
Annualized SD = 0.89*SQRT(245)= 13.93
what ever its not Annualized SD = 17.04%,Annualized SD = 17.04%?
where i make mistake?
I need to double check as well. But if there was a mistake, others would have pointed out by now 🙂
if the chance of decimal misplacement that will the observation day (252). what ever i got the observation date from
your previous comments that was 12-aug-2014 to 10 -aug- 2015. the total observation from these date is 245 days then i calculate the
Annualized Return= 0.04*245= 9.8
Annualized SD = 0.89*SQRT(245)= 14.13(sorry the previous comment i mentioned % sign i had not taken in the calculation)
even i gave to chatgpt then i got these answer
Annualized Return= 0.04*252= 10.08
Annualized SD = 0.89%*SQRT(252)= 14.13
Sure, let me also check from my end.
Daily Average Return = 0.04%
Annualized Return = 14.8%
Daily SD = 0.89%
Annualized SD = 17.04%
Annualized Return= 0.04*252= 10.08
Annualized SD = 0.89%*SQRT(252)= 14.13
HOW YOY GOT 14.8,17.04 ? THIS I DID CURRECT WHERE I MISSED?
Must be some decimal misplacement?
Hi Karthik,
The method you suggested for writing call that is 1 week before expiry in OTM. I got a basic doubt.
Below is the data of Banknifty 28 Dec 49100 Call (expiry is today, BANKNIFTY closed at 48500):
O:24, H:75, L:0.1, C:0.1
What is the problem in this approach: I can sell the call option in the morning for 24 rupees and wait till evening because anyway I am confident upto some extent that this call will remain OTM, and eventually premium will goes to zero. I can earn all the premium. It\’s not just about this OTM, there are other strikes higher than this which are also doing the same.
I don\’t have to wait for 1 week, on the last day of expiry I can write call and earn easy safe money. Please help me to understand, is there something I am missing in above approach?
You can do that Arnav, but the assumption here is that the intrday volatility wont shoot up driving the premiums higher. If that happens, you will have trouble with your option.
If Banknifty has a volatility of 14% on 1st week expiry and 15% on next week expiry then how to consider the daily volatility? bcoz it evincing a pretty miniscule number when weekly volatility is divided by the square root of time
plz suugest. Thanks!
You can assume its avg of 14% and divide it by sqrt of time.
Sir if today nifty is trading at 20919
And vix is 12.83 can we predict niftys range for 1yr, 1m ,1w range by just spotprice and vix .
Can we say that nifty range gor next 1 yr can be upper 20919+12.83% and lower range 20919-12.83%
Yup, you can.
Sir on pagen no 144 of module 5, we have
nifty spot 8547 and nifty volatility 16.5% by above information we have calculated nifty\’s
lower estimate =8547-(16.5%*8547)=7136
Upper estimate =8547+(16.5%*8547)=9957
Spot-(annual volatility*spot)=lower estimate
Spot+(annual volatility*spot) = upper estimate
Above calulaion suggest that nifty is likely to trade between 7136 and 9957
BUT,
ON page no 163 and 164 we have spot 8337 and daily volatility 1.046%
Therefore annual volatility is 16.61%
By above info we have calculated nifty upper range = spot*(average+1SD)
Lower range spot *(average-1SD)
Upper range =10841
Lower range = 7777
My question is why we need (avarage + 1SD )and (Average – 1SD) to find range
Why dont we just take 1SD for one year ie 16.61 %
By which we get
upper range= spot+(volatility*spot)
8337+(16.61%×8337) =9721
Lower range = spot-( volatility*spot)
8337-(16.61%*8337) =6952
Why in first case we used
Spot+(volatility*spot)and spot-(volatility*spot) to find range and in second why we used different formula
(Avarage+ 1SD) and (Avarage-1SD) to find range. Why we needed average to calculate range , please help im not so good at maths and i have just started to read this module,
Here is the exact calculation for determining the price range, especially if you are using log method (next chapter).
1. calculate daily log returns
2. calculate mean & SD of log returns series
3. 68% confidence interval is current price * exp (mean*time +/- SD* sqrt(time))
4. 95% confidence interval is current price * exp (mean*time +/- 2*SD*sqrt(time))
The process involves computationally intensive tasks such as calculating log returns, calculating exponential of a value etc.
Under the following circumstances, the above calculations can be approximated with more simpler calculations
1. Short periods of time: When time is small, (mean * time) is so small that it hardly makes any difference to the final value i.e. mean * time << SD * sqrt(time)
2. When daily percentage movement 20%, recalculate with accurate method, otherwise you can process with approximation.
Hi Karthik, great chapter. I have one doubt though, early on in the chapter, the lower range is calculated by multiplying current price times one plus average return for the number of days plus the standard deviation. However, in the later section, you have calculated the lower range simply by multiplying current price with standard deviation for the number of days. I believe the method mentioned above i.e. (Current price * ( 1 + average return + standard deviation) is not an appropriate way to calculate the upper or lower range. The method which is used in the last section of the chapter seems to be the appropriate one. Could you kindly help double check the same. Thanks
These are two different techniques, I\’d suggest you stick to the one which you find easier to implement.
im just beginner and trying to understand option trading, i have been using your module 5 and it helped me a lot to understand basics.
I was reading volatility chapter (17.4 ) and im so confused about the range as on page no 144 (15.3) we calculated range by just volatility ,but in 17.4 (page no 163)we are calculating range by avg+volatility ,
My question is why the upper range is not 8337+(16.5%*8337) or lower range 8337-(16.5%*8337) ie why not the upper
Range9712 and lower range 6961
Prasad, is is that only right? Not sure if I\’m missing something.
Hi Karthik,
Thank you for the articles.
I have a question regarding how you calculated the SL for Airtel. You calculated the volatility to be 1.8% but then you directly deducted the volatility from the price. But in previous chapters, you always added and deducted the average from SD to arrive at the Upper Range and lower range. Why we skipped that step here?
I was expecting it.
Upper range = (Average daily volatility * 5) – (Volatility or SD SQRT (5) )
Can you please clarify
Both are fine, Vasanth, especially when the daily mean is very low.
Sir, I have 2 douts
1st, why you calculate reward from SL
(417-385=32), Not from expected entry price 395.
And 2nd thing is,
When we got the new SL 375.
Then, with the new SL, only the risk is changing, why is the reward not changing?
new risk is 395-375=20 point.
Then the Reward will be 417-375=42 point.
But you calculate RRR (32÷20=1.6%)
That means Reward is 32.
That is correct, please do check the comments, others have also pointed this out.
Oh I see, 🫥. Then don\’t you think that probability in this bharti airtel trade is very minimal , the reward is 22 points and risk is 20 points. Coming to approx 1:1 RR. And can we use this volatility based stoploss technique while trading USD INR?
Yes, you can apply to any asset that has a time series of prices.
\”Step 3. Calculate the stop-loss price by subtracting 4.01% (5 day volatility) from the expected entry price. 395 – (4.01% of 395) = 379. The calculation above indicates that Airtel can swing from 395 to 379 very easily over the next 5 days. This also means, a stoploss of 385 can be easily knocked down. So the SL for this trade has be a price point below 379, lets say 375, which is 20 points below the entry price of 395.
Step 4 : With the new SL, the RRR works out to 1.6 (32/20), which still seems ok to me. Hence I would be happy to initiate the trade.\”
Hello karthik sir,
I could not get the RRR calculation in step 4: my entry price is 395 , my target price is 417, and my stop loss is 375. so my reward is (target{417}- entry{395}) = 22 points and risk is entry – stoploss price (395-375) = 20 points. How 32 is coming in the step 4 calculation ? Please guide me 🙂.
I think I made a typo 🙈
Hi Karthik
Can you please guide how to predict daily, weekly and monthly Nifty range using INDIA VIX.
It will be helpful for all of us. Thanks in advance.
You can use the same volatility-based prediction technique (based on normal returns distribution) we discussed here.
Hello sir i have a doubt In previous module for getting upper and lower range of nifty 50 you first convert log percentage into regular percentage then you multiple exponential of that into nifty current market price to get nifty range in numbers BUT in this module you did not convert log percentage into regular percentage you directly multiply with current market price and add that to CMP to get upper range of nifty same you did to find lower range you did this 8462 * ( 1 + 4.215% ) = 8818 same method you did to find lower range you did not multiply exponential of 4.215% to 8462 MAY BE I AM ASKING SILLY QUESTION MY MATHS IS WEEK PLEASE ELABORATE THIS THANKS IN ADVANCE
hello sir ,I have a doubt in this module please solve this as soon as possible ! in previous module for finding the nifty range of 1 year , you calculated 1 st 1 year average and 1 year standard deviation then you added and subtracted S.D. from average range of nifty in percentage for 1 year . ( THEN YOU SAID CONVERT LOG PERCENTAGE INTO REGULAR PERCENTAGE ) then you multiply EXPONENTIAL of log percentage into 8337 nifty level BUT in this module you directly multiply 16 standard deviation with current market price and added with current price for geting nifty 16 day upper range same you did to get lower range YOU DIDN\’T CONVERT LOG PERCENT INTO REGULAR PERCENT WHY????? please explain in detail thanks in advance
They are two different techniques, Vinayak. I\’ve explained this in the comments above 🙂
That is an excellent explanation sir. But in this case we are calculating SL for short duration trades(4 days in this case). But what about long duration trades. For eg if one is bullish on NIFTY and want to initiate a put bull spread at 19000 on a long term contract like monthly or even a 15 days duration, wont the volatility based SL be deep in the money? We cant place SL so deep right? In that case, could you tell how you would approach such a situation? Thanks.
The good part is that you can scale volatility to whatever time frame you are working on. But yes, the SL may turn out deep. Alternate to this is to go by fixed % method, where you conclude that you wont risk more than 3% of 5% of the capital.
Got it Sir. I gave this chapter another read and 2 questions popped up in relation to Index trades. I hope you could answer this.
1. As you have mentioned, there are a lot of instances where the trade seems to end up against me, due to which I exit, only to find out that the trade takes a U turn and finally ends in my favour. So these days I want to strictly exit the trade only when my breakeven point reaches. I totally understand that it is difficult to teach conviction. But could you point me to some books which can make me do this better? (I have noted all the other books you have suggested throughout the entire module)
2. You have mentioned that you will quit your call option position if it turns ATM or ITM. Lets assume a situation where the spot goes against you and ends near your breakeven point 2 days before expiry. At this moment, your position is still an OTM and the You have 2 more days for expiry. What would you suggest in this situation?
– Exit the trade fearing that the spot might open gap up or gap down extending the losses (or)
– Would you still wait for the contract to become ITM before exiting?
Since RR is not good in most strategies, I guess you can understand why I\’m asking this. Thanks for guiding me as a good Mentor🙂.
1) This is quite common, Sathish. The only way ard this is to place logical stop losses. Something like a volatility-based SL. As far as reading material is concerned, I\’d suggest you look at the articles in inner worth.
2) Its very hard to answer this. It helps to have a system in place where in these decisions are driven by factors defined in your system. But at ATM, I may not panic, but if the positions goes deep ITM, you need to be worried 🙂
Since we are calculating SD and then selecting the strike away from 1SD, doesn\’t the breakeven itself act as a stoploss. Do we need a seperate volatility based stop loss? Thanks.
It does act as a SL, but you do need to have a SL as it serves as another layer of protection 🙂
Can i use volatility stop loss for intraday option trading
Yup, you can do that.
Sir I have already asked regarding not so attractive risk reward when deploying this SD calculation in hedged strategies like iron condor. But in Sensibull the SD calculation result seems to be vastly different from the results using this chapter\’s method. I guess the formula used in Sensibull is 1SD = Spot Value x ATM IV% * SQRT(n/365), where \’n\’ is the number of days. If I use this the RR is much better. Can I use this method for hedged strategies? Thanks
Yeah, you can Sathish. They probably use the ATM IV for proxy implied volatility.
I\’m just getting more confused 🤔
In this eg. You have taken daily average return and daily SD
In prior eg. You took average returns of 2 days log returns ?
I have got the concept but can u explain the calculation\’s in easy way.
These are two different techniques. You can opt for either one, I\’d suggest the daily average range.
Hi sir,
1.Will you please explain the calculation\’s you did for Nifty
8462*(1+4.215%) why did you add 1.
2. And in prior slide you used exponential to do the same.
1) You add 1 to get the percentage incremental value.
2) Sorry dint get the complete context here.
Hello,
Amazing Karthik sir.
I keep regularly reading this explanation of selling call options it\’s an eye opener
It\’s an eye opener, if you had any more such magical articles please provide the link.
You are a great teacher
Regards,
Mukesh
Ps , pls share from which source to get nifty daily average and daily sd
Thanks for the kind words, Mukesh. I\’m glad you liked the content. Not sure who publishes the daily SD values.
Dear Karthik,
A very well written article, request when you have time pls post more on selling put options along with the source of getting accurate S.D and Average to get a proper picture.
Thanks once again.
Regards,
Mukesh
Noted, will try and do this Mukesh.
Hi Karthik, Great content.
I have some queries,please guide me,
1.is above strategy of writing deep OTM options which are outside 1SD or 2SD range financially feasible when margins have become larger compared to earlier??
2.Now as nifty has weekly expiry,so what strategy you adopt regarding writing options as now the Friday becomes the first day of weekly series meaning still is it wise to write on fridays or when lesser number of days are there for expiry say 1 or 2 days?
Thanks in advance 🙂
1) These are typically short-term trades; if you have the capital, then why not 🙂
2) I\’d suggest you look at Tuesday or Wednesday for writing. Perpahse it strikes a balance in terms or theta decay and premiums.
Hi Karthik,
Came across you notes and have been going through the options section to improve my learnings. Your explanations and notes are fantastic. Thanks for doing this.
Quick question, on the last example (volatility based stops) where you have noted Reward (417-385) = 32 should that be (417-395) = 22 as the entry price is 395?
Neel, thanks. I need to double-check this, but you do get the gist I suppose.
First of all, I thank you for your efforts to enlighten people like me. It is just that I am unfortunate that I have been reading the Zerodha Varsity contents very late, after around more than 7 years.
I have a doubt in this chapter:
In the previous chapter you multiplied the CMP to exponential of (Average% + SD%) or (Average% – SD%) to get the results. In this chapter you multiplied CMP to (1 + Average% + SD%) or [1- (Average% – SD%)] to get the results, without using exponential function.
If we use in this chapter the formula that you used in the previous chapter, we get the higher limit as 8826 and lower limit as 8218, which seems OK. However; if use [1 +/- exponential of (Average% + SD%)] and [1 – (Average% – SD%)] we get bizarre results.
My concern is that when we multiply CMP by exponential of (Average% + SD%) or (Average% – SD%), we get the return after certain period. And, therefore; we need to add return to CMP to get the upper and lower limits. But, if we do so, we get 18015 instead of 8818 and 244 instead of 8214.
I hope I could able to explain my concern to a level where you would be able to get it. I hope you will address my doubt that which one we use and why.
Rahul, its better late than never. Sharing a response I had shared earlier –
Here is the exact calculation for determining the price range
1. calculate daily log returns
2. calculate mean & SD of log returns series
3. 68% confidence interval is current price * exp (mean*time +/- SD* sqrt(time))
4. 95% confidence interval is current price * exp (mean*time +/- 2*SD*sqrt(time))
The process involves computationally intensive tasks such as calculating log returns, calculating the exponential of a value etc.
Under the following circumstances, the above calculations can be approximated with more simpler calculations
1. Short periods of time: When time is small, (mean * time) is so small that it hardly makes any difference to the final value i.e. mean * time << SD * sqrt(time)
2. When daily percentage movement 20%, recalculate with accurate method, otherwise you can process with approximation.
Sir,
I am trying to follow your guidelines for normal swing trade in the capital markets and finding it good (till date). However, I am only 2 months old to this market. I have read the futures segment and I am now going through the options learning. However, I could sense that there are a lot many variables in F&O trading, specially in options.
Thus, I feel I should go for paper trading for quite some time in F&O and intraday/MIS before actually come to these derivatives market. But I have no idea how/where to paper trade. Could you please guide here?
Instead of paper trade, i\’d suggest you buy sell 1 lot of CDS contracts. In terms of margin, it is not much, but it gives you a lot more confidence in understanding the market.
Hello again there,
Once again very insight full and eye opening session for me. Expecting lot more to come.
I have following 03 queries regarding Volatility based Stop Loss:
1) You assumed the Airtel trade to hit the target in 5 days. How flexible can these be in days? Because our volatility calculations will be based on these days.
2) Is it okay to take into consideration Daily Volatility of stocks/ indices (although they based on Futures) mentioned on NSE website?
3) I would like to have more insights on \’Trailing Stop Loss\’. Where can I fine one?
Thank you in advance.
1) These are expectations based on numbers, but the actual outcomes may vary a bit, so its best to be prepared for that 🙂
2) Yup, it should be ok
3) Maybe this should help – https://www.youtube.com/watch?v=rSYyB9fBsSs&list=PLX2SHiKfualEyD05J9JsklEq1JFGbG6qJ&index=6
Please try the link now. My understanding about the volatility for a given stock/index is that it should be more or less the same for adjacent strikes. But here it looks odd, kindly clarify.
https://drive.google.com/file/d/174lSuxJrj70N8-yRg3zqzWPHR5QR_yOH/view?usp=drivesdk
More or less yes, but then it also depends on the demand and supply of each strike.
Please try the link now. My understanding about the volatility for a given stock/index is that it should be more or less the same for adjacent stikes. But here it looks odd, kindly clarify.
That depends on the demand and supply for the strikes as such.
Typo, it is actually May2023 expiry.
Hi Karthik, the below link is snapshot of the option chain of Nifty April2023 expiry. The premium of the red encircled strike is exorbitantly high, why?
https://drive.google.com/file/d/174lSuxJrj70N8-yRg3zqzWPHR5QR_yOH/view?usp=drivesdk
Unable to open, but if the premiums are high, always check whats happening with the volatility. Premiums increase if volatility has shot up.
Hi Karthik,
Wondering as to what motivates people to buy strikes outside 1SD when there is just 32% probability of such strikes transitioning to ITM and most of the times expiring worthless. Would you please apprise me on this?
Different opinions is what forms the market, some feel safe within 1SD, some with 3SD 🙂
Does this work on a weekly scale.
Yeah, it does. Everything remains the same, except that the timeline shirks.
How SD save to st chart in kite.
Mentioned Calculation in both chapter(Volatility normal distribution and Volatility Applications) are different from each other, it is confusing. Do we need daily average return or mean? Also mentioned Range calculation differently in both chapter. Can anybody explain this.
Its not Prashanth. These are two different techniques of calculation. I\’ve explained in the comments, and I request you to scroll through the comments. Thanks.
(Continued W.r.t last query). Because in both the situations, be it short straddle and the topic discussed here, we are dealing with the same situation, that is selling options without hedging, centered around major events and it is contradicting each other. Hence the confusion. Hope you get the point. So if you could clarify this, it would be helpful. Thanks Sir.
Got it, but like I mentioned, naked short positions are scary, but you certainly can initiate a spread to benefit from cooling volatility.
Yes sir. I have read the short straddle portion where you have mentioned that it is best to deploy this strategy around major events. Since here the information is contradicting that, I was confused as to how to approach this. That is why I asked. Thank You.
Ah ok. Naked positions are scary, spreads are ok 🙂
Another query Sir. I assume you have given this information based on non hedged based strategies. You have advised not to write put options due to potential fast downside movements. But if I were to use iron condor using SD, I have to write put options as well. So in this case is this irrelevant? Also would like to know whether you would not take even hedge based strategies like iron condor before major events. Thank you.
Yes, my point was mainly keeping a naked put in perspective. Hedged strategies are perfect for event-based trade setups.
Sir, You have mentioned that you avoid writing options before market events. But isn\’t that the time to write options as premiums would have swelled up and expect to come down eventually. Given the current situation, one way or the other too many events are lined up continously throughout the month. In that case it would be difficult to take even a single trade. Please kindly clarify about how to approach this.
I agree, I think in the later chapters (maybe option strategies), I\’ve explain this in more detail.
Hi Karthik, first of all, many thanks to you and Zerodha team for this initiative and for sharing your knowledge, this is extremely helpful for beginners like me…
I have 2 questions in this module:
– in previous module, once we found the range as [mean (+ and -) SD] in log percent form, we calculated absolute points using spot * exp(). But here in 18.1, we have used percentages directly to get the absolute values from percentages. How do we decide this…
– in 18.2 – volatility based calculation of stoploss..
If spot price is 395, target 417 and stop loss at 385, the reward would be 417 – 395 = 22, and the risk is 395 – 385 = 10, so RR ratio would be 2.2 – am I missing something here?
Thanks in advance..
Thanks, glad you liked the content.
1) For this, I had posted a detailed response in one of the comments earlier. Can you please check that?
2) This could be a typo, let me check 🙂
sir very good material.thanks but we need more and complete course on quantitative trading.again thank you for your effort and world class teaching.
Thanks for the kind words, Suresh. I\’ll check on this 🙂
Wipro one month return and one yr return is in Zerodha\’s Wipro search. it is negetive. pls illustrate the 16 days return to find higher and lower range price for call shorting. cmp is 390.45 and SD i have got from Fin box site as .97.
Ah, we have shared the steps to do the same. Request you to kindly download the data and execute the steps.
Hi Karthik,
Can you please give an example on how to use vol based stop loss in case of option selling. Since stop loss would be on premium and we are calculating upper range basis spot of Nifty, am not able to quantify how to translate that to premium value to place a stop loss for options.
Thanks
Nayan, one way to do this is to set up a SL based on the underlying. If you were to do this, then the underlying price works as a trigger to take action on the options trade. I\’ll probably do a video on this topic sometime soon 🙂
Sir, where to find daily volatility for a stock in Zerodha ? as you mentioned ATR is not really a standard deviation.
You can use the Bollinger band also, it is a volatility indicator.
Hello Sir, Currently I use weekly option for trading. I\’m interested in calculating the range based on 1sd and 2sd and selling the options. Can I know how many months previous data I should be analyzing if I\’m doing weekly options?
In 18.2 section..the Airtel example you have mentioned reward of 32
It should have been 22 (417-395)
And by that your reward to risk ratio also changes
Let me check this.
Sir, nice modules. Short and sweet. I am confused with average and standard deviation/volatility calculation. While mentioning examples you said average, STDEV. But in nifty it is mentioned average, annual average, and STDEV. No confusion in STDEV/Volatility. Since Volatility calculated as STDEV of daily return. Having confusion in calculation of daily return vs average. Sorry for basic query. Regards
Can you point of exactly what the confusion is? Isit the formula to calculate or something like that? It will help me give a better explanation 🙂
\”the SL on options is best derived based on the spot value\”
What does this mean?
Shouldn\’t we consider the volatility for SL in option?
Volatility of the spot, eventually thats what impact the option premium.
Hello sir, I am having trouble calculating daily average return and daily SD using excel sheet. Is there any other way I can calculate the same or any site presenting this data?
\”I personally use this strategy to write options\” – SD1 here\’s a chance of 68% that the spot wouldn\’t cross the upper estimate.
We\’ll be gaining around 1.5% in 16 days.
But what if it\’s a black swan event, how much are we at risk.
it\’ll be too much I think
Yes, the risk of black swan does exist 🙂
HI Karthik,
Brilliant content 🙂
I am still not clear about the stop loss for call / put option for both long and short. Could you please add an example
Thanks
Gourab
Glad you liked it, Gourab. Have explained both here – https://www.youtube.com/watch?v=-mO0YOTcCiQ&list=PLX2SHiKfualFiusiT9G5uE9jU3vetvW2x
Hi karthik, where can I find the returns and volatilty data on NSE site for indices??
I\’d suggest you download the bhavcopy, Venu.
i am using zerodha from 2016 , but after i was introduced to quant trade and got some basics . now when i read this it is really useful.
If someone would followed this they would have got 60 day challenge certificate. Really thank you for this great explanation.
Happy learning, Abhilash!
Hi Karthik
Can we predict the nifty range using INDIA VIX?
Yeah, you can get a range. I will be sharing a video on this on our Youtube channel soon. Please keep track on the update.
Hi Kartik
Thank you for the article
I had just 1 doubt
Lets say I am writing option on Fri 3:15 PM for next Thu Expiry
for calculating upper range I would take—- no of days avg + no of days standard deviation
My doubt is
Is the no of days 6 ( Sat to Thu)
OR
Is the no of days 4 (Mon to Thu) —- as Sat Sun are trading holidays.
I am not considering Fri in days calculation as I am writing option at 3:15 PM
You can consider Mon to Thursay.
Hello, Mr. Karthik on 11-10-22 I posted a question regarding the absence of Exponential in the current chapter. Later I read a previously posted reply:
(When you take log percentage, it\’s important to convert the same back to the regular % scale. In the 1st method, we are directly doing it, in the 2nd we are splitting it over 2 steps….both are essentially the same. Suggest you stick to the 2nd method.)
I humbly request you to elaborate on the splitting of 2nd method over two steps.
I prepared my excel sheet as per the exponential method and now I am eager to learn the math behind the second step.
Shalini, I\’ve put an explanation for this (responded to your previous query with the same); please do check that once.
In this chapter, the upper range is calculated as 8462 * (1+4.215%) and the lower range as 8462 * (1 – 2.920%) while in the previous chapter EXP(exponential) was used. Is it because the returns mentioned in this chapter are not daily log returns ?? Please explain utility of both formulas.
Shalini, I\’ve put up an explanation for this in the comments section (maybe a few months ago). Can you please check that once?
Sir,is the ATR a thing that is gonna be taught in upcoming chaps.
We have discussed ATR here – https://zerodha.com/varsity/chapter/supplementary-notes-1/
Sir,question to your reply of my above answer
So replacing 1 with 68%, isn\’t it possible
No, you should not be doing that.
Sir,
In one of the answer,you quoted \”If the movement of that 1 day is significant, then it will have the impact to change the volatility of the last 300 days. So better to include all data points.\”
Which all data points is reffered here?
We are talking about the stock price data here, Franklin.
Sir,
Here,I replaced 1 with 68%,as 1SD=68%.In a previous query,You have told,it is possible to do so.
Ah no, that 68% is the probability of the event, right?
Sir,it is said that
= 8462 * (1+4.215%)
can also be written as
8462 * (68%+4.215%)
But in the second case the answer turns out to different one
Sorry, I\’m not sure if I fully understand the logic of replacing 1 with 68%.
Sir, while finding the RRR, why have you taken stop loss(385) for the calculation of reward? Shouldn\’t the reward be calculated by subtracting 395(entry point) from the target?
Yes, thats right. I\’ve overlooked this, I will fix this 🙂
Hi Karthik,
What is the best way to learn trading, any course? books or it comes by time?
I just want to perfect the basics to technical analysis and option trading before starting but not finding where to get started from
You are in the right place to learn to trading, Saif! Please explore all the modules here that are available for you.
Big Thank you Karthik Sir and Zerodha for your efforts to make the options learning simlifty.
Happy learning 🙂
Thanks very much for sharing these finer details. These articles are fantastic.
I\’m a beginner and don\’t know how big is the market. But wanted to understand a buyer, seller mindset. What would happen to your option selling strategy, if all of the traders adapt it ?. There would be no option buyers right ? (i.e market has more sellers than buyers.).
Can you please through some standard deviation of failing on a trade because there are no buyers ? (on the list of stocks and indexes you have mentioned). in case if there are buyers, why would they buy which are outside 1SD when so close to expiry ?
A trade happens only when the buyer and seller agree to transact. The buying interest dies when liquidity dries up, and if you are holding on to a position, it will get settled by the broker.
In the 16 day calculation, why haven\’t you converted the upper range (4.2% something) from logarithmic to normal using e^(4.2%)? This was done in the previous chapter, but not here.
There are two different techniques. I have explained both in detail in one of the comments above. Please do check that once.
Is there any study available in kite which plots these SD range values for 1 SD, 2 SD etc.
Asking this since manually calculating it will tke lot of time.
You can use the bollinger bands for this, Sandeep.
I have a doubt sir. In the section of selling call options u calculated the strike price as present price + no days to expiry × average daily return + daily volatility x sqrt of time to expiry. But in the section in stop loss u just calculated it as present price – daily volatility x sqrt of time. Why hv u excluded the average daily return x no of days? Is it bcz it is a short term trade?
Yeah, short-term and usually the average is very small to make a difference over the short term.
First of all thanks for great job. I have a doubt regarding predict range of underline price(such as index and stocks).
In chapter-17 where you discuss standard Deviation and Normal Distribution you use exponential % but in chapter-18 where you discuss regarding selection of right strike you didn\’t exponential %, you use only normal % why?. Please clarify to me.
Thanks Saroj. I have posted an in-depth explanation about this in one of the above comments. Please do check that once. Thanks.
You have done a great job sir . But I have a doubt .In the last chapter we took exponential to calculate the ranges, but here I could see that they are straight away calculated in % terms.Is there anything that I missed out.
Thanks Arun. I have posted an in-depth explanation about this in one of the above comments. Please do check that once. Thanks.
Being SD a compounded return, shouldn\’t the upper range number be equal to 8462 * exp(4.215%), instead of 8462 * (1+4.215%) ?
Loris, I have posted an elaborate response to this in an earlier comment. Can you please take a look at that? Thanks.
How many days daily average returns should we see for a stock or index?
At least for 1 year, Sunny.
Sir,what all trades are meant by \”Momentum based swing trades (futures)\”.
It just means that you buy a stock or index with the intent to hold the stock for a few days.
Chapter-17,17.3
Sir,
Referring to the answer for my question asked on July 20,
Sir,if 1 can be replaced with 68%,so in case of 2SD,95% can be used,right?
But Sir ,in 2SD calculations given in Chapter-17,17.3,it isn\’t mentioned
Sir,please let me know where I went wrong?
Yes. 1 SD = 68% and 2 SD = 95%.
Sir,
\”Step 3:Calculate the stop-loss price by subtracting 4.01% (5 day volatility) from the expected entry price.\”
Here in step 3(above context),the volatility Percentage is subtracted and added from the entry price,but in previous calculations it\’s added to average,why is it so??
Two different techniques. Have posted a lengthy explanation in the comments (either in this chapter or the chapter of volatility cone). Please do check.
Sir,
Yes,in my second question,I meant 72%.
But my answer turns out to be 6110.
Sir,
How is annualized return calculated in calculation under 18.1 paragraph above,
\”Daily Average Return = 0.04%
Annualized Return = 14.8%\”
If it is obtained by multiplying 365 to the daily average return,then shouldn\’t it be 14.6%
Maybe a typo?
Sir,
But then the answer turns out to be 8462×(68%+4.215%)=8462×72.215 will be equal to a large number.Please tell where did I go wrong
Its 72% right?
Sir,
Here,to get the upper range number –
= 8462 * (1+4.215%)= 8818
Here does 1 in (1+4.225%) refers to 1 SD?
If it is so,Can 68% be used instead of 1?
Yup, it can be.
Dear Karthik sir,
Thanks so much for your reply. We are privileged to have you as Guru.
Happy learning, Sandeep 🙂
So if we can use simpler method, i.e, Current price * (1 +/-SD*Sqrt(time)) in case daily returns < 10% then this means that
in all the NIfty examples across chapters 17, 18 we could have used the simpler method for price range calculation as Nifty daily returns was < 10%. Right sir ?
Yes, thats right Sandeep.
Sir, I have gone through your comment. You\’ve said log returns as accurate & % returns as quick method.
1. You\’ve said that if the daily price movement is < 10%, we can go for % returns for quicker calculation.
By daily price movement you mean to say daily returns or Closing price – Opening price sir?
2. Can we use the log returns method by default irrespective of price movement %?
1) I mean the daily returns
2) Sure, its just that most ppl find it tedious 🙂
Dear Karthik sir
In section 18.1 Nifty example, Daily Average Return = 0.04% which is log return. So the price range calculation should be CMP*exp(Avg+-SD),
as you have told in Chapter 17. But here you have calculated the price range as CMP*(1+-Avg+-SD).
1. Why such difference in formulae when we are dealing with the same log returns?
2. Which formula you would suggest to use finally out of the two?
Sandeep, I posted a long explanation for this few days back. Please check the comments.
The premiums erode much faster during the last week of expiry favoring the option seller- Why is that sir?
Because there is lesser time to expiry.
In section 18.1, Nifty upper and lower range were calculated as spot*(1+upper range percentage) and spot*(1-lower range percentage) while in previous chapter section 17.4, Nifty upper and lower range were calculated as spot*exponential(upper range percentage) and spot*exponential(-lower range percentage). Why the difference?
I just posted this response to this y\’day, copy pasting the same –
Here are the exact steps to calculate the price range –
1) Calculate the daily log returns
2) Calculate the mean and SD
3) 68% confidence interval is – Current Price * Exp (mean*time +/- SD *Sqrt (time))
4) 95% confidence interval is – Current Price * Exp (mean*time +/- 2*SD *Sqrt (time))
The process in computationally intensive as it involves the calculation of mean, log returns, exponential etc. You can approximate it with simpler calculations –
1) For short time period (say for 1 year data), the (Mean*time) is so small that it hardly makes any difference to the final value i.e. Mean * time << SD * Sqrt (time) 2) When daily % movements 20%, then calculate using the accurate method.
using average vs spot to find range..what is the difference ?
Sorry, dint get that query, can you elaborate, please?
Sir what\’s the thing called collateral for option selling? I came across where we can put our money in FD or ETFs so that we will be earning interest and same money can be used for trading as well. I am bit confused about it. Can you briefly explain how actually it works ? From option selling perspective specifically
You can check this – https://support.zerodha.com/category/console/portfolio/pledging/articles/how-do-i-pledge-my-shares-to-get-collateral-margi
BAsically, the idea is simple, you pledge shares to get a margin and sell option basis the margins you\’ve received against the collateral.
Reward should be 417-395=22 so the
R/R ratio 22/10=2.2
Yup.
As per your experience, how much annual return a trader should expect? Surely it depends on once risk appetite and markets he is trading in but in general what % of annual return will you consider as descent return?
If you are trading full time, then the least you can expect is good FD rate * 2 times.
My current loss is taking on my head 😥 I lost my 1 month profit and more than that. In long run will it work really?
Maybe you should review the strategy step by step. If it is causing stress and not working in your favor, don\’t hesitate to pull the plug.
Thank you sir!
Also, when my shorted call option strike becomes ATM, should I exit it or should I wait hoping markets will return below 1 SD till expiry?
Recently when HDFC n HDFC Bank announced merger, Bank nifty actually broke 1 SD on same day itself but eventually it cooled off and ended below 1 SD
That really depends on your market conviction, Dhananjay 🙂
I shorted 1.5 SD bank Nifty Call option and today it became almost ATM. I exited, booked loss. More than that, I would like to know from your experience, what additional precautions I could have take while entering trade keeping in mind the current insane state of markets? As you said, one need to have his own intuition in markets but I would like to hear it from you. How you would you do that?
A basic check on how the market is positioned wrt to what you are trying to do (are you going against the trend), will help. 1.5sd is otherwise a good place to short. Maybe add 1 or 2 strikes as a buffer.
Hi Karthik Sir,
in the last chapter, we took exponential to calculate the ranges, but here I could see that they are straight away calculated in % terms.
Which one to use?
It depends, if its log returns, then you take exponential, else you can use the returns as is.
The reason we didn\’t consider average+SD while setting the stop loss as here we want limit our loss,when we consider about the Characterstics of normal distribution it gives us accuracy of 68%,95% and 99% when we add average in SD ,if we consider this while setting the stop loss the lower end would be far below the SD for call.Hence the risk reward ratio would not be favourable for us as compared to the stop loss set only with SD.
Is this justification right??
Do explain!
Thanks in advance!!
Paras, normal distribution is not about accuracy. Its about more about the odds. So when you say 68%, it means there is a 68% chance of the data falling within the range. So think about your risk and reward from this perspective.
Dear Sir,
In previous chapter, to calculate Range you used exponential of Average+1 SD. But in this chapter, you used (1+Average+1SD). Please suggest which one we need to consider for calculation of Range?
Thanks, Sreenivasa.
YOu can take either. I\’d suggest you take Avg+Sd.
Hi Karthik
Calculations using Pecentage and EXP makes lot of difference for ex. below are the calculations based on actual Nifty data for 01-Apr-2020 to 31-Mar-2021 based on Daily Closing price, with actual 250 days trading days which is used for calc, we get
Daily Yearly 30 days
==========================
Average 0.23% 58.12% 6.97%
SD 1.39% 22.01% 7.63%
CMP 14690.70
based on these
Range Calculation with 1 SD
1 year
Upper 80.13% 32738
Lower 36.11% 21079
30 days
Upper 14.60% 17000
Lower -0.65% 14595
But if looked at Range which came as per calculation is not correct or realistic
Annual it gives 21079 to 32738
30 Days it gave 14595 to 16999
where as Market was closed on 31-Mar-2021 was 14690, it is impossible and can not move next day to 21079 which came as per your EXP Calculation. whereas if used % formula it gives satisfying range 9386 to 26462
Please mention which Excel function should be used EXP or Percentage?
You can use the percentage. Btw, when you say, based on closing price, you mean the returns and not the actual price right?
Didn\’t get that can you please elaborate the query in detail?
Thanks in advance!
Hi!
We use average and SD while calculating the upper end and lower end to determine the range.
However why did we not consider the same while calculating the Stop Loss?? as we only used SD to set the Stop Loss.
Thanks in advance
In volatility-based stop loss, you do use it. Right?
Sorry Sir, But not clear with 2nd and 6th point.
(ii) it is quite simple if I use this Spot + SD% and in next chapter the way u find the range seems like quite advance.
(vi) At the end should I use exponential function to convert the log return into simple ?
Yes, its fine if you stick to Spot+SD%, no issue with that. Yes, if you use log, then use exponential function to convert.
Dear Karthik Sir, I like your and your team initiative for such type of financial education. I have some doubts pls answer:-
1) What we interpret from daily and annual volatility?
2) In previous chapter (may be in volatility basics), u find out Nifty range by Spot + SD% and Spot – SD% then why in next chapter u consider Average + SD for consideration of Nifty range ?
3) Why we calculate log return (I know u posted this answer but can u pls tell me in simple way) and at the end why we convert it into simple return ?
4) I got your all calculation but don\’t know how you use exponential function in excel and get that figure i.e., 10,841 (in previous chapter). Can u pls elaborate this
5) Should I consider always 1 year data if I want to find range for week, swing trade, positional, long term trade ?
6) In Stoploss volatility, the way u find Volatility (%) it include log return na then why u not convert it into simple ?
7) The range u find for Nifty i.e., 8214 to 8818.,(for strike price selection) I understood sell CE option at strike price of 8818, but not understood why u choose strike price of 8850 or 8900 which is out of the range na that u find and for this calculation it include log return then why not convert into simple return ?
1) The daily and annual volatility gives your a sense of how the variance or riskiness of the stock or index is
2) I\’d suggest you stick to Spot and not average
3) Log returns are additive in nature like I\’ve explained in the chapter. But I\’d suggest you stick to regular returns to avoid confusion
4) Use \’=EXP ()\’, function in excel
5) At least 1 year data
6) Need to bring the data back to the normal number plane, hence.
7) That depends on the overall point of view, basically your view on markets and what you expect. Basis which you pick a strike. I\’ve explained the same in the next module.
Also, as this is long holiday, should I consider anything other for writing options?
Like 4 days straight holidays so anything can happen in these 4 days that may affect markets.
That overnight risk is generic to markets (maybe slightly more for options).
Thank you so much for your reply!
Good luck!
It\’s a long holiday now. So I will be writing options tomorrow. From today to next weekly expiry, there are 9 days including holidays and weekends. So should I consider holidays and weekends in volatility calculation? If I use 9 days then range get expanded and premiums are not really attractive still.
Market would have already factored in the holidays. Yes, you can ignore the holidays and consider only the trading sessions.
This is gold!! I regret not coming across this material till now.
I started on varsity multiple times but never reached this chapter till today!!
Thanks a ton to all the people who helped put this up.
Happy reading!Never too late 🙂
I am happy to share that I executed my first option trade. I booked 3.5% in this trade on Bank Nifty by selling call option. Karthik sir, I appreciate your efforts towards educating us and support for the same!
One of the best and easy to understand explanations of one of the most complex things !! Love it
Happy reading, Chinmaya!
Okay! Thank you!
Good luck!
Selling options using SD consideration is really a good strategy. Is there any other quantitative way I can use to sell options?
Not that I know about 🙂
Simply Hats off to you, just one thing how long period of Historical data has to be downloaded. In your excel its for 4 years. Thanks.
Thanks Manish. You can download at least 2 years data, that\’s good enough.
Ohh! Thanks!
Sure! Good luck.
This question may make you laugh but still asking to make sure I am not missing something-
Just like we can estimate the range for stock/index using STDEV and 1/2/4 SD projections, is there any statistical method by which we can calculate minimum movement of underlying?
What I mean to say is, can we estimate by any way that stock/index will not trade in particular range for given time period?
Actually, if the range which you\’ve calculated is true, the price outside that range indicates no action zone 🙂
Thank you so much!
Good luck!
Now here\’s the thing- I don\’t know did anyone noticed it or not! When we calculate 1 SD away range for underlying and simply plot it on chart as horizontal line (as upper and lower bound), it is very close to historical supports and resistance.
Same thing I realized with Fibonacci as well!
Ah, I\’ve not made that observation 🙂
Thank you very much!
and one phrase hear a lot is option chain analysis or OI analysis. I don\’t know what is output from that analysis but if you think it\’s important then can you cover this topic sometime in future please?
Sure, we already have some notes on OI – https://zerodha.com/varsity/chapter/open-interest/
Let say I want to write call option for coming weekly expiry on a just one Friday before (Expiry on 6th day after I write call option including weekends). When I am calculating 1 SD away ranges then should I use 6 days or 4 days (Should I exclude weekends as markets are closed anyway)?
Or just let me know what is time period I should use to calculate 1 SD ranges to write call option for weekly expiry, assuming I will be writing on just one Friday before
Weekend you anyway wont have data, so use 4 days.
Thank you!
And do I need to let it settle physically? to keep whole premium.
If it\’s OTM, then the option is worthless anyway and hence no physical settlement. Also, only ITM options have a physical settlement.
I have one doubt- Let say I write one call option by receiving premium of let say 150. Then I hold trade till expiry and that contract expire OTM. So technically as a option writer I will keep all the premium of 150. But what if on expiry, for that particular contract, premium is 30 or so. then what will be my profit? 150-30=120 or whole 150?
And one more point, If my profit is whole 150 then do I need to let the option to settle physically?
Yes. But if the option is OTM, then the premium upon expiry will be zero.
ohh! I just forgot that 🤦♂️
Sorry and thank you!
Good luck!
Thank you!
It means no matter what is premium after expiry(let it be against me as well), if option expire OTM then I will be entitled to keep all the premium right?
Yes. Also, there is no premium for an expired option right?
If I write let say bank nifty call of strike 36700 when nifty bank is trading at 35200. I have written this on last Friday before expiry (6 days to expiry including holidays). Now assume premium I collected was Rs. 10. Then within a week till expiry, Nifty bank goes up and ends at 36400 on expiry day. so call premium will also increase with time as spot has increased. But, the option which I sold has expired worthless and let say premium on expiry closed at Rs 21. then will I be in profit or loss?
As long as the option expires worthless (i.e. OTM), you can retain the entire premium.
Hello,kartik
I have a query … how do I calculate stop loss of nifty futures… also, if keep check of standard deviation of difference of 3day ema with respect to closing.
Now if the standard deviation is high as I mentioned above so wen I take a trade shud I put a stop loss above the standard deviation.
YOu can match the SD with the support and resistance levels and identify a SL or for that matter target as well.
thanks for the reply sir , it seems like i still dont get it , so i went through last 4 chapters again and i think 1SD is basically upper and lower ranger so i have to write call strike close to upper range = (spot*(4days avg return% + 4 days SD% +1)) taking 4 days as expiry is on 24th of this month .If i am still doing things wrong can please solve this for me
Nifty Spot = 17276
daily avg = -0.133% (calculated)
daily S.D = 1.532%
so which strike i am supossed to write on monday .
or please do calculations from Scratch my calculations can be wrong
Thanks for your time .
Thanks for your time sir , do you mean that if nifty is at 100 and S.D is 1% then 1S.D = 1% of spot+ spot , here we took spot =100, 1SD = 1+100 = 101 . So now i have to write calls of strike which are 101 away from spot , am I right or still doing something wrong? 😩
Thats right, don\’t look at 101 as being close to 100, look at it as being 1 SD away 🙂
Thanks Sir for such amazing chapters , i have a query as you said on 21st of month calculate the S.D and write the strike price that is 1 S.D away .
So daily S.D that we get is like 0.89% , so what is meant by strike price 1 S.D away , sorry if i missed something from the chapter :(.
If Nifty 100, and SD is 1%, then 1SD is roughly 101. So I\’ll look at writing strikes which are 101 and away.
Hello Karthik,
For banknifty after choosing a strike price say slightly ITM option , as a buyer for placing sl should I consider below factors which can be proper sl
1) account delta for ITM option
2) Volatality based sl
Is there any other factor which needs to be incorporated apart from these in placing sl
Pavan, I\’d suggest you look at the volatility-based SL approach. You can maybe calculate volatility on Bank Nifty futures as well.
hi everyone,
strike identification to be done 1 or 2 weeks before expiry day ? pl guide
Hi,
strike identification to be done 1 week before expiry or 2 weeks ?
2 weeks will give you a decent premium I suppose.
I got -ve value while calculating the average of log values of daily returns of a stock.shall we consider -ve value to calculate upper and lower range for a specific period of stock
Yeah, or you can take a longer data period.
In the previous chapter you used log return while calculating the range, but in this chapter you are using the actual return. Can you pls share the reason
They are two different techniques, wanted to showcase both.
Dear Mr.Karthik..
In the previous chapter, to calculate nifty ranges you used exponential formula like 8462*exponential(4.215%) whereas in this chapter you have calculated in a different way ie 8462*(1+4.215%).
I am little confused as i am not a math guy.What is this( 1+…) thing.
Kindly clarify.
You can use either, Muralidhar 🙂
Sir,
Where you had given information on RELATIVE VALUE ARBITRAGE/ PAIR TRADING and VOLATILITY ARBITRAGE.
thanks in advance
Here – https://zerodha.com/varsity/module/trading-systems/
I think the formula of reward is Reward = Target price – Entry price.
But you have written Reward = Target price – Expected Stoploss.
Please correct me if I am wrong.
Ah, yes, that\’s correct. My bad, will try and make the change.
Hi,
I saw One of your video on \” stoploss based on volatility in that video you calculated the Upper and Lower Range with Standard deviation only .
you did not take the average/mean in the Account to calculate the Upper Range .
As we Went Through the series on Below mentioned formula to calculate the Upper Range –
Upper Range = 16 day Average + 16 day SD
Shubhika, yes, you can use this assuming the mean or average is very small.
Hi,
Which Method is Best to Place a stoploss as we can calculate the stoploss with support and Resistance and Second with volatility .
It is best if both these can lead to the same price, but that rarely happens. For the short term, intraday trades, I\’d pick the S&R method, but if bandwidth permits, I\’d opt for volatility based.
Hi,
I calculated many stocks to get the stoploss by using daily volatility formula.
But I observe all stoploss have gap of 15- 20 points from entry price .
Is it normal to keep a stoploss , 15-20 points away from entry price .
Or should I check more points while keeping the stoploss because in above calculation we only think about volatility factor and ignoring the other factors .
Of course, thats alright.
I got a notification for intraday CHOLAFIN stock
Details are :
Target price – 592
Entry price – 579 -580
Stoploss – 574
Date – 08 Sep 2021
And I calculated the same by taking the data from 07 Sep 2020 to 07 Sep 2021.
My calculation stands as
Average return – 0.37%
Volatility – 2.75%
Stoploss – 564 ( 580 – 16 )
Stoploss calculation are –
580 – ( 2.75%) = 564
Why is 10 point difference between their stoploss and mine .
Why they keep the tight stoploss .
Shubhika, I never trust these calls (so should you). The idea is to learn and identify these trades by yourself 🙂
Hi,
I have applied stoploss formula for La Opala stock.
Details are –
Entry price – 300.80
Stoploss – 281
Daily volatility – 2.52%
Volatility for next 7 days – 6.67%
My question is I checked the last 52 weeks low is 194.95 , do you think in the next 7 days, it will hit the stoploss 281 .
As there is big difference in 52 week low and stoploss for next 7 days .
2. The formula we apply for stoploss is only valid for stocks that deal in F&O because la Opala does not deal in F&O. It can be the reason for major difference.
do you think in the next 7 days, it will hit the stoploss 281 —> Well, no one can predict this 🙂
No, you can use this for non F&O stocks also.
Hey,
Don\’t need to answer my last query about daily average return . I got my answer.
One more question
I downloaded the excel sheet as you provided the link .
You have taken CMP – 8337 and your data was on 10-03-2011 to 28-07-2015.
So, this CMP 8337 was trading on 29 -07-2015. Is it ?
2. In that sheet there is table about bin array and freq . what is all about
Glad you got the answer 🙂
1) Yes, the CMP is as on the latest date
2) That\’s to calculate the distribution, have explained in the subsequent chapters.
Hi,
For example, an average of 0.04 % indicates the daily return of nifty are centred at 0.04% .
Suppose you took the data between 12th Aug 2014 to 10th August 2015 ,
So, I calculated the daily return of the nifty by using log formula and we get different values of every date .
My question is…
what is 0.04 % , it is the last value we get of 10th August 2015 by calculating daily return .
Suppose , I want to calculate annualized average daily return .
Formula is – daily average * 252
So, what can be my daily average value , is it last value that show on 10th August by using the log formula .
I know, it bit confuse you ..
Hope you understand
Hi,
What is the correct formula to calculate the upper range and lower range .
In the previous chapter you calculated the upper range by =
1. 8337* exponential ( 26.66%)
And in this chapter you calculated
Upper range as
2. 8462* ( 1+4.215%)
So, which one is a correct formula
Both are correct, Shubhika. 2nd method is easy to calculate. Use the 2nd method if the percentage is small (say less than 15%), if it is more than 15% you can use exponential. This is because the exponential method gives better results when the percentage is large.
Hi,
You taught us how to calculate the stop loss of particular stock but can you teach us, how to calculate the target price .
As you took in the above example of Airtel
For the target price, you can always look at the support and resistance points.
SIR ,
WHY DIDNT YOU MINUS VOLUTALITY/SD FROM AVERAGE MEAN WHEN CALCULATING RANGE OF SWING OF STOCK AIRTEL. YOU DIRECTLY MINUS THOSE PERCENTAGE FROM LTP . IAM CONFUSED .?
How can you deduct from the average?
Yes offcourse I meant sensibull OC used by zerodha. And thanks for the article..really helpful
Good luck, Prateek. Happy learning!
hey karthik.
can you please tell why the iv shown in zerodha option chain and that on nse india are different for same expiry and same strike…thanks in advance..
Check this, Prateek – https://sensibull.freshdesk.com/support/solutions/articles/43000115287-why-is-the-iv-on-nse-website-different-from-sensibull-s-iv-
Btw, Zerodha gets the option chain from Sensibull.
Hi Karthik Sir,
Thank you so much for enlightening us with your knowledge in such a clear manner
I had a same confusion, please help out with the same,
Under the SL bit we see that the initial reward is 417 – 385 = 32 which is calculated by Target Price – Stop Loss
Post our SL calculation we see that the keeping the SL at 375 makes more sense
So in this case shouldn\’t the Reward also become 417-375 = 42
Hence, the RRR changes to 42/20 = 2.1 but here we see the reward has remained the same
Also, even if we keep the target price at 411 now (based on SD calculation), the RRR would be 36/20=1.8
Kindly help with this doubt
Actually, I think I made a mistake here. Reward = Target – Entry price, not the SL price. So, please relook at this with the corrected formula 🙂
Definitely the whole point is to understand volatility based SL.
Yeah, good luck Bhavya!
Hello Karthik,
In above discussion with Vivek you have asked to take daily avg in place of 7 day avg. but in above mentioned examples you have taken 16 day avg. which we have to follow? which is correct?
Vishwajeet, this depends on your trading number of days right? What is the holding period you\’d expect for the trade?
Sir don\’t you think in above example of airtel we should keep the SL below the support (i.e. below 385) because it just gives the room for the trade to work in our favor it might happened that prices hit the support and we exit the trade and then prices bounce back. Of course i am talk about before calculating the volatility and figuring the lower range of the stock to be performed.
Perhaps, but the idea here is to track volatility and place the SL accordingly 🙂
Hey Karthik,
I\’m confused with the calculation suggested to calculate the upper range at multiple instances using the daily average & volatility.
1. In chapter 17, the example to calculate range for next 30 days uses the following formula: CMP * e^{daily avg*30 + daily SD*sqrt(30)}
2. In chapter 18, the formula used for 16 day range is: CMP * [1 + {daily avg*16 + daily SD*sqrt(16)}]
3. While in an above question by Vivek posted on 22nd July, you\’ve suggested to use the following for 7 day range: CMP * [1 + {daily avg + daily SD*sqrt(7)}]. Here you\’ve suggested to avoid multiplying the no. of days to the daily avg.
Can you please clear my & possibly a few other fellow users\’ confusion?
Undeniably, your effort to explain the so complex markets, hands down is the best one can wish for. I sincerely thank you for being such an amazing teacher!
1) You use this if you have taken log returns to calculate daily returns
2) You use this if you\’ve used simple returns to calculate returns
3) Yes, 7 days because I think he wanted to scale this to 7 days.
Vaibhav, not sure if the above helps. Maybe I should revisit these two chapters and reword the content for uniformity across both chapters. Will do it sometime soon.
Reward should be target price – strike , in your example it would be target – long. Why are you calculating reward after subtracting SL from target price?
That was a mistake, had clarified in one of the comments, Manoj.
Thanks a lot Sir. It really impresses me with the kind of effort you put for learners like me. Delighted to be Zerodha customer.
Happy learning, Vivek 🙂
Thank you so much for the reply Sir. I\’ve taken 7 day average because in the example above you\’ve taken 16 day daily avg return. I\’m a little confused if we should simply take the daily average or number of days to expiry average.
Take the daily avg that you calculate using yearly data, Vivek, that\’s good enough.
Thanks a lot Sir for this valuable information. This is truly an eye opener. But, I\’m a bit lost trying to apply the same today. I\’m trying the virtual option writing suggested by you. Can you please help me understand where am I going wrong ?
Date = 22nd July 2021
Number of days for expiry = 29th July 2021
Nifty current market price = 15817
Daily Average Return = 0.015% (based on the last 20 days returns)
Daily SD = 0.513% (based on the last 20 days closing price)
Given this I would now like to identify the range within which Nifty will trade until expiry i.e 7 days from now –
7 day SD = Daily SD *SQRT (7)
= 0.513% * SQRT (7)
= 1.35%
7 day average = Daily Avg * 7
= 0.015% * 7 = 0.105%
These numbers will help us calculate the upper and lower range within which Nifty is likely to trade over the next 7 days –
Upper Range = 7 day Average + 7 day SD
= 0.105% + 1.35%
= 1.455%, to get the upper range number –
= 15817 * (1+1.455%)
= 16047
When I look up for the margin required to sell 16050 CE expiring on 29th July 2021, it says 87250. It is a lot higher than 12000. Even if I change the expiry date to 05-aug-2021, the margin it still somewhere around 84000. Besides, 15% above the current NIFTY AVG also requires a margin of 60000. Although I understand that this was written 6 years back, I just want to understand if I\’m missing something here or if the margin required has increased over the years given that NIFTY has also almost doubled in this 6years.
Upper range = Daily avg return + 7SD. No need to take 7-day average. The margins are function of the volatility in the market, keeps changing all the time. Also, it can increase/decrease if you have other F&O positions open.
I am finding this topic tough. Especially finding the SD for strike price. Too much calculations
I understand this is not an easy topic to explain or understand. Takes sometime to digest 🙂
Agreed, the chances of nifty moving this much is low then at what level should I put my stop loss if the 4 day volatility is 4.99%
If you are going with this method, then it has to be 5%. But what generally ppl do is that they place it around 1% or so, knowing fully well that the range is upto 5%. So you need to be prepared for SL getting triggered.
Hey Karthik, I just calculated the nifty daily volatility, I got it right this time, and its 1.065%but the problem that occurs here is that as I am planning to hold the nifty CE for 4 day period and the volatility for 4 days is coming 4.99% I don\’t think if it\’s correct as because if my stop loss is at that level and is the nifty goes in the opposite direction then I will lose all the money as my CE will become worthless
Agree, but on a normal day, the chance of Nifty moving so much in 4 days is also low right?
yes I am running the STDEV function on it
Ok. That should work then.
hey Karthik,
as you said I did the math and calculated the daily volatility of nifty and its coming 0.011543% I think this figure is absurd as nifty surely moves more than this on a daily basis and I cross checked my calculations twice also, so is there a way to check this or something else for getting the correct figure
Yup, that does not make sense. Are you sure you are running the STDEV function on Nifty\’s daily returns?
Thanks a ton Karthik. The content of your course is very simple and lucid – but of course understanding every small bit and applying it is tough and takes time but it is our job. You have done an excellent job – far far better than many of the text books I had to study during my engineering course!
Coming back to my question and your answer: I think I can create an excel sheet or use yours to automate the calculation of SD and perhaps even draw the distribution graph. Should this be updated every day when you are in the trade (in my case futures) since volatility changes on a daily basis?
I have see your futures explanation on hedging – selling the expensive contract and buying the cheaper one. Would you be covering later the calendar spread strategy for futures too?
Thanks, Sathya.
Usually, the volatility calculations are automated and the system does this. But otherwise, try and calculate this once in 15 days to get an approximate sense of what the volatility is.
Thanks for the quick answer Karthik. I will use the underlying to get the closing prices and will try out the \”hard work\” of using excel sheet for calculating SD/Volatility for last 1 month and last 6 months. I will try out also the distribution. But after \”learning\” the fundas, is it fine to use the volatility as listed out by NSE and use it for the \”volatility applications\” like fixing SL, fixing targets etc.?
Sathya, the volatility listed by NSE will vary from the method described here. The reason for this is that NSE calculates the volatility from a margin perspective, which means they will give more importance to the recent few days data points, whereas the method described here considered all data points equally.
Hi Karthik,
Another question for futures – can I use the statistical method of yours (rate of return, average and SD) to create a distribution for underlying / futures and then make a trade/no trade decision? I can use 1SD or to be even more confident perhaps 2 SD.
Yes, you can. In fact, I\’d suggest you paper trade this for a while and then take actual trades.
Being an engineer, I found your concept of using SD and using volatility to fix logical SL very interesting. It is 2021 but I hope you will still answer my question: For futures, when I need to fix SL based on your concept, should I use the IV or should I calculate historical volatility? If I have to use historical volatility, should I use the past 1 month\’s rate of return or past 6 months or past 1 year – especially if I want to be conservative. If I have to use IV, do I take it from the options chain or is there someplace where I can get volatility/Implied volatility from NSE site?
Since it is many years past your articles, do you also post your answers to my email ID?
Sathya, you can use the historical volatility for this. I\’d suggest you calculate both 1 and 6 months to get a perspective.
I reply to all queries here itself 🙂
Hi Karthik,
We are in 2021 and I presume all these concepts are valid even now. I don\’t have any experience writing options. But your concept of fixing SL – can it be used for fixing targets even?
Sathya, yes, the concepts remain the same. But certain nuances change, like lot size, settlement procedure etc. But the core option working remains the same. Yes, you can use this for fixing targets as well.
so where else can I find the daily volatility for stocks and indices
Its best you calculate this. Its quite straightforward. Else you can overlay indicators like Bollinger bands/ATR to get a sense of volatility.
I checked it but couldn\’t find it, could you please tell me the sequential order for searching the same above
I\’m not sure either. NSE used to put this up on their website, not sure if they still do it.
where I can find the daily volatility of stocks or indices on nse site
Please check the indices page.
oh yeah! my mistake as I was just brushing up with this topic and I didn\’t read it a whole
Good luck, Shivansh!
in the \”volatility based Stoploss\” the Stoploss should be at low of previous day or the close of previous day as because you wrote, that the Stoploss should be at the low of the previous day low but you put the Stoploss at the previous day\’s closing price
Not sure if I\’m missing something, but the low of the day does not come into the picture as the Volatility based SL will directly suggest a price as a SL right?
Hi Karthik. It\’s been 6 years since you wrote this.
Has these 4 MF changed from your portfolio – HDFC Tax saver, Kotak Select 50, Sundaram Select Mid Cap, and ICICI Prudential bluechip equity fund.
Also is it a good day to share your 12 stocks as well? Thanks and very eagerly waiting for your reply.
I reshuffled my MF portfolio Yash, mainly because I transitioned from regular to Direct on Coin 🙂
My funds are largely in the index fund. Stocks as well, but will refrain from naming them for obvious reasons 🙂
Hello Sir,
I have done the exact thing.
I used 252 days. I used annual volatility and divided by sqrt 252.
I used 3 month returns and divided by 63 to get daily returns.
and used the calculation to get the upper and lower range.
Ok. Are you comparing the volatility you have calculated vs the NSE\’s volatility?
Hello Sir,
I will give you my data inputs and show you my out puts for SD calculation of Nifty 50 Exp 17/06/21.
I am taking 11/06/21 closing price which is 15799.35
No of trading days till expiry is 4.
The 3 monthly nifty returns are 4.12%, while the annual volatility is 26.64.
My 1 SD range is between 16339 and 15279.
My 2 SD range is between 16880 and 14759.
While sensibull is giving me a 1 SD range of 15430, 16168.7
2 SD range of 15060.70, 16538.
There is atleast 200 point difference. Which is a difference of lots of option premiums.
Which should one us?
Dont know why, but I\’ll give you a gist of how to calculate.
YOu don\’t need monthly volatility for this.
Divide the annual volatility by sqrt of 252 or 365, depending on the day count convention. This will give you daily volatility
Use the daily volatility and multiply it sqrt of 4 (since you are interested in 4 day volatility)
Use the 4-day vol to calculate the upper and lower range.
How to interpret \’stock is 1.17x as volatile as Nifty\’ given in tickertape?
Higher the volatility, the higher the riskiness of the stock.
Upper Range = 16 day Average + 16 day SD
= 0.65% + 3.567%
= 4.215%, to get the upper range number –
= 8462 * (1+4.215%)
= 8818
Lower Range = 16 day Average – 16 day SD
= 0.65% – 3.567%
= 2.920% to get the lower range number –
= 8462 * (1 – 2.920%)
= 8214 Please re check the calculation, resultant figures appears to be not correct .same should be 8885 for upper range and 8293 for lower range. Requested to please clarify the mistake or reason there of for difference. Umesh Porwal
Will check this.
Hello Sir,
I did, however, they basically told me to read your chapters on volatility.
Not sure, could I post a link if you could check my calculations?
It will be tough to go through it, Jonas. Maybe you can try explaining where you got stuck, will try and help you as much as I can.
Hello SIr,
I have been using Sensibull for a while.
I confused about their usage of 1 SD and 2 SD.
It is drastically different from the results I get from using your method.
I use annual volatility and 3 month avg returns for my calculations.
Ah, I\’m not sure how they are computing this. Can you please check with them once?
Sir, I have a few doubts w.r.t this chapter. I\’d be grateful if you take time out and address them:
1) In the first example where you\’ve taught us to make an educated guess about the range within which Nifty is likely to trade
Date = 11th August 2015
Number of days for expiry = 16
Nifty current market price = 8462
Daily Average Return = 0.04%
Annualized Return = 14.8%
Daily SD = 0.89%
Annualized SD = 17.04%
In the previous chapters you\’ve taught us that Annualised return = Daily average return * 252. With that calculation, shouldn\’t the annualised return be 10.08% instead of 14.8% ? (0.04% * 252 = 10.08%)
Similarly Annualised SD = Daily SD * sqrt(252) => 0.89% * sqrt(252) = 14.12% instead of 17.04% mentioned above. It seems like the values in the aforementioned example were arrived at by taking 365 days into account instead of 252 trading days. Please clarify what should we follow?
2) Moving ahead while calculating the range for 16 days, you\’ve used regular percentage calculation instead of exponential one. Is it because the time frame was short? What percentage should we use, regular or exponential? Also between 11th Aug 2015 to 27th Aug 2015, there were 4 trading holidays. So should we calculate the range wrt 16 days or 12 days?
3) In the Volatility based stop loss section, you\’ve taught us to calculate the SL wrt 5 day holding period and have said that if the expected holding period was 10 days, then the 10 day volatility would\’ve been 1.8 * sqrt (10), so on and forth. Sir in case we were to initiate the trade at the beginning of the series and were to hold it for 20 days, then the SL would work out to be 1.8 * sqrt (20) = 8%. With that wide a SL, if the spot were to move against us, it would cross the immediate support and would reach the next support. Please guide me, I\’m thoroughly confused.
Please pardon me if my queries seem silly. I\’m new to the the world of Options and learning by reading Varsity.
1) Some people prefer 365, and some 252. I\’ve shown both the methods, although I prefer 252
2) Yes, I\’d suggest you use regular
3) When you are placing the SL based on volatility, then you should not look at S&R. These are two different things, no point mixing them up 🙂
The shorting ideas of yours and return % that you have mentioned in this chapter are as per old margin rules, right ? With the latest Sebi margin rules, are these still valid ?
Sorry, I\’m new and trying to understand.
Thats right, Sunil.
In the risk reward calculation, for reward you have substracted the stop loss from the Target price. eg: Reward = Target price – Stoploss.
Is it right ? I\’m expecting it to be Reward=Target price-Entry price. Can you kindly explain this ?
Reward = Target price – Entry price. Not sure if I mixed up this one 🙂
Dear Sir.
To follow up with my question, should one write naked options 1 SD away when there are 4-5 days left? The premiums are extremely low and you have to put a margin of 1L to gain Rs. 400-700 per lot.
What can one do?
If your capital permits, then this could be one of the things you could do.
Sir,
Following is your quote. Pls revert in which chapter you explain this.
4) In one of the subsequent chapters I will talking about which strike to select given the number of days to expiry. That will help you select strike better.
Thanks in advance,
Vidyadhan Gedam
Here – https://zerodha.com/varsity/chapter/re-introducing-call-put-options/
Hello Karthik,
I decided to try out writing 1 SD away when there are 5 days from expiry.
So as of 27/05/21 Close, Nifty CMP 15337. 1 SD away is 15990, 14814 and 2 SD away is 16443 and 14291. I used 3 month returns as it is more realistic than annual returns. And used 3 month volatility.
If I were to write a naked 16000 CE costing 3.25 I pay a margin of 1.12 L. Similarly writing a 14800 PE would be 10 points for 1.2L margin.
If I were to create a bull put spread by writing 14800 PE and 14750 (price 2.55) PE by pocketing 2.45 and reducing my margin to 30 K. The Risk to reward remains around .052.
What can be done about this?
The premiums drop closer to expiry, drops further, the further you go (in terms of SD). From a ROE perspective, spreads are better..btw, although lower premium, they are lot safer I guess.
Hi Karthik,
1. For the volatility based stop loss, how do you recommend setting it for more long term investors (say 6-12 months). Or would that be considered \”investing\” and not trading and therefore fundamentals would play a more important role?
2. I usually use the weekly/daily ATR to set my stoploss. Would that be considered a good volatility stop loss strategy?
1) Thats more a fundamental approach, this may not be of much help
2) Yup, for a longer time frame, this may be useful.
Karthik Sir, will this Stop-loss approach works for the equity share??
Yes, it does, Harshit.
Hi Karthik, Math was never cup of my tea, but after going thru your very much crystal clear ideas an solutions.
I am full of confidence to crack option trading now.
Thanks for sharing excellent knowledge .
Always love to keep myself around Varsity.
Happy learning, DJ!
Dear Sir,
I wrote options of banknifty, expiry- 6 May, 2021. I did all the historical calculations and sold one lot of both PE and CE of SD1 away from average. For CE, I was always in the profit till expiry but for PE there was a time when the loss was running huge as underlying was going down. I didn\’t close my position and fortunately the PE also expired worthless.
I don\’t have any limit like 2% or 5% of capital should be stoploss.
So I want to know what should be the stoploss? At what point I should have exited?
Wow! Its nice that both options expired worthless. But do have a SL in mind for future positions. Something like 5% should be ok, it really depends on your capital.
Sir I applied this,
My thought process is, I was bearish on the markets,After the price rejection at 15000 and coming back to channel of 14000 to 15000
Since 4 days left for expiry (weekly)
My calculated volatilty came 3.08%
Upper Range is 15100
I can short call and recieve premium of 24
If I need to lose money Markets need to move 3.08% up, in 4 days
And FII selling to are aggressive
How is this trade setup,where can I improve
Is this risky are safe play
But I thought margin would be less as 12000
but margin required is 120000
Fair enough, but I think 3% is a bit tight given the market situation, Bharath.
why did we take 1 instead of exponential in the example regarding finding strikes to write
I think we can just use ATR to keep SL
Which one do you prefer sir
Yes, ATR is a good volatility based indicator.
I found out that you have replied to this query in an earlier comment. No need to reply again.
Thank you:)
Happy learning, Sachin!
My Question is same is Sudarshan Reddy\’s … when we calculate the range from Volatility percentages, do we use the exponential or use the simple percentage way ? In last chapter you have used exponential as we use log for daily returns, but in this chapter u are using simple percentage way to calculate the range.
BTW Awesome Chapter !!! Thank you.
How you calculated these numbers?
Daily Average Return = 0.04%
Annualized Return = 14.8%
Daily SD = 0.89%
Annualized SD = 17.04%
Have explained in the chapter itself, Vamsi.
Karthik,
In the previous chapter we took exponential of SD and Average to calculate the ranges, but in this chapter we used straight away SD and average sum to calculate the expected range.
Could you please elaborate on this?
Vinod, please do check the comments once, have discussed this.
I actually got a FUT contract yesterday because I was expecting something like that. It was a good decision since it\’s not affected by the drop in volatility.
I am too timid to write an option for now, even if it\’s for intraday. I tracked the change in different strikes today. Except for ITM strike which had a meagre 8% gain on 3.5% gain in underlying, all strikes closed in red today. I guess I should just stay away from options when I expect volatility to drop.
Sure, I think its a matter of getting used to the beast 🙂
Hello Karthik,
Do you have a recommendation on how to choose an option strike when volatility increases?
To give an example, yesterday most stock crash by 10% and I noticed the volatility increase from 65 to 80 pts on average of a stock I trade. Today\’s morning, the OTM option had 79 as volatility while the ATM option had 75 as volatility and the ITM option with 70 as volatility.
If I expect the stock to go up today by 5% and volatility to go down around 65, how do I choose a strike now?
Varun, the best thing under such circumstance is to write an option for which you think the Volatility is high. You write with an expectation that the vol will cool off, premiums will drop, and you can buy back the option at a lower premium.
Sir, how should we interpret India VIX,
To differentiate between high and low volatility what range of VIX is generally considered ?
You can treat ViX as a proxy for the market volatility, you can download the historical Vix, run a max, min function and estimate the range.
In the last example , won\’t the reward be 22 as 417-395 (the entry price)
Phew! Thats right. Typo 🙂
Found in the comments that the articles were published in a time framed way back in 2015. It would have been great to experience that including the suspense.
It feels long ago now, but these are evergreen topics, the concepts will remain the same over decades 🙂
Sir! How to arrive at the stop loss while trading Options? If we\’ve a directional view about a stock, say it would go up, you\’ve taught to place the stop loss at the lowest low of the pattern coinciding with support. This works beautifully for stocks as well as Futures. We can arrive at the requisite stop loss by looking at the charts and place it through GTT. I\’m confused as to how to do it for Options. GTT asks to enter premium value as a stop loss. If the stock stays flat for a couple of days after initiating a trade, the premium will erode thanks to theta even though it isn\’t exactly moving against us. How to arrive at the requisite premium value to enter it as a stop loss in GTT?
Prashant, given all the complexities involved in options, its best to keep a flat 20 or 30% drop in premium as SL. This can be any number, I just quoted 20-30%.
Hi sir,
In your above example for NIFTY\’s likely upper & lower range why dont you convert log percentage in normal one using \’exponential function\’ ,like you did in early chapter of \’volatality calculation(historical data)\’?
In this you find upper n lowr range using just simple percentage calculation.[(e.g. upper range for 16 days=8462*(1+4.215%)]. Confused.
Ideally, it should have been converted. Not sure why I missed it, need to review it again.
Didn\’t get it, Sir. You mean to say that we shouldn\’t square off the position & let the losses happen. Kindly elaborate as I\’m very new to Options. Your valuable reply would help me to understand the concept better.
Thats right, Pramjeet. If the expectation is that the position will continue to go against you, then what is the point of holding on to such positions right? You may as well get rid of it and book losses.
Dear Karthik Sir, Thank you very much for teaching us Options in a very simple manner. I just completed this chapter in which you said that you square off your written call position when price shifts from OTM to ATM. Kindly solve my doubt. If we have written a call deep OTM, Delta at that point of time might be somewhere close to .03. When the option starts becoming ATM, Delta might be .50 at that time. So if we square off the position, don’t you think we’ll be in a huge loss because of change in Delta.
Thats right, Paramjeet. The other option is to hold the option and let the losses mount (assuming the option goes deeper into the money). So it really is a call on your risk management techniques.
Dear Sir,
I hope you are doing well.
Lets say I decide to short a nifty CE 2-3 days before expiry. If I am able to hold it succesfully till expiry I can gain 7-8 points. But I need to pay a margin of roughly 150000 per lot.
If executed successfully I end up getting roughly 0.4% per trade.
Is this a good trade? HOw do I calculate the return annually?
0.4 or 0.5% over 3 days is not bad 🙂
Chapter 7 and 18 in module 5 I meant.
Module 7; 7.2
Nassim Nicholas Taleb in his book “Fooled by Randomness” says “Option writers eat like a chicken but shit like an elephant”.
Module 18; 18.1
Satyajit Das in his highly insightful book “Traders, Guns, and Money” talks about option writing as “eating like a hen but shitting like an elephant’.
Both authors said the same thing. Is it?
I guess so, good observation btw 🙂
Hi sir,
Margins are high nowadays?
Budget around the corner right?
okay, so I\’ll be referring the spot charts if I want to trade in equity options and not the future charts. correct?
Thats right, but there are no rigid rules around this. You can look at futures in tandem as well.
So I should refer the spot chart only if i am using indicators for example vwap or any other indicator?
No, spot charts can be used for all sorts of analysis.
Hey karthik, if I trade in equity options so for that which volume should I see? The spot volume or the futures volume?
Spot volume.
Hi Karthik,
Thanks for the lovely explanations in your modules. Just wanted to ask if you know any formula or filter in zerodha or any other website to compute the volatility based range through the system ?
Everytime downloading the data and making calculations may be cumbersome and prone to errors.
Thanks & regards
Manoj Trehan
Ah, not sure Manoj. Maybe you should check Sensibull or Streak.
Hi,
I am really confused regarding to when to use log returns and its exponential conversion and when to directly use the given volatility percentage.
In one example you have multiplied the spot value by exponential of log returns while in the airtel example you have taken it directly w. r. t to given percentage.
Please help me understand someone…
Depends, on the data you are using. If the data you are using is more than 2 years, go for log returns, else stick to regular returns.
Hi Karthik, you say \”Think about it, margin amount required to take this trade is roughly Rs.12,000/-\” the capital blocked to write a call option can\’t be this low right? Am I missing something here?
The margins dynamics have changed since then Ganesh has gone up now.
And one more thing I want your advice on is that,
I take a trade only when the volume confirms, i.e. if the volume is higher than the 10 day average volume, but still I get many false signals. So can you tell me how can i increase the accuracy of this?
Volume is an added factor, your main cue to set up a trade should come from candlestick patterns.
Hi …Can you please help me in finding the 52wk High Historical Volatility and 52wk Low Volatility
You can calculate the same easily on excel. Use the max, min function on the daily volatility array.
Hey karthik,
I generally trade in f&o segment and use the volatility percentage for trailing stop loss. A while ago you told me to use 30-50 day past data for volatility calculation if I use hourly time frame for trading.
1) I want to ask that how much time period should I take for volatility calculation if I want to trade on a daily (EOD) chart (1 day)??
2) And my other question is that when should I calculate the volatility as it changes on a daily basis? For example should I calculate the volatility at the start of the new month and use that volatility for the following month or should I keep calculating it every week or every day?
1) Last 8-12 months
2) Would be better if you can update this every day.
I saw other ppl said that, forgive me.
Hey no, not all. My bad.
Originally, the reward is the target minus Entry, not the stop loss, so 417 – 395 =22
risk ratio is win/loss, (417-395) / (395-385) = 2.2
If the stop loss is 375 then the ratio become (417 – 395) / (395 – 375) = 1.1
It is not a good deal in fact.
Ah Philip, an oversight from me I guess. Let me recheck this. Thanks for pointing and correcting this. But I hope the idea is conveyed correctly 🙂
Can we use volatility based stop loss in intraday trading in stocks?
Yes, you can.
Sir, how to get those data for calculating expected price movement?
You can download the historical data from the NSE site itself.
Thanks Karthik for such crystal clear explanation. This is really impressive. You have explained these topics so simply. I also noticed that you have taken the pain to respond to every query on this portal. Kudos for your support and encouragement to others like me!
I had one question – in the example above on Reward Risk ratio, I noticed you have taken the spread from SL 385, though Long was initiated at 395. Which one should be considered in the calculation of Reward Risk ratio? Thanks
Dipankar
Thanks, Dipankar. Risk is defined as the difference in price between the price point you\’ve initiated the long to the price at which you will exit (SL) in case the trade goes wrong.
Hi Karthik,
Again the way you explain is just a masterpiece!
Please clarify some doubts.
1. Read some comments and also seen in NSE website that I would get Daily volatility (SD) directly from there, so I have considered SD from there for Nifty. My goal is to find right strike price to write Call option hence I calculated 2 scenarios, Nifty data from May till today vs Jan till today. Results are quite different i.e. SD = 1.59, Daily Avg = 0.24 (7 months data), Daily Avg = 0.04 (11 months data) and hence I got 2 upper range for Nifty for December expiry (19 days) which is 14500 and 14000. Due to covid market got fluctuated quite a bit, now which one to choose? preferably which one you would consider? (I have taken 7 months since market started recovering from April hence took that period)
2. From point 1, if 14000 is upper target then margin required (1 lot) is pretty huge for individual investor, does it even make sense to write call options? If we consider intraday then margin is less but I don\’t think it makes sense for intraday when you do option writing so you have to proceed with Overnight means more margin. (Required Margin is above 1L and profit would be 3.7*75 = 278)
3. Also does volatility based stop-loss applicable for Intraday trades?
1) I\’d suggest you calculate this on your own. NSE calculates the volatility by keeping margins in perspective, but as a trader you need to be concerned about real price vol
2) Thats right
3) Yes, it is.
Thanks Karthik. First time read about volatility based SL and its logically make sense to me. Still today I always heard about x% / Y% SL or candle low candle OHLC level SLs. Or indicator based though it depends on system. but truly volatility based SL …… Its awesome.
I\’m glad you liked it Sagar. Happy reading and trading!
Hi Karthik,
If i want to calculate the volatility for a particular month (and say there are 10 trading days remaining in that particular month, should my range calculation have data till last trading day of the previous month (and then calculate 30 day range and trade accordingly), or the last trading day till today (and calculate 10 day range and trade accordingly)?
Regards
You can take the most recent 30-day data.
Thank you sir for your quick reply.
Though we calculate in percentage terms, ultimately we would end up arriving at the SL price of Airtel; that is what has been shown in the Airtel example as well.
Can you please further elaborate for my better understanding.
Regards, Siva
Can you try applying the Nifty method to the airtel example and compared the results? Maybe you can share that here in the comments section.
Dear Sir,
As usual your explanation is making me enjoying the read.>>> I have a query..
When we calculate the range of Nifty we are using the formula as shown in the \”Example-1\” below……
we are considering the (1 + (\”Average return for the period of holding\” + (-) \”SD for the period\”))%. Here I hope SD means volatility.
But while computing the stop loss in the BHARTIARTL example, we are computing the stoploss (I presume stoploss means lower range in long trade) just by subtracting the SD (Volatility) % without considering the \”Average returns\” for the holding period. Why is this difference.. ? Thanks in advance
Regards,
Siva
\”Example-1\” copied from your explanation above-
Given this I would now like to identify the range within which Nifty will trade until expiry i.e 16 days from now –
16 day SD = Daily SD *SQRT (16)
= 0.89% * SQRT (16)
= 3.567%
16 day average = Daily Avg * 16
= 0.04% * 16 = 0.65%
These numbers will help us calculate the upper and lower range within which Nifty is likely to trade over the next 16 days –
Upper Range = 16 day Average + 16 day SD
= 0.65% + 3.567%
= 4.215%, to get the upper range number –
= 8462 * (1+4.215%)
= 8818
Lower Range = 16 day Average – 16 day SD
= 0.65% – 3.567%
= 2.920% to get the lower range number –
= 8462 * (1 – 2.920%)
= 8214
In the case of Airtel, we are interested in calculating the SL in percentage terms, but in terms of Nifty, we are calculating the value directly.
The reward mentioned in volatility based stoploss
Reward = 417 – 385 = 32 or about 8.1% above entry price
should this not be 417 – 395 as the entry point is 395 and not 385?
I guess so, someone had pointed this as well.
Or any other time period that you would suggest for hourly chart?
thank you karthik for the help 😀 😀
Have posted a reply to your previous query.
As I use volatility percentage for Trailing stop loss (Volatility percentage as it is). Should I use the past 1 year data to calculate volatility which will give a very stable figure as I go on?
OR
Should I take the past 15-20/30 days data to calculate the volatility which will keep on changing rapidly as i take the new immediate past days into consideration?
Just a few doubts karthik
I use daily Volatility Percentage to Trail Stop Loss (Daily Volatility% as it is). And I use 1 hour timeframe
-In you previous module (Volatility Calculation), you mentioned to \”BE SURE TO TAKE DATA FOR THE PAST 1 YEAR.\”
So while calculating volatility, which would be better: 1) Data for past 1 year?
2) Data for past 15-20/30 days? OR anything else that you would suggest?
Thank you karthik, you have been a great help! 😀 😀
If it is intraday trading, then I\’d suggest you look at 10 (or 15) minute data for last 12-15 days. If you are not looking at intraday data, then at least 30-50 days of EOD data will help.
Also, when you say in you previous comment \”if swing trading then consider data of at least 15-20/30 days.\” You are referring to the Past data right?
Or you are saying for the future days like: volatility multiplied by SQRT of X no. of days?
That\’s right, I mean the immediate past data.
Thanks karthik, so how many days data for volatility calculation would you suggest for 1 HOUR time frame?
Thank You.
At least 5-8 trading sessions.
Hi Karthik
When calculating volatility (I use it for stoploss) what time period should be taken into consideration? As market conditions are changing rapidly these days as we have seen.
As I use volatility stop loss what time period should I use for calculating the volatility? (For example: monthly, 3 months, 6 months etc)
Depends on your trading time frame. If swing trading, then consider at least 15-20/30 days data. If intraday, then consider the volatility for at least 5 days across 10-15 mins candles.
Hello kartik, Besides Index, SBI, Infosys, Reliance, Tata Steel, Tata Motors, and TCS, what are your picks as of now?
Picks for investments you mean? It is largely MFs 🙂
\”If I were to personally select a strike today it would be either 8850 or 8900 or probably both and collect Rs.7.45 and Rs.4.85 in premium respectively. The reason to select these strikes is simple – I see an acceptable balance between risk (1 SD away) and reward (7.45 or 4.85 per lot).\”
Could you elaborate the above sentence/on your calculation of risk to reward.
It is basically estimating the risk one is willing to take and the payoff against that risk. In this case, the risk is 1 SD away (remember risk is measured in terms of SD), the chances of 1 sd not getting triggered is 66%, this is ok when you consider that the time to expiry is not much.
Hey Karthik, First of all, loved you your work. But I have some questions I want to ask you (well I want your suggestion on this).
1) Which volatility percentage will you use for the stop loss, the one we calculate or the one we can get on the nse website (as there is always a slight error/difference)?
2) How much points below should be the actual stop loss we place from the volatility stop loss? For example, in the module above we calculated the stop loss for airtel and we got 379 as the stop loss and the stop loss will be anywhere below 379.
So my question is how much points below should be the stop loss for any other stock as well? (in genral)
Thank you.
1) Use the one you calculate. The one on NSE is mainly calculated by keeping the margins in perspective
2) No thumb rule here, set it based on your comfort. For example, if it is 379, I\’d look at say 374, slightly below the 375 mark which is a round figure.
Hi Karthik,
Thanks for this great explanation. I have a doubt with respect to last chapter.
In last chapter, to calculate Upper and Lower range we have used the formula, CMP * exponential(SD %).
But, in the chapter you have used the formula, CMP * (1+SD%).
I calculated with some values using both formulas, I am getting different values for each. Please enlighten me.
Exponential is used when log-returns are used, else if it is regular returns, then it is the other method.
As volatility is good for buyers, I wanted to demo trade buying of BANKNIFTY options. But I couldn\’t find Oct 29th weekly contract for BANKNIFTY and Kite just showed me 5th Nov weekly contract.
1) Please tell me, why Oct 29th weekly option is not available.
2) Can we trade next week\’s ie, Nov 5th weekly options contract now.
Thank you Sir.
1) 29th weekly won\’t be available as its the monthly expiry, so please do consider the monthly expiry only.
2) Yes Sir, you can.
Hello sir!
You\’ve mentioned the following steps for calculating volatility based SL:
Step 1: Estimate the daily volatility of Airtel. I’ve done the math and the daily
volatility works out to 1.8%
Step 2: Convert the daily volatility into the volatility of the time period we are
interested in.
Now, if I plan to take an intra-day trade, will the daily volatility(1.8%) work for figuring out the SL or will this method won\’t work for intra-day trading?
Thanks!
Since 1.8% is daily vol, this works for intraday as well.
Dear Sir,
In the previous chapter you have used Nifty spot * exponential (Derived %) to arrive at the upper or lower range, But in this chapter you have used the Nifty spot * (1+ or – Derived %). why is it so ? If the percentage is higher than 10%, the result is also differing drastically. Like below.
8337 * exponential (26.66%) = 10884.1 whereas 8337 * (1+26.66%) = 10559.64 which is huge difference. so which one to be used ? exponential or 1(+/-) ?
Siva, please check the previous few queries. We have discussed the same.
Hello sir,
thank you for such beautiful explanation. I have a small doubt,
In notes you have mentioned as
Note : In case our expected holding period is 10 days, then the 10 day volatility would be 1.6*sqrt(10) so on and so forth.
Now I am confused that why 1.6 is used here where the daily volatility for the Airtel stock was calculated as 1.8% ?
Its 1.8 🙂
Hi Karthik,
Thank you for such amazing learning sessions. I am a beginner to stock market and hence, such an insight is highly appreciated.
I apologise for asking a question which has been repeated, but responses to that have only increased my confusion.
1. You have used exponential to convert a LN function in chapter 16, where you evaluated the range for Nifty, shouldn\’t be the same method be used to calculating volatility based SL in the example of Airtel?
2. Similarly, while calculating 16 day day average, you again did not use the exponential, rather just used CMP (1+Range%), so I am confused as to which method to be used?
3. Does the method differ due to some circumstances, and that is the reason why you calculated without using the exponential? If yes, could you clarify on that a little more.
Regards!
1) Over a short time timeframes, it does not really matter which one you use. So it is ok to use regular returns, Ashutosh.
2) Same as above
3) Same as above 🙂
Thanks, I\’ve come across a specific short-straddle based algo where a strict 50% SL on the entry price is required. The model has reasonable accuracy, but some in cases this rigid SL is not working. SO I\’m exploring if there is a way to use IV as a baseline to define the SL.
Sure, do ensure you have adequate risk management practice in place 🙂
Hi, I\’m really intrigued by the volatility based stop-loss method. In the case of options, should we base it on the underlining\’s volatility or the IV of the specific strike? Many thanks!
I\’d say underlying volatility, but I do know traders who insist on strike specific volatility.
Sir when calculating volatility based stop loss, the standard deviation should be calculated based on how many years\’ data? 1 year/5years, how many exactly?
And especially, if am planning to start trading in options in the near future(apparently as soon as am done with your Options modules!)-in this covid times-which has seen bizarrely wild fluctuations over the course of past 6months, then should a script\’s volatility(standard deviation) calculation be done on the basis of the trend in the last 6months? Or you think the standard deviation of last 5years would only be marginally affected by the unparalleled trend observed in last 6months, and so former should be equally suffice.
6 months to 1 year will help. 5 years will be a bit too much 🙂
Good luck with options 🙂
\”Also, I personally get out of the trade when the option transitions from OTM to ATM.\”
Sir this statement is true only w.r.t to short calls/puts or true for other option types too?
Many thanks!
Other options types mean? There are only calls and puts right?
Thank you very much for helping Sir. You are simply awesome in explaining everything. Thanks again for the Varsity… I came here with 0 knowledge now gained confidence to start the trading.
Happy to note that, hope you continue to learn and enjoy the content here 🙂
Hello Sir, first thank you very much for helping by replying to all our doubts. This encourages me to ask my silly doubt. Kindly apologise.
You said \”The premium that I collect is around Rs.5 or 6 on Nifty Index, translating to about 1.0% return.\”
Today with the intention of trading close to expiry day – 1 lot of Sell Nifty 8th Oct 11800 CE @ 4.75 is showing Rs1.24L margin in Zerodha kite.
If I take the trade and by 8th Oct if I collect full Premium my profit = 75 × 4.75 = Rs356.25. With hedging if margin reduce to say Rs60k and with approx Rs360 profit for 1 lot, my reward is 0.6% and risk = unlimited.
Instead of this.. if I confidently analyse and choose to do intraday BUY call or put options of Stocks/Indices and capture this Rs5 premium, will that be a good idea. Please help me out Sir. Thank you.
That\’s right, Bala. The margins have increased which reduces the return on these trades. Yes, naked positions have a better yield but you need to ensure you evaluate the risk and reward.
16 day SD = Daily SD *SQRT (16)
= 0.89% * SQRT (16)
Why square root of 16 ,why not simple multiplying it to 16?
That\’s the way volatility behaves wrt to time. You need to incorporate the sqrt function.
Would this approach will also apply to weekly expiry of Nifty and Bank Nifty. What tweaks are needed to to trade in these induces?
Yes, you can use the same thing for Nifty and Bank Nifty weekly options. No tweaks required.
Thanks a ton Mr Karthik
Happy reading, Ashish.
Goodafternoon Mr Karthik
Reposting for your response.
\”Congratulations on a very lucidly written module. Options for me were very difficult and volatile concepts are, but I keep coming back and read them again and again to further my understanding of the same and have reached a basic understanding, thanks to You.
I had one doubt. Wrt calculation of the probably range in which any underlying is going to oscillate, the formula is Mean +/- SD. In the calculation for the range to identify Volatility based stop loss, you have simply subtracted the sqrt5*SD from the CMP of airtel to find the lower range of the movement. My question to you is should the formula not have been [(5 * Daily Mean) – (sqrt5 * Daily SD)]. This has been confusing me a lot.
Your response would be much appreciated.
Thanks\”
You are right. But for small periods, like few weeks to a month, mean is very small compared to SD, so ignoring it won\’t make much difference.
Hi Karthik.
Eagerly awaiting for your reply on my question posted on 09 September 2020
Thanks
Sorry, I must have missed that. Can you please repost the same?
Hello Karthik, great content and explanations. Thank you.
Quick question , I normally take 5-10 years historical data to arrive SD and normal distribution for the day trade. Is that the correct approach? Is there any standard ratio can be followed? Thanks in advance
Harsha, its better if you can reduce the look-back period and look at maybe 2 years data instead.
Wannbetrader said: While Taking Position just before closing of Friday, whether to consider calculations for Upper Lower Range based on Data of previous Day Thursday closing or Based on CMP of Friday. You preferred Friday data just before closing:
I have a doubt: say based on Yesterday Thursday Closing Data , Calculated Estimation of Range for Expiry next Thursday Gap of exactly 7 days including Saturday and Sunday. This includes the volatility to happen on Friday just after yesterday (Thursday).
Therefore will it be ok to take position based on estimation of Range based on yesterday Thursday Data and for 7 days or
will it be prudent to take position after fresh calculation with CMP of friday and range after 6 days.
Will be glad to receive a reply
Yes, you can take the CMP on Friday and estimate the fresh range.
Goodafternoon Mr Karthik
Congratulations on a very lucidly written module. Options for me were very difficult and volatile concepts are, but I keep coming back and read them again and again to further my understanding of the same and have reached a basic understanding, thanks to You.
I had one doubt. Wrt calculation of the probably range in which any underlying is going to oscillate, the formula is Mean +/- SD. In the calculation for the range to identify Volatility based stop loss, you have simply subtracted the sqrt5*SD from the CMP of airtel to find the lower range of the movement. My question to you is should the formula not have been [(5 * Daily Mean) – (sqrt5 * Daily SD)]. This has been confusing me a lot.
Your response would be much appreciated.
Thanks
Hey,thankyou for making things so simple and interesting at the same time.
Is this approach applicable for intraday trading like if we take daily return and 1 day volatility and option buying?
Thats right, you can take the daily vol for intrday trading as well.
Hi,
Isn\’t the calculation of SD and 2SD good for a strangle strategy?
Should you calculate daily average and daily SD for 10 year data? Wouldn\’t that give better accuracy than 1 year data, since all events would generally come within this range?
Is it even better to do a 20 year data for calculation? If yes, then how does one decide for which share 10 year data is good and for which 20 year data should be collected?
If a share splits or gives bonus within your data points (say 10 years), then how do you account for that while calculating SD?
If you use a strangle strategy monthly with this information, would you have to keep changing the input data to include the previous month for the next month?
Thanks in advance
1) Yes, it is good for strangles.
2) 10 year data maybe an overkill. You need to get a sense of what is happening in the recent past.
3) No, for same reason as stated above
4) You need to take the cleaned up data
Not really.
Karthik sir
I have a small doubt about the time period used for the volatility calculation. What I want to know is if I need the volatility of nifty for 8/8/20 what will be the time period of nifty return data i will be using?
I\’d suggest you look for at least 12-15 months of data.
Thank you Mr Karthik. 🙂
Suppose i want to calculate Nifty range / or any stock range for the next 1 month. If i consider past one year data, then it will include the market crash in Feb-March. Whether considering the past 1 year data and use it for predicting the range shall be reliable?
Given the circumstance, you are better off taking last 2 years of data.
Hello Karthik,
To begin with, let me thank you and your team for such a detailed document useful for a beginner like me! 🙂
As per your suggestion in the Topic 5.18 – I would like to download TCS data for last 1 year from NSE website- to download the and filter the daily close value, but not sure which options to select in the history – E.g. I selected the following options –
Instrument – Stock options
Symbol – TCS
Option type – CE
Period – 22 June 2020 to 21 Aug 2020. Its not allowing to select one year, but max 90 days.
But the result I got is not showing the daily close value.
Kindly assist.
Would appreciate if you can email me [email protected], so I would not miss your reply/ answer.
Thanks in advance.
Regards,
Mandar Chitre
Mandar, I guess you need to download and stitch the 90 days of data to make it 365. May require you to download multiple times. Make sure you are downloading equity.
Hi Karthik,
Why did we follow the formula 8462 * (1+4.215%) instead of 8462*exp(4.215%)?
Thanks in advance.
We use exp function when dealing with log numbers. Otherwise its not required.
hai.. i calculated the DAILY AVERAGE of RELIANCE stock using 1 year data(aug/19 to aug/2020)..i got the value of -0.20%.. should i consider the minus(negative) sign while calculating the upper range(avearge+volatility) and lower range(average-volatility) of the stock for the SD calculation….??
I need to look at the data, but are you sure you got a -ve value for RIL? RIL is trending positively for the year right?
Let us suppose i have sold a far otm option.
I believed that any event than can cause my far OTM option to expire ITM to be the black swan event.
But i got my doubts cleared. So nevermind 🙂
Thanks Anyway.
-Saood
PS: Any additional comments are still appreciated.
Cool, happy learning 🙂
Hi Karthik,
Thanks for the reply.
That\’s correct but can we say for sure that probability of black swan is always more when we place our strike 1 SD away as compared to 2 SD away (As there would be lesser chances to break the 2 SD strangle compared to 1 SD) .
I think it should be but still want to confirm.
Hmm, I\’m not sure if I get the context right. Can you tell me what you think a black swan event is?
Hi Karthik,
I have a doubt on short strangle strategy
As i could infer the probability of a black swan happening is dependent on how far we have placed our strikes.
How often does the black swan occur if we have placed our strikes
1) 1 SD away
2) 2 SD away
Thanks
-Saood
No one can really predict the Black swan occurrence, in fact, that why its called a Black swan event 🙂
hello sir,
Can we use the SL technique for placing intraday SL or in swing trading also ?
Yes, you can.
First of all, thank you for sharing such useful information and answering each and every reader\’s queries. I have a question regarding stop loss on option trades.
Let\’s say Nifty is range-bound and I calculate the range for next week using volatility and sell a strangle on Friday. How do I go about setting a stop loss on my trade? Which is the best way to do this?
I had a few ideas such as a stop loss based on probability of profit, or if Nifty\’s movement exceeds daily ATR, support and resistance, percentage of capital, etc.
One way to look at SL is by evaluating the underlying itself and figuring a stop on both sides. This way, you focus on what really matters i.e. the movement in the underlying. Yes, you can apply all these things – ATR, Bollinger Band, S&R etc on the underlying itself. This is a good way to setup trades.
Yes sir it happened today. As the required margin went up today, the available margin in my zerodha account is showing in negative (-). Sor what should i do in such scenario now? Should i add up more funds to cover up the negative margin or should i just let it be and wait for tomorrow for my options to expire?
And is there any interest charged by our broker on such negative margins ?
You need to bring the additional funds to continue maintaining the position.
Yes sir i read tgis chapter. It says that in OTM options youndont need to take or give delivery. In my case ( shorted Call Option ) the option is most probably expiring OTM. So what willl happen in this case? As there is no need of physical settlement, will the premium i am going to earn will automatically get creadited in my account after thursday ?
If it expires OTM, you will get to retain the entire capital. But margin requirements will go up as you move closer to expiry.
Sir. Last Thursday I sold following options:
1. Tata Motors 115CE
2. BHARAT ELECTRONICS 110CE
Both 30th july expiry
Both these options are tending to expire OTM and i am gaining the premium as profit.
But today i received following SMS from ZARODHA :
“ We see that you have an open F&O position in a contract with compulsory physical delivery. Please ensure you have sufficient margins/stocks to avoid your position being squared off. Read our policy on compulsory physical delivery here: http://bit.ly/2JwiVjo”.
Sir kindly explain me what will happen on expiry and what i need to do to take my premium profit.
The requires margin money for both options was already blocked at the time of selling the options.
Siddhant, as and when we approach close to expiry, margin requirements go up for open positions due to physical delivery. I\’d suggest you check this – https://zerodha.com/varsity/chapter/quick-note-on-physical-settlement-2/
Sir in the example of placing stoploss is the 5 day holding period a random guess or there is some logic behind it??
Please tell if there is a way to decide the holding period.
THANK YOU.
Its not a random guess, it is based on the 5 days expected volatility of the stock.
In his new book Statistical Consequence of Fat Tails, Nassim Taleb tried to explain why this Neoclassic method of Option Pricing Fails in real world. Also, he hates Normal Distribution and Bell Curves( You must\’ve known this). What is your take on this? What do you think are the errors related to using the Black-Scholes models in real market?
Also, thank you for explaining F&O in such simple manner.
Yes, I agree with him. Some real-life examples –
1. Failure of LTCM
2. AIG had to be bailed out by fed during the 2008 crisis
Anyway, yes Nassim Taleb does not approve normal distribution, but he also admits that Black-Scholes model along with stochastic volatility, prices options fairly correctly over a wide range, but they too fail at the extremes.
In the Nifty Example above, why is daily average return and daily SD multiplied by 365 days and not 252 days to get annualised return and annualised SD respectively? Why 365 days why not 252 days?
Depends on the day count convention you\’d like to follow. If it 365 days a year, then month should be 31, if its 252, then month is 22. No right or wrong answer here.
how did you found out the volatility on airtel to be 1.8 ???
I\’ve described the steps in the chapter itself. Use the standard STDEV function in excel.
is stop loss applicable in case of option writing or am i gonna lose all my margin in case things go against me?
You can set a stoploss on option writing too.
Hi Karthik,
Please explain this formula, I don\’t get it. I am stuck here: = 8462 * (1+4.215%)
= 8818….Why (1+4.215%) is there? Again we got 8462 * (1 – 2.920%). Why (1-2.920%)? Why did you add 1 and subtract 1 both cases? Please explain or refer to me any study material I can study in mathematics.
Suman, I\’ve explained this in the chapter and in the queries. Request you to please read through this.
Sir, Volatility & SD both are Same ???
SD is the measure for volatility.
Dear Sir,
Where we can obtain the Standard Deviation and Annualized Return value of a stock
You can calculate it easily, have explained the process to do so.
Thanks for the book suggestion by Taleb. Recently I got a copy of Mr. Taleb\’s Black Swan and instantly remembered you mentioning him in this chapter. I have almost finished the book(a difficult one to read). He is completely against the usage of Bell curve and SD in share mkt. He call Bell curve a GIF(great intellectual fraud).
He have not mentioned this in his book but I can deduce he will consider TA an observational bias or narrative fallacy.
You are probably right, the only other option to trade is to look at from numbers perspective. Trading then reduces to quants.
Hi Karthik,
The varsity material is very good and the connection to day to day examples helps a lot in understanding. I just wanted to know, is there a resource where i can download an excel to calculate Stop loss, target premium prices of options etc based on the Greeks?
Happy to note that Mariyam. Unfortunately, we don\’t have an excel to do that. Guess you\’ll have to build one.
Hi Karthik, first of all kudos to you and the whole team for the Varsity initiative. It is really interesting and resourceful.
In the above example, the reward should be 417 – 395 = 22, as the entry price is 395. Am i correct or missing something ?
Thats right, expected reward is the difference between entry price and target price.
So in above example entry price is 395,but in formula it is 375. Right?
When you move SL to 375, only your risk changes, the numerator (reward) still remains the same.
Dear Karthik,
As you mentioned…
Long @ 395
Stop-loss @ 385
Target @ 417
Risk = 395 – 385 = 10 or about 2.5% below entry price
Reward = 417 – 385 = 32 or about 8.1% above entry price
Reward to Risk Ratio = 32/10 = 3.2
With the new SL i.e. 375, the RRR works out to 1.6 (32/20), for Risk you have subtracted like 395-375=20 but in same way why you have not subtracted in Reward like 417-375 = 42?
so RRR would be (42/20) or (32/20) ?
Keval, for the reward, you need to consider the entry price, not the SL price.
But in this section you haven\’t converted it to get the stop loss value. Why?
You need to convert. I must have missed it.
In volatility stop-loss the daily volatility is in logarithmic return form and in previous examples you have converted it *exponential (1x%)
Ah, it should be converted from log to exp scale.
Hi, greetings. Going back to your calculation of SD for 11 days between the dates 11Aug(Tuesday) and 27 Aug(Thursday) of year 2015, you took the figure for conversion as 16 which is the no. of actual days between the dates. But the actual no. of trading days is only 12 excluding the 2 Saturdays and 2 Sundays in between.
My point while converting from daily SD to Annual SD you are multiplying by sqrt(252) where 252 is the no of trading days, why for converting to expcted SD for the expirty date 27 Augu 2015 you are multiplying Daily SD with sqrt(16) where 16 is the actual no. of days and not multiplying with sqrt(12) as 12 is the actual no. of trading days.
Hope I presented my question more correctly, now. Shall appreciate a clarification.
Yes, I understand that this is an inconsistent convention. The calculations should be based on a single convention i.e. either on a trading day basis (252 days) or on calendar day basis (365 days).
Dear Karthik,
it is mentioned to avoid trade when volatility is high, and when we expect it to go from low to high.
In this context, i have to questions: how much is actually high and how much is low?
also, how do we anticipate if the volatility will go up or down?
Avoid is a perhaps not the right word, better to be cautious is perhaps right. You can check today\’s volatility with historical volatility to get a perspective on where the volatility is.
Hi, after reading your articles, I try to digent these completely. Not finding proper explanation for below:
While calculating Average and SD for yearly you multiply Daily Mean with Actual no. of working days in a year =252; similary while calculating yearly SD you multiplied Daily SD with SQRT(252) 252 being no. of working days. Fine
Now while calculating Upper and Lower Ranges till Expiry for the first example on Nifty Start Date 11 Aug 2015 and Expiry 27 Aug 2015 you simply took the no of actual days in between the dates which is 27 – 11 =16 including the Saturdays and Sundays.
Request a deeper clarification. Thanks
Volatility is proportional to the square root of time. So if my daily volatility is 1.2%, then yearly volatility (if you consider the year to have 252 trading days) then it is 1.2%*sqrt(252). If you want the volatility of 11 days, then it is 1.2%*sqrt(11). Here you are converting daily volatility into the volatility for the desired time period.
Thank you for your response
Good luck!
Hi. Highly appreciate your essays in simple and easy language. I tried to estimate Range of Banknifty for 7 days. I jotted down closing prices for last one year. The Mean came to negative -0.17% result in SD = 2.64% (log). 7 days Avg =-1.16% & SD =7.00% and step 3 Upeer and Lower Ranges 21539.71 & 18766. There are two days in the range of Daily Return 23 Mar 2020 negative -18.31% (the lowest) and 7 April 2020 +10%. My question is these two days the behaviour was extraordinary far away from normal. Will it be prudent to exclude these two days Daily Return Data to arrive at the most correct Mean value of Daily Return. Will be happy to receive your reply
This is the tricky bit, I\’m really not sure what is the right answer:)
If you exclude, then you are curve fitting the data if you don\’t your model will misbehave. My suggestion would be to include it anyway.
Thank you sir
Welcome!
So
1) To Calculate daily average , daily SD we should have 252 days previous close price data of stock/index
2)Then \’x\’ days average= x*daily avg and \’x\’ days SD = daily SD*x
(Is point 1& 2 right?)
3)Sir I can able to get 252 days data of stocks from NSE But I can\’t able to get 252 days data for Index
4)So can we write/sell option based on range as we calculate and keeping other greeks in perspective?
x day = square root of time.
3) The data is available, please check index data
4) Yup
hi,
You have explained all in a very simple way and I have a clear clarity on the above topics compared to before.
If possible try to explain the yield curve also.
Will try and do that 🙂
Dear Karthik,
Waiting for your valuable guidance. Thanks.
Sorry, looks like I missed you query. NSE publishes these values, but unfortunately, it does not match with the one calculated using this method. Both the methods are correct though, its just they serve different purposes.
how did you calculate annual return and annual sd????
what formula I have to enter in excel?
Have explained that in the chapter itself, Rohan. Please do check.
Dear Karthik,
I understood how to calculate the daily average and then SD based on Variance. However, is there any website or placeholder where we can check the Daily or Annualised returns of Index or Stocks? Is the Annual Mean or Average equal to the 1year absolute returns shown on different portals?
Thanks for your time.
Hi Karthik,
Really appreciate your efforts in helping markets to reach a common man!
So the question is not really about this module. But as you mention your overall capital breakdown for investment. As this blog was written 5 years back, Did your overall perspective changed about the breakdown/percentage of allocation into MFs, EqLT, EqST or maybe you finally got into some other asset classes like gold, estate,…?
Robin, as of today, I\’m still a 100% equity guy, but thanks to COVID 19, I\’m now questioning my belief. Maybe its time to rethink about asset allocation 🙂
Hi Karthik,
First of all, i want to thank you for uploading such content which is easy to understand.
I have a question I would like you to help me with, it is regarding the maintenance of margin though.
Suppose I have initial margin kept at 15,000/-
Minimum margin maintenance is at 12,000/-
What are the factors in the option trading that would lead to increase or decrease of margin every trading day?
Margins are required only if you write options. It will change with the change in volatility of the stock/underlying. Higher the volatility, higher is the margin required.
Sir.. Thank you very Much….
I would like to get clarification..
is daily avg is arrived from last 1 year data? (In all scenario for intraday, short term, options with 15 days expiry…)
for nifty index ,When it comes to 16 expiry day, should we calculate the daily avg from previous last 16 days data??
If you specifically look for \’Daily Avg\’, then it is arrived based on EOD data. Once you have a daily average, then you can extrapolate to any other time frame you are looking at.
Hi Karthik, can you please explain the charts of effects of time in more detail? Probably wrt to theta and vega? I dont get the part why OTM will lose money with more days to expiry. And can i check this for historical data maybe somehow?
Most of it is explained here – https://zerodha.com/varsity/chapter/theta/ . OTM loses the most because they have the least probability to transition from OTM to ITM.
Hi Karthik,
These are very useful tutorials. Cheers to you and your team for composing all this.
Some questions I have are as follows:
1. Can we use the approach mentioned in this chapter to practically identify strike prices or should we identify strikes only after bringing greeks into the picture?
2. Quantitative analysis is very interesting area and is so much reliable, is there any good books that you can suggest through which we can learn more in this are in detail or any courses?
1) I\’d suggest you keep the greeks in perspective
2) You can check this module – https://zerodha.com/varsity/module/trading-systems/
Hi Kartik,
Would the Volatility based approach for calculating Stop loss also be applicable on Stock trading?
Considering the steep fall in the stocks recently the Volatility of the Stocks is high and the future price ranges seems a bit unrealistic.
Regards,
Pranay
Yes, you can use the same for stock as well Pranay.
Hi Kartheek!
In this chapter while calculating upper or lower range it mentioned as upper = Spotprice +(1+{Average+SD}) and Lower as Spotprice +(1-{Average-SD})
Please clarify below points!
a. In previous chapter Nifty example calculation Mentioned as Upper = Spotprice +Exp(Average+SD) and Lower as Spotprice+exp(Avg-SD)
which one is accurate because both methods gives different calculation upper = Spotprice +(1+{Average+SD}) , there may be a case Average value is Negative in that case calculated Lower value is greater than Upper value
Ex: the below values are NOt random its calculated for Sunpharma by taking 1 year data by referring nifty example excel sheet
Daily Avg = -0.01%
Daily STD = 2.47%
Spot price – 485.5
Now calculating for 30 days
30 day avg = -0.01%*30 = -0.43%
30 day Std = 2.47%*sqrt(30) = 13.5%
30 day upper = 485.5*(1 + (-0.43%+13.5%)) = 548.95
30 day lower = 485.5*(1-(-0.43%-13.5%)) = 553.162
b. If we consider the current chapter calculation i.e. upper = Spotprice +(1+{Average+SD}) and Lower as Spotprice +(1-{Average-SD})
Lower price is greater than Upper price as per example in Point a.
upper range and Lower range is correct sir.!
(The calculated made by Krishna)
Yup
This calculation is correct sir ..?
Sir
In the Airtel example given above under STOP LOSS section, it is mentioned that Reward = 417 – 385 but my entry price is 395, not 385. So actual reward which I may get is 417 – 395. Please clarify this sir.
Thanks
Hmm, have I made another typo 🙁
Hello Karthik,
wonderful explanation, I am learning all option concepts from yours,
By studying calculating Nifty range I have applied all the calculations you mentioned.
can you please check my calculations are correct? or am I missing some thing.
I have taken nifty date and close price from 19-apr-2019 to 17-apr-2020 from nse site.
I got following results:
average daily return (daily return mean applied LN) – 0.09%
Daily Volatility (SD) – 4.49% (taken this value from nse )
Current market price of Nifty 9266.75
calculating for next 15 days nifty range:
Average = -0.09 % * 15 = -1.35%
SD = 4.49% * sqrt (15) = 17.38%
Average + SD = -1.35 + 17.38 = 16.03%
AVERAGE – SD = -1.35 – 17.38 = -18.73
upper range
9266.75 *exponential (16.03%) = 10877
Lower range
9266.75 *exponential (-18.73%) = 7683
Finally I am getting upper range as 10877, and lower range as 7683.
Please confirm my calculations or correct?
please correct me If I am doing any calculations wrong, I am planning to use this strategy for my trades. Thank you!
Hello Karthik,
wonderful explanation, I am learning all option concepts from yours,
By studying calculating Nifty range I have applied all the calculations you mentioned.
can you please check my calculations are correct? or am I missing some thing.
I have taken nifty date and close price from 19-apr-2019 to 17-apr-2019 from nse site.
I got following results:
average daily return (daily return mean applied LN) – 0.09%
Daily Volatility (SD) – 4.49% (taken this value from nse )
Current market price of Nifty 9266.75
calculating for next 15 days nifty range:
Average = -0.09 % * 15 = -1.35%
SD = 4.49% * sqrt (15) = 17.38%
Average + SD = -1.35 + 17.38 = 16.03%
AVERAGE – SD = -1.35 – 17.38 = -18.73
upper range
9266.75 *exponential (16.03%) = 10877
Lower range
9266.75 *exponential (-18.73%) = 7683
Finally I am getting upper range as 10877, and lower range as 7683.
Please confirm my calculations or correct?
please correct me If I am doing any calculations wrong, I am planning to use this strategy for my trades. Thank you!
Yes Sir, it is!
Hi Karthik,
Thanks for your prompt reply, So incase i do use it. Is it ok if i get the lower range value which is bigger than the upper range ? If not , then in this case (negative daily return mean) how do we identify the strike range ?
It will be tricky to identify the range when returns are -ve. No harm, you still can use it to get a sense of the range.
Hi, When i am calculating the average of the daily returns for NIFTY for the period 15th April 2019 – 13th April 2020, i am getting – negative 0.11 % ( -0.11%). For further calculation purpose of SD and upper range and lower range should i consider the negative sign ? When i consider the negative mean of daily return the Lower range value is higher than the upper range value. Looking forward for your valuable response.
Technically you should, but the results are not intuitive. Hence not many traders use this when the returns are -ve.
How can we select the correct strike price if I am an option buyer ?
Please check the next few chapters.
Hi
Thank you for the detailed explanation.
i have doubt
as per you
16 day SD = Daily SD *SQRT (16)
= 0.89% * SQRT (16)
= 3.567%
16 day average = Daily Avg * 16
= 0.04% * 16 = 0.65%
Upper Range = 16 day Average + 16 day SD
= 0.65% + 3.567%
= 4.215%, to get the upper range number –
= 8462 * (1+4.215%)
= 8818
can we calculate
Upper range number = 8462 (1+ 16 day SD)
Lower range number = 8462 (1+ 16 day SD)
why we are adding 16 day average to SD
regards
prem kumar
Prem, that\’s because we are interested in finding out the 16-day range right?
Thank you sir for timely reply… great to see mentors value customers
Happy learning!
option price calculated by BLACK SCHOLES Method is quit different than actual price. Mostly on expiry day.
Why NSE option chain do not shows IV on expiry date.
True, B&S is the fair value, what you see in mkts is the actual price. There will be a difference in that. I\’m not sure why NSE does that.
sir ,
One more doubt..
\”Short and sleep far OTM CE strikes.Intrinsic value becomes zero by expiry.Uncle Theta also helps us.This strategy working since 3 months for me.Short after 2nd week.OI concentration should give rough picture where Nifty ends.\”
this was one of discussion I saw in the blog… How Open interet can help to predict nifty movement..
OI indicates the open position concentration, Ginish. So it helps traders develop a sense of the range within which trading is taking place. Based on this, they develop their trading strategies.
I cross checked the data again and is correct.
sir I need answer for query
1.Any option trading tools available like volatility cone in zerodha.?
2. nifty have option chain for all weeks.. ie. every thursday of all weeks in month…ie. minimum 4 option chain per month..then the concept for current, mid, far month means? sir,also in zerodha- sensibull for this month only option chain with expity 16 April, 30 April, and 8 may are only shows..But in NSE website option chain for 16,23,30 April, and 7 may are seen…
3. what about the accuracy if incorporating fibonacci levels with the range found by volatility calculations…
Thanks,
Ginish
1) Check this – https://sensibull.com/
2) I\’m not sure, but I guess Sensibull has weekly also. Suggest you check with them once
3) I\’ve never tried that 🙂
Sir, thank you for the reply. I calculated daily volatility using NIFTY closing price data from 05/04/2019 to 08/04/2020.
But the daily volatility found to be 1.86%. but in NSE website it is shown as 4.82
why this much difference happened. also how many days NSE using to calculate the volatility.
I can\’t wrap my head around this staggering difference. Are you sure your data is clean? Ensure you are taking close price only.
Hi Karthik,
Appreciate your effort in this entire series! It\’s been very helpful.
I have a question regarding holding Short Call Options till expiry as you mentioned in your examples.
Let\’s say I wrote a call option at 9000 strike price with a premium of 10 when spot price was 8000. Now today, Nifty moved up by 500 points and the premium has increased to 20. In this case, my open position is showing large loss. But will it matter if I hold it till expiry and nifty doesn\’t cross 9000? In that case, I will still get my premium of 75×10, right?
Thanks,
Vishnu
Yes, if you hold the option to expiry and if Nifty does not cross 9000, then you get to retain the entire premium of Rs.10/.
Sir
I am a new customer of zerodha..Great and easily convincing explanation for such a complex matter.. I have some doubts regarding range calculation..
Is there any difference for calculation process while calculating range for Strike identification ( that can be “short” ) and finding range for stop loss of an equity
For Identifying strikes that can be short (probable price range for Nifty for ‘n’ days) you shown calculation like this
Daily average return (for ‘n’ days), X = n* daily return
Daily volatility/SD (for ‘n’ days), Y = Daily SD * SQRT of ‘n’
Upper range = (X+Y) %
Lower range = (X-Y) %
As in your example
If say nifty spot is 8337
Find range for 30 days
Daily average return = 0.04%
Daily volatility = 1.046%
Daily average return (for ‘30’ days) X = 30* 0.04=1.15%
Daily volatility/SD (for ‘30’ days) Y = 1.046 * SQRT of ‘30’ = 5.73%
Upper range = (X+Y) % = 5.73+1.15=6.88%
Lower range = (X-Y) % = 1.15-5.73 = -4.58%
So price range for nifty for 30 days
Upper range 8337 *exponential (6.88%) = 8930
lower range 8337 * exponential (-4.58%) = 7963 With 68% confidence
For Identifying range to find STOP LOSS For equity means shown calculation other way
Here upper range possible for 30 days = 8337+ 8337(1.046 * SQRT of ‘30’)
= 8815
Lower range for 30 days = 8337 – 8337(1.046 * SQRT of ‘30’)
= 7859
Here we are not using daily average.
The range values obtain by two methods are different
Sir which method we should follow?
Also while taking daily return from old LTP data average of how many trading days to be taken at least.
I\’d suggest you stick to the (X+Y)% method. Take at least 1 year of data.
Hi
Thanks for explaining such a complex info in short and crisp way however I have a doubt when it come to calculation of volatility
We do have the index VIX which is used to calculate the volatility why don’t we simply use that instead of measuring SD and calculating for our daily or weekly variance ?
Wouldn’t that help in giving the insight on how much fluctuations is expected in near term ..may be it wud be easy calculate it this way rite or am I missing something here ?
You can use ViX as a quick and dirty method to get a sense of volatility. This is especially true while trading ATM options.
Hello Karthik,
As you said that one should be careful while writing the options when the volatility is about to increase. However how can one know that the options that are currently trading are highly volatile? Is it by looking at the implied volatility?
If yes then how can one know looking at the implied volatility without any benchmark comparison?
Yes, you will have to look at the current volatility and match it with the historical volatility to get a sense of the current volatility is either high or low.
Dear Sir,
They are related as explained by you in \’Step-2\’ and \’Step-3\’ of the volatility based stoploss calculation. With increase in holding period, the net volatility will increase. This will affect our stoploss and, ultimately, affect our RRR. Thus, the expected holding period is very critical.
That\’s why, I asked you about any strategy to estimate the expected holding period.
Regards,
Rahul Mishra
Ah, got it. But yeah, you cannot predict the holding period, it can vary on a case to case basis.
Sir,
To correctly calculate volatility based stoploss, the expected holding period is very critical. So, is there any strategy to estimate the expected holding period ?
Regards,
Rahul Mishra
No, the expected holding period comes from your strategy. But from my experience, getting the holding period right is very difficult. Btw, why are these two related?
Hi Sir,
This particular thing you have calculated with 365 days while some time back you calculated with 252 days. Though this is not very important but just for clarification.
Daily Average Return = 0.04%
Annualized Return = 14.8%
Though it should be 0.04*252 but you have calculated 0.04*365
252 is a better way as it considers only the number of trading days.
Hi Sir,
My doubt is on Stoploss. As per the module, we should calculate the volatility % * sqrt(remaining days) and then subtract ( CMP – % of volatility amount)
eg, HDFC Bank Trading @ 1192.8, volatility percentage is 4.56% and for expiry,13 days left as on 3rd Feb 2020. So if I perform the above math.
= 4.56% * sqrt (13) = 16.22
Now to keep SL point (1192.8 – (16.22% of 1192.8) = 997.69
As per the above example whenever there are huge working days left for expiry the SL is very high. Can you please suggest some other option?
Hmm, 4.56% is volatility for how many days, Sanjay? It does not seem like annual vol. Also, 16.22% of 1192 is roughly 193.
Dear Sir,
To calculate WEEKLY NIFTY Upper Range and Lower Range, Average(Mean) should be calculated for 7 Days or for year?
Regards,
Jayesh Khatri
7 days may be a bit tight. I\’d suggest at least 6 months or more.
Thank you sir I would like to try for NIFTY, BANK NIFTY, TCS and RELIANCE first to just observe.
Sure, good luck Jayesh.
Good evening Karthik,
I have two doubts.
1- In this chapter (Volatility Applications) to calculate the Nifty Upper range you have NOT multiplied by exponential percentage as below.
=8462*(1+4.215%)
= 8818
But in previous chapter i.e, Volatility & Normal Distribution you have used everywhere exponential function to calculate Upper range and lower range.
So What I should use? Because there is a different answer is coming.
2. To calculate the Nifty range for 30 days, Average/Mean should be calculated for the entire year or for 30 days only and then convert the Average to 30 days or 7 Days.
Thanks in advance.
Regards,
Jayesh Khatri
1) If returns are calculated on log scale, then use exponential
2) Yup, for the year and then converted to the required number of days.
When Stock Price went up.
Call Option of all range was falling. Wonder why ? Can you explain.
Case in Point :
Kotak Bank
Date : 23 Jan 20 10:58 AM
Spot Price of Stock: 0.29% 1590.15
KOTAKBANK FEB 1600 CE -0.31% 47.75
KOTAKBANK FEB 1620 CE -5.47% 38.00
KOTAKBANK FEB 1700 CE -4.82% 15.80
KOTAKBANK FEB 1620 CE 5.56% 14.25
Would like to know this behaviour of premiums of Call options . Thanks in advance
First of Thanks for very Precise Explanation.
Following are my queries:-
1. What is the best period to calculate the Average Return since there are may options availablei.e. 30 days, 200 days, 365 days.
2. What is your opinion if we but Put option instead of writing call OTM call option as per result of above mentioned explanation.
1) If you are looking at short term trading, then stick to 50 or less. For the long term, I\’d suggest 100 or 200 days EMA
2) This is based on volatility. If vol is low and expected to increase, then buy Put. If the vol is high and expected to crash, sell the call.
HI sir,
good morning. I have small query. If i sell call option, and i forget to buy it back even after expiry. That call option became zero after expiry. Will i get any profit?
Yes, you will.
Hi Karthik,
I quote you
\” Instruments – I prefer running this strategy on liquid stocks and indices. Besides Nifty and Bank Nifty I run this strategy on SBI, Infosys, Reliance, Tata Steel, Tata Motors, and TCS. I rarely venture outside this list \”
Does this hold good even today (Jan 2020)
They, they still seem to be the most liquid 🙂
This is one of the MOST VALUABLE articles in Varsity. Not just it impart knowledge but we also get to share the wisdom (huge difference) on how and what to trade – it is almost like a complete trading plan.
Kudos – great selfless work done here!
Thanks for the kind words, Jatinder. Happy reading.
Thanks kartik. for such great lectures..
Sorry. I forgot to do the squareroot for SD..
Today. 19th Dec 2019. Nifty spot yesterday close price 12221.65. Daily average 0.03%. SD- 0.84%.
7 days to expiry. so for 7 days – average -0.21% SD- 2.26%
+Range – 6.09% = 12221.65+(2.46% of 12221.65)= 12522.30
-Range = -5.67% = 12221.65-(2.05% of 12221.65) = 11971.1
Now i can short 11850 Put option & pocket premium of 7.30*75=547.5 Rs. But Margin i check is 86000 required…!!!
I know Kartik said dont short Put, but call premiums are not attractive at all. For example for 12600CE premium is 1.95*75= 147. Margin required also the same.
If someone can cross check my calculations & guide me on this, would be much obliged..
Thank you..
Thanks kartik. for such great lectures..
Today. 19th Dec 2019. Nifty spot yesterday close price 12221.65. Daily average 0.03%. SD- 0.84%.
7 days to expiry. so for 7 days – average -0.21% SD- 5.88%
+Range – 6.09% = 12221.65+(6.09% of 12221.65)= 12965.95
-Range = -5.67% = 12221.65-(5.67% of 12221.65) = 11528.68
Now i can short 11450 Put option & pocket premium of 4.80*75=360 Rs. But Margin i check is 86000 required…!!!
I know Kartik said dont short Put, but call premiums are not attractive at all. For example for 13000CE premium is 0.80*75= 60. Margin required also the same.
If someone can cross check my calculations & guide me on this, would be much obliged.. Thank you..
The calculations are right, but it is just about shorting the put options 🙂
and the formula sir?
You can use this \’=Average()\’, in excel.
yes,if we calculate the average from daily log return then we need to use exponential form.
but if we use simple average we use the simple algebraic function.But my question is simple average of what?
The simple average of the daily returns.
then do we get log percentage or normal percentage
Normal will do, Ajay.
Date = 11th August 2015
Number of days for expiry = 16
Nifty current market price = 8462
Daily Average Return = 0.04%
Annualized Return = 14.8%
Daily SD = 0.89%
Annualized SD = 17.04%
i mean the daily average return used here,how to find that?
Use the average function on the daily return time series and you will get the answer.
sorry,,,,i intended to say that you used two method to find the ranges
1.by using exponential
2.by simple algebra and % method.
but in 2nd one how to find the daily average return?
Irrespective of which, you can always you the simple average function and get the mean value right?
if we are preferred to use the 2nd method i.e. without using exponential,then how to find the daily average return although daily STDEV is clear.But how to find daily average return?
\’m sorry, I may not have got your question properly. You can plot a regular EMA cross over right?
please explain when to use exponential and when to use simple?
For all practical purpose, I\’d always prefer to use EMA on price and SMA on volume.
\”Long @ 395
Stop-loss @ 385
Target @ 417
Risk = 395 – 385 = 10 or about 2.5% below entry price
Reward = 417 – 385 = 32 or about 8.1% above entry price
Reward to Risk Ratio = 32/10 = 3.2 meaning for every 1 point risk, the expected reward is 3.2 point\”
In this above example, I think reward should be 417 – 395 (NOT 385) = 22 because I am entering at 395 and above that (417 here) I am getting as reward. 385 I am already accounted for in the risk. So the risk/reward ratio is 22/10 = 2.2 (NOT 3.2)
Correct me if I am wrong.
Thats right, I think its a typo. Let me recheck, thanks for pointing.
Derivative pricing in the strict scientific sense is a relativity between underlying price,underlying log return underlying volatility and the option sensitivity with time to expiry and not a demand supply process as commonly understood. From Nse\’s volatility file one can get to know the annual volatility and inputting the underlying price and time into BS calculator one can get the fair option price. Try to input with quarter a day, one day, 4 days and 16 days with the calculated AV and you will be surprised to find the option price of call doubling instead of quadrapling and going half for puts.Just throw yourself the question at what time a 9.15 ATM option price on expiry day will half and quarter provided the volatility at such calculation instances are uniform. Most are inclined to believe that it is at midtime of the day and three quarter a day but in reality it is not but based on the square root of time rule.
Can Najeeb or Karthik please elaborate more on this sorry I couldn\’t understand it.
Thanks 🙂
Dear Karthik,
Converting daily volatility to minute volatility or second volatility is quite easy and the same goes for calculating multiple day volatility from daily volatility(metric of calculation based on SD)And there is a relativity between daily underlying volatility and daily option premium.Put it very simple if daily volatility of Nifty for the day is 100 points at 9 15 AM then 15 minute volatility will be 20 points I minute volatility will be 5.164 points and I second volatility .667 points. Corresponding option prices ought be 39.89 , 7.898 , 2.06 and .266 for the day.( provided the volatility is uniform)This information is very useful for traders doing lambda locking.Scientifically the corresponding the option premium of 39.89 (40) ought to half to 19.95(20) at 1.525 Pm and quarter to 9.9725( 10 ) at 3.075 pm General notion that option prices ATM half at mid time(12.235 )PM of the day is wrong and it ought to half at three quarter of the day precisely at 1.525.Disparities happening in live markets are happening due to bid order spreads and changes in underlying volatility.
AS IN PREVIOUS CHAPTER U HAVE CALCULATED THE UPPER AND LOWER RANGE BY EXPONENTIAL
AND IN THIS CHAPTER U HAVE CALCULATED BY ADDING ONE IN PERCENTAGE NUMBER WHICH YOU GOT FROM ADDING SD AND AVERAGE AND THEN YOU HAVE JUS ADDED ONE IN THAT AND MULTIPLIED BY CMP..
Yeah, you can use the 2nd way.
Also, please tell me if the following statement is wrong:
The changes in spot underlying are reflected in premium through delta and vega, thus spot volatility, -1sd, can be used along with delta of the strike price in consideration to determine stop loss 1.
And vega gives changes in premium wrt Implied volatility, which can be used to determine stop loss2. The higher absolute value of SL1, SL2 can be used as the stop loss.
Hi Karthik,
I am confused between historical spot volatility and Implied volatility. From what I have understood through Varsity (which is absolutely mindblowing) and browsing the internet, Spot volatility is determined from the past data, as shown by you in the SD calculations. However, IV is generated with respect to future events that the market considers keeping supply and demand in perspective.
Now, when I try to make a system checklist before I trade options, I need to put my stop loss near the spot volatility bottom, but how I figure out the the range that the premium price may oscillate in due to changes in IV.
Also, IV seemingly is a relative term since it is different for different indices and stock options, shouldn\’t we use an exponential moving average to determine how relatively rewarding or damaging role the IV is playing? I need to understand how damaging the current IV value is to decide the stop loss.
By spot volatility, I guess you mean historical volatility, which is determined by the current data. The current IV is a reflection of the current sentiment in the market, you need to look at it with respect to historical volatility to get a sense of how high or low the volatility is.
Dear Mr Karthik , You given excellent calculations for stoploss of the stock in example .
Now how to estimate stop loss for options ? I thought that one can calculate the strikes for stop loss and choose those premium values as stop loss ? pl advise . Thanks in advance
Rajendra
I\’d generally prefer to calculate the SL on the underlying and then correlate that with the strike and the premium.
Good evening Karthikji
How to convert daily volatility into hourly volatility especially for Intraday trading like Futures or cash ?? Kindly provide formula for same
Tthanking you 🙂
Harsh, this is complex and also not worth it. Over-engineering this is leading to model errors, best to stick to daily volatility.
the calculation in terms of no. of days or months what should be calculated no. of working days or no. of total days remaining?
The number of working days.
Where do you get the current values of Standard deviation of return and volatality?
You can calculate this Varun, quite easy to this on excel.
i did not understand that, you said that RS 125,000/- i.e 25% of 5 lack gose to short term trading ok then how can you short 4 lot of nifty in just RS 125000/- plz reply. AND what does mean 35% of Rs.125,000/- i.e Rs.43,750/- is the maximum you would allocate per trade.
Can you please share more context to this? Thanks.
Hi sir,
In nifty for finding range you used mean+sd …. But in bhartiartl you used only volatility and sqrt of time period but not mean for placing stop loss. Why we have not used mean+sd in bhartiartl also?
I need to check the context again, Barun. I\’d suggest you look at the volatility method.
Karthik,
Very interesting description. I read and implemented much. Although did only 2-4 trades, but I am finding short straddle ATM on Banknifty more comforting than naked call/put shorts. (the profit is less as one leg eats out other). What do you think. Also is it risky to have multiple short straddles at ATM or near OTM strike (one or two strikes above ITM).
Regards,
Narendra
Yup, I always prefer spreads over naked trades, unless you are super confident about the directional move.
Great
Hi sir, While explaining selection of strike you did mean+sd calculations to predict upper and lower range where nifty will go… But in bhartiartl stock you just considered volatility and calculated the levels.
My questions is why can\’t we use just volatility for nifty to find ranges and can we use mean+sd calculations in bhartiartl?? Which is efficient method to predict the move??
Because the volatility of Bharti will be very different from Nifty. It is better to deal with the stock\’s volatility rather than take Nifty\’s volatility.
So when I need to predict the strike for nifty then I need to take mean and SD. And when I need to predict the strike for stocks then I need to take volatility only. Is it right sir??
No Bala, it is the same procedure for both. What I was trying to say was that you cant take Nifty\’s volatility as a proxy for the stock\’s volatility.
Hello
I had a short straddle on ICICI bank to take in some IV as the results were about to come. But IV did not come down and ended with a small loss.. This happened with TVS motors also… Sir what do you think would caused IV to stay the same even after results were announced??
Were the IVs high before you took the position?
Yes they were high.. IVP was around 90 when I checked in sensibul. So I took those trades.
Interesting, ideally it should have cooled off. Let me check this, Nikhil.
Hi Sir,
1. In volatility calculation, for sqrt of no days what should be taken into account ideally? Should non trading days be accounted or not?
2.To my understanding, in volatility based SL we are placing SL at 1SD away from our entry and as per RRR of 1.5 or 2 we expect a move of 1.5-2 SD in our favor. Is it right?
3.If my point two is correct then how could we expect a move of 2 SD in our favour [if our RRR=2] for SL placed at or just away from 1SD, as move of 2SD will have only 32% chance but SL at 1SD has 68% chance. Isn\’t it contrasting !!! or Am I missing anything here?
4. I could see that we are not adding avg volatility to SD for 1 day ( for placing SL or range for 1 day) but for SD calculation of many days we are doing it !! Why is it so? Don\’t we need to add avg volatility of 1 day along with normal SD from closing price to calculate 1 day\’s range?
1) Yes, you should consider the number of trading days
2 & 3) Thats right. However, you cannot equate that RRR with the SDs, they are two different things
4) I\’m sorry, I\’m unable to get the your query. Can you kindly elaborate please?
Hi Sir,
I could see that you are not adding average volatility in 1 days SD calculation [i.e Actual SD= SD of 1 day]
But for SD calculation of x days we are doing it [i.e Actual SD= (avg volatility * x days ) + SD*sqrt(x) ] !! Why is it so?
To calculate 1 day’s range shouldn\’t it need to be like this [ i.e Actual SD= Avg of volatility + SD ]?
You can do this with returns, but not on SD.
Sir,
You are too cautious on writing options before 15 days or when events like monetary policy, Corporate announcement etc takes place or relying only on small amounts of premium. I am skeptical, if these are feautures of a professional trader.
As the book name is Options theory for Professional trading.
What differentiates a professional and a novice trader is the knowledge and not really the capital. Writing 15 days prior is ok if you can stomach the volatility and slower theta decay.
Hi Sir,
1.In volatility based SL, you tell to calculate based on multiplying the volatility with sqrt(no of days).My question is how to identify in how many days our target would hit,So that we can use the same in calculation. Or else what should be the ideal value for no of days and based on what?
2. Why we are in need to multiply the sqrt of entire holding period time for SL indentification in Volatility based SL. Doesn\’t that mean we are expecting the stock to go in opposite direction to our expectation right from the day of trade initiation to the final day?If that happen then we will be at huge loss right.
3.if we have placed sl based on volatility* sqrt( no of days) – and if trade move in opposite direction from the trade initiation till the no of day (near to our SL) then i there a possibility for such trade to reverse in our favor after that deep opposite move.
4. Isn\’t it enough to calculate one day volatility alone, which means so that we expect just one candle in opposite side and then trade to move in our favor. IF that doesn\’t happen then we exist our trade rather expecting the trade to move in opposite direction for the entire period and placing SL based on it.
5.why we multiply with sqrt of no of days instead of just no of days?
1) This depends on the momentum of the stock or index you are trading. Higher the momentum, the faster for your target to hit. However, from my experience, for short, overnight term trade targets are usually hit with 15days max
2) Thats the mathematical formula for scaling volatility
3) Well, this depends on your luck 🙂
4) Yes, as long as you are doing intraday. For multiple day positions, you have to scale volatility with time
5) Same reason as stated above (point 2)
Sir
1.How to calculate simple returns in Excel.Because u have suggested we can use simple returns only to calculate upper and lower range instead of log returns and exp function.
2.In options we cannot place the stop-loss on spot we need to place on premiums only for ex
Nifty spot 11750
Strike 11850
Premium 110
Stop loss 11600
I need to place stop loss for this 150points move on spot price but I dont know what will be the premium when spot is at 11600 how should I place the stop loss now on premium.
1) Return = [Today close/Y\’day close]-1
2) That\’s right, you will have to calculate the approximate premium value by taking the delta of the option. This is explained in the Delta chapter later in the module.
hi Sir,
1How to you assess the Risk reward ratio for option selling?Kindly explain the procedure as I could see that there is no stoploss in option.Then how could you calculate it.
2.Also let me is it possible to set stoploss order for option based on Spot.What I am asking is if a SL level in Spot trigger only then the Option position should exit immediately.
1) The risk-reward should be analyzed on the spot. Traders usually look at the charts for this
2) Yes, in fact, this is the right thing to do.
Sir , the topics covered are very useful . I have a small doubt
For volatility based stop loss you have calculated the range as below
Calculate the stop-loss price by subtracting 4.01% (5 day volatility) from the expected entry price. 395 – (4.01% of 395) = 379. The calculation above indicates that Airtel can swing from 395 to 379 very easily over the next 5 days.
But other places you have calculated by converting to exponential of this percentage and calculated the range . Can you please explain what is the reasoning behind this ?
That depends on how the returns are calculated in the first place. If it is simple returns, then exp is not required. If its log returns, then exp is required.
Thank you for clearing this doubt
Good luck, Sachin!
Hi Karthik,
One more query:
If the daily return is negative(-ve), so for calculating the range what will be approach For eg:
Daily return for 30 days = -0.04
SD for 30 days = 0.11
Upper range= -0.04 + 0.11=0.07
Lower range = -0.04 – 0.11=-0.14
or
Upper range= -0.04 + 0.11=0.15
Lower range = -0.04 – 0.11=-0.15.
Please clarify.
Thanks,
Manish
Yup, the same procedure. You get -ve average daily returns when the stock is getting beaten down on a daily basis.
Hi Karthik,
Here are my questions:
1.The strategy of writing the call option before the week of expiry, for that do we need to calculate the range for 7 days or 30 days. Since only one week is left for expiry.
2. Is this strategy will be help full for the options with weekly expiry meaning to say- calculate the upper and lower range for the weekly expiry options and write one friday and get the premium next thrusday. For eg:
For eg Writing Nifty 7th MAR 11000 CE on friday 1st and collecting premium on 7th March
1) The range should the be number of days between the expiry and the day you decide to write the option
2) Yes, it will.
Hi Karthik,
When trying to calculate the margin required to sell option of particular strike price, its showing all the values as 0. Please find the screen shot below for Ashok Leylend. Unable to paste my screen shot here
Thanks,
Manish
Manish, when was this that you tried? Also, can you please refresh the page once and check?
what amount would be locked for option writing? Span margin or total margin? Sorry for stupid question I posted.
It will be SPAN + Exposure, Rohit.
For option writing in nifty ce 11500 in NRML, does one need total margin of more than 75000 for one lot size? Thats less than 1% return on investment. Pl clarify.
YOu can check the margins here – https://zerodha.com/margin-calculator/SPAN/
Anyone have step by step procedure to make volatility cone or any excel sheet
also is SD + IV a good method to write strangles sir?
mainly in nifty sir
Yup, please do paper trade to understand the behavior before initiating an actual trade.
I am using 5% of my account sir, so I went ahead and created a live position. Hope it goes well !!!
what is your view on unbalanced strangles, example based on my IV and nifty view I am creating a unbalanced strangle with delta of 0.2, how to manage these type strangles sir?
Well, strangle itself is safer compared to naked options. I\’m hoping it will go well for you! Good luck.
sure sir, thank you
Good luck!
\”Strikes with a probability of 16% ITM / 84% OTM capture a 1 standard deviation range for an OTM option\”
Came across the above sentence in quora, what is the meaning of this sentence sir ?
I\’m a bit lost as well, Mani. Not sure what he means 🙂
K sir, if one is to adjust a strangle to maintain delta zero, at what value of delta adjustment has to be made sir?
I think you will have to make it delta neutral the moment the delta of the overall position crosses 0.2 or 0.3.
ok sir, to make it delta neutral, for example if nifty is going down towards my put strike, then can I close my call strike and write a new call strike to maintain delta neutrality sir?
Yes, you can tweak your positions to make it delta neutral. Always add up the deltas.
sir if I move one side make the position delta neutral, then I am reducing the range of strangle, instead of moving the position if I add more call or put option then I am increasing gamma risk, how to deal such a situations sir?
also what to do if underlying reaches one side of strangle, should I wait for the breakeven to be reached or close the entire position?
I am trying to write a algo using kite api to manage strangle positions.
Mani, you can even think of adding a futures position to make it delta neutral. As far as the breakeven is concerned, most ppl book out when it hits one of the sides of the strangle, some hold to expiry. This bit depends on your risk appetite.
is creating a delta neutral position using futures and CE better than short strangle sir?
also which one is better sir futures with CE or futures with PE?
There is nothing like one is better than the other. We have to use these according to the market situation.
thank you
Hello Karthik,
As in the case of a stock, IV tells about 1 standard deviation equivalent movement in the stock with a 68% probability. So, for eg- If a Rs. 200 stock is trading with a 20% implied volatility, it indicates that there is a 68% chance that the stock might lie in the range of Rs 160-240 over next 1 year.
My question is – What could be a similar explanation for a Stock Option\’s IV (that varies with strike price)? For eg. – What does it mean if a call option with strike price of Rs 210 has an IV of 15% (Stock\’s current price is, say, Rs. 200)?
Well, it still means the same. The difference, however, is in the way the volatility is derived. The former is derived based on historical data but the later (option\’s IV) is obtained by factoring in the street\’s expectation of the volatility.
Why different strike prices have different implied volatility?
IV is a function of the street\’s expectation of the volatility, which is dependent of the strike. Hence different IVs.
Why we are calculating here 8462 * (1+4.215%) insted of doing exponential value like in last chapter?
I guess we considered exponential as we too look log values in the previous chapter.
Hello,
Thank you for this wonderful study material
Eg. If I sell the option at 7.45 and I I don\’t buy it back few expiry, what will happen after expiry last Thursday 3:30 PM
Upon expiry, the contract will cease to exist and the settlement would happen based on the intrinsic value of the option.
how do you calculate daily average returns?
You can use the function\’=average()\’, in excle. Make sure to run this on the daily return time series.
Sir,
Here you have assumed the Normal Distribution. I wish you can throw some light on the Lognormal distribution, which I think more appropriate for the market movements.
Thanks for the pointer, Abdul. Will try and do that sometime soon. Thanks.
Hi Karthik, does NSE publishes any csv having implied volatility of all the options of any day? I couldn\’t find any relevant csv on https://www.nseindia.com/products/content/derivatives/equities/archieve_fo.htm. Does Zerodha API provides real time implied volatility of options? The question is how to get real time implied volatility of option in a program.
I\’d suggest you check Sensibull – https://sensibull.com/ for IVs.
Thanks Karthik. You mean if I fetch live option data for any strike using Zerodha Kite API, I won\’t be getting IV?
No, IV needs to be calculated.
VOLATILITY /VEGA CHAPTER IS LITTLE TOUGH FOR ME. HOW CAN I MAKE GRIP OVER IT? USING ALL THIS STUFF FOR DECISION MAKING? SD N ALL ?? PLS SUGGEST. #NOVICE
Chanu, you need to read through this chapter and the subsequent ones to get a complete understanding. Request you to do that. Thanks.
Respected sir,
Double Handed salute for sharing excellent knowledge.
You are sincerely requested to please clarify two different methods of calculating daily range. 1-as per previous chapter and 2-as per this chapter. Please explain in details.
“These numbers will help us calculate the upper and lower range within which Nifty is likely to trade over the next 16 days –
Upper Range = 16 day Average + 16 day SD
= 0.65% + 3.567%
= 4.215%, to get the upper range number –
= 8462 * (1+4.215%) ” in previous chapter you made use of Exponential function”
= 8818
Lower Range = 16 day Average – 16 day SD
= 0.65% – 3.567%
= 2.920% to get the lower range number –
= 8462 * (1 – 2.920%) ” here also exponential function
= 8214″
if we use exponential function we are getting different answer , please explain what to use and why it is to be added or subtracted from 1 as in previous chapter Volatility & Normal Distribution and in WIPRO explanation you have used the exponential as
Upper Range
= 8337 *exponential (26.66%)
= 10841
And for lower range –
= 8337 * exponential (-6.95%)
= 7777
Piyus, I\’d use this method –
Upper Range = 16 day Average + 16 day SD
= 0.65% + 3.567%
= 4.215%, to get the upper range number –
= 8462 * (1+4.215%) ” in previous chapter you made use of Exponential function”
= 8818
Lower Range = 16 day Average – 16 day SD
= 0.65% – 3.567%
= 2.920% to get the lower range number –
= 8462 * (1 – 2.920%) ” here also exponential function
= 8214″
We add and subtract 1 to get the values.
Respected Karthiksir,,,
Many thanks for your prompt reply.
But my question is —In previous chapter you were using exp() function. As per exp function the value is different. It is 8826 instead of 8818.
What method we should use as per previous chapter e.g. exp() function or as per this chapter e.g. add or subtract 1 and WHY??
As per both the methods the results are different. I have also checked the example given in previous chapter also.
Piyush, if you have calculated the daily returns using the log method i.e log(today\’s price/y\’day pricee), then you have to use the exponential function to convert back to regular series.
If you have not used the log technique to calculate daily return i.e the regular approach of (Today\’s Return – Y\’day price)/Y\’day price, then there is no need for exponential conversion.
I\’d suggest you stick to the regular, non-log technique.
Add and subtract 1, is simply a mathematical manipulation to arrive at the answer quickly. For you to understand this better, try and answer this question – what is the value of Rs.250 if it grows by 7% by the end of the year.
Ok Sir…………got it………..Thanks a lot for your humble approach.
Good luck, Piyush!
hi
kartik
is there a way to get precalculated volatility to setup stoploss during intraday as it takes too much time to calculate during intraday trading. Also i could not get volatility data on nse website as suggested in chapter
Why don\’t you use ATR instead? Check this – https://zerodha.com/varsity/chapter/supplementary-notes-1/
thnaks a lot
Welcome!
Hi sir,
I read somewhere that Option writers lose money whenever there is a gap down or when volatility cracks? I was under the assumption that writers make money when price falls?
This depends on which option you have written. If you short put, then you want the market to move up. If the market cracks, then you will lose money.
Dear kartik sir,
I have been calculating the upper range and lower range for getting the approx high and low for 1 day in 1 SD and i have used this data for paper trading in nifty futures . I know you had suggested this for option writing. This was working fine until volatility started recently and there was wild movement in nifty and bank nifty prices. The closing prices were nowhere nearer the 1 sd calculation.
Do you think that it is good to calculate and follow 2 SD when there is such volatility.
I hope you are able to understand what i am trying to tell you. Waiting for your feedback.
Yes Shyam, 2SD is a lot more convincing than 1 SD. But I do understand that the payoff could be a lot lower with 2SD. Hence its a trade-off between the margin of safety and pay off.
Dear Karthik sir,
Thank you for such an in-depth explanantion
One doubt:
\”When I’m writing options 3-4 days before expiry I prefer to write 1 SD away, however for whatever reason when I’m writing the option much earlier then I prefer to go 2 SD away.\”
Do these 3-4 days include non trading days also or only trading days
Yes, it does Pooja.
Dear Karthik,
Thank you so much for this wonderful knowledge center.
I have a doubt, in the above example of Nifty,
You have Daily Average as 0.04% and Daily SD = 0.89%
The above calculation is for only trading days, but when you say 16 days to expiry, you are counting the non trading days also.
Will this make a hufe difference? I ask because you have multiplied by 16 or sqrt of 16 to get the final %
Jay, I\’d suggest you include the non-trading days as well.
Thank you Karthik.
One final thing.
It is really amazing that you have summarized your thoughts in this neatly packed \”Varsity\”. Not many do that. However I haven\’t seen anyone, patiently and quickly responding to Investors\’ questions. This is something which is awe inspiring. From the bottom of my heart I thank you and wish you all the best!! Happy investing brother
Hey thanks so much, Jay. I feel humbled 🙂
The nse website has a csv file which shows thevdaily volatilty and the annualized volatility.
What would you suggest we use – the volatility data from the website or volatility computed off the spreadsheet
The only hassle i see in the latter is that the data would need to be updated on a daily basis and the time would to do this is obviously be a function of the number of stocks
You can certainly use that sheet, Vimal. These calculations are fairly accurate.
In your call option table i notice that there is a bid for a 9250 call @ 0.10 quantity 16000
Two questions
Why would someone even bid when time to expiry is short and strike price is way above normal range
Would it not make more sense to write an option at this price and quantity considering the risk is very small and pocket rs 1600
I have not done any computations but tjis apoears like a no brainer
This is a typical betting mentality. People buy it thinking its a lottery, which hardly ever works in the market. Writing of course makes more sense 🙂
How to calculate volatility and stoploss for intraday?
Easiest way is to use the ATR indicator. More on that here – https://zerodha.com/varsity/chapter/supplementary-notes-1/
Thanks
Hey,
Today is the expiry day of options. As you mentioned the theta depreciates the premiums of options. On expiry of SEPT options whether the October options will face a huge decay tomorrow? Because as I see. Right now the Oct options are rpices pretty high on a particular stock I\’m tracking. If I buy a call or put of OCT OPTIONS today. Am I bound to lose money by tomorrow due to decay ?
Oct options won\’t be affected by this because there is still ample time to expiry. The Spet options would certainly decline.
For stoploss calculation, you didn\’t use daily average/mean. Just took the daily volatility?
Yes, remember, volatility is standard deviation, kind of incorporates this.
I was calculating the upper range and lower range for Federal Bank.
Because average daily return for this is in negative (for past 20 days), the upper range calculated turns out to be a negative number (which is not possible).
I\’ve not seen the chart, but is the stock trending downwards?
Can we use this volatility based calculation/stop loss for equity (cash market) intraday to predict the upper and lower limit of stock ? or it\’s only for options ?
Yes, you certainly can use it. However, request you to calibrate it to match the intraday trading situation.
Hey Karthik, pls suggest-
can we apply same principle to write call for bank nifty weekly expiry?
tq
You can.
Hi Karthik
Here, the volatility is favoring Options Seller/Writer. What are the applications for Buying call or put option? I am generally Bullish in nature and look for Bullish strategies in options world.
In that case look for buying options when the volatility is low.
while calculating upper range and lower range can it both be lower than the underlying price?
i was calculating the same for tata global..have a look at it and please tell me if im wrong.
https://drive.google.com/file/d/1BrvZsyAGwvz_icgMQXrJ0WzSgdupRAQq/view?usp=sharing
Yes, sometimes this can happen. This depends on the mean and SD.
it is really nice to have a teacher like you sir..Stock market makes so much sense now.
Thank you.
Thanks for the kind words, happy learning, Wasim 🙂
Hi Sir,
Once we calculate the range for 1 or 2 days using 1 SD dont you think its better to buy or sell futures(Nifty or Bank nifty) than options.
Futures price tends to move faster than options . I mean options prices moves as per delta ..option greeks play a big part.
Have been doing paper trades . The results have been good. Dont you think its better to scalp in futures i.e may b get out of the trade once you gain 60-70 points. I just need your point of view on this?
Not really, the idea is to write the options beyond the range. When you buy or sell futures, it can very well go against you and the worst part is that there is no clarity on the probabilities involved.
To scalp, I think futures is good.
Hi Karthik,
Thanks for teaching these topics so effortlessly.
I have a doubt:
You mentioned that Hence –
\”You can sell all call options above 8818 and collect the premiums because they are likely to expire worthless
You can sell all put options below 8214 and collect the premiums because they are likely to expire worthless\”
I want to know…since I dont have enough margin can I do the following:
1. Instead of selling a call option I\’d buy a Put option
2. Instead of selling a put option I\’d buy a call option.
I have this conceptual doubt as I\’m not able to distinguish between buying a call option or selling a put option and vice versa.
Thanks,
No, that wont be right because when you sell an option, there is a specific reason for do so. Likewise when you buy an option, there is a very specific reason to do so. One cannot really replace the other.
Thanks Karthik,
Can you help me understanding the specific reasons which we need to follow…I cannot wrap my head around this…why cannot I buy a call instead of selling a put and vice versa..
Thanks.
I understand. You cannot substitute a long option thesis with a short option of the other type. This is because –
You decide to buy an option when –
1) You expect the market to move in a certain direction over a certain period of time
2) You expect to make quick capital gains on the premium (sometimes as much as 100% or more)
3) When you want to place a small amount of money on the table and expect asymmetric payoffs (small premium paid for OTM options)
4) When the volatility is beaten down and you expect it to increase
You decide to write an option when –
1) You expect the market to stay flat and make sideways movement till expiry
2) When the premium has swelled for irrational reasons, and you expect it to collapse
3) When you expect the volatility to cool off
So as you see, the reason to go long and the reasons to write options are different. In my opinion, one cannot substitute the other.
You can also check with good investment book for stock and shares through below link.
https://www.amazon.in/Quantitative-Value-Investing-Buying-Stocks-ebook/dp/B01CHBA2QG?tag=price-in-india-21
Sir I have a question.
Suppose i sell nifty 11200ce 15 days before expiry of premium 11.55, what would be stop loss set. current market spot price is 10950.
can you let me help stop loss according to volatility IV of nifty 11200ce is 12.5.
thanks.
Rajnish, since you have shorted the option, you must be of the opinion that the volatility is high. If this is true, then I\’m assuming you also gave a value in mich to which it may fall. Exit the position then.
I don\’t understand your answer. Sorry. Could u explain ?
Volatility and option premiums are highly correlated. Premiums go up when volatility increases and premiums go down when the volatility reduces. So when you trade options you also need to have an opinion on the volatility. I\’ve explained this in more detail in the chapter.
Thx. Sir
Tried calculating the range of BNF for the rest of the week today. Range came to 26316- 27073
1. I calculated range at 8AM so took 4 days to expiry, i.e. including today (Monday). Is this correct?
2. I thought of buying 26300 CE since I am sure it will not break my lower range. But the premium is over Rs. 300 and as you have mentioned several times to me before that at expiry, premium will be almost close to IV, say BNF is about to close at worst 26325 on Thursday, so IV will be Rs. 25 and I at the end stand to lose \’cos premium paid is about Rs. 300.
You\’ll ask me to short 27,100-27,200 and collect premium of about Rs. 600+ but I cannot afford Rs. 89k as margins.
Please help me strategize in such situations as I am a new trader with low capital.
1) Yes, that works
2) Yes, that is right – as you move closer to expiry, higher is the intrinsic value and lower is the time value.
You won\’t really have an edge when you buy options close to expiry, Chirag 🙂
Regarding pt. 2-
Last Thursday, the day\’s high on BNF was over 150 points from opening and touched only after 2PM. So If I predict even a 75-100 point jump then buying an ATM call or slight OTM call on expiry day in the morning will fetch me good gains over the day, right?
At the money works best in such situations.
How is expense for 1 lot- ₹1.95?
Every time there is either buy/sell, Zerodha charges flat ₹20. Can you explain please?
Suggest you look at the brokerage calculator here to know the exact details – https://zerodha.com/brokerage-calculator
Using Para 18.1, SD, Normal distribution and more which you have taught- Can I use very short time frames, say 15 minutes and try to predict a 2-3 point change in Bank Nifty?
For example, I buy 40 lots of Bank Nifty for <= ₹100 premium and calculate (sorry I used the word 'predict' earlier as this is pretty much scientific and not out of gut feeling) and calculate upper and lower range of BNF 15 minutes so I can try earning 2-3 points max and make around 2k gross profit in one trade.
Will it work?
Viraj, technically possible, but can be a hugely tedious process. The challenge here is to separate out noise and information component here.
\”Step 3. Calculate the stop-loss price by subtracting 4.01% (5 day volatility) from the expected entry price. 395 – (4.01% of 395) = 379. The calculation above indicates that Airtel can swing from 395 to 379 very easily over the next 5 days. This also means, a stoploss of 385 can be easily knocked down. So the SL for this trade has be a price point below 379, lets say 375, which is 20 points below the entry price of 395.\”
Why you not calculate the exponential value here?
Khurshid, you can use the ATR indicator also.
While calculating SL as 379, why didn\’t we use the formula to find lower range as per previous chapters.
Lowe range = CMP+(Mean-SD)
Similarly for Upper range = CMP+(Mean+SD)
But somehow 379 was calculated as CMP-SD?
CMP is 395 for Airtel
Vishal, mean ± SD in fact works. I have been intending to update this chapter.
Hello Karthik,
Great initiative and thank you for sharing. I have a query regarding the data time frame. You generally prefer past 1 year data for mean SD calculations? Or can we take more than 1 year data too?
You certainly can, Siddharth. However, the point is, SD-based trades are short-term in nature so most of the times, 1 year look back suffices.
Hi Karthik,
How have you determined the value of Annualized Return? Is this like following:-
Daily Return=0.04%
Annual Return=0.04*365= 14.6%
However, when we calculate the annual return of Indigo like taking 04-Apr-18 and 05-Apr-17 i.e. (1388.5 -1086.55)/1086.55= 24.52%
And by calculating the based on daily return it comes out to 43.66% means (Average Daily return *365).
So I\’m confused what to use and which one is accurate??
Regards,
Kunal
Kunal, you need to calculate the daily average return and multiply that with 365.
Hi Karthik,
Your explanation is quite well. I\’m getting good knowledge out of it. Thank you very much.
Just want to know how you do following:-
Track the markets and gauge the market sentiment all along. The moment you sense things are going wrong be quick to exit the trade.
Regards,
Kunal
Glad to know that, Kunal.
This comes largely from experience but it has the disadvantage of involving human emotions. To avoid this, you can even look at indicators.
Hi karthik,
I have read all ur chapter word by word and i have understood everything well till here. But when i read the comments posted by readers they have referred to Implied volatility(IV), VIX in their comments but nowhere i find these terms in the above chapters till ch18.. so is implied volatility the alternate name used …and what abt india VIX … ???
India ViX is a proxy for market\’s implied volatility.
And what is historical volatility & Realized volatility???
Today\’s realised Volatility becomes the historical volatility.
Hi Mr. Karthik,
Big Congratulations!! Your explanation is excellent. I have completed up to the application of normal distribution chapter.
I have a question,
We get the Daily Volatility and annual volatility from NSE\’s website. How can we know the exact value of NSE\’s average?
Do I have to use the daily returns manually calculated by LN formula in excel?
Again thank you very much.
Regards,
Kunal
Kunal, glad you liked the content here 🙂
You can use NSE\’s volatility value. I\’m really not sure about the technique they use, so can\’t comment on the averages.
Hi Krathik,
Thanks for your reply.
I\’m re framing my question:-
See we have Daily volatility and annual volatility from NSE\’s website. Apart from that we do need average to calculate the upper and lower range.
You mentioned earlier in the comments that NSE\’s data should be used for more accuracy. So i want to know how we take NSE\’s average?
Regards,
Kunal
Thanks for the clarity 🙂
NSE does not give the average of the returns, I\’d suggest you calculate the average on your own.
Hi Karthik,
Can you please explain who to utilize volatility skew to step up a trade???
And thanks for providing such wonderful piece of work(Varsity).
There are quite a few options traders who look at this.
Sorry karthik…i didn\’t get you.
can u please explain how to look at volatility skew in setting up a trade.?
Skew helps you compare today\’s vol to historical vol. So this means by referencing the vol, you can identify if the current IV is high or not. If yes, then probably you can look at selling option…else if the vol is low and expected to go higher, then perhaps you could look at buying options.
Thank you very much karthik..Great to have you for solving our queries..
It is an honour for me, Smiranjeet 🙂
Hi Karthik,
Regarding black swan event : I personally get out of the trade when the option transitions from OTM to ATM.
Lets say we are short on call option and due to some very good news in overnight ,market rises more than anticipated next day morning , option will transition from OTM to ITM . How do we manage this risk.At the time of writing itself how we can mitigate this risk.
Thanks,
Vinod.
Vinod, unfortunately, you cannot cover this risk when you hold a naked option position. Hence the need for a option strategy 🙂
Hi,
how to roughly determine \”expected holding period\” .
This really depends on your target expectation. When you initiate a trade, you hold till your target is hit or the stoploss is triggered.
In section 18.2 ,Step 2, you are using expected holding period to calculate total volatility over 5 days .
If there any formula to determine expected holding period from Stoploss ,Target and entry price ?
Ah, no….expected holding period comes from your expectation of profit and target. Probably something like a technical analysis will help.
Hi Karthik,
I really liked your trading parameters that you defined for a good trade, For example : \”Visibility on risk and reward – both should be quantifiable\”, etc….
For example, if I have sold a far OTM Option, and if I want to exit the trade only if the Option becomes ITM , so how can I quantify my risk in this case before taking the trade ? Is there some particular risk assessment model that you use ?
Regards
Kulbir
Kulbir, I guess there is nothing available specifically for this. However, you can develop a framework based on the volatility of the stock – this will give you a sense of how widely the stock can swing and therefore a probability-based assessment of far OTM turning ITM.
Ok, understood, looks complicated.
I was wondering whether do we have something similar to the Black & Scholes formula to estimate the price of an Option for a future date.
Hmm, that would be a bit tricky 🙂
Hello Karthik,
if i write an option,do i need to wait till expiry to close my trade.
if i do so what will be the loss?
Thanks
No boss, you can square off anytime you wish.
I am new to option writing and have read your content and must say it is excellent and lot of concepts are clear. Before I go into writing an OTM option i wanted to know if, i write a call option of Nifty 10800 @ 4.55 today and let it expire – is my understanding correct that I will pocket a premium of 341.25 (75×4.55) – (the STT + Brokerage + SEBI charges + Stamp duty i.e 23.81). So, eventually 317.44 should come in my account of Feb 22 2018.
True.
Thanks a lot Sir. Your lessons are really amazing for a beginner
Glad you think that way, Vivek. Happy learning!
Hello sir,
I have few questions:-
1.if I want to buy a naked call option of a particular chain\’s particular strike than how to utilise India vix
Say I have different strikes and IV figures such as, 10300(ITM), 10400(ITM),10550(ATM),10700(OTM),10850(OTM),10900(OTM) & 12%,14%,16%,35%,22%,19%respectively and at the same time India VIX is at is at @19%
2.You wrote this line in option module\’s India vix topic
\”NSE computes India VIX based on the order book of nifty options\”
What do you mean by this line
Are you saying volatility of nifty underlying or nifty future are based on nifty\’s option or even on a particular nifty option chain or strike
3. In next line you said \”The best bid-ask rates for near month and next-month Nifty options contracts are used for computation of India VIX\” Which are they best bid-ask rates are they belongs to particular ITM,ATM OR OTM strikes.
4. INDIA VIX can swing between 0 and 100 but Who will decide that India vix value is in high, low or normal range means what is the reference behind saying it\’s high ,it\’s low or it\’s sideway.
5. Can I consider if india VIX is high then option are expensive to buy because strikes must be trading at higher volatility due to higher India vix value. Assume direction will be sideway in coming days.
6. Do we use historical volatility in option calculator or implied volatility
To get theoretical premium value.
& How theoretical premium differ due to different volatilities used in option calculator.
7. IV increases before big events is understandable to me but Why sometime volatility decreases exponentially without any reason or big event and premium became cheap. I was watching March expiry of nifty and a strike which was almost ATM and it\’s volatility was @ 1.35% and premium was 0 .so why this happens.
8. How to know how much is the realized volatility in number or percentage term like Implied, historical or forcasted volatility you did not described about this in option theory module ( I didn\’t read option strategies module yet)
9. You said there is four type of volatility exists Historical,implied,forcasted and Realized volatility
In case of implied volatility you said it represents the participants expectation on volatility it mean that they are expecting something for future because expectation take place in future then what is forcasted volatility is doing here
Then what is the difference between forecasting volatility and implied volatility are they both same
Thanks for reading this granth and for your patience
1) As a rough back of the envelop, I\’d consider all options above 19% IV as expensive in terms of volatility
2) You can check the details on India ViX here – https://www.nseindia.com/products/content/equities/indices/india_vix.htm
3) Check the details from the above link
4) I think historically, 26-30% is the highest it has reached, hence this should serve as a benchmark. On the lower side, it have touched close to 8-12%
5) Yes
6) IV
7) This can also happen due to pure demand supply reasons – although not frequent
8) Forecasting Vol is your expectation based on your forecasting model, IV is market\’s expectation.
HI sir,
i wanna know that if i am right
Todays realized volatility will be read as historical volatility tomorrow if yes then this must be fine
realized volatility(1-jan-2017) = Historical volatility (1-jan-2018)
Yes, Ankit – today\’s realized volatility will be t\’row\’s historical volatility.
Hello sir
SiR is India VIX simply forcasting future possible Realized volatility ????
Yes, it is representative of market\’s expectation of future volatility.
Hello sir,
i also want to know that does technical analysis works on India VIX ?????
No, it does not.
Hello karthik sir,
Thanks for clarifying my last question. i have a doubt what is india VIX telling me about. Means india VIX for in a time is @14% is it representing IV of NIFTY 50 if yes then suppose i am taking a trade in a option market for say a naked call buy whatever strike and IV volatility for that strike is @ !9% then how india VIX will help me to decide to go ahead and take this trade or just leave it basically i want to know connection between India VIX and option chain EVEN a particular strike in a particular option chain and i also want to know thought process behind this trade step by step assume all other variables are constant you just focus on INDIA VIX and on strike price.
And thanks for your valuable efforts
Have you read the chapter on Volatility cone/Smile? , check this – https://zerodha.com/varsity/chapter/greek-interactions/ . This will give you a perspective on how you can use the volatility to set up trades.
Hello,
Could you tell where can one find the mean of the underlying. Volatility is available on nse, but I don\’t see the mean. TIA
You can calculate this yourself, Vikrant. Have explained the calculation method in the chapter itself.
Dear Kartik,
Thanks for the valuable information you post in your site for free.It really helped me in adding to my passion for understanding market dynamics To my limited understanding scientific version of price motion seems that If the motion of prices were with uniform velocity and uniform acceleration , price motion would have it plotted as straight line if depicted in a chart showing linear motion.But in reality prices moves with variable velocity and variable acceleration and hence when plotted we it is seen as zigzag with nonlinear motion. Economic version of price movement seems that price moves with varied speed and varied volatility and this volatility gives opportunity for traders to trade and make money in the markets. Had the volatility been constant and speed be constant prices would have moved in a straight line and investors would have got fixed returns in fixed time lengths.(CAGR over an year and log return on a daily basis. If volatility and speed is zero then prices would not move and traders will have no opportunity. Returns in the market (positive or negative)are as a result of dispersion from the price equilibrium point created by demand and supply at that instance. A new equilibrium point is created with each trade and based on the equilibrium point in the underlying is the futures equilibrium point and options equilibrium point evolved. In Indian market context the shift of equilibrium point is seen set at 5 paisa for all scrips and indices. The shift of the equilibrium point in underlying translates its effect to the futures equilibrium point in turn passing its effect on to the options equilibrium point with option pricing following the underlying pricing based on its sensitivity of the first , second and third order. Dynamics of the equilibrium point shift is complex and not merely apparently visible demand and supply. It is neither totally fundamental nor technical but natural like a river flow around the theoretical value line. It is a mixture of rational calculus and irrational randomness with butterfly effects playing its role .The whole market seems mathematically programmed and marketmaked in such a way that when underlying moves(without any effect of time) futures and options too moves in a mathematical way dependant on time length to expiry. Fundamental analysis tries to look the linear motion of the underlying value based on macros and micros and not bothered about the noises in between where as technical analysis is bothered only on the effect of the noises benchmarking certain points in economic space like price ,volume and open interest but not taking the time length and underlying value. If robots with artificial intelligence could be created with infinitesimal calculus skills and chaos reading skills which can comprehend, synthesise analyse and evaluate infinitesimal data, macro and micro, it would be good bye fund managers over period of time . Many conglomerates are already on the move to tap AI. Could happen within a decade . Lets wait and see. Would appreciate if I could have your email id to explain you some scientific versions of price motion if price is equated to a mathematical object and the principles of Newtonian motion and chaotic motion is applied along with mathematical and economic theories.
I agree with the uniform acceleration and velocity bit, that depicts a rather safe asset like a fixed deposit. The variable nature of speed (also called Delta in the options world) and velocity (also called as vega in options world) gives scope for setting up the trade and hopefully profiting out of it.
Good luck with your work, Najeeb.
Hi Karthik,
Your article on Volatility based stoploss was really enlightening and it really helped me expand my knowledge on calculation of Stops .
If possible for you, can you please let us know how do you calculate the Stoploss for a Call option using Volatility, do you use IV(Implied Volatility) or do you use the Volatility of the underlying. A small example will be helpful, please consider the following scenario:
NIFTY SPOT : 10607
NIFTY 11200 Call : 9.30
Today\’s Date : 8th February
Expiry Date : 22nd February
Implied Volatility : 16.84
Nifty Daily Volatility : 0.84
Q. How do you calculate the days until expiry ? Do you calculate it based on the number of working days for the market ?
Q. How do you calculate the Stoploss for this Strike using Volatility ?
Q. Do we need to consider other Geeks also to calculate the Stoploss, for example Gamma, since it is against the Options Seller ?
I;m glad you liked it, Kulbir. All calculations have to be done on the spot market. Not really on the options directly.
1) Take the number of days to expiry.
2) Like I said, the calculations have to be done on the spot market.
3) Not really, just the volatility + range should suffice.
Hi Karthik,
Thanks for replying so promptly. Like you said that we need to do the calculations of StopLoss on the Spot Market. That makes sense.
Suppose if I am writing a Call Option and the Option starts moving against me(spot starts to increase in price), then by the time the Spot Market reaches the Stoploss(Volatility based stoploss), the Option may have had a sufficient increase in price to damage my trading account, so how do you think can we counter this ?
You will have to plan the options trade by looking at the price on the spot. For example, spot is at 10500, hence I decide to write the 10600 CE @ 45. Now spot moves to 10620, I decide to close the trade at 56. The point is that I\’m not really looking at option price here – I\’m working on the spot. The option price is incidental. Having said so, there are times when I work purely on option price, irrespective of the spot price. There is no one rule that fits all situations, varies based on case to case basis.
Hi Karthik,
I am really thankful for your valuable opinion. After reading your articles, I would love to explore the world of quantitative trading. Can you suggest some useful books or other resources for this ?
Also do you provide some trading guidance to people outside Zerodha Varsity. If so I will be very much interested to know more about it.
Regards
Kulbir
You could start with this – https://www.amazon.in/Quantitative-Value-Investing-Buying-Stocks-ebook/dp/B01CHBA2QG?tag=googinhydr18418-21
Actually SD is to be calculated based on square, square root and we are using it.
Is there any study which uses cube and cube root, or \’n\’ and nth root ? Why exchanges volatility with SD only ?
I\’m not sure about this Santosh. Standard deviation is the standard measure of volatility.
Hello Karthik,
I shorted Banknifty 26300CE yesterday (6-2-18) which is expiring tomorrow (8-2-18) and the premium which I received was 23 which was about 1.3% Return and the spot was around 25300. Surprisingly spot moved to about 1000 points in around 30 mins or some thing. And the option which I had shorted was near to atm. Leaving me no choice but to close the trade at a loss of 10% of capital.
So my question is, if I am trader who is not comfortable in losing more than 2% in any single trade. Is this strategy of writing the options near the expiry suitable for me?If it is how can I place my stops because my premium could move to 2% or more and eventually cool off at the day of expiry . If I place my stops say like 2% from my entry, it will most likely hit my stops and cool off at the time of expiry. So how should I deal such cases?
Thank you.
Nihkil, when you write options, you need to make sure you account for volatility. A 1000 point move on bank nifty is very common. So account for this and write options which are outside the expected volatility range. When you do this, you will have staying power and therefore higher chances of making a profitable trade.
I had done volatility calculations and 3SD was 26150 and I shorted 26300.So what I want to know is can I limit my risk to 2% per trade?
If yes, how can I?
Thankyou 🙂
Yes, you can by exposing 2% of your capital to this trade. We have discussed more on the topic of capital allocation here – https://zerodha.com/varsity/module/risk-management/
Hello sir,
Thanks for such an informative topic.
just one doubt, please tell me if shorting a call(selling a call) and writing a call is same thing?
Yes, shorting a call, writing a call, short call are all the same. It refers to the act of selling a call option.
Sir,
Since the topic is almost two years from now..so do u still use the same techniques to select strikes and sell calls and also is it still 5-6 days before expiry? You had shared some stocks in the chapter in which you prefer to sell calls have u added some more to the list ??
Secondly in a section capital allocation in this chapter u named Momentum based strategy ( futures ) which u use..have u shared that here in varsity..if yes please share the link and if no please give a hint what is all about..
Thanks
Yes, if i were to select strikes, I\’d still use this technique.
I will write about the momentum-based strategy in the Trading System\’s module – https://zerodha.com/varsity/module/trading-systems/ .
Sir,
When we apply this stop loss technique in intraday, from which price (open or high or close) the daily volatility should be minuses?
Sir,
Let\’s say i bought a 10500 strike price
call option buy @75 rs premium.suppose i missed to square off my position on expiry day and the option expired @10600. Will i lose the whole money , else 25 rs is my profit?
Yes, you will lose the premium you\’ve paid i.e Rs.75/-.
So it\’s mandatory to square off the position before expiry?
No, not necessary that you square off. The Option will be exercised since its in the money.
Intrinsic Value will be 10600-10500= Rs 100. After deducting the charges, you\’ll be settled with the net amount by the broker.
Note- STT will be higher if the option is exercised. Read more here
Dear Sir,
You have done an incredible job by writing difficult concepts in a very lucid manner so that anybody and understand. I have a couple of doubts regarding the topics covered in this chapter.
1. Throughout the chapters on options theory and options strategies, you have explained with graphs how to choose the strikes (for both calls and puts) with expiry in perspective. Now, does Standard Deviation find its application in only writing options and not for buying?
2. In one of the examples in this chapter where the Nifty\’s range has arrived as 8214 and 8818, you have mentioned since we are 16days away from expiry it is better to sell Call options (in OTM range-8850 &/or 8900) and collect the premium. If we sell 8900 strike call option and if market expires at 8500, if we buy the option at 8500 and close the position, apart from the premium will be getting the difference between the strike and spot multiplied by the lot size?
Dear Sir,
I think the second question is very silly or basic. As explained by you Intrinsic value for call options is spot minus strike and by virtue of which the option would expire worthless and we retain the premium. I request you to clear the doubt on the first question.
Yup, thats right.
1) You can use SD in terms of buying options as well. But in my estimate, it is best when used for writing options.
2) No, when you sell an option you earn only in terms of premium received.
Dear Sir,
Thank you very much for your guidance. In my view, after going through options strategies I feel during the second half of the expiry series if we find the range in which the Index or Stock toggles then we can set up Short Strangle to be in small/decent profits consistently. Correct me if I am wrong.
Suppose on Friday (22/12), the spot is around 10,500 & I write the 10,700 call option (premium around 4). On expiry day, around 3:20, if the spot is at 10,600-
1) Should I square off my position or let it expire? In which case will my profit be higher?
2) Secondly, I\’m assuming that the premium would be near 0 by then. Am I right in assuming that?
Thanks!
1)You can let it expire, the chance of Nifty moving 100 points in 10 mins is very very low. Your max profit is Rs.4
2)Yes
Okay. But wouldn\’t STT be more if I let it expire?
STT is applicable if you are holding a long option position upon expiry, not when you have written an option.
hello Karthik,
Loved this chapter. I have a question regarding the volatility based stop-loss.
let\’s assume that during a trading day, I find an opportunity to short a go long at Rs.1000 in any particular stock at 12:50 pm ( 15 min chart ). The daily volatility of a stock is 1.25 %. but the last day closing price is 996.
So should the stop be at 1.25% of 996 i.e around 983? or the stop should be at the 1.25% of 1000 i.e 988.
Basically should I place stop loss order according to last day closing or desired entry price?
Thanks
SL should be based on your entry price – remember, this is your reference point.
Hi Karthik,
Nice write up as always! My compliments!
Was wondering whether you could help me with the following queries:
1. Can we apply volatility based stop loss in intraday time frames? Like on hourly or half-hourly time frames (even though I intend to hold the position for a few days)? What would be the formula in that case?
2. In the example above, you took the nearest resistance as target which is great, but how can we identify a potential target if the price is breaking it\’s previous highs or lows? Or in other words, it\’s trending up or down, beyond past resistances and supports?
3. Also, how can we calculate the approx. holding period within which it reaches the target? Like in the example, you mentioned 10 days. How did we arrive at that?
And this I am asking w.r.t Equities. Would appreciate your help. Thanks.
~ Abudhar al Hassan.
1) Yes, you certainly can. Calculate the daily Volatility range on EOD basis (have explained the formula in the chapter itself), and identify the stops
2) In such cases, its always a good idea to trail your SL
3) No standard measure here. You just have to wait till it triggers your target
how did you get Daily Average Return.
by =LN(8525/8564)i.e =LN(closing of 10 august/closing of 9 august)
=LN(Today\’s close/Previous day close)
how i calculate usdinr volatility from the nseindia website pleace guied me over there….
You can use that to place option trades. I\’d suggest you go through this module in more detail.
As you have mentioned –
\” I prefer to short options only on the last Friday before the expiry week. For example given the August 2015 series expiry is on 27th, I’d short the call option only on 21st August around the closing. Why do I do this? This is to mainly ensure that theta works in my favor. Remember the ‘time decay’ graph we discussed in the theta chapter? The graph makes it amply evident that theta kicks in full force as we approach expiry.\”
My question is : Do you exercise option on expiry or square-off before expiry?
Let it to expiry, assuming its expiring worthless.
If it is not worthless. Then?
Square off and book your loss.
Sir kindly explain how IV is calculated in option chain, each strick price has different IV.
thanks sir?
Calculating IV is not straightforward, its quant intensive…and I dont have expertise in that area. However, you can reverse engineer this on a B&S options calculator.
thanks sir
????
Cheers!
Hi Kartik,
Thanks for sharing such wonderful knowledge about options. Have a query on the above chapter.
1. From where did you get the Daily SD = 0.89% & Annualized SD = 17.04% numbers.
Understand the daily returns & annualized returns calculation from last chapter but could not get the SD values.
Pls share your feedback, thanks.
Rgds Dipankar
Standard Deviation is the measure of Volatility, which is what we have calculated in the previous chapter.
1) I had started straight away started with the options theory module and wasn\’t aware of the Bullish Harami pattern (which I assume had been shown in a previous chapter), so should I read some of the earlier chapters first before moving forward from this chapter onwards? Same goes for Futures chapter. Haven\’t read it, though I know the concept somewhat (at the very basic level). Personally, I was thinking of reading this and the next (option strategies) module first before moving to either Futures or Technical Analysis chapter.
2) Is there some program/software where the (excel) calculations shown in the last few chapters can be done automatically? Some of us may not be that well versed with Excel.
Thanks!
1) I\’d suggest you read this chapter, Sachin – https://zerodha.com/varsity/chapter/getting-started/ I\’ve tried to explain how these modules are connected.
2) You can automate all these using any programing language. Excel is for non programmers 🙂
Hi Karthik,
Could you please let me know if 1) \” since inception CAGR annualized daily return compounded daily \”of an underlying stock is the same as since inception log return and does it have any mathematical relation with DV 2)For DV calculation since inception data input or yearly data input gives more precision if the intention is for price velocity and price acceleration tracking than risk tracking. Chaotic random motion and butterfly effect has how much effect on volatility?
Daily log returns give you the daily returns, CAGR, on the other hand, gives you the year on year growth rate. For daily volatility, you need to take the daily return data. Anything else would distort the numbers.
Thanks for your reply sir.
As you said the only way to track IV is through historical volatility.
So can we do it from the average of the historical volatility available till now and calculate its SD and can we see the IV keeping the mean and the SD in perspective of historical volatility. Will it give us a view on if the volatility is high or low. And also maybe we can apply it only for the ATM options as from there we know that IV behaves as volatility smile. And I am waiting for the day when Zerodha will invent the volatility cone tool it will be the best that one option trader can get for trading options.
Thanks a lot for your efforts sir.
You can check the average historical volatility and compare that against the current day IV. But do remember this technique is only an approximation. Not really the clean way to do it. Hopefully, the options tools will roll faster from our end.
Hello Sir,
First of all I would like to thank you for sharing such an ocean of knowledge that you had with us it\’s like a feeling that we are being guided by the best cricketer to learn cricket thanks a lot for your effort sir and the simplicity you provide that helps us to understand wonderfully once again thanks a lot. And I had also compared Zerodha brokerage charges they are way low from the traditional brokers of the market you are just doing an mind blowing job.
Now coming to my question.
Sir can you please help me finding out the lowest and the highest volatility of a specific stock or option as it will help us to know wheatear the stock that is trading with a implied volatility of 38 or 40 is its average volatility or it is with high or low volatility because sir there is different volatility for different stocks so I am confused in knowing wheatear the volatility of an option or stock is running high or low?
Eagerly waiting for your reply
Thanks & Regards,
Ketan. 🙂
Thanks for the kind words, Ketan. I\’m really glad that you are enjoying your experience with Zerodha.
The only way to get a sense of how today\’s IV is with respect to the historical vol, then you will have to plot the volatility cone. Unfortunately, this is not really available as a tool anywhere. Hopefully, we should be able to plug this gap soon.
Hey Karthik –
1. How do I know the timings for monetary policy, policy decision, corporate announcement etc?
2. Is there a site which has all this data in a single place?
3. Can you list down all the main events (policy etc that you discussed) that we should be aware of ?
4. Stop loss needs to be put on a daily basis?
Won\’t that be a pain for part time traders?
5. On what basis should we decide on a holding period for an underlying?
1) This would be tough as companies and agencies are not required to stick to a particular time
2) Not sure, I\’ve not come across anything reliable
3) Check this – https://zerodha.com/varsity/chapter/key-events-and-their-impact-on-markets/
4) Yes
5) Depends on your risk appetite.
Hi Karthik,
Thanks for adding inputs to volatility queries.Since 365 , 252 or 245 was giving me sleepless nights though of talking directly to the NSE IISL team on index constructions and got to know how they make volatility calculatuions.They dont follow the normal SD calculation .A bit complicated way based on previous day volatality , log return and current day volatality and squarerooting 365 for AV calculation or GARCH MODEL for INDIAVIX. Volatality data of all FO scrips in \”all daily reports\” of MONTHLY REPORTS in equity derivatives in PRODUCT link.
Ah, that\’s quite insightful, Najeeb. Thanks for sharing that bit.
hi karthik
i am little bit confused in the calculation of daily average return & daily SD. can you help me with an example?
Have explained this with an example in the chapter.
Nifty other information values are also log returns?
Can i use directly nifty other information volatility values for range calculation?
I\’m not sure if its log, but yes…you can use for range calculations.
hi karthik
can a short option position be carried overnight or it has to be squared off intraday?
If you are shorting in F&O, then you can carry forward the position.
got it!!
Cheers.
hi karthik…in the previous chapter you have used the following formula to arrive at the likely levels:
time duration=t
present value=p
daily return=r
daily SD= s
likely range after t sessions =p*e^(rt+s.sqrt(t)) and p*e^(rt-s.sqrt(t))
i understand these are log returns and log standard deviations.so things follow logarithm arithmetic….fair enuf
but in this chapter u have calculated likely range as follows
p(1+(rt+s.sqrt(t))) and p(1+(rt-s.sqrt(t)))… which shows u assume simple mean and SD…
can u please clarify the anomaly
Megha, if one is taking Log returns, I think it makes sense to convert it exponential form. I\’m aware of this anomaly, I\’ll fix it and make it consistent across chapters, thanks for pointing it out.
thnx
i am little confused with calculation of dailaverage return?
is it daily return ln(B/B2) ?
or
something else?
Its either –
(today\’s close/y\’day\’s close)-1
or LN ((today\’s close/y\’day\’s close)
But, both the formula giving different result. I understand (today’s close/y’day’s close)-1, but could not understand LN ((today’s close/y’day’s close). How LN is the substitution of other formula? Thank you in advance.
The LN gives a more realistic perspective of returns. I guess I\’ve explained this with an example in this chapter (or maybe in the earlier one). Request you to kindly look into it. Thanks.
hi kartik,
I have two questions:
1. in the above airtel example you directly used SD to calculate the stop loss, whereas in one of you nifty examples you used avg return – SD to calculate the stop loss, so my question is when to use avg return and when to use the SD directly to calculate the stop loss?
2. sometimes you use log returns and sometimes you use regular returns, so when sould we use Log returns and what is the significance of using Log vs normal returns? (especially if we are going to convert our answer back to normal form anyway by using the exponential function).
I need to review what I\’ve written, its an old article. However, I\’d suggest you use SD.
If you are converting it back, then you can use log. If your data period is under 1 year, stick to regular. Usually, for large data sets, ppl prefer log.
Hi Karthik
Today I was thinking about trying to write Bank Nifty Call Option with Strike Rate 24500 with premium 20 in the morning and in a hope China India problem won\’t rally the market.
Date = 16th August 2017
Number of days for expiry = 2
Bank Nifty current market price = 23996.95
Daily Average Return = 0.10%
Daily SD = 0.92%
With 1st SD
Upper Range: 24357.95
Lower Range: 23732.72
Now today Bank Nifty Closes at 24437. And Bank Nifty Strike rate 24500 premium closes at 63.13.
Now in case tomorrow bank nifty remain flat or below this value. I will get full premium but yes today my more margin amount will be blocked because of high premium. But if I wait till end of day tomorrow and let my option expire. I will be in profit.
Right ?
Is my calculation correct ?
Yes, as long as Bank Nifty closes below 24500, you will get to retain the entire premium of Rs.20.
Good luck, Waqaar.
Thank You Karthik.
Welcome!
Can the daily average return be a negative value. If yes the for the Upper and lower value do we consider the sum and difference 0f the Absolute Values or we add and subtract taking the \”- ve\” into the calculation
Sure, it can be. Yes, you will have to take -ve value into consideration. This is especially true for stocks which have trended downwards.
Hi Karthik
If the average return is negative do we have to use the value with the negative sign or absolute value. In the case of INFY the average return is -0.06%.Daily SD =1.47%.. Annualised Average Return -14.82%. Annualised SD 23.24%. Upper Range= 8.52%. Lower Range =-38.16%. If I convert using the CMP of 896 I get upper range as 975 and lower range 612 at one SD. In my view this appears absurd. I have taken the latest one year INFY price from 1st Oct 16 to 30 th Sep 17. Whether the model shown by can be applied to stocks and indexes which are trending down and which as per fundamentals reached bottom? Or any mistake in my calculation?
It would make sense to take the -ve sign. Taking the absolute value would skew the results. I understand, that is the range – but then there is a probability for that which you need to consider.
How to calculate the probability?
The quick and dirty way is to consider the past records. For example, if the last 6 of 10 trades have been profitable, then the probability of the 11th trade to be successful would be 60%.
This is an awesome explanation. Loving the whole experience
Glad you are liking this 🙂
Where do you obtain this data:
Date = 11th August 2015
Number of days for expiry = 16
Nifty current market price = 8462
Daily Average Return = 0.04%
Annualized Return = 14.8%
Daily SD = 0.89%
Annualized SD = 17.04%
You can calculate the same, its explained in the chapter.
Hi Karthik,
How can we determine a stop loss for Options? Should we take the volatility of the stock and apply it to options premium (Doesn\’t look sensible)
Kind of tricky. But yes, you should be looking at SL based on spot and translate that to the number of points you\’d lose on premium. Not easy, but I guess this is a better approach.
But the daily volatility comes around 2% whereas the options premium can move 20% or more in a day. The stop losses would be triggered consistently then.
Not really, think about it – how often do you see a daily 2% move on Nifty?
No. I\’m talking about stock options. And I\’m not sure I got your point. Can you please explain with an example if possible?
Ok, here is a rough example – If you have 1000 CE option of Reliance when the spot is trading at lets say 980. Now, you can hold on to the this option, irrespective of the premium till the stop hits 970. 970 is arrived at based on the volatility of Reliance.
Okay. Got it now. Yes that\’s seems like a great method. Thank you for sharing knowledge Sir.
Good luck!
Hi Sir,
Because of delay on getting Reply, I have gone through all \” 211 \” Comments above … I have got the answer … It was a repeated question from my end …Sorry …
… But I didn\’t find a Precise answer to one question, what if the Average Daily Return is Negative ? , it\’s really affect the Calculation. You answered to the same question \” KARTHIK RANGAPPA Will try and do this sometime soon.Thanks. \” …
…C an you please come up with a Solution for Negative ADR, Now I am simply changing the Negative in to Positive and using the same ADR value … Is it the right way to Calculate ?
Thanks a lot for your Articles …
Sure, Abhilash. I will try and do this soon.
Hi Karthik , Very Happy to see your Reply … one more question please ,
There are many Stocks under gone Stock Split , If we download CSV file of 2 / 3 years, it shows price before Split and after Split with respect to stocks … So how reliable this Data to calculate ADR and SD … SO is there any way to solve it , please clarify it here
Thank you sir …
The charts are usually cleaned up and adjusted for corporate action – this ensures you are looking at continuous data.
You mean to say that Do the calculations as per the Chart, instead of looking in to Split, Bonus and etc …. Just continue with the Chart Data … right ?
Yes, this is assuming that the chart you are looking at is adjusted for splits and bonus.
Hi Karthik, Sorry If I am not right on calculation… I thought to find Upper and Lower range for any stock for specified time period …
Example : TATASTEEL, CMP : 523, I am gonna find the next 10 days Upper and Lower range ,
1. Calculate Average Daily Returns ( say the variable \” ADR \” ).
2. Calculate SD ( It is already available in NSE , 1.85 ) .
3. Calculate 10 Days Average Daily Returns … ADR * 10 = \” 10 ADR % \” .
4. Calculate SD for 10 days …. 1.85 * SQRT ( 10 ) => 1.85 * 3.2 is \” 5.92% \” .
5. Upper Range => 10ADR + 5.92%, it refers to a variable \” UR \” and Lower Range => 10ADR – 5.92%, refers to a variable \” LR \”.
6. Upper and Lower Range Calculation, TATASTEEL CMP : 523 ,
523 * ( 1 + UR%) and 523 * ( 1- LR%) … Hope the calculation is Right …
Here is my question ,
1. Can we take the Daily Volatility from NSE itself, because it is FUTURES Standard Deviation ?
2. Instead of 10 days volatility calculation, can we use the same for 60 days for Short Term Investment ?
3. For any Calculation , do we need to refer minimum of past 1 years Data to get Average Daily return ?
4. If we are calculating next 10 Days Upper and Lower bands, 10 days may includes ( 7 Trading days and 3 Holidays ) … So the calculation should be in perfect 10 Trading Days , or 10 Days are general Specific ?
If I am doing Short term Trade for 2 months duration of 60 days , can we apply the same Strategy ?
Dear Karthik
Is this strategy is good for bank nifty weekly options
What is your opinion ?
You should give it a try 🙂
I am little bit confused here.
Confusion no 1: I do intaday trading in nifty future. On NSE website daily and annual volatilties are given. But as we know we need average volatility too to calculate following day\’s price deviations. But the problem is how to calculate the avg volatity. Well, we can calculate the avg volatility of the underlying (nifty 50 spot).
You can always the daily volatility and scale it to the desired timeframe. To do this, you need to multiply the volatility by square root of time.
The volatility stop loss is coming below the 3rd SD. Is this perfectly fine or calculation mistake?
Should be ok. If the SL is too deep and does not fit the risk reward frame work, then it may not really be a great trade to initiate.
sir,
which method do you use to short calls for nifty? Either you use sd method or you use option pain theory ? and which one is better and can help in making consistent profits.
I\’d probably combine both!
Hi Karthik,
it was very nice tutorial given today online but i missed some part.
can you put all calculation with same example of idea stock price?
i have doubt with range, upper lower range , SL , and reward calculation formulas.
i tried to refer video but its not available.
Please do the needful..
Regards
Thanks Hemant. Unfortunately we lost the video today. Will try and put this up again.
Topic \”volatility based stoploss\”
In RRR calculation do you this Reward should 22/10 2.2:1 after all we are entering at 395 not at 385 the real reward will start after 395
I guess I\’ve calculated the reward to risk ratio.
Hi Kartik,
The write ups have been really great and useful to a novice trader like me and am sure to a lot others.
Reading these gave me a lot insights about options trading. Keep up the good work.
I have few questions but will limit myself to 1 question on volatility for now.
I wanted to know how do we determine whether the volatility is high or low ? I mean is there a benchmark ? can we treat india vix as a benchmark when comparing individual stock\’s volatility ?
Thanks,
Varun
You can use ViX to benchmark Nifty. However, for individual stocks, you need to use their historical Vol and compare it with the present day IV.
i have calculated yes bank range for 1 sd taking into consideration 1 year back data. the upper range comes to rs 1764 and lower range comes to rs 1484. the spot price is 1546. how to trade in this scenario
Set up a short strangle ?
Hello Karthik,
First of all congratulations for developing a knack in teaching such complex (or confusing) subject in clear, concise, easy and interesting way. Zerodha varsity is till date the best material for traders have found so far…
I have One question, why range and stop-loss calculations are done in a different way?
e.g. In above examples, to select best possible strike rate, Nifty range for requested no. of days is calculated using daily average return and SD However the stop loss is calculated only using SD (volatility). Is there any reason or did i miss something?
Happy to hear that Arvind. Thanks for the kind words.
SL is more from a trade perspective, however strike selection is a pre trade condition, it helps you with the identification of the right strike which in turn leads to a trade.
[…] So the next time you place a stoploss make sure you check the ATR value to see if stoploss level is relevant. You may also want to read more about volatility and its application (including volatility based SL) – Click Here […]
Hi
Can we try to short most of the time on last day of option market every month….is it so?…..Can you give your opinion on this
Of course you can. You need to ensure you are not doing this with an ITM option. Please do read this – http://zerodha.com/z-connect/queries/stock-and-fo-queries/stt-options-nse-bse-mcx-sx
Hi Karthik
Thanks for sharing your great insight on Options. In fact, besides going through your module teaching, I am also picking up a few good points that you mention in the subsequent Q & A sessions of the respective chapter. One thing about volatility, .. after calculating the annualized volatility can I take that figure as the historical volatility of the stock/index and compare it with the IV of any particular strike to understand whether that particular IV is going high or low as compared to the annualized volatility.. thanks
You can do this for a quick back of the envelop comparison.
hiii,
nice strategy explanation ……. show us some strategies on indicators too……..
well i have one question ……..
1) how to know the movement of the option price with its future ……… say if nifty moves 100 points how much its otm ce or pe will move with it ?
thank you…
Will be touching upon these topics in the current ongoing module (module 9).
thanks karthik for your valuable inputs 🙂
Welcome!
Hi karthik,
First of all, thanks a lot for sharing all this valuable knowledge. Really appreciate the effort being put forward!!
Coming to my query, I tried putting into application the concepts being taught.
Did all the necessary calculations (mentioning below FYR)
NIFTY Spot- 8406
Daily vol- 0.8%
Daily Mean- 0%
Nifty range- 8242- 8568
The calculation is for the next 6 days and I have taken the data for the last 6 months.
My point is if I really go short on the nearest OTM call which is 8600, the premium bagged is considerably low( 2.45).
whereas in case of nearest OTM put, say 8250, the premium bagged is relatively high( 7.7).
1. Why is there a difference in the prices considering the spot to be much closer to OTM call than OTM put?
2. In this scenario, is it advisable to select a nearer OTM call or go in for shorting of multiple lots of the aforementioned OTM call?
Please give your necessary inputs.
Regards,
Mohit
1) This is where the market perception comes into play. Traders are fearful of a fall, hence a higher premium for puts. Also, just because they are fearful, markets need not fall. Markets have the knack of proving everyone wrong, when you least expect it to.
2) I would prefer shorting multiple lots of OTM calls.
Karthik, I don\’t know if this is the right trail to ask this query, but seeing the option chain I get a feeling the market would go bearish whereas on the contrary, moving averages suggest otherwise. Can u explain if this calls out for a neutral options strategy?
Directional neutral strategies are best when you lack the conviction on the direction….given the split minds you are in, it may make sense.
How about shorting option on expiry date. Plz explain the strategy as how to select OTM strike well before time?
You can in fact use the Volatility number and identify strikes which fall outside the 3SD and short them.
Hey man I have a very Novice question. I\’m having a hard time with these two terms \”Option Writing\” vs
\”Short Selling Call/Put Option\”. What I have in mind is – \”these two are completely different terms\”. And execution process of these terms are as follows,
(As per the example given in this module, the predicted Nifty range is between 8214 – 8818. So we decide to Write (or) Short Call Option at the strike of 8850 for Premium of Rs. 7.45 & the trade goes as excepted)
1) Option writing: Here we are creating a new 8850 call option contract. So in order to create this new contract we need a margin of 12,000 . And we collect a premium of Rs.186.25 from the buyer.
2) Short Selling Call Option: Now the 8850 call option is selling @Rs.7.45 in the market & we simply Short it (like shorting equity stocks in spot market) and hold the short position till expiery – since option positions can be kept for overnight unlike equity postions which should be squared off the same day. And on the expiery day we buy back the option for 0.50 paise, to square of our position (or just simply let it expire – since no STT is charged for Short positions). In this way we do not require a large margin like option writing. All we need is Rs.186.25 / lot. (This gives a insane return of 371%).
Am I right about the shorting concept (or) these two terms (Option writing & Option Shorting) are same and I simply misunderstood the whole concept. I don\’t know where I got this idea, but it just stuck in my mind & I\’m going goofy with
it, please help me out man.
Vignesh….both \’shorting an option\’ and \’writing an option\’ are essentially the same 🙂
I can tell you, \”Vignesh, I shorted an option\” or \”Vignesh, I wrote an option\”….it points to the same trade!
When you short/write an option, margins are blocked in your account….and the margins are released when you square off the short/written option position. You can choose the square off either on expiry or anytime before expiry.
Ah, thank you so much man. \”both ‘shorting an option’ and ‘writing an option’ are essentially the same\” – this is all I wanted to hear. I was searching for this in blogs & videos, and all I got is more Jargons. You know this guy \”Charles Bukowski\” he utter intense philosophy in simple words. Your whole module is like that – simple and straight to the point. Once again thank you Karthi.
Cheers, good luck, and happy trading 🙂
as per you calculation margin amount for shorting NIfty is 12000/- but it has been changed now and it would not give that much returns with the higher margins. Margin Required as on 30th Oct 2016. it is Rs. 47111/-.
I am giving an example with actual data.
on 21st Oct 2016. Nifty Ended at 8693.
if I short 8900 Strike call options I get 75 X 3.75 = Rs. 281.25
which is equivalent to 0.6%. if I do this for 12 months What I would get is 12 X 0.6 = 7.2%. which is less the National Savings Certificate, PPF and most FDs of Banks.
for 8800 Strike it comes 30% annual but with Higher risk.
So in this changed context in Margins requirements do you think it still makes any sense to shorting Nifty Options ?
Yes, margins have changed because the lot size has changed.
Returns and Risk go hand in hand, one cannot circumvent this.
Does implied volitality mentioned in daily reports of nse for options measure the daily volatility of the nifty?
Sort of.
Kartik, can we use the daily IV number provided by NSE to calculate SD?
Hmm, you can Pratik. No problem with it.
Hello Karthik Sir,
I am rather confused with the calculation in 18.1-i.e.- the range between which nifty is likely to trade within the next 16 days, i.e.-8462*(1+4.215%) and 8462*(1-2.920%). My question is can\’t we also calculate it like what has been shown in the previous chapter, under solution-1, where the nifty\’s CMP has been multiplied with the exponential of the 1 SD, eg. 8462*exponential(4.215%). I am unable to see why there is this difference.
I need to explain this, but for now I\’d suggest you stick to the exponential method.
Hi
1) For calculating NIFTY Expiry Range i am using the IV ATM put option which would then be divided by 3.47.
e.g., For current 8800 PUT option IV is 12.93 hence the range of 12.93/3.47 = +-3.72%.
How the above is different from the method taught by you ??
Amol, frankly I\’m not too familiar with the method you\’ve stated. I need more insight into that before making a comment.
hI Karthik
Thanks for the article. Can you please let us know how to calculate alpha and beta values for GARCH. Is there any online calculator GARCH.
Regards,
Praveen
I\’ve never really looked at online calculators for GRACH, if I find something good, will share the link.
Thanks Karthik. Can you please let us know how to identify alpha and beta values for GARCH
Are you talking about the parameters which capture the effect of market prices and the lag in the Garch(1,1) model?
I am looking for alpha and beta calculation (inputs) for Garch (1,1)
Praveen – Will try and get you this info soon.
” don’t like to short PUT options for the simple reason that panic spreads faster than greed. If there is panic in the market, the fall in market can be much quicker than you can imagine”.
I quoted your writings in this chapter. I am fully confused now. Selling put options is bullish trade isn’t it? When market falls put option writer will be in safer side isn’t ? Then how option seller will be in risk ?
When you sell puts, you will make money if market moves up and you will lose money when the market goes down.
\” don’t like to short PUT options for the simple reason that panic spreads faster than greed. If there is panic in the market, the fall in market can be much quicker than you can imagine\”.
I quoted your writings in this chapter. I am fully confused now. Selling put options is bullish trade isn\’t it? When market falls put option writer will be in safer side isn\’t ? Then how option seller will be in risk ?
When you sell puts, you will make money if market moves up and you will lose money when the market goes down.
Hi Karthik, I must say that your demonstration is absolutely phenomenal, I just have a query, im looking to buy RelCapital call as I\’m bullish on it, nse shows annual volatility as 22 and IV for OTM strikes are greaterthan 40, cleaely IV is more than double of historical volatility, so maybe i should holdon till IV comes below 30. Otherwise, decrease im volatility decreases option premium, also i should wait max for a week, after that, if I buy, theta will crush me. I\’m a very beginner, please throw some light if my understanding is correct.
If you feel the volatility is higher than usual then you should look at selling the option rather than buying it. As the volatility reduces and falls back to the range, the premium would decrease and you as a seller would profit from it.
Also, for the same reason you should avoid buying options when the volatility is high.
Sir, also in the above airtel example, the reward is calculated as Reward = 417 – 385 = 32. Should it not be 417 – 395? since we are entering the trade at 395? thanks.
It should be with reference to the entry price, I may have made a mistake, let me check
Sir, in the above AIRTEL example how did you arrive at the expected target to be 417. Please clarify. Thanks.
A target based S&R basis I guess.
Hey, Karthik. Your every article is institutional.
Haven\’t found any proper note in some points, want insightful pins of the following
1. Implied Volatility
2. Volatility Forecaster GARCH (1,1), GARCH (1,2)
Thank you.
Nil, check this one on IV/ViX – https://www.nseindia.com/content/indices/white_paper_IndiaVIX.pdf
Have not found any simple paper on Garch, will put it up when I find one!
Thanks, I was searching for VIX also and you made it easy.
But there\’s more, that how Implied Volatility is related to Option pricing and all others that do matter while trading F&O.
Implied Vols dictate the option premiums. The volatility input in B&S formula refers to the implied vol.
Hello Karthik, first of all, thanks to you for doing excellent job of educating people in a very simple manner. I have a Question. Why the entry price (395) was considered to calculate the volatility based stoploss for Airtel example. Is not it appropriate to consider the mean price over 1 year period? Which one to follow?
Entry could be based on any logic – in this case its assumed the entry is at 395. However the SL is based on volatility.
Hi Karthik,
Great work ! I have a alternate idea of calculating the volatility. Please correct me if I am wrong. My idea is , why use a tedious calculation of daily average return, SD etc.. Instead can we use cluster of Bollinger bands with 1SD, 2SD of the desired look back period and determine how the stock might swing above or below the average and write the options. Thanks.
I am really sorry that people have already spoken about this. kindly ignore.
No problem 🙂
Works perfectly well as BB is derived using SDs. Btw, the calculations are not tedious 🙂
Hi,
when should we calculate 1SD,2SD,3SD? from 1st day of the contract or any day while taking entry between expiry or from Resistance point when it is down trend or from support point when it is up trend?
Technically you can calculate this whenever you wish to, but its best when you do this at the point of taking a trade.
Hi Karthik – I used your excel and found the range for reliance as 913 to 1126 today. SO I was just checking the margin required to short Reliance 1120CE expiring on 26 may (Premium 4.2). And the calculator showed the margin as 62000. Is this correct?
If the calculator says so, then yes it must be 🙂
Can we use bollinger bands for knowing std. deviations. on charts? How much will be the probability if the std. deviation is 1.7?
Yes, in fact BB is based on SD.
hi karthik,
why always put option has high IV , several times i notice it how it is happen please explain….
Check the section on Volatility smile!
Hi, Do we consider the Current Market price is last days closing price or Price after the pre-market open session. I observed the Nifty is highly volatile during the pre-market open session. In that case how do we predict the Stop loss from the NFO day trading perspective?
Pre market is just wild speculation. I\’d suggest you look at eod data.
how to claculate daily avg? plz explain with an example…thnx
If you are using excel, just select the data array and run the function \’=Average()\’. That will give you the average.
hi, how to figure out whether volatility is going to increase or decrease
You can build volatility forecaster models for this. Popular models include GARCH(1,1), Garch (1,2) etc.
my calculations-
dail volatility 2.21
yearly volatility=42.21
nse site-
daily-2.62
yearly-50.11
so is this difference ok?
Yes, the difference could be due to various reasons – (1) Ln return vs simple return, (2) Spot data vs Futures data, (3) Day count convention etc.
Hi Karthik Sir,
Although you explained Implied Volatility pretty well, I could not understand practical use of it. I mean in the NSE option chain IV keep on increasing from ITM to OTM. Does that mean OTM with more Volatility should be avoided? so, what is a safe level of IV ? I have confusion which strike to choose using IV. kindly explain practical use for it….
IVs play an important role in determining which options/strategies to trade. All this distills down to one important fact – if the IVs are low and you expect the same to increase then try being net long as increase in IV is good for long option position. Likewise if you see that the volatility to be very high and you expect it to fall, then this is conducive for a short trade.
Dear Sir,
As your view (1) what could be High range of Implied volatality to sell an option( my guess is above 16) and what could be low range of Implied volatality to buy an option (my guess is below 15). And also kindly advise, at what range of VIX India volatality we can enter into a strategy.
Thanks & Regards,
R V N Sastry
This depends upon the individual stocks. For Nifty I would suggest you keep 22-25% (ViX) as high and about 13-15% as low.
sir, can I take ATR fig. from chartink.com. and fix STOP LOSSES.
Regards
Yup, you can. Alternatively you can use ATR on Kite – https://kite.zerodha.com/
sir what if daily returns turns out to be negative
i have calculated it for reliance communication for the past 1 year.
pls do clarify.? in that case how it will be affecting our calculation.
avg daily returns turns out to be -0.08%
It is quite possible, especially companies whose prices have come down considerably during the time frame you have selected.
sir,
thanks so much for the valuable information..sir i have a doubt today i am going to a intraday trade in nifty future and my buy price is 7783 and daily volatility of nifty is .78 and my sl will be = 7783-(7783*.78//100)=7722.2 am i right? daily volatility of nifty i got from nse website
Sarath – not sure what .78 means. Where did you get this information?
sir ,
i got the .78 from nse website please find the screenshot
Ah, sorry, I should have known where you got this from 🙂
Sir, In NSE web there are lower and upper price brands showing in stock quotes. how they are calculated. Is the same method adopted as explained in the above article.
Regards
These are price filters also called circuit limits as set by the exchanges. This is certainly based on volatility, but I\’m not sure about the formula that exchange uses to identify the exact limits for a given stock.
Hi Karthik,
I\’ve demo trade on nifty option at yesterday (02-12-2015). Finally, I got 60.75 rupees profit on investment of around 6000. But, the brokerage charge, 2 times pay-in fund transfer charges and other taxes and charges levied around 77. Totally I book loss from this trade 10.32 rupees and 2 time pay-in FT charges 20.32 rupees. After, that only i know about the brokerage calculation for option trading. I ask the query and gather the information about the brokerage from zerodha support team. They explain the brokerage via email.
Trade date Trade time Exchange Contract description Expiry date Type Quantity Rate
02-12-2015 10:34:25 NSE NIFTY15DEC8200CE 31-12-2015 B 75 40.00
02-12-2015 12:51:44 NSE NIFTY15DEC8200CE 31-12-2015 B 75 37.50
02-12-2015 13:12:11 NSE NIFTY15DEC8200CE 31-12-2015 S 150 39.20
Here one query again I buy nifty option, in case I sell nifty option what about the brokerage charges for option seller.
Below screen shot explain about option brokerage calculation for novice-option traders (like me).
Hi Karthik,
It\’s brokerage and charges about Zerodha. Any link and query forum about option brokerage calculator on z-connect or tradingqna, if yes please give the link.
Maybe you should try this – https://zerodha.com/brokerage-calculator
If you are trading with Zerodha, then I would suggest you write to our support team – support at zerodha dot com.
sir
\”These numbers will help us calculate the upper and lower range within which Nifty is likely to trade over the next 16 days –
Upper Range = 16 day Average + 16 day SD
= 0.65% + 3.567%
= 4.215%, to get the upper range number –
= 8462 * (1+4.215%) \” in previous chapter you made use of Exponential function\”
= 8818
Lower Range = 16 day Average – 16 day SD
= 0.65% – 3.567%
= 2.920% to get the lower range number –
= 8462 * (1 – 2.920%) \” here also exponential function
= 8214\”
if we use exponential function we are getting different answer , please explain what to use and why it is to be added or subtracted from 1 as in previous chapter Volatility & Normal Distribution and in WIPRO explanation you have used the exponential as
Upper Range
= 8337 *exponential (26.66%)
= 10841
And for lower range –
= 8337 * exponential (-6.95%)
= 7777
If you use simple returns while calculating the daily average then you need to subtract 1. However if you use log return to calculate the daily return then you need to use the exponential function to convert it to simple return.
sir, thanks a lot.
Regards
how to calculate the daily average return sir i can calculate all the above things like sd,daily volatility, annaul volatility but how to calculate daily average sir ?
Calculate the daily return for all the days, and then take an average of that!
Sir, Will you please explain how to look into ATR. I have read on your link once but not noted the contents of that. can u give the link if time and space doesn\’t permit here.
Regards
Here is a 10 point note on ATR –
1) Average True Range (ATR) is an extension of True Range concept
2) ATR is not upper or lower bound, hence can take any value
3) ATR is stock price specific, hence for Stock 1 ATR can be in the range of 1.2 and Stock 2 ATR could be in the range of 150
4) ATR attempts to measure the volatility situation and not really the direction of the prices
5) ATR is used to identify stop loss as well
6) If the ATR of a stock is 48, then it means that on average the stock is likely to move 48 points either ways up or down. You can add this to the current day’s range to estimate the day’s range. For example the stock price is 1320, then the stock is likely to trade between 1320 – 48 = 1272 and 1320 + 48 = 1368
7) If the ATR for the next day decreases to say 40, then it means that the volatility is decreasing, and so is the expected range for the day
8) It is best to use ATR to identify the volatility based SL while trading. Assume you have initiated a long trade on the stock at 1325, then your SL should be at least 1272 or below since the ATR is 48
9) Likewise if you have initiated a short at 1320, then your stoploss should be at least 1368 or above
10) If these SL levels are outside your risk to reward appetite, the its best to avoid such trade.
Sir, Can I take Daily Volatile figure from NSE web site under Derivatives quote. Thanks
Yes, you can. No problem with that.
Dear Sir, Which is the better method to put stop loss for Swing and Futures trading. Is volatility method explained above is suits or S&R. Can we fix based on Open Interest Writers.
I have lost max amount of money due to poor strategy in fixing SL though my number of trades are winners than losers. Regards
I would suggest you combine volatility method along with S&R…if you find volatility difficult to calculate you can use ATR as well.
Dear Mr. Karthik,
Thank a lot for your guidance.
Dear Mr. Karthik,
I have tried to find out nifty range to short for the month of Nov\’15. Request you to kindly check and suggest :
• Date = 19th Nov 2015
• Number of days for expiry = 6 days
• Nifty current market price = 7842 (Closing price 19.11.15)
• Daily Average Return = 0.026%
Calculation for Daily Return = (DATA TAKEN FOR LAST 6 DAYS ONLY SINCE 6 DAYS LEFT FOR EXPIRTY – IS IT OK??? or should be more days)
13-Nov-15 7762.25 RETURN
16-Nov-15 7806.6 0.005697289 (=LN(B3/B2)) FORMULA
17-Nov-15 7837.55 0.003956756
18-Nov-15 7731.8 -0.013584591
19-Nov-15 7842.75 0.014247844
Daily average return =average(0.005697289,0.003956756,-0.013584591,0.014247844)
Daily average return = 0.002579324
Daily % average return = 0.26%
Daily SD =stdev(0.005697289,0.003956756,-0.013584591,0.014247844)
Daily SD = 0.011676836
Daily SD % = 1.17%
6 day SD = Daily SD *SQRT (6)
= 0.1.17% * SQRT (6)
= 2.86
6 day average = Daily Avg * 6
= 0.26% * 6 = 1.55%
Upper Range = 6 day Average + 6 day SD
= 1.55% + 2.86%
= 4.41%, to get the upper range number –
= 7842 * (1+4.41%)
= 8187
Lower Range = 6 day Average – 6 day SD
= 1.55% – 2.86%
= 1.31% to get the lower range number –
= 7842 * (1 – 1.31%)
= 7739
Nifty is likely to trade anywhere in the region of 7739 to 8187.
We can short 8200 Call or 7700 Put but best is 8200 call (Premium 2.45)
Kindly check and suggest wherever correction required.
dear Lalitdimple,
great job … just wanted to ask why not short put 7700 ? the price on 18th closing was 14.5 for 7700CE Put Vs 8200 call at 2.30. As on 20th closing the values for 8200 call is 1.15 & 7700 put is 8.70?
Dear Nitin : your expert advice !!!!
just to tell you though i had several options of trading but i have opted for Zerodha and am very happy with the services and it is all because of you. keep up the good job…
Dear Mr. Kumar,
I have gone step by step as per guidance of Mr. Karthik.
He has advised to not short PUT options, although premium is high. On 19th market rose by 105pt so PUT price has gone down. I also thought when saw premium of 1.15, which is of no use.
But the best answer can be given by Mr. Karthik only.
I request for his intervention.
Lalit / Kumar – remember panic spreads faster than greed in markets. So after you write the PUT option, in case panic grips the market (we cannot really predict this) the price you pay will be quite high. Hence I would advice not to write PUT options.
Your calculations are right, but use at least 6 months data to calculate the daily average and SD.
Sir, Is it advisable to adopt Bollinger Band Strategy, going long ATM CE at the bottom of bollinger band when we see a bullish candle and short at the top with a bearish candle i.e buying ATM put.
Regards
Sir, Is it advisable to adopt Bollinger Band Strategy, going long ATM CE at the bottom of bollinger band when we see a bullish candle and short at the top with a bearish candle i.e buying ATM put.
Regards
You could give it a shot, worth the efforts I suppose. Make sure you paper trade it before implementing it. Few things to keep in mind –
1) Do not buy options when there are just few days to expiry
2) Stick to ATM or strikes that are few marks away from ATM
3) If the price sticks near the upper or lower band for a long time, maybe the bands are expanding…so make sure you cut the position.
Thanks for this post , things become so clear. However , I would like you to elaborate on identifying the correct strikes that fall within 1SD when I am buying and not writing an option ? Should we consider the IV or should we consider price difference between the theoretical and market price ?
Sorry, can you please elaborate a bit more? Not able to understand your query. Thanks.
I wanted to know the correct method to identify a strike price when I am buying a NIFTY option among various strikes that fall within 1 Standard deviation of NIFTY
When you buy options you need to ensure that there is ample time to expiry, check this – http://zerodha.com/varsity/chapter/re-introducing-call-put-options/
SD theory works best for options writing. For buying I would suggest you stick to ATM or maximum 2 strikes away from ATM.
Yes, Thanks things are much more clear.Eagerly waiting for the modules on options strategy
Sure, the first chapter is already out…working on the 2nd chapter.
NSE daily volatility is SD.What we need is daily average returns to calculate ranges.Is it right.If yes,how to calculate log returns of daily returns.
Its explained in the excel. Request you to kindly go through it.
Karthik,
Please read this blog. We can use VIX for annualised volatility,right. Kindly give your valuable insight.
http://www.indexologyblog.com/2013/10/18/turn-vix-into-information-you-can-use/
We can Sandeep, best served as an approximation. Will go through the link, thanks.
Short and sleep far OTM CE strikes.Intrinsic value becomes zero by expiry.Uncle Theta also helps us.This strategy working since 3 months for me.Short after 2nd week.OI concentration should give rough picture where Nifty ends.
Good luck Sandeep!
Dear Sir,
Is it correct to sell nifty options at higher iv above 18 and buy simultaneously at lower range @ 15. Please advise. Thanking you very much Sir. R V N Sastry
Sure, it does makes sense from \”volatility\” perspective.
Dear Sir,
I would request you to kindly advise whether
( 1 ) the STANDARD DEVIATION Of AVERAGE OF DAILY RETURN is equivalent to DAILY VOLATALITY and if how many days average of daily return is most suitable to calculate STANDARD DEVIATION PRICE RANGE. (2) And also please advise me whether the daily volatality shown in NSE site or Daily volatality arrived by us is more accurate to calculate STANDARD DEVIATION PRICE RANGE. I am very grateful if you can kindly respond and advise me in this matter. Thanking you very much , Best Regards, R V N Sastry
1) The SD is calculated on daily return. Do look into at least last 1 year data.
2) Please do give more preference to NSE\’s SD calculation, although both our calculations should match.
Dear Sir,
Can You please inform in the following formula which is correct :
(1) To calculate as per 1SD intraday price range –
Price*daily volatality*sqrt(1)/sqrt(365) (or)
price*annual volatality*sqrt(1)/sqrt(365) and for positional also can I take the same by inserting number of days to hold. I will be grateful if you can advise. Thanks & Best Regards, R V N Sastry
Dear Sir,
Can You please inform in the following formula which is correct :
(1) To calculate intraday price range –
Price*daily volatality*sqrt(1)/sqrt(365) (or)
price*annual volatality*sqrt(1)/sqrt(365) and for positional also can I take the same by inserting number of days to hold. I will be grateful if you can advise. Thanks & Best Regards, R V N Sastry
Daily Vol * Sqrt of time
So if time is 10 days, then
Daily Vol *Sqrt (10).
Hi Karthik, can you please address open interest(OI) at some point. Thanks. I also have a recommendation for the people out here to please try the NSE paathsala, before we get into the real market to try the option strategies.
Check this for open interest – http://zerodha.com/varsity/chapter/open-interest/
Hi Karthik,
We have long weekend , and suppose i am estimating price of Reliance capital for 30/09/2015, in this case, would number of days include holidays and hence 6
or exclude holiday and become 3
Regards,
MSP
Do take the calendar number of days…so in this case it would be 6.
Hi Karthik,
You and your team is doing splendid task for the country. I have followed many books , many veterans interview, some books, however the kind of clarity and knowledge you are sharing is priceless.
Thanks is not the word enough for you guys.
Thank you so much for these kind words. We are working towards delivering high quality content regularly…please do stay tuned.
Hi karthik, the Daily volatility of Banknifty as per the nse site is 2.10 %. now, using this to place a stop loss for options of a particular strike price, we deduct the DV from the price of entry in case of a call and add in case of a put. is that correct? thanks.
Ahh…this is a bit tricky. Best is to use the volatility to place SL in direction trades employing Futures or stocks. Suggest you dont use this technique for options.
ok. thanks for that karthik. then how do you suggest a SL be placed in an option trade?
In most cases its best to place a SL based on the underlying and not really on option prices.
No, its wrong I sqrt volatility instead of days.
It must be like this
{2.59* (sqrt7)}%
1371+(2.59*2.65)%
1371+6.85%
=1464.91 (+93)
1371-6.85%
=1277 (-94)
R:R ~1:1
am I right ?
Thanks.
Calculations are right, however the RR depends on the target…and target should not be entry + volatility scaled ti required time. It should come to you by some other means…for example it could come for resistance levels.
Hi Karthik ,
Attaching eod chart of AppolloHosp with DarkCloud formation .
I have used daily volatility from nse site.
Holding period we consider are calendar days or should be trading sessions ?
Thanks.
Calendar days which includes weekdays and holidays.
Thanks for helping us download the excel sheet which you have painstakingly worked on,it clears out any ambiquity.Can you please cover topic on OPTION PAIN .Waiting for the strategy for scenarios like the one witnessed on 24Aug15
Yes, will discuss about Option Pain in the next module i.e Options strategies.
gotcha….apologies karthik. i guess we were using the link you provided earlier to get the historical data for stocks, not realizing that the indices link to get historical data is different…appreciate your patience.
Cheers.
Hi karthik, i tried getting the data for bank nifty through the NSE website for the last year. i too got \”No RECORDS\”. and yes, i did give the date strings as 31 aug 2014 to 30 aug 2015.
Seems to be working for me Madhu – I selected the dates between 31st Aug 2014 t0 28th Aug 2015 – http://www.nseindia.com/products/content/equities/indices/historical_index_data.htm
I have observed that at some particular occasion both the premium of the CALL and PUT option will decrease at the same time .usually if the call option is loosing then PUT option will gain right .
The Occasion which I experience last year was the next day of the TCS declaration of quarter results . on this date both the call and put looses the premium value..why this will happen can you explain ?
Thanks in Advance
This is because of the increase in volatility…Chapter 19 (will upload this week) explains this in greater detail. Please do stay tuned for more info.
Hi Karthik,
Thank you for very good introduction on Option Theory. I went through all of them over a weekend sitting. 🙂
In your explanations, you have noted that you mostly do trade in Nifty, Bank nifty , and a handful of stocks like Infy etc. Although at the outset, volume , liquidity of stock are important in selecting stock for derivative trading, are there other important factors?
Also do certain stock lend well to certain investors, which can only be determined by actual experience over time.
i.e. Each investor should discover their own set of stocks to trade in?
Because of your long term tracking of stocks like Infosys, SBI , Reliance etc, have you not gained insight into their positional and long term behaviour ? In such a case, is quant more reliable, or gut-feel based on long term observations better?
Thanks
Harsha
Wow! did you actually read through the entire module ? Thanks and i hope you found the module helpful!
The main reason why I prefer to trade these stocks is because the liquidity is high in these stocks and therefore the impact cost – you can read more about impact cost here – http://zerodha.com/varsity/chapter/nifty-futures/ , refer section 9.2.
Of course knowing your stocks and their regular movements well adds to the comfort.
Hi Karthik,
First of all, thanks for the amazing materials that you have here. I\’m a great fan. 🙂
I had a question regarding the instruments that you are trading (which you mentioned in this chapter). SBI, Infosys, Tata Steel, Tata Motors etc. Is it safe to consider that the most active stocks on a particular day in NSE are the most liquid stocks?
The main reason why I\’m asking this is because I have been trading (and making losses) by investing in around 12-15 stocks and not being able to give attention to all. I want to shortlist 5-6 quality stocks and trade only those instruments.
BTW, its been 3+ years since you wrote this chapter. Does your list still stand without any changes? Just curious.
Many thanks,
Anoop
Thanks for the kind words, Anoop.
Liquidity in the market still is the same, so the list holds: 😉
Hello Karthik, very informative chapters.
Just had one doubt.In previous chapter, for calculating upper and lower range, we used the following formula
[
Upper Range
= 8337 *exponential (26.66%)
= 10841]
i.e. We took exponential. But in this chapter, we used [ 8462 * (1+4.215%) ] i.e. Upper Range = CMP * (1+R)
Can you please explain the difference in calculation method.
Thanks
When you take log percentage, its important to convert the same back to the regular % scale. In the 1st method we are directly doing it, in the 2nd weare splitting it over 2 steps….both are essentially the same. Suggest you stick to the 2nd method.
Hi Karthik,
I am not getting NIFTY data for previous years from NSE website,
Any suggestion?
Have you tried clicking the \”Select a Time Period\” option and entering the required dates?
Yes i have done that. Still same issue. It shows \’No Record\’.
Just make sure the number of days is less than 365.
Dear Karthik Sir,
All the chapters on Option theory Module are that very very useful and easy to understand. Thank you so much for your whole team for this knowledge initiative. Can you suggest some good books on option trading strategy for practical trading purpose? When you will release the 6th module -Option strategies? eagarly waiting for the same.
Thanks.
S.Lawrence
Thanks Lawrence. Will start the options strategy module by next month. Check out Natenberg\’s book on Option price and volatility.
hi karthik, in one of the questions above regarding placing of stop loss using the volatility method on intra day trades, you have said this method works for positional trades only. whats the method then to place SL on intra day trades?
You can sort of do the same for intraday trading Raj. Its just that while doing intraday trades, you only take the average daily volatility as it is and not multiply it with any square root factor.
So, you first calculate the daily returns, and then using the =STDEV () function calculate daily volatility. or, you can also use the daily volatility figure mentioned on NSE. then, how do we arrive at average daily volatility?
So we first calculate the daily returns and using the =STDEV() function arrive at daily volatility. or we can use the daily volatility of a stock published on NSE. then, how do we calculate average daily volatility?
STDEV() of daily returns will give you the daily volatility. This you can scale according to the timeframe required. NSE gives you the daily volatility which again can be used. So calculate the daily vol, and then use the STDEV() function.
Karthik , you have replied( So calculate the daily vol, and then use the STDEV() function.)…but, to calculate daily vol we use the STDEV function….what do we do next to calculate average daily volatility?
Average Daily Volatility is same as the daily volatility that you calculate by applying STDEV() function on the daily returns.
Karthik,
How do we judge what is a very high IV environment for an Index (Nifty)? Do we compare it to Historical volatility? i.e Can we say we are in a high IV environment if
1) IV of a strike is > Historical IV
2) IV of a strike is > by \”X\” % of Historical IV
3) VIX is above 10 ema or any such measure?
4) IV is greater than 25% (considering normal IV is observed to be between 15-20%)
What i am trying to evaluate is what can be considered steady state or normal IV and what can be considered volatile or high IV environment
-Prashant
Prashath – It makes no sense to apply technical stuff on ViX and option charts, these are different animals altogether. So this eliminates option 3.
Option 1, 2, and 4 makes sense…I\’d consider IV as high/low if it varies 20% wrt to historical IV.
Dear Karthik,
Today, for the 1st time I bought 25 put option at strike 8000 with premium 112 and I sold them at premium 103. Whether I am getting profit or I am incurring loss. Because my position at Zerodha is showing -217.
It is a loss Prasad. Your buy price is 112 and sell price is 103, so you have lost 9 points on this trade. Good luck for your future trades.
Sir,
What to do in such a volatile market as it was today on August 24, 2015. BSE down > 1600 ans NSE down almost 500 points. Now eagerly waiting not only for next chapter on volatility but also for Option strategies. It must be first time such a big crash in a day?
No, such crashes have happened earlier as well. Hope to come out with the strategies as soon as possible.
Dear Karthik,
I had just done a beginner course in Nifty options and found it very interesting. In Options, one can gain huge profits both side, if the Nifty goes up or down because in Nifty there is much liquidity and less manipulation. Slowly and steadily, I want to move out of equity and to major extent turned into Nifty Options day trading and position trading. I am finding it hard to know and get good books on options for extra studies and looking at your explanations, I think u r the right person, who can help me out in this regard. I also want to turn into full time trader and investor in future in options. Please help me out. Regards.
Good luck Prasad, I would suggest you read through all option chapters before you start your venture into Option. I\’m sure this will be a good place to start.
Hi Karthik, Thanks a ton for demystifying the options greeks in such a logical manner. One doubt on the above article. In the Nifty example you calculated the Range for 16 Days as 8818 on the upper side (which is 356 away from current) and 8214 on the lower side, (which is 248 away from current), why the range is more larger on the upper side and less on the lower side, as you said falls are more steep than rise, so bit confused with this calculation. I too calculated for different time ranges and got similar results, always upper range was more compared to lower. Please throw some light.
Suresh this is because the average value is a +ve number. If the average was 0 (or close to zeor) we would have a symmetrical distribution.
Dear Karthik Sir,
In the note of step 4, the volatility for 10 days given as 3.01*SQRT of 10. How the 3.01 is arrived?. Please clarify.
Thanks.
S.Lawrence
Lawrence…thx so much. Its a typo…..it should read 1.6*Sqrt(10).
Dear Karthik Sir,
How to calculate the volatility based SL for intraday trade using 5 mts chart? ( For 8300CE Nifty Option)
Thanks.
S.Lawrence
Lawrence the volatility based SL is best applied to positional trades. Do no use charts for option trades.
right karthik, so what you are saying is 1 sd away means, you are 68% sure that all strike prices above 8818 will expire worthless and the premium can be pocketed. i.e if you short/sell them.
Bingo! If you want more accuracy then you will have to consider 2SD or 3SD. But do remember higher the SD, lower the premium collected.
If I were to personally select a strike today it would be either 8850 or 8900 or probably both and collect Rs.7.45 and Rs.4.85 in premium respectively. The reason to select these strikes is simple – I see an acceptable balance between risk (1 SD away) and reward (7.45 or 4.85 per lot)…..karthik, what do you mean by 1 SD away? here 1SD is 3.567%..so how does choosing a strike of 8850 or 8900 effect the SD? secondly if i was a call buyer how would i select the strike price between 8214 and 8818 ?. i know that nifty will swing between this range, but how do i select the most profitable strike price within the range, as the swing is 604(8818-8214) points? what it definitely tells me is not to chose a strike price above 8818. kindly advice. thanks.
Madhu – SD represents risk. So when I say 1 SD away I\’m talking about a confidence level of 68%. I guess this chapter will give you more clarity – http://zerodha.com/varsity/chapter/volatility-normal-distribution/ .
In most of the cases buying ATM option makes sense. I will be reasoning as to why this makes sense in subsequent chapters.
Volatility, Implied volatility, market volatility, statistical volatility, seems to be confusing. If some event has to happen then also \”volatility\” increases and affects the option price, how? I don not know if my questions are silly one.
Your question is extremely valid – in fact the next chapter will is about this topic only 🙂
Yet another great article, Karthik…..One question….If i am looking for a very short term trade (3-5 days) , what is the ideal data time range required for calculating daily volatility? Do i need to calculate it based on closing data for the past 1 year or can it be 1 month, 10 days or some such range?
Thanks Prashant.
I would suggest you use the last 6 months data for very short term trading.
Good approach for stop loss. If we are increasing the SL limit then the exposure shall be reduce to limit the total loss per trade to a acceptable level. right, then it will limit the profit also. My another point is that normally it said that ATR (Average True Range) is also related with the volatility. Can it be correlated to the ATR to reduce the calculation time but get the same result.
My one more point is that what will be the impact of variation in the one day price movement on the volatility as about 300 old data are considered. Its effect may be less will be less.
Yes, hence I\’ve said that before taking a trade your Reward to Risk ratio should be satisfactory. ATR is not really volatility in terms of \”Standard Deviation\”….for this reason I don\’t prefer using ATR.
If the movement of that 1 day is significant, then it will have the impact to change the volatility of the last 300 days. So better to include all data points.
Sir, till I read your above article, I think and relate ATR based stop-loss with Volatility stop loss, not only your above article teach us new , other and more correct vol base stop-loss but also teach us how to use it with different time frame, also learner how to calculate different time frame volatility by using daily vol and vice versa…. Thanks again sir, always eagerly waiting your new chapter…
Happy to note that, Ganesh!
Btw, all the chapters wrt to options are already out there. We are currently working on trading systems – https://zerodha.com/varsity/module/trading-systems/
Hi karthik, how does one select the strike price if you are a call option buyer based on the formula you have followed? the e.g are for option writers only. in the bharti airtel e.g above, you have mentioned: [ Note : In case our expected holding period is 10 days, then the 10 day volatility would be 3.01*sqrt(10) so on and so forth]. The daily volatility you have calculated is 1.8% so shouldn\’t it be as 1.8%*sqrt(10) ?
I usually use this approach to write options (I\’m mostly an option seller as opposed to buyer), I will discuss a bit more on option buying in subsequent chapters.
You are right on the 10 day volatility calculation of Airtel.
\”Then we are talking about a return of over 18% annualized just by means of option writing.\” — Man that such an eye opener 🙂 especially for me after loosing tons of money in attempt to be overnight billionaire :). Have few questions
1) If we short a option and 12k is deducted as margin and market goes against me, the at what point does my 12k margin gets exhausted and my position is squared off? –I understand this is worst style of trading, but just want to know for information sake
2) Do you change the entry time if there is holiday in expiry week? say if Monday is off in expiry week would you take position on close of Thursday instead of Friday?
3) And I am 3rd SD sure (99.7% sure) that everyone reading this chapter is curious to know the 4 MF and 12 stocks you invest in 🙂
The key to success in short term trading (at least in my limited experience) is to achieve small but consistent returns…and keep adding them up 🙂
1) If you deposit 12k as margins and short options, then you will have to make sure that this margin amount does not get blown off. You will have to pull the trigger and get out before this happens. Usually this happens when you write OTM option and that option transitions into an ITM option…during this whole transition process your 12k will vaporize.
2) The idea is to write options when there are about 6 days to expiry. But yeah, if there is a holiday then I would not mind shifting 1 more day.
3) Here are the 4 MF\’s – HDFC Tax saver, Kotak Select 50, Sundaram Select Mid Cap, and ICICI Prudential bluechip equity fund. I\’ve been doing a SIP on these since 2006! …. I\’ll keep the stocks for another day 🙂
thanks much for your reply mate, very helpful 🙂 on more question that I should have asked before today..but will help for next expiry, if we plan to take position during close of Market on Friday before expiry , should we consider current Market price instead of yesterdays closing ? for example yesterdays closing is 100 points more than CMP of nifty 8268 so If I did calculation in morning with yesterdays close price, I would short 8600 CE, but as per current calculation I have virtually shorted 8500 CE at 8.45…lets see what I get on expiry 🙂
It does makes sense to consider the current market price rather than previous close. Good luck for the virtual short 🙂
Virtual profit of 8.40 rs per lot 🙂 of course the 500 points fall was main reason
And I hope you got the reasoning behind why you should not be writing Put options 🙂
\”And I hope you got the reasoning behind why you should not be writing Put option\” — Totally 🙂
🙂
What a superb explation you have given with all the reasoning for your own strategy. however i have few minor doubts.
1) Sd you have taught us in last chapters, from where you got \”Daily Average Return = 0.04%\”
2) your calculated Daily SD = 0.89% while mine is around 0.97% (by applying formula given by you earlier)
3) Since you will be writing call option on 21st i.e. last friday before the expiry, can you not calculate upper & range range for only next six days? by which your range may vary and may get a chance to pocket more premium?
4) Will it be a good strategy to buy ITM options (call/put, according to trend) in the first half /quarter of any month and write only OTM call options on the last friday before the expiry?
Shreya, here are my answers –
1) Daily average is the \’Average of the daily returns of Nifty\’. For daily return I have calculated the log return and not simple return.
2) This could be because of two reasons – data period could be different ( my data if from 12th Aug 2014 to 10th Aug 2015) or you may not be taking the log returns. In fact the same is applicable to your 1st query as well.
3) In fact this is exactly what you are supposed to do. In the explanation the number of days is 16, hence I\’ve done the math around that time frame.
4) In one of the subsequent chapters I will talking about which strike to select given the number of days to expiry. That will help you select strike better.
Hey! Such awesomeness from you.
I have a doubt regarding the number of days, aren\’t we supposed to exclude non-trading days while calculating the annual deviation?
This depends on the day count convention. Some prefer 252 while others take in 365 days.
Thanks Karthick!
One ore thing, in the last chapter we took exponential to calculate the ranges, but here I could see that they are straight away calculated in % terms. Am I missing something?
Hmmm, let me check this up.
We can find the daily volatility return in the daily volatility file available at the nse website but how do to we know the daily average return for the nifty. The same file shows the log return but it is only comparing the previous day and current day difference as average return..
You can always download this data and quickly calculate this on excel by using the \’=average()\’, function.
Amazing ,only one thing to say for Karthik Sir :Aur Dikhao Aur Dikhao :=)
Next week another show 🙂
Does this stoploss calculation with respect to volatility also apply to Call/Put options?
or Do we have to factor the greeks
Vaibhav, the SL on options is best derived based on the spot value.