13.1 – The Curvature
We now know for a fact that the Delta of an option is a variable, as it constantly changes its value relative to the change in the underlying. Let me repost the graph of the delta’s movement here –
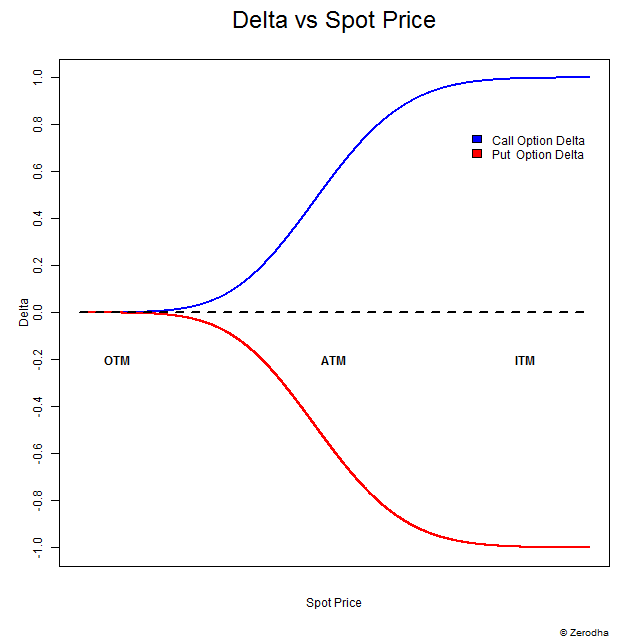
If you look at the blue line representing the delta of a call option, it is quite clear that it traverses between 0 and 1 or maybe from 1 to 0 as the situation would demand. Similar observations can be made on the red line representing the put option’s delta (except the value changes between 0 to -1). This graph reemphasizes what we already know, i.e. the delta is a variable, and it changes all the time. Given this, the question that one needs to answer is –
- I know the delta changes, but why should I care about it?
- If the change in delta really matters, how do I estimate the likely change in the delta?
We will talk about the 2nd question first as I’m reasonably certain the answer to the first question will reveal itself as we progress through this chapter.
As introduced in the previous chapter, ‘The Gamma’ (2nd order derivative of premium) also referred to as the curvature of the option gives the rate at which the option’s delta changes as the underlying changes. The gamma is usually expressed in deltas gained or lost per one-point change in the underlying – with the delta increasing by the amount of the gamma when the underlying rises and falls by the amount of the gamma when the underlying falls.
For example consider this –
- Nifty Spot = 8326
- Strike = 8400
- Option type = CE
- Moneyness of Option = Slightly OTM
- Premium = Rs.26/-
- Delta = 0.3
- Gamma = 0.0025
- Change in Spot = 70 points
- New Spot price = 8326 + 70 = 8396
- New Premium =??
- New Delta =??
- New moneyness =??
Let’s figure this out –
- Change in Premium = Delta * change in spot i.e 0.3 * 70 = 21
- New premium = 21 + 26 = 47
- Rate of change of delta = 0.0025 units for every 1 point change in underlying
- Change in delta = Gamma * Change in underlying i.e 0.0025*70 = 0.175
- New Delta = Old Delta + Change in Delta i.e 0.3 + 0.175 = 0.475
- New Moneyness = ATM
When Nifty moves from 8326 to 8396, the 8400 CE premium changed from Rs.26 to Rs.47, and along with this the Delta changed from 0.3 to 0.475.
Notice with the change of 70 points, the option transitions from slightly OTM to ATM option. Which means the option’s delta has to change from 0.3 to somewhere close to 0.5. This is exactly what’s happening here.
Further, let us assume Nifty moves up another 70 points from 8396; let us see what happens with the 8400 CE option –
- Old spot = 8396
- New spot value = 8396 + 70 = 8466
- Old Premium = 47
- Old Delta = 0.475
- Change in Premium = 0.475 * 70 = 33.25
- New Premium = 47 + 33.25 = 80.25
- New moneyness = ITM (hence delta should be higher than 0.5)
- Change in delta =0.0025 * 70 = 0.175
- New Delta = 0.475 + 0.175 = 0.65
Let’s take this forward a little further, now assume Nifty falls by 50 points, let us see what happens with the 8400 CE option –
- Old spot = 8466
- New spot value = 8466 – 50 = 8416
- Old Premium = 80.25
- Old Delta = 0.65
- Change in Premium = 0.65 *(50) = – 32.5
- New Premium = 80.25 – 32. 5 = 47.75
- New moneyness = slightly ITM (hence delta should be higher than 0.5)
- Change in delta = 0.0025 * (50) = – 0.125
- New Delta = 0.65 – 0.125 = 0.525
Notice how well the delta transitions and adheres to the delta value rules we discussed in the earlier chapters. Also, you may wonder why the Gamma value is kept constant in the above examples. Well, in reality, the Gamma also changes with the change in the underlying. This change in Gamma due to changes in underlying is captured by 3rd derivative of underlying called “Speed” or “Gamma of Gamma” or “DgammaDspot”. For all practical purposes, it is not necessary to get into the discussion of Speed, unless you are mathematically inclined or you work for an Investment Bank where the trading book risk can run into several $ Millions.
Unlike the delta, the Gamma is always a positive number for both Call and Put Option. Therefore when a trader is long options (both Calls and Puts), the trader is considered ‘Long Gamma’, and when he is short options (both calls and puts) he is considered ‘Short Gamma’.
For example, consider this – The Gamma of an ATM Put option is 0.004, if the underlying moves 10 points, what do you think the new delta is?
Before you proceed, I would suggest you spend a few minutes to think about the solution for the above.
Here is the solution – Since we are talking about an ATM Put option, the Delta must be around – 0.5. Remember Put options have a –ve Delta. Gamma, as you notice, is a positive number, i.e. +0.004. The underlying moves by 10 points without specifying the direction, so let us figure out what happens in both cases.
Case 1 – Underlying moves up by 10 points
- Delta = – 0.5
- Gamma = 0.004
- Change in underlying = 10 points
- Change in Delta = Gamma * Change in underlying = 0.004 * 10 = 0.04
- New Delta = We know the Put option loses delta when underlying increases, hence – 0.5 + 0.04 = – 0.46
Case 2 – Underlying goes down by 10 points
- Delta = – 0.5
- Gamma = 0.004
- Change in underlying = – 10 points
- Change in Delta = Gamma * Change in underlying = 0.004 * – 10 = – 0.04
- New Delta = We know the Put option gains delta when underlying goes down, hence – 0.5 + (-0.04) = – 0.54
Now, here is a trick question for you – In the earlier chapters, we had discussed that the Delta of the Futures contract is always 1, so what do you think the gamma of the Futures contract is? Please leave your answers in the comment box below :).
13.2 – Estimating Risk using Gamma
I know many traders define their risk limits while trading. Here is what I mean by a risk limit – for example, the trader may have a capital of Rs.300,000/- in his trading account. Margin required for each Nifty Futures is approximately Rs.16,500/-. Do note you can use Zerodha’s SPAN calculator to figure out the margin required for any F&O contract. So considering the margin and the M2M margin required, the trader may decide at any point he may not want to exceed holding more than 5 Nifty Futures contracts, thus defining his risk limits, this seems fair enough and works really well while trading futures.
But does the same logic work while trading options? Let’s figure out if it is the right way to think about risk while trading options.
Here is a situation –
- Number of lots traded = 10 lots (Note – 10 lots of ATM contracts with a delta of 0.5 each is equivalent to 5 Futures contract)
- Option = 8400 CE
- Spot = 8405
- Delta = 0.5
- Gamma = 0.005
- Position = Short
The trader is short 10 lots of Nifty 8400 Call Option; this means the trader is within his risk boundary. Recall the discussion we had in the Delta chapter about adding up the delta. We can essentially add up the deltas to get the overall delta of the position. Also, each delta of 1 represents 1 lot of the underlying. So we will keep this in perspective, and we can figure out the overall position’s delta.
- Delta = 0.5
- Number of lots = 10
- Position Delta = 10 * 0.5 = 5
So from the overall delta perspective, the trader is within his risk boundary of trading not more than 5 Futures lots. Also, do note since the trader is short options, he is essentially short gamma.
The position’s delta of 5 indicates that the trader’s position will move 5 points for every 1 point movement in the underlying.
Now, assume Nifty moves 70 points against him, and the trader continues to hold his position, hoping for a recovery. The trader is obviously under the impression that he is holding 10 lots of options which is within his risk appetite…
Let’s do some forensics to figure out behind the scenes changes –
- Delta = 0.5
- Gamma = 0.005
- Change in underlying = 70 points
- Change in Delta = Gamma * change in underlying = 0.005 * 70 = 0.35
- New Delta = 0.5 + 0.35 = 0.85
- New Position Delta = 0.85*10 = 8.5
Do you see the problem here? Although the trader has defined his risk limit of 5 lots, thanks to a high Gamma value, he has overshot his risk limit and now holds positions equivalent to 8.5 lots, way beyond his perceived risk limit. An inexperienced trader can be caught unaware of this and still be under the impression that he is well under his risk radar. But in reality, his risk exposure is getting higher.

Now since the delta is 8.5, his overall position is expected to move 8.5 points for every 1 point change in the underlying. For a moment, assume the trader is long on the call option instead of being short – obviously, he would enjoy the situation here as the market is moving in his favour. Besides the favourable movement in the market, his positions are getting ‘Longer’ since the ‘long gamma’ tends to add up the deltas. Therefore the delta tends to get bigger, which means the rate of change on premium concerning the change in underlying is faster.
Suggest you read that again in small bits if you found it confusing.
But since the trader is short, he is essentially short gamma…this means when the position moves against him (as in the market moves up while he is short) the deltas add up (thanks to gamma) and therefore at every stage of market increase, the delta and gamma gang up against the short option trader, making his position riskier way beyond what the plain eyes can see. Perhaps this is the reason why they say – shorting options carry a huge amount of risk. In fact, you can be more precise and say “shorting options carry the risk of being short gamma”.
Note – By no means I’m suggesting that you should not short options. In fact, a successful trader employs both short and long positions as the situation demands. I’m only suggesting that when you short options, you need to be aware of the Greeks and what they can do to your positions.
Also, I’d strongly suggest you avoid shorting option contracts which has a large Gamma.
This leads us to another interesting topic – what is considered as ‘large gamma’.
13.3 – Gamma movement
Earlier in the chapter, we briefly discussed that the Gamma changes concerning the change in the underlying. This change in Gamma is captured by the 3rd order derivative called ‘Speed’. I won’t get into discussing ‘Speed’ for reasons stated earlier. However, we need to know the behaviour of Gamma movement so that we can avoid initiating trades with high Gamma. Of course, there are other advantages of knowing the behaviour of Gamma, and we will talk about this at a later stage in this module. But for now, we will look into how the Gamma behaves concerning changes in the underlying.
Have a look at the chart below,
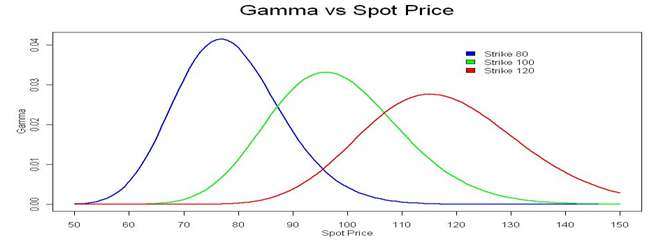
The chart above has 3 different CE strike prices – 80, 100, and 120 and their respective Gamma movement. For example, the blue line represents the Gamma of the 80 CE strike price. I would suggest you look at each graph individually to avoid confusion. In fact, for the sake of simplicity, I will only talk about the 80 CE strike option, represented by the blue line.
Let us assume the spot price is at 80, thus making the 80 strike ATM. Keeping this in perspective we can observe the following from the above chart –
- Since the strike under consideration is 80 CE, the option attains ATM status when the spot price equals 80
- Strike values below 80 (65, 70, 75 etc) are ITM and values above 80 (85, 90, 95 etx) are OTM options.
- Notice the gamma value is low for OTM Options (80 and above). This explains why the premium for OTM options doesn’t change much in terms of absolute point terms; however, in % terms, the change is bigger. For example – the premium of an OTM option can change from Rs.2 to Rs.2.5, while the absolute change in is just 50 paisa, the % change is 25%.
- The gamma peaks when the option hits ATM status. This implies that the rate of change of delta is highest when the option is ATM. In other words, ATM options are most sensitive to the changes in the underlying.
- Also, since ATM options have the highest Gamma – avoid shorting ATM options.
- The gamma value is also low for ITM options (80 and below). Hence for a certain change in the underlying, the rate of change of delta for an ITM option is much lesser compared to ATM option. However, do remember the ITM option inherently has a high delta. So while ITM delta reacts slowly to the change in underlying (due to low gamma) the change in premium is big (due to high base value of delta).
- You can observe similar Gamma behaviour for other strikes, i.e. 100, and 120. In fact, the reason to show different strikes is to showcase the fact that the gamma behaves in the same way for all options strikes
Just in case you found the above discussion bit overwhelming, here are 3 simple points that you can take home –
- Delta changes rapidly for ATM option.
- Delta changes slowly for OTM and ITM options.
- Never short ATM or ITM option with a hope that they will expire worthless upon expiry
- OTM options are great candidates for short trades assuming you intend to hold these short trades upto expiry wherein you expect the option to expire worthlessly
13.4 – Quick note on Greek interactions
One of the keys to successful options trading is to understand how the individual option Greeks behave under various circumstances. Now besides understanding the individual Greek behaviour, one also needs to understand how these individual option Greeks react with each other.
So far, we have considered only the premium change concerning the changes in the spot price. We have not yet discussed time and volatility. Think about the markets and the real-time changes that happen. Everything changes – time, volatility, and the underlying price. So an options trader should be in a position to understand these changes and its overall impact on the option premium.
You will fully appreciate this only when you understand the cross interactions of the option Greeks. Typical Greek cross interactions would be – gamma versus time, gamma versus volatility, volatility vs time, time vs delta etc.
Finally, all your understanding of the Greeks boils down to a few critical decision making factors such as –
- For the given market circumstances, which is the best strike to trade?
- What is your expectation of the premium of that particular strike – would it increase or decrease? Hence would you be a buyer or a seller in that option?
- If you plan to buy an option – is there a realistic chance for the premium to increase?
- If you plan to short an option – is it really safe to do so? Are you able to see risk beyond what the naked eyes can spot?
The answers to all these questions will evolve once you fully understand individual Greeks and their cross interactions.
Given this, here is how this module will develop going further –
- So far, we have understood Delta and Gamma.
- Over the next few chapters, we will understand Theta and Vega.
- When we introduce Vega (change in premium concerning the change in volatility) – we will digress slightly to understand volatility based stoploss
- Introduce Greek cross interactions – Gamma vs time, Gamma vs spot, Theta vs Vega, Vega vs Spot etc
- Overview of Black and Scholes option pricing formula
- Option calculator
So as you see, we have miles to walk before we sleep :-).
Key takeaways from this chapter
- Gamma measures the rate of change of delta.
- Gamma is always a positive number for both Calls and Puts.
- Large Gamma can translate to large gamma risk (directional risk)
- When you buy options (Calls or Puts) you are long Gamma.
- When you short options (Calls or Puts) you are short Gamma
- Avoid shorting options which have a large gamma.
- Delta changes rapidly for ATM option.
- Delta changes slowly for OTM and ITM options.
Special thanks to our good friend Prakash Lekkala for providing the Greek graphs in this and other chapters.
The change in Gamma due to changes in underlying is captured by 3rd derivative of underlying called “Speed” or “Gamma of Gamma” or “DgammaDspot”.
I think there is a small correction in this sentence,
The change in Gamma due to changes in underlying is captured by 3rd derivative of PREMIUM called “Speed” or “Gamma of Gamma” or “DgammaDspot”.
As, The underlying price is just a variable — we don’t take “Greeks” of the underlying itself.
All Greeks (Delta, Gamma, Speed, etc.) are derivatives of the option price (premium) with respect to underlying or other factors.
I would like to take a moment to sincerely thank you for sharing such valuable knowledge about trading. Your guidance has not only helped me understand the market better but has also given me clarity and confidence in my learning journey. What once felt confusing now feels structured and achievable because of your insights. I truly appreciate the effort, consistency, and dedication you put into helping others grow. Your work is making a real difference.One day, I hope to meet you in person and personally convey my gratitude.
Thanks for the kind words, Venu, and also thanks for pointing out the error 🙂
Hi Karthik Sir,
You gave this example in this lesson.
For example consider this –
Nifty Spot = 8326
Strike = 8400
Option type = CE
Moneyness of Option = Slightly OTM
Premium = Rs.26/-
Delta = 0.3
Gamma = 0.0025
Change in Spot = 70 points
New Spot price = 8326 + 70 = 8396
New Premium =??
New Delta =??
New moneyness =??
Let’s figure this out –
Change in Premium = Delta * change in spot i.e 0.3 * 70 = 21
New premium = 21 + 26 = 47
I have small doubt here, here you calculated the change in premium using this formula
Change in Premium = Delta * change in spot i.e 0.3 * 70 = 21
For all 70 points move the delta will not be same as 0.3, so the calculation 0.3*70 =21. Is this correct ? Every point change the underlying, the delta also changes because of Gamma. Please let me know if my understanding is right ?
Yes, technically no, there will be minor variations in delta. That said, its a good approximation.
Never short ATM or ITM option with a hope that they will expire worthless upon expiry
OTM options are great candidates for short trades assuming you intend to hold these short trades upto expiry wherein you expect the option to expire worthlessly
Can you little elaborate what worthless & worthlessly here mean.
By worthless I mean they will expire without any value attributed to the option. Basically expire as out of the money option.
When would it make sense to buy an option in the hopes that it will expire?
GAMMA FOR FUTURES IS ZERO
Gamma captures convexity. Options have curvature in their payoff (non-linear), but futures don’t.
Therefore, futures lack gamma risk — delta doesn\’t change with the underlying price.
HELLO, KARTHIK SIR
STARTED VARSITY TOUR JUST FOR SOME EXTRA KNOWLEDGE AND TO MAKE SOME BUCKS OTHER THAN REGULAR INCOME. BUT KNOW SPENDING MOST OF MY TIME ON VARSITY DUE TO ITS EASY AND CLEAN EXPLAINATION OF TOPICS.
WANT TO JOIN THE TEAM OF GREAT MINDS LIKE IN ZERODHA, SO THAT I CAN ALSO MAKE MY DREAMS TRUE.
Thats right, Futures dont have Gamma. Happy learning 🙂
Namaste sir,
Under the 13.1 heading in example
Change in premium= old delta*(underlying movement)
But if gamma is there so delta must change continuously so it must follow S= ut+ (1/2)at^2.
where S is change in premium.
please guide
Thank you.
Sorry, dint really get your query. But in general – with change in underlying, gamma changes, and hence the delta changes, and hence the premium also changes.
S= ut+ (1/2)at^2.
where S is change in premium.
To answer your question, first need to clarify on following
what is u, t, a?
Hi @karthik, thanks for all the wonderful articles, it\’s gold mine and would love to meet you one day.
Just one understanding here, so in order for us to make money , the default assumption is we need to predict the market, be it in equity trading or in derivates. Can we infer this ?
Thanks, Rohit. Yes, that is the underlying fact. Basically, be in a position to either predict direction or volatility 🙂
Answer is Zero for Future. Karthik you are awesome. The way you explain the things is really very remarkable and simple way. Thanks for preparing study materials for us. Sinc I am beginner I was not looking into this deltas, gamma and other Greeks. but now chapter by chapter its increasing my excitement and looking for what a good strategy considering DELTA where few traders do follow for neutral strategy like short iron condor or short iron butterfly.
Happy to know Poonam. I have shared the link to the videos in the previous comment you posted; I hope you find that useful. Happy learning 🙂
gamma of a futures contract would be 0
Yes, thats right.
So basically, if a trade is favouring you, then gamma shoots up
If a trade is against you, then gamma shoots down.. Does it make sense?
In a sense yes and you can extend this to all greeks 🙂
As you said that shorting ITM & OTM are risky as the gamma is high and also with the hope that they\’ll expire worthless. So what are the chances that this is true? Also does it mean one should never short ATM and ITM?
You can use the delta as a proxy for the probability of the option expiring ITM. So if the delta of an option is 0.6, then you can think that the probability of that particular option/strike expiring ITM is 60%.
so if the underlying goes up/down, the new delta value will be negative? since shown in the example below.
Yes, the delta changes based on the changes in the underlying value.
I am following the Option Greek series and I am very happy that I started learning from zerodha verasity platform, Slowly I am getting insights about many things like movement of premium and how to deal with premium while trading. Everything has been explained in a very lucid manner. Thank you
Thanks Vivek, I\’m glad you liked it. Happy learning 🙂
Hello Karthik,
had doubt in example mentioned above. here gamma should be negative since it is a short position right?
Let’s do some forensics to figure out behind the scenes changes –
Delta = 0.5
Gamma = 0.005
Change in underlying = 70 points
Change in Delta = Gamma * change in underlying = 0.005 * 70 = 0.35
New Delta = 0.5 + 0.35 = 0.85
New Position Delta = 0.85*10 = 8.5
therefore actual gamma = -0.005
new position delta = -8.5
is this error or maybe I am wrong somewhere. please help me understand this.
I think its short put right?
Hello Karthik,
have doubt in following:
The trader is short 10 lots of Nifty 8400 Call Option; this means the trader is within his risk boundary. Recall the discussion we had in the Delta chapter about adding up the delta. We can essentially add up the deltas to get the overall delta of the position. Also, each delta of 1 represents 1 lot of the underlying. So we will keep this in perspective, and we can figure out the overall position’s delta.
Delta = 0.5
Number of lots = 10
Position Delta = 10 * 0.5 = 5
Shouldn\’t the delta of position = -5 since it is short call?
Puts have -ve delta, so short put becomes positive.
very interesting and very difficult to understand.In fact, options trading is not easy, which is why 9 out of 10 traders make losses here.ufffff….😐
Yes, options are complex, and takes time to figure 🙂
then what about the premium, will it depend on new delta or the old delta
Yes, the premiums too change with the change in the underlying.
Hi Karthik, could you please explain this statement,
\”Never short ATM or ITM option with a hope that they will expire worthless upon expiry\”
And also in the first example,
\”\”Change in Premium = Delta * change in spot i.e 0.3 * 70 = 21
New premium = 21 + 26 = 47
Rate of change of delta = 0.0025 units for every 1 point change in underlying
Change in delta = Gamma * Change in underlying i.e 0.0025*70 = 0.175
New Delta = Old Delta + Change in Delta i.e 0.3 + 0.175 = 0.475
New Moneyness = ATM\”\”
Does the new premium depend on old delta value(0.3) or the new one(0.475)
Thats right, old delta changes with the change in underlying and that is dependent on the gamma of the option.
Hi Karthik,
The old delta changes with underlying but when calculating the new premium we use the old delta itself and then calculate the new delta?
Or do we first calculate new delta and then use the new delta value to calculate new premium?
We use the old delta to get the new premiun, and then the new delta for subsequent calculation.
where to get the real time chart for values of Gamma of nifty options during live trading hours..
waiting for reply..
No, this is not possible. But do check once with Sensibull.
Thank you for detailed explain about gamma, what is the reason to change the gamma value
The change happens due to the change in the underlying price change.
hello sir
in the example given below u have told that we have shorted the call option taking 10 lots into consideration then how come delta value will be 0.85 if the situation goes 70 points against our favour which is 70 points increase
So from the overall delta perspective, the trader is within his risk boundary of trading not more than 5 Futures lots. Also, do note since the trader is short options, he is essentially short gamma.
since we are shorting new delta should be -0.5 + 0.35
Now, assume Nifty moves 70 points against him, and the trader continues to hold his position, hoping for a recovery. The trader is obviously under the impression that he is holding 10 lots of options which is within his risk appetite…
Let’s do some forensics to figure out behind the scenes changes –
Delta = 0.5
Gamma = 0.005
Change in underlying = 70 points
Change in Delta = Gamma * change in underlying = 0.005 * 70 = 0.35
New Delta = 0.5 + 0.35 = 0.85
New Position Delta = 0.85*10 = 8.5
The easier way to think about it is that the underlying is gaining in value, which means the stike is getting closer to or more in the money, which means the delta should increase. Therefore the delta gains.
Thanks Sir, You have written everything over here, We don\’t need any paid course at all.
Thanks, yes, you dont really need a paid course 🙂
Happy learning!
Sir, I think the Gamma of the Futures contract is Zero.
Thats right.
The reply section ain\’t working. Anyway my question was-
Nifty at 20070
strike price 20250CE OTM
Premium 5.2 Gamma 0.0012 Delta 0.09
if we expect the market to move till 20250 that is 180 pts then the delta should be at 0.5 but if we calculate the gamma then 0.012*180= 0.216
Add delta- 0.09+0.216= 0.3
if 20250 becomes ATM when nifty moves from 20070 to 20250 then why is the delta at 0.3? which should be at 0.5
For which u said to confirm the value, as i have a pic of that values which i had taken from sensibull.
let me know if possible to send you that pic for confirmation.
thankyou !
Gamma for the future contracts must be 0 so it won\’t affect its delta from 1. 🙂
Thats right, Ajay. Futures does not have any gamma.
Sir how can I find the Value of gamma for ex delta for ATM is 0.5 to 1 like what about gamma
There are no ranges like that for Gamma, Limith.
Nifty at 20070
strike price 20250CE OTM
Premium 5.2 Gamma 0.0012 Delta 0.09
if we expect the market to move till 20250 that is 180 pts then the delta should be at 0.5 but if we calculate the gamma then 0.012*180= 0.216
Add delta- 0.09+0.216= 0.3
if 20250 becomes ATM when nifty moves from 20070 to 20250 then why is the delta at 0.3? which should be at 0.5?
Where did you get the values of Delta and gamma? Anyway, delta will be ard 0.5, may not be exact 0.5. But that said, it wont be 0.3 as well. Please double check your values once.
Hi
I believe there is some confusion in the graph of delta versus spot for put option. I think it must be as follows.
Delta curve for put option in in the above graph delta vs spot must start raising from -1 delta to 0 with a positive slope representing +Gamma. That means for put options delta -1, option is in full ITM, -0.5 is ATM and 0 is OTM. If the graph is modified that way it represents Gamma is is positive either for PUT or CALL option.
with best regards
Eleswara Rao Mylangam
Thank you, let me review this again.
Gama is zero in future trade
Because underline valu increase future increase but not more thane delta are not change 1 to 0.5 and 0.5 to 0 so gama value is zero i think
Thats right.
Hi karthik, My question is how to factor in the gamma on expiry day for ATM options, is there any basic roundoff formula to calculate. Let me give you an example, let us say that around 10am on expiry nifty atm is worth 40(delta close to 0.45) and my spot Sl is 30 points, how can i factor in gamma to find how much premium would move when 30 points SL is reached within 5-10 min(Consider zero to none theta decay, as Spot SL is hit within no time). Also do i need to worry about vega while calculating the risk??
As far as I understand, you only need to factor in Vega on expiry day. You would not have to worry about gamma to play out. Otherwise also, no round off formula for this.
Sir,
If my nifty expiry is on 3rd august,
The nifty spot price is 19600,
the atm call option 19600 CE price is 5500RS Per lot. 110 rs is the premium
Delta is 0.5
and gamma is 0.0016
my position delta is 0.5*2 =1
I expect nifty spot to go up by 50 points
so the premium change will be:- (DELTA*EXPECTED CHANGE IN UNDERLYING) 0.5*50 =25 points
for my position delta will be :- 25 points *2 = 50 points
the total delta change will be:- (GAMMA*EXPECTED CHANGE IN UNDERLYING) 0.0016*50 = 0.08
new delta will be = 0.5+0.08 = 0.58
positional new delta = 0.58*2= 1.16
for every 1 point change in my underlying, my premium will be changing by 1.16 points.
I paid the premium of 220 rs(for 2 lots) and the return I got is 50 rs (for 2 lots). = 220+50= 270, (270/220)-1*100 = 22.72% ROI. 🙂
is it correct ? 🙂
I understood the gamma in respective of Call and Put option longs, but how does the gamma move react in shorting options , if you can explain it to me with an example of nifty options that I given above, it will be helpful. 🙂
The easiest way to understand the gamma movement is to imagine it to be on a slider, the movement is similar for CE and PE.
In my opinion, the gamma of a futures contract should be zero. This is because changes in the price of a futures contract do not affect the Delta, which remains equal to one.
I derived this logic by equating futures contracts with Deep ITM CE. As a CE gets deeper into ITM, the delta becomes quite close to 1. So, when the delta becomes equal to 1, it cannot increase further, and hence, the gamma gets closer to 0 when a call option gets deeper ITM.
Sir, please tell me whether my answer & logic is right or wrong.
Yes, thats right. We have discussed this in comments as well 🙂
I think I got it. We are talking about strike price here and not spot price and hence the confusion
Cool 🙂
May be it\’s too late to point out error in the article, but just want to clear out in case I have misunderstood while interpreting.
13.3 – Gamma movement – Gamma vs Spot price chart
It says – The chart above has 3 different CE strike prices – 80, 100, and 120 and their respective Gamma movement
So we are talking about call options over here, is that correct ? If it is then next statements in subsequent explanation contradicts with it and explains OTM, ATM, ITM as if its put option
2. Strike values below 80 (65, 70, 75 etc) are ITM and values above 80 (85, 90, 95 etx) are OTM options.
Am I missing something here ?
Devendra, I just read the explanation. It looks alright to me, not sure if I\’m missing something here 🙂
Volatility can have varying effects on different strike prices in options trading. The impact of volatility on different strike prices is often analyzed through the use of the Vega Greek, which measures an option\’s sensitivity to changes in implied volatility. Here are some general observations regarding the relationship between volatility and different strike prices:
1. At-the-money (ATM) options: ATM options, where the strike price is close to the current market price of the underlying asset, tend to be most sensitive to changes in volatility. As volatility increases, the prices of ATM options typically rise, and as volatility decreases, their prices tend to fall. The Vega value for ATM options is usually the highest.
2. In-the-money (ITM) options: ITM options have strike prices below the current market price (for calls) or above the current market price (for puts) of the underlying asset. These options have built-in intrinsic value. The impact of volatility on ITM options is generally less pronounced compared to ATM options. While higher volatility may still increase ITM option prices and lower volatility may decrease them, the effect is typically not as significant as with ATM options.
3. Out-of-the-money (OTM) options: OTM options have strike prices above the current market price (for calls) or below the current market price (for puts) of the underlying asset. These options rely solely on extrinsic value, as they lack intrinsic value. The impact of volatility on OTM options is usually lower compared to ATM options. Higher volatility can potentially increase the prices of OTM options, and lower volatility can decrease them, but the effect is generally less pronounced.
It\’s important to note that the relationship between volatility and different strike prices can vary depending on market conditions, supply and demand dynamics, and other factors. Additionally, the specific characteristics of each options contract, such as time to expiration, can also influence the impact of volatility on different strike prices.
Analyzing the Vega values of options at various strike prices can provide a more detailed understanding of the relationship between volatility and option prices. Options trading platforms or software often provide access to these values and can assist in evaluating the impact of volatility on different strike prices more precisely.
This is correct, but I dint really find a query 🙂
I read the volatility topic, but in all 3 chapters in varsity, it\’s not explained how this happens in each strike. Can you please help me a little more?
My exact question is \” Volatility is highest for ATM and lower as we go OTM or ITM. Also, it decreases in a linear fashion. How are some options behaving in the opposite way of gaining premium while the whole chain is losing premium? \”
Any kind of help to understand this deeper would be so much more meaningful. Thank you.
There are multiple factors at play Hesham. Premium is a function of all these factors at play. Some of these factors are –
1) Volatility
2) Theta decay
3) Directional movement of the underlying
4) Individual strike\’s demand and supply
So the premium for that particular strike which you are referring to would have baked all these factors into its premium. While volatility is one aspect, do pay attention to the particular strike\’s demand and supply. That too have a role to play in determining the premium.
Why is this nature of one PE premium decreasing while another PE is increasing, I am aware that it may decay less as it goes away from ATM due to decreasing theta value but why will it increase?? Please refer where I can read or know more about this kind of behaviour or imbalance in behaviour based on strikes
Each strike has volatility which impacts the premium, Hesham. So this is a function of that.
I have observed that the option price of say PE near the ATM is 50 rupees, a few more strikes away i.e. OTM is 20 rupees. In a sideways Market, 50 Drops to say 40 rupees, while 20 sometimes increases to say 22. Is this due to Gamma? Please help me understand
Its due to how volatility affects the individual strikes.
This is Really Rocket Science. One hell of a ride but worth pursuing.
Its fairly simple if you give it a couple of reads. Let me know if you have any queries, will be happy to help.
hi if nifty is at 17000 and i buy 1 lot of 18000 ce and i sell 16000 pe of 1 lot so where should the market move to make profit can you explain it in detail
What you have initiated here is a spread strategy, and each spread has its own set of P&L attributes, as I\’ve explained here – https://zerodha.com/varsity/module/option-strategies/.
To know the exact points at which you profit or loss, you can enter these values on Sensibull\’s platform and figure.
Dear Sir,
I am a Zerodha client and a big fan! I have been consistently profitable in Nifty Bank Nifty trading Options. I do directional trading. I only wirte ATM options. I have a concern. My ROI is very low. Margin blocked is too high. So I cannot increase position size since I have limited capital. I was thinking about two things on which I need your guidance- 1 To shift to ITM option buying with delta close 1, in which case will they be liquid enough to exit position and how to manage spread? 2 I shift to monthly ATM option buying where theta won\’t be much of a problem, but again how about liquidity and spread?
Please guide me here as I am a profitable trader looking to improve ROI as my skills far exceed my capital now.
Anand, writing ITM options itself is a bit scary thing and add to the liquidity issues, and it just does not make sense. ATMs are better that way. This is the trade-off Anand, if you want to push ROI, you will have to take a higher risk. You need to figure what keeps you comfortable and allows you a good night sleep 🙂
Many thanks for this and previous articles. this has really helped in clearing my concepts about options
Happy learning!
GAMMA of the Futures should be 1
Yeah, since Delta of Futures is 1.
Sir, in section 13.2, if nifty moves 70 points against ATM put, then the delta should decrease i.e new delta 0.5-.35= .15
And total delta for 10 lots= .15*10 = 1.5
Am I correct or should I revisit the calculations
Yup, for a call, if the spot falls, so does the delta.
I think gamma for future contracts is 0 as the delta is constant.
Yeah.
Hey Karthik!
I think you have made some serious mistake, while calculating the price of new premium, let\’s take the example you have mentioned:
Where: ->
Nifty Spot = 8326
Option = Nifty 8400 CE
Moneyness = Slightly OTM
Current Premium = 26
Current Delta = 0.3
Gamma = 0.0025
New Premium = ?
New Delta = ?
New Moneyness = ?
We know,
change in delta = gamma * change in spot
In our case, new delta = old delta + change in delta
New delta = 0.3 + 0.0025 * 70 = 0.475 (This part you have calculated correct)
Change in premium = delta * change in spot
But, here delta is not constant, which you have assumed, this is wrong.
So, dP = (OldDelta + Gamma*S)*dS, because delta is a function of Gamma and Spot
where dP = Change in premium and dS = Change in Spot price
And hence, change in premium comes out to be = (oldDelta + 1/2(Gamma * change in Spot) ) * change in spot
And so new premium = old premium + change in premium
New Premium = (0.3 + 1/2(0.0025 * 70) ) * 70 = 27.125, although the contribution with change in gamma currently seems less, but if the change in spot will be higher, the change in premium will differ a lot with your forumla.
Also, I have assumed the Gamma as constant, just to solve the problem, which is clearly not possible in real life. Correct me if I am wrong somewhere.
Rishabh, thanks. Let me check. In reality, neither gamma or delta are constant; they change continuously. I assumed a constant delta to convey the topic, like the way you assumed constant gamma for simplicity.
But I do get your point 🙂
Hi Karthik,
Thank you for all these wonderful learnings.
I have a query if I may –
Is the classification of option as OTM ATM ITM from option buyers perspective alone?
Say for a CE, if an option is OTM for buyer, it would obviously be ITM for seller right?
Example-
Option Type = CE (Buyer)
Strike Price = 100
Spot Price = 90
Moneyness = OTM
If you look at the above example from sellers perspective it would be ITM for him isn\’t it?
I think I am confusing myself. Appreciate if you can help me connect the dots where I am missing.
Thank You
The moneyness of an option is the same for both buyers and sellers. In the above case, 100 CE is OTM for both buyers and sellers.
Never short ATM or ITM option with a hope that they will expire worthless upon expiry
(please help me to understand the meaning of this line )
Thank you.
The probability of ATM and ITM expiring as an ITM option is quite high. Hence you don\’t want to risk it.
It is really commendable work that you are doing.
My doubt is how is the gamma value arrived at? As we can calculate delta, given gamma, but how the gamma is derived?
Thanks, Pariskhit. Gamma, and all the other greeks, are an output of B&S calculator.
Hello,
My question is regarding the value of delta taken as positive 0.5 in the example where we are shorting 10 calls. Why is the delta positive when we short/ sell calls? Shouldn\’t it be -0.5 and consequently the delta of the portfolio be -5 (since -0.5*10 = -5)? And then wouldn\’t a change in underlying of +70 points result in +0.35 gamma and then, a net portfolio delta of -5+3.5 = -1.5 ? Please let me know if there is some error in my understanding.
Thank you.
+ve for Delta, and -ve for the direction of trade.
Hi Karthik,
The gamma of a futures contract should be zero.
Any suggestive material to read more about the quantitative side of options theory? I want to dig deeper into the math.
Love the way you explain such complex topics in a simplistic manner.
Thanks.
Rahul, there are multiple books. I\’d suggest you check out the book reco on CQF forums.
Also you cannot simply calculate the change in premium as delta*(change in spot). At ATM there is significant gamma which you cannot ignore.
So the correct approach should be.
Change in premium = delta*(change in spot) + 1/2*gamma*(change in spot)^2
Your explanation and coverage is quiet good but I found a lot errors on Gamma topic. Please review and correct.
1. Gamma is not always positive. Its positive for all long position. A put option is a bearish position and will have negative gamma. Because as the underline increase the PE will move towards OTM resulting decrease in premium, delta and hence gamma is negative.
2. Even you wrongly tried to prove in examples, that Put options will have positive gamma.
1. Case 1 – Underlying moves up by 10 points
* Delta = – 0.5
* Gamma = 0.004
* Change in underlying = 10 points
* Change in Delta = Gamma * Change in underlying = 0.004 * 10 = 0.04
* New Delta = We know the Put option loses delta when underlying increases, hence – 0.5 + 0.04 = – 0.46
Put option loses delta when underlying increases – this is correct but -0.46 > -0.5. So by your calculation its not losing delta.
Correct approach is Gamma = -0.004
Then ->
* Change in Delta = Gamma * Change in underlying = -0.004 * 10 = – 0.04
* New Delta = We know the Put option loses delta when underlying increases, hence – 0.5 + -0.04 = -0.54
Thanks Anshu, I need to double-check this. I have started updating the content starting from the first module, will try and fix this bit soon.
Hi Karthik,
I like your literature on stock market.
In this chapter, you have concluded that \”Never short ATM or ITM option with a hope that they will expire worthless upon expiry\”.
From this chapter i understood that, as gamma is high for ATM options we should avoid shorting as there is high risk.
My doubt is how did you conclude that ITM options are not great for shorting, as gamma is lesser for both ITM and OTM compared to ATM options.
Regards.
Ah, Raju…I\’ve explained the logic in the chapter itself.
Number of lots traded = 10 lots (Note – 10 lots of ATM contracts with a delta of 0.5 each is equivalent to 5 Futures contract)
Option = 8400 CE
Spot = 8405
Delta = 0.5
Gamma = 0.005
Position = Short
The trader is short 10 lots of Nifty 8400 Call Option; this means the trader is within his risk boundary.
Sir the above extract is taken from chap 13.2
sir can you please explain how the trader is within his risk boundary.
Thank you sir.
Paul, can you please check the above comments one, we have discussed this specifically 🙂
note ;- revised question
sir i have some confusions in this chapter Gamma part 2 , going back to the lesson page 124
senario 1 of the lesson
o Number of lots traded = 10 lots
o Option = 8400 CE
o Spot = 8405
o Delta = 0.5
o Gamma = 0.005
o Position = Short
(Now, assume Nifty moves 70 points against him and the trader continues to hold
his position, hoping for a recovery. The trader is obviously under the impression
that he is holding 10 lots of options which is within his risk appetite…
Let’s do some forensics to figure out behind the scenes changes –
o Delta = 0.5
o Gamma = 0.005
o Change in underlying = 70 points
o Change in Delta = Gamma * change in underlying = 0.005 * 70 = 0.35
o New Delta = 0.5 + 0.35 = 0.85124
o New Position Delta = 0.85*10 = 8.5
correct me if i am wrong ,as short
o Delta = 0.5
o Gamma = 0.005
o Change in underlying = -70 points
o Change in Delta = Gamma * change in underlying = 0.005 * -70 = -0.35
o New Delta = 0.5 – 0.35 = 0.15
o New Position Delta = 0.15 *10 = 1.5
so this is what what needed to be written over there ?
as 70 points went against him so change in underlying will be -70 points
so Change in Delta = Gamma * change in underlying = 0.005 * -70 = -0.35
o New Delta = 0.5 +(-0.35) =0.15
o New Position Delta =0.15*10 =1.5
this is what i have assumed please correct if i have assumed wrong
You can take the absolute change in Nifty as 70. But if you want to consider the -ve sign to indicate the short position, then you will also have to consider a -ve sign with Delta since its a short position.
1. sir i have some confusions in this chapter , going back to the lesson page 124
senario 1 of the lesson
o Number of lots traded = 10 lots
o Option = 8400 CE
o Spot = 8405
o Delta = 0.5
o Gamma = 0.005
o Position = Short
(Now, assume Nifty moves 70 points against him and the trader continues to hold
his position, hoping for a recovery. The trader is obviously under the impression
that he is holding 10 lots of options which is within his risk appetite…
Let’s do some forensics to figure out behind the scenes changes –
o Delta = 0.5
o Gamma = 0.005
o Change in underlying = 70 points
o Change in Delta = Gamma * change in underlying = 0.005 * 70 = 0.35
o New Delta = 0.5 + 0.35 = 0.85124
o New Position Delta = 0.85*10 = 8.5
correct me if i am wrong ,as short
o Delta = -0.5
o Gamma = 0.005
o Change in underlying = 70 points
o Change in Delta = Gamma * change in underlying = 0.005 * -70 = -0.35
o New Delta = 0.005 -0.35 = 0.345
o New Position Delta =0.15*10 = 1.5
so this is what what needed to be written over there ?
i assumed as its short delta =-0.5 and
as 70 points went against him so change in underlying will be -70 points
so Change in Delta = Gamma * change in underlying = 0.005 * -70 = -0.35
o New Delta = 0.005 +(-0.35) = -0.345
o New Position Delta =-0.345*10 = -3.45
this is what i have assumed please correct if i have assumed wrong .
For example consider this –
Nifty Spot = 8326
Strike = 8400
Option type = CE
Moneyness of Option = Slightly OTM
Premium = Rs.26/-
Delta = 0.3
Gamma = 0.0025
Change in Spot = 70 points
New Spot price = 8326 + 70 = 8396
New Premium =??
New Delta =??
New moneyness =??
Let’s figure this out –
Change in Premium = Delta * change in spot i.e 0.3 * 70 = 21
New premium = 21 + 26 = 47
Rate of change of delta = 0.0025 units for every 1 point change in underlying
Change in delta = Gamma * Change in underlying i.e 0.0025*70 = 0.175
New Delta = Old Delta + Change in Delta i.e 0.3 + 0.175 = 0.475
New Moneyness = ATM
MY QUESTION:
when 70 points move upside then you mentioned change in Delta is=0.3*70=21,But for every one point gamma also adds value to Delta but you are not including the gamma value in calculating the NEW Premium.
According to my understanding NEW PREMIUM=old premium+[(Delta+gamma)*70]
=26+33.25
New Premium =59.25
Yup. We\’ve had this discussion earlier in the comments as well. In reality, both delta and gamma change in real-time. Gamma does not change after the delta changes.
But sir,in case of going long,in chapter 10,you have stated slightly OTM can be very impressive,so likewise in case of going short, actually itm options can be a good try, isn\’t it so?
But here why is it told OTM options are better than itm options in case of shorting
Why,sir?
No, in fact, you should never look at shorting an ITM option unless it\’s part of a strategy.
Sir,I read it in one of the questions that deep itm options have very less volume.
Is it so?
Sir if yes
why is it so?
Yes, usually the liquidity is quite low for these options.
Sir,one doubt
Why is it told \”Never short ATM or ITM option with a hope that they will expire worthless upon expiry\”
That\’s because ATM and ITM options have very high probability of expiring ITM. You want to short options which can expire OTM, hence.
Delta changes rapidly for ATM option- Why sir?
Because the gamma to is at the peak for ATM. So when gamma changes are high, so will the delta.
Hi Kartik,
Thanks for laying this down so well!
Continuing with your example:
Option = 8400 CE
Spot = 8405
Delta = 0.5
Gamma = 0.005
Position = Short
My question is that –
If the underlying moves by 70 against me -> 8405-70
New gamma = -70*0.005 = -0.35
New delta = 0.5-0.35 = 0.15
Shouldn\’t 0.15 be the new delta for me rather than 0.85 mentioned in your example?
That means if I was initially carrying a delta of 5 (10 lots * 0.5 delta) , my new position delta position becomes 1.5 (10 lots * 0.15). Which means I\’m carrying lesser risk now?
This might be way of if I\’m missing something. Can you please help me out?
YOu are short on CE, and the move against you means the underlying price has increased and therefore the delta too should increase. Keep the greeks apart and think just from your position perspective and then overlay how the greeks should behave. Hopefully that will clear things up 🙂
Hello Karthik,
Thank you detail explanation.
One query.
OTM options are great candidates for short trades assuming you intend to hold these short trades up to expiries wherein you expect the option to expire worthlessly Can you please elaborate more on this regards to Delta & Gamma.
Thanks in advance.
Simplistically, OTM options have the highest probability to expire worthless thereby the odds of you retaining the premium are high.
So gamma value can actually be negative based on my position ?
https://www.projectfinance.com/long-gamma-short-gamma/
Hi, everywhere they say long gamma is positive and short gamma is -ve but you said , Gamma is always positive number..Which one is correct
Gamma is dependent on the position you take, Bruce. Hence that statement.
where we can see gamma value of particular option strike price ?
any application?
Yes, check sensibull – https://sensibull.com/
Very very Helpful
Happy learning!
Sir, (this is about estimating risk using gamma) As i saw one of your comment u said that option transition from atm to itm so delta should gain but earlier in this chapter we learn that if position delta is -ve then underlying and options move in opposite direction so underlying gain options lose so do delta and premium right sir?
Hi sir, in estimating risk using gamma there we are shorting 10 lots of call options, delta is 0.5 then position delta should be -5 right sir?
And as underlying is against means market moving up delta should go down then how delta is 0.85 instead 0.15
I\’m confused in this section please answer my confusion.
Sir What do u mean by theata is 0.65 when the value of premium itself is Rs.25???
And How does theta decays in Weekly expiry
It means that the option premium will lose 0.65 points is all else equal. Theta decay works the same way with weekly expiry as well.
Gamma आणखी सोप्या पद्धतींमध्ये होऊ शकतो का ,समजण्यासाठी जास्त किचकट होत आहे.
कृपया याबद्दल मार्गदर्शन करावे
I think the gamma for future will be 0. The delta don\’t change with the change in underlying price value.
Please let me if i am right ?
Yes, thats right.
hi!
went through this chapter, on page number 121, i.e in first equation after the curvature :in there u explained \’rate of change of delta=\’ and \’change in delta=\’ in those two formula u told \”change in spot\” once and \”change in underlying\” once both are same or different?
The spot is the underlying, Anuj. Both are the same.
GAMMA IS A MEASURE OF RATE OF CHANGE OF DELTA. SINCE DELTA DOES NOT CHANGE FOR FUTURE, GAMMA IS NOT REQUIRED.
Thats right.
hello karthik sir , first of all thanks for such execellent yet simple and free classes , i have a querry that you mentioned \’ Never short ATM or ITM option with a hope that they will expire worthless upon expiry\’ . What does this mean by expire worthless upon expiry ,like what i m expecting to happen with delta and premium values if am shorting an ATM and ITM and what will actually going to happen with these upon expiry
Worthless options are those which have zero intrinsic value upon expiry. If you write an option, it\’s good to see the option go worthless upon expiry as you can retain the premium received. The chances of an ATM or ITM option being worthless upon expiry is low, hence you should try and avoid writing these options.
Thanks sir for all your efforts 😊
Good luck and happy learning 🙂
Does option contract have expiry on the last Thursday of every month or every Thursday??
Every Thursday is for weekly options, last Thursday is for Monthly contracts.
Sir what\’s the meaning of a contract expiring worthless?? As in when you said OTM is great candidate for shorting wherein we expect it to expire worthless… What\’s the meaning of worthless here ?
If an option contract does not have any intrinsic value upon expiry, then that option is said to be worthless.
Sir was there a set calculation when you\’d say that the trader would define his risk limits to 5 Nifty futures contracts ?? I mean why \”5\” …As a capital of Rs.300,000 he could obviously go for more contacts than just 5
Or is the number purely imaginary and only for the example ….
10 lots of ATM option, each with a delta of 0.5, so 10*0.5 = 5 lots futures equivalent.
since trader has short 10 lots of Nifty 8400 Call Option, Initial Delta of position should be -5, instead of +5
and after market moves 70 pts up against the trader, new delta should be -5+0.35= 4.65
pl clarify where am I wrong
Varun, its the delta of the option we are talking about. So an option transitioning from ATM to ITM will gain delta right?
Sir can volatility alone can increase the premium of an option if market movement direction is not supportive
Yes, volatility can play an important role in determining the price of an option premium.
Ok Karthik.Got confused by the graph of PE option.
Delta calculation is correct.But graph is wrong.
Red graph should be horizontally reversed(as Spot increases PE delta should go from ITM(-1) to OTM(0), but here it is going from OTM(0) to ITM(-1) .. Pls change graph if possible
Thanks a lot
Let me relook at this, thanks 🙂
Thanks for response Karthik.
No, Hence from -0.54 from -0.5
-0.54 is more negative than -0.5..pls see the red graph of Put option delta
Sreekanth, -0.5 to -1 indicates that the option is transitioning from ATM to ITM, and from ATM to OTM the delta moves from -0.5 to near 0. The graph and the math indicate the same. Look at the graph from the ATM point of view.
Hi Karthik,
Firstly thanks for your awsome learning articles. I am a big fan of your way of writing.
I have a query in below calculation of Delta for PE option:
Case 1 – Underlying moves up by 10 points
Delta = – 0.5
Gamma = 0.004
Change in underlying = 10 points
Change in Delta = Gamma * Change in underlying = 0.004 * 10 = 0.04
New Delta = We know the Put option loses delta when underlying increases, hence – 0.5 + 0.04 = – 0.46
Case 2 – Underlying goes down by 10 points
===> Here new Delta should be -0.54 beacuse PE Delta loses value(becomes more negative) as Underlying increases. Even from graph, we can infer, red line moves towards more negative value as underlying price increases.
Delta = – 0.5
Gamma = 0.004
Change in underlying = – 10 points
Change in Delta = Gamma * Change in underlying = 0.004 * – 10 = – 0.04
New Delta = We know the Put option gains delta when underlying goes down, hence – 0.5 + (-0.04) = – 0.54
===> Here new Delta should be -0.46 beacuse PE Delta gains value(becomes less negative) as Underlying decreases. Even from graph, we can infer, red line moves towards less negative value as underlying price decreases(moves to left on X-axis).
Here new Delta should be -0.54 because PE Delta loses value(becomes more negative) as Underlying increases —–> hence -0.46 from -0.5 right?
Sir I have read almost all Modules they are amazing. Thank you For that. Can you please Provide a module regarding Algo trading too??? That would be really helpful because zerodha is providing algo trading through STREAK but its still confusing.
Algo trading is simply packaging a bunch of rules which gets validated systematically. Check this – https://zerodha.com/z-connect/queries/general-queries/the-rise-of-algo-trading-platforms-everything-you-need-to-know
If you are long options then you are long gamma
If you are short options then you are short gamma
I am not able to understand this properly. Kindly elaborate sir
Thank you
Jitesh, have explained this in the module and comment section. Request you to check this again.
Hello sir,
Great work, you just put this confusing concept in such a way with an simple example that any one can understand this concept.(*with little brain work 😅).
Gamma value of future- 0.
Happy learning, Vishad!
Gamma will be somewhere near to zero but never be zero such value of gamma could be 0.000000001
Yeah, as long as there is time to expiry, greeks will have a value, however small they are.
Calculation mistake in 13.2 where delta should be -0.5+0.35=-.15
Hmm, I need to check again.
hi karthik
as price action, zones work on naked charts of stocks, indices, does price action works on candle stick charts of options, in the same way it works on charts of stocks and indices?
can i apply same patterns, doji, stars and other indicators, to know the movement of options?
regards
I\’m not a big fan of applying CS patterns on the option charts, because there are lot more factors at play wrt options.
Hi Karthik,
A critique on chapter 13.2. The point on \”gammas getting added up\” and making shorting options riskier than long options would have been easier to understand with an example. In my opinion your point is a VERY IMPORTANT one and I humbly submit that one can get the wrong picture here. This can be explained as below with data from your own example where delta = 0.5; gamma = 0.005 and underlying moves by 70 points:
Case 1: Underlying moves up by 70 points for a person shorting options (market moves against the person\’s position):
– New delta = old delta + (gamma x change in underlying)
– New delta = 0.5 + (0.005 x +70) = 0.85
Case 2: Underlying moving down by 70 points for a person buying options (market moves against the person\’s position)
– New delta = 0.5 + (0.005 x -70) = 0.15
So in both the above cases, market has moved against the person\’s positional view by the same 70 points. But the person holding short position will likely lose more because of higher delta. The person holding long position will also lose but lesser because of lower delta.
1) Is my understanding correct?
2) Leaving the mathematics aside, why do you think is the reason for this phenomenon?
Regards
Sathya
Sathya, this is correct and I also realised that I gave a rather simplified example here. Will try and add more details to strengthen this.
constant
Hi karthik,
These topics are amazing and very lucid.
can u suggest me where can i find value of delta and gamma of stock.
in some exmples you have taken 0.005. How do u know
Is there any website?
Thanks Pavan. I\’d suggest you look at Sensibull\’s website for this.
Then , you supposed to be correct in above example under the \’Risk in Gamma\’.
You took + 5 in the example
Your multiplication are 10 *0.5 = 5
Even you are short on call option and don\’t you think the whole scenario will change as you has put your thought according to +5 delta .
That\’s right -5 lots * -(underlying change) gives a positive output.
Hi,
Option = 8400 CE
Spot = 8405
Delta = 0.5
Gamma = 0.005
Position = Short
Number of lots = 10
Position Delta = 10 * 0.5 = 5
These values are updated by you .
But when we are short on call . The value of delta comes in negative .
Like you told in previous module that when we are short on call we use ( – ve ) sign .
So , delta position should be –
-10 *0.5 = -5
I put negative sign next to next because we are short on call as you said in previous module .
Thats right, Shubhika 🙂
Hi,
I Went through some of the comments and You mentioned some Values of Delta
– Delta of Call ATM = +0.5
– Delta of Put ATM = -0.5
But when You are Short
– Delta of Call ATM = -0.5
– Delta of Put ATM = +0.5
In the Above example Under gamma Risk
You took 10 lots and delta = 0.5
You were short on Call Option
So, don\’t You think delta of short Call = – 0.5
You can think about it from this perspective. Its a CE we are talking about, ATM becomes ITM if the spot moves up. So the example we have quoted is correct. Short CE is = -ve, change in underlying wrt to the position is also -ve. So both together is +ve.
Hi,
In the previous chapter we calculated the delta values . If you see last case in previous chapter you sold the 1 lot and you put (- ve) sign before 1 and above example under risk you were short on 10 lots.
so, why didn\’t you put – ve sign before 10 .
Sort call or PUt?
Hi Karthik,
Thanks for these wonderful lessons. I am finding them so interesting and able to understand as the flow is very simple and step by step. Although I am excited to enter Options\’ world but holding my resistance for now as I know that until I know full alphabets of Options it is asking for trouble. Every chapter I go through, makes me feel more confident on my understanding of Options. Continuing with next chapters on theta and Vega.
Thanks for the awesome job!
Happy learning, Neeraj! I hope you find the rest of the chapters interesting as well 🙂
Hello Karthik.
I must say, all these modules have helped me a great deal in understanding the basics of options trading.
Now, I have a confusion regarding the Gamma value for Calls and Puts. We know premiums tend to fall faster than they rise. Although this is a qualitative factor, shouldn\’t this mean the gamma of a Put and a Call option at the same strike would be different.
Umm…going by your analogy, if the acceleration of a car is at lesser speed than its braking, the velocity of a car going in reverse should be different than the velocity at which it advances, isn\’t it?
Keshav, prices tend to fall faster than they raise —> as you said, this is sentiment-driven and not really quantified.
Hi Karthik,
You\’ve mentioned – \”Avoid shorting options which have a large gamma\”
Why did you specify only shorting, isn\’t the risk same for shorting or buying an option for a particular gamma?
I mean – \”Avoid shorting/buying options which have a large gamma\” – Is this wrong?
SHort positions requires margins, and with the price drop, margins increase and therefore your capital deployed increases.
Hello Mr. Karthik,
On May 29, avinash singh also asked same thing, there is something wrong as compared to old chapter & this chapter explination, as in previous chapter negative sign considered in calculation. but in this case section 13.2 negative sign should consider. can please explain in more detail.
Vishwajeet.
Let me check this again, Vishwajeet.
Hello Mr. Karthik,
In estimating risk by gamma, The trader is short 10 lots of Nifty 8400 Call Option, but while calulation no where minus sign is considered, while review of adding up deltas(Previous chapter) we have seen in case no 5 that for sell(Short) we are considering (-1* 0.5)= -0.5 but here in this case +0.5 considered. what is the logic behind this? if am wrong please correct me.
-ve sign indicates the direction of the trade, Vishwajeet.
in 13.2 – since the nifty has moved 70 points against the 8400ce seller this means the spot now is 8475. this means option has become OTM from ATM. and for OTM delta should decrease from 0.5. but why are we adding 0.35 to 0.5? as mentioned before delta above 0.5 is ITM in case of call options..plz explain this..
We are not adding, I guess the new delta is less than 0.5, hence around 0.35.
Change in delta = gamma * change in underlying
So in futures
Change in delta is 1
Gamma is ?
Changes in underlying if 1
Put this in equ
1=gamma * 1
So gamma = 1/1
Ans for future in gamma is zero
Yes sir.
gamma of the future will be zero because the future delta is constant to 1 which doesn\’t change. gamma is the rate at which delta changes. if delta is not changing then why gamma? so gamma will be zero.
Thats right.
Hi Karthik,
When I use the Black and School Greek calculator from Zerodha, I get (in addition to others) delta and gamma values. For that day, can I add delta and gamma and then multiply the sum with unit change in spot price to get unit change in premium?
You cant add delta and gamma, Sathya.
Hello Sir ,
Very beautifully explained gamma especially the 3D graph was very helpful.
I have understood the gamma relation with moneyness and expiry.
Is there any other factor gamma related to ?
( i heard someone saying gamma shoots up with the increase in volatility )
Is this correct sir?
Thank U for always guiding us.
Gamma is more related to the change in the price. Yes, volatility too has an impact on Gamma, Abdul.
Sir I have a doubt
At sr 13.3 graph has drawn with spot price on X axis but while discussing the same strike price has been considered which is little bit difficult to understand. Correlating the two graph and the discussion is cumbersome. Can you please explain the same.
Thanks in advance.
Hmm, but these are used in different context, Anurag.
I believe gamma is 0 for future contracts.
Right.
Answer to your futures gamma question.
Zero, why because, gamma is change in delta value, but futures, delta is constant and so gamma is zero. Am I right Mr. Karthik?
Yup.
I think the gamma of a futures contract will be 0.
Yup.
In Section 13.2, example is considered for Short CE means delta must be negative means -5 for 10 lot, if spot price moves 70 point then it is moving is OTM zone for CE shorter & delta should decrease so new delta should be -5+3.5 = -1.5
Yes, the delta increases if the spot increases, but it has an opposite effect on short CE, hence the -ve sign.
I am confused about this part –
Since the strike under consideration is 80 CE, the option attains ATM status when the spot price equals 80
Strike values below 80 (65, 70, 75 etc) are ITM and values above 80 (85, 90, 95 etx) are OTM options.
For call options, isn\’t that price higher than strike should be called ITM and lower are OTM? What am I missing here.
Strike higher than spot will be ATM for CE (ITM for PUT), and OTM otherwise.
Sir
Please tell me or suggest which chapter read again.
The module on options, especially the ones dealing with the greeks.
For example consider this –
Nifty Spot = 8326
Strike = 8400
Option type = CE
Moneyness of Option = Slightly OTM
Premium = Rs.26/-
Delta = 0.3
Gamma = 0.0025
Change in Spot = 70 points
New Spot price = 8326 + 70 = 8396
Above example premium Rs 26 /- .
This 26 /-₹ how to calculate or where from came.
You have explained it yourself 🙂
Hey you Teach us how to calculate Premium after changing underlying points, delta or gamma. But can you tell us how this premium decided what calculate required for set premium.
Sorry, dint get that. Can you please share more context?
For delta calculation, we have taken an updated delta.
But, for gamma why always (0.0025), why now updated gamma?
thank u sir
The change in gamma is very small.
Hello sir,
This is paragraph from above .
\”Option = 8400 CE
Spot = 8405
Delta = 0.5
Gamma = 0.005
Position = Short
Delta = 0.5
Number of lots = 10
Position Delta = 10 * 0.5 = 5\”
Shouldnt the position delta be -5 as the position is selling as we took negative in case of selling in delta part 3.
Ty
We took the difference in the spot as -ve, right? That takes care of the delta movement.
Gamma of future contracts = 0
Gamma = Change in delta / Change in underlying asset
Hence, Since the delta of future contracts doesn\’t change, hence Change in delta = 0
Hence, Gamma of future contracts = 0
Thats right, Eesha.
HI.. Sir
Thank you for such a valuable information. i have one doubt
in this
Case 1 – Underlying moves up by 10 points
Delta = – 0.5
Gamma = 0.004
Change in underlying = 10 points
Change in Delta = Gamma * Change in underlying = 0.004 * 10 = 0.04
New Delta = We know the Put option loses data when underlying increases, hence – 0.5 + 0.04 = – 0.46
Case 2 – Underlying goes down by 10 points
For PE option when the underlying moves up by 10 from ATM it becomes ITM and ITM data should increase OR i misunderstood somthing
and when ATM becomes ITM
When underlying moves up, the PE loses money right?
Hi Karthik sir, gamma is slightly difficult to understand because it\’s contain lot of calculus. And also I\’m unable to integrate and interpret the delta and gamma together. In fact I\’m poor in mathematics from school days. My questions are…
1. Is it really important to understand the calculation? Is it not enough if I understand only the behaviour of the Greeks? (i.e. gamma value is high in ATM, and low in ITM and OTM,etc)
2. Should options trader need to calculate all the Greeks before enter into it?? Is it not enough only directional view (i.e. underlying is going to raise or fall)
3. You have explained what is naked options. Can you please interpret it more clearly?
Thank you.
I understand Sathish. Eventually, all you need is a working knowledge of Greeks, no need to understand the exact calculations and values 🙂
Dear Sir,
What exactly do you consider to be a large gamma?
So ideally one should short mainly OTM options that have low Gamma correct?
Thats right, Litesh. While putting a number is difficult, its good to be aware that ITM/ATM tends to have higher gamma.
Can you suggest some books to get hold of these concepts or the overall F&O market?
You have Varsity for this 🙂
Hi Sir,
I am new to options and I have a basic question.
If I short a call, but don\’t square off till the expiry date, and if the spot is below my strike, what will happen to my lot?
Will the system auto-square off with a value of 0.05?
Yes, the option will be settled by the broker at 0.
Hello sir,
I m new to options, Just to understand, people always say not to do naked options. Naked means position without hedge, right??
But, in case of naked options we can use stop loss, right??
I just want to understand difference between stop loss and hedge?
stop loss is used to exit the trade which doesn\’t work as per our view or setup. Then again we can take fresh entry.
What happens in case of hedge??
Hope I asked right question..
That\’s right, Pravin. Naked means its unhedged. Yes, you can use SL to naked positions.
When you hedge, you have no exposure to the market. You are completely insulated to the movements in the market.
When you place an SL, you are willing to take a loss, in the event the market moves in the opposite direction of your trade.
got it.
so can we say, when delta is 1(DEEP ITMs), gamma will be zero.
Gamma is a non zero value. But yes, near 0.
Thank you again. Understood the calculation.
Good luck!
Thank you so much for this well elaborative write up. Have derived a lot of clarity on the options. Just for the sake of clarification, the calculation of new premium over is done based on the spot price and delta while the table shown in the previous topic (delta) has calculated the new premium based on the old premium with the delta value.
Would appreciate your clarification.
That right Gresha. In this chapter, we consider the rate of change of delta as well. We discuss that since we introduced the concept only in this chapter 🙂
Dear Sir,
I think there is a mistake in the above chapter. I sorry in advance if I am wrong.
Case 1 – When underlying moves up by 10 points.
So new delta for PE should decrease with the increase in underlying.
So as per me, the new delta should be = -0.5-0.04=-.54
Hence Old delta -.05>New delta -.54
Case 2 – When underlying goes down by 10 points.
So new delts should increase for PE
So new delta should be = -.5+0.04=-0.46
Hence Old Delta-0.5<New delta -0.46.
Please clarify
Ankit, I guess we have discussed this in the thread, can you please check the query section once?
after digestion roughly this topic ,i gain some ideas from this module, thank you karthik. but if you give link for download of worksheet then it must be more pleasure to the zerodha customer.
We have the PDFs at the end of the module page, which you can download and use. Happy learning!
Alright Karthik. So somewhere closer to 1 near ATM and closer to zero for OTM and ITM if we are to make a guess.
Yeah, that is right. Remember, these are just quick reference numbers.
Hello Karthik
Once again, these modules are extremely helpful and also thank you for responding to our queries even now.
In case of a Delta\’s value, we can kind of predict what it will be based on the type of option we are holding (0 to 0.3 for Deep OTM, 0.6 to 1 for Slightly ITM) and so on without having to depend on the Black and Scholes model. Similarly, is there any way to roughly predict what the value of Gamma will be without using the Black and Scholes method? While we know the Gamma value will be positive and that it will be between 0 and 1, is there some way to make a slightly more precise guess like in the case of Deltas?
YOu can estimate the rough gamma based on the delta itself 🙂 It will be max for ATM, slightly lower for OTM and ITM.
Hi Karthik,
New option premium should be by considering Delta and Gamma only
.: Option premium at the time of executing order +/- [ Difference in underlying value * New Delta taking Gamma effect at the latest spot price of underlying where the new option premium would be calculated] and not the old Delta as stated above module.
Thank You
Thanks for pointing this, Satyajit. I need to validate this, will do.
What is maximum value of gamma? Is it 0.5? In real world is it possible such gamma value?
Yes and yes 🙂
Gamma of Futures is zero, as there is no change in it\’s delta.
In calculus, Derivative of a constant quantity is zero.
True.
Hi Karthik,
Few questions, please clear my understanding. I tried to progress through this chapter slowly as per your suggestion, if you feel I missed anything let me know.
In earlier comments, for one question regarding successful options trader, this was your answer – Trust me if you can consistently make 2% a month trading options you are doing a phenomenal job.
1. Does it mean for every 100 rupees spend on options premium getting 2 rupees profit is considered as good (after all charges)?
2. You said shorting ITM options is risk since it has low gamma and likeliness of option to become worthless on expiry is less, completely agree. But how shorting ATM options is risky considering market is moving in our favor and it has high gamma so chance of worthlessness is more? Only because if it goes in opposite direction losses are more that\’s y it is risky?
3. In the above example 13.2, you said trader\’s risk appetite was 5 delta points or 5 Nifty future contracts. As explained market moved against his/her bet and delta changed to 8.5 points, at this stage are you saying a wise trader would exit booking losses? (since risk was only up to 5). But generally options would expire after some days and market will go up and down during this time, so is it wise to exit immediately as risk increased to 8.5?
4. In Delta (Part 2) chapter, while explaining different stages of delta change, you said go for ATM options if you want to play safe and ITM options if you want play very safe. So my question if since ATM has high gamma, it also reacts equally to negative movement i.e. risk is also high, didn\’t understand how is it playing safe? Same goes for ITM as well, even though low gamma but absolute change is high again negative reaction would have huge losses so how is it safe compared to deep OTM option. Deep OTM gives less profits and more resistance towards negative reaction so ideally deep OTM should be more safe to play right?
1) Yes, but the emphasis is on consistency. You need to do this month on month
2) True, the directional risk is quite high when you short ATM options
3) The trader can either exit by taking a loss or delta hedge the position. But delta hedge is an expensive affair and costs a lot more. So this really depends on the trader\’s capital
4) I had option buying in perspective when I mentioned about the safety of ITM and ATM option.
Thanks Karthik. Is there any upper and lower bench mark values for Gamma and has some significance like Delta has 0 to 1 and 0 to -1.
I guess max value could be 0 to 1 only.
No, Gamma is not bound by limits.
thank you sir . i will definetly try it
Good luck, Vinay!
I have a doubt sir .
the 10 lot shorting example that you have given , i understood each and every thing like how quickly because of gamma your delta can change from 0.5 to 0.85 . My question is no matter at what rate the delta changes because of gamma if the price doesn\’t go above (strike price + premium price ), i won\’t incur any loss , ofcourse the rate at which you start losing your premium varies when the call you shorted starts transitioning from otm to atm to itm . so even if the prices move against me and this is the last day of expiry and i plan on holding it till expiry or until i start incurring losses . i can keep the position till this price (strike price + premium price ) and then exit as soon as the price moves beyond this .
You can Vinay, I\’d suggest you paper trade this before you take a real trade. YOu will know where this will fail if at all it does.
let me phrase what I understood from the \”estimating risk using gamma\” chapter. Basically, you should keep a check on the moneyness of your option, in this example the trader short the ATM, so if he doesn\’t want to incur a loss, the option has to come to ITM or at least stay ATM! Right? correct me if I am wrong!
Thats right, Hetang.
Hello kartik, as you said unlike delta gamma is always positive, then what do you mean by long gamma and short gamma?
Long options are long gamma and the short option is short gamma.
Sir,
For example,
Nifty Spot = 8400
We are shorting 8300 CE Strike, ITM option, Delta of 0.8, and Premium is Rs.105.
What happens if there is a sharp fall in the market and the Nifty spot moves from 8400 to 8250.
Now, the 8300CE becomes an OTM option. I know that an option writer gets to pocket only the premium but I want to understand at what rate the premium will change/decrease for a CE option or is it that, no matter how hard the underlying falls we just get to pocket the initial premium value of Rs.105?
I\’m a beginner with options that\’s why I\’m a bit confused:)
Thank You Sir!
Yes, the premium goes down. But the rate at which it decreases depends not just on the price fall but also on the time to expire and drop in volatility. This is the difference between options and futures. In futures, only price drop matters (hence called linear instrument), but in options its dependent on multiple things, hence non-liner instruments.
Yes sir but I\’m slightly confused with the particular calculation in such case. Could you please give a brief on th same?
Thanks!
Can you give more context pls?
Hello sir!
You\’ve mentioned that ITM options have a delta of 0.6-1 and ATM option has a delta value of 0.5.
The ITM and ATM options have high gamma value as well but what happens if we short slightly ITM option which eventually becomes OTM option before the expiry day itself? How will the calculations go about in that scenario?
Thanks!
With the change in spot, the greeks too will change right?
Hi Kartik , I have a question for you. Suppose I buy call option by giving a premium of Rupees 30 and the market lot is 1000. The value of underlying asset rises and so the premium also rises to Rupees 50. If I sell this contract, will my profit be 1000(50-30)? Or the profit depends on the spot price or future price?
That\’s right, your P&L will be 20*lot size and it depends on the spot price movement.
hello Kartik as mentioned above, delta changes rapidly for ATM options, then why are we recommended going for slightly OTM money rather than ATM? Also, the essence of this chapter was to keep a track of gamma and delta when the market starts moving against you. Unless the market starts to move against us, we are good with HIGH GAMMA! Correct me if I am wrong!
Regards.
YOu also need to evaluate the time to expiry and take trades based on multiple factors. High gamma is ok, as long as you know what you are dealing with.
Hello sir, it is great to read these modules and you have really explained it in the simplest way possible. I just had one question, you gave the example that when a trader shorts the option and the market goes against his prediction and the risk of the trader increases because of short gamma. However what if a trader buys the same quantity of call options in expectation of the market to go up but the market falls, then does he too face the same invisible risk which is faced by the trader who initiated short position?
Please pardon me if I have misunderstood something.
The thing with long option position is that your maximum risk is already defined by the extent of the premium paid. So you cannot lose more than that.
I feel the other way of explaining my stand, would be that since its a short call, then that means 0.5-1(each lost sold)x0.005×70=0.15, and 0.15×10=15 for 10lots. I don\’t know but somehow this seems right to me. However apparently it seems am mistaken, sir. Would be glad if you could help!
Please do check the previous comment, let me know if that helps.
\”Let’s do some forensics to figure out behind the scenes changes –
Delta = 0.5
Gamma = 0.005
Change in underlying = 70 points
Change in Delta = Gamma * change in underlying = 0.005 * 70 = 0.35
New Delta = 0.5 + 0.35 = 0.85
New Position Delta = 0.85*10 = 8.5\”
Sir if the spot has gone 70points against on a short call then should not the new delta be= 0.5-0.005*70=0.15
for 2 reasons, one you mentioned that gamma is negative for short positions.
and two, the short call will become OTM from ATM as it was supposed go below the strike(which is close to ATM) and here it went 70points higher(least desired by a short caller), thus furthering the short caller from the ITM range.
and hence i feel the new delta should be 0.15. I don\’t understand where am going wrong in terms of my understanding. Could you shed some light sir?
Thanks in advance:)
For a moment, keep aside short and long position. Think about it from the option strike perspective.
Option = CE, which means the option will gain value as and when the underlying moves up. So if the market moves up 70 points, then it implies the delta too increase. Now think through the position, you are short, which means you\’ll benefit if the market decreases, but here the market is moving up, which is against your position. Hence you will lose money. Also, since you are short, the gamma too works against you and increases the risk.
Hope this makes sense.
You said ATM options are risky to short because of high gamma in case of unexpected opposite movement. So isn’t the opposite also true, that going long on high gamma option is risky when unexpected opposite movement occurs?
WHen you are short, the deltas add up, thanks to gamma. This does not happen when you are long options. Hence risker when you short.
Is gamma = 0.004 for all ATM options? If not, how do we calculate? Also how do we calculate gamma for ITM and OTM options?
There is only 1 ATM strike, right? Gamma is calculated using a B&S indicator.
I quote you from above.
“Although the trader has defined his risk limit of 5 lots, thanks to a high Gamma value, he has overshot his risk limit and now holds positions equivalent to 8.5 lots, way beyond his perceived risk limit. “
The trader had defined his risk limit as 10 lots right? Then due to gamma if he now holds positions equivalent to 8.5 lots, then the risk is less right?
Is there some typing error, or have I mistaken something?
Abel, the trader\’s risk limit is 5 lots, not 10.
hello sir,
can gamma be negative??
any books say that gamma is negative for short calls and positive for long calls. pl explain
Not really. Gamma is positive for both CE and PE, long and short.
Thanks for the wonderful and well poised contents with simplified explanation. Its easy for a layman to understand your content.
I found one part to be confusing or there is any error.
In section 13.3 you have assumed 80CE option, but in the point no. 2 in subsequent paragraphs you have considered below 80 spots as ITM and above 80 as OTM l.
In my opinion either the option should be 80PE or the above 80 spots as ITM and below 80 spots as OTM.
Also please explain why the gamma at ATM is decreasing when strike price is increasing for the graph shown above.
For a call option, all strike above the at the money (ATM) strike is considered out of the money and all strikes below the ATM option is considered ITM. In a put option all strike below ATM is OTM and above ATM is ITM.
Reading in Sept 2020
Hi sir ,
Im confused in this .For every 1 points movies up its 5 up but when It comes down its 8.5 how sir
Delta = 0.5
Gamma = 0.005
Change in underlying = 70 points
Change in Delta = Gamma * change in underlying = 0.005 * 70 = 0.35
New Delta = 0.5 + 0.35 = 0.85 -(this place I\’m confused new delta should go low to 0.35 how it can be to 0.85 when it falls down)
New Position Delta = 0.85*10 = 8.5
Plz clearify this sir
Is this for a long CE/PE or short CE/PE? The calculation of new delta depends on that as well.
Thanks!
Hi Karthik, not sure if this has been pointed out already but the sample graph for Gamma vs Spot isn\’t peaking ATM but slightly OTM.
Hmm, let me recheck. I should peak at ATM, else, there could be a very minor modelling error which is leading to this.
Understood the statement \”PE gains when underlying decreases and loses when underlying increases\”. So going by that,
* when underlying increases, PE/delta drops, hence New Delta = -0.54
* when underlying decreases, PE/delta gains, implying New Delta = -0.46
This seems to have been reversed in the calculations or I am missing some thing basic here.
The Varsity has been so very helpful with understanding the fundamentals of F&O. I would like to thank you and Zerodha (Varsity) team for such detailed content.
Thanks Prashanth. By the way, this is also wrt to the position you hold right? If you are long PE, underlying drops, you gain. But if you are short PE, underlying drops, your position loses.
gamma for future contract should be zero
Yup, thats right!
Hi Karthik,
I think there is an error in the mathematics below,
Case 1 – Underlying moves up by 10 points
Delta = – 0.5
Gamma = 0.004
Change in underlying = 10 points
Change in Delta = Gamma * Change in underlying = 0.004 * 10 = 0.04
New Delta = We know the Put option loses delta when underlying increases, hence – 0.5 + 0.04 = – 0.46
>> Delta drops => New delta = -0.5 + 0.04 = 0.54 (delta moves towards -1).
Case 2 – Underlying goes down by 10 points
Delta = – 0.5
Gamma = 0.004
Change in underlying = – 10 points
Change in Delta = Gamma * Change in underlying = 0.004 * – 10 = – 0.04
New Delta = We know the Put option gains delta when underlying goes down, hence – 0.5 + (-0.04) = – 0.54
>> Delta gains => New Delta = -0.5 + 0.04 = -0.46 (delta moves towards 0).
Please review/verify and let me know if that\’s not correct.
Hmm, this seems correct. PE gains underlying decreases and loses when underlying increases. AM\’I missing something?
I was able to understand clearly till delta (Part-3) & gamma (Part-1) chapters. I got a little confused in Gamma (Part 2)
Here it goes:-
The trader is short 10 lots of Nifty 8400 Call Option
Number of lots traded = 10 lots (Note – 10 lots of ATM contracts with delta of 0.5 each is equivalent to 5 Futures contract)
Option = 8400 CE
Spot = 8405
Delta = 0.5
Gamma = 0.005
Position = Short
Position Delta = 10 * 0.5 = 5
Then you said :-
Now, assume Nifty moves 70 points against him.
Delta = 0.5
Gamma = 0.005
Change in underlying = 70 points
Change in Delta = Gamma * change in underlying = 0.005 * 70 = 0.35
I want to know why delta was added?? What if the price had fallen 70 pts then delta to be subtracted or added??
New Delta = 0.5 + 0.35 = 0.85
New Position Delta = 0.85*10 = 8.5 (Pls explain why you didn\’t take -10 because the call was shorted)
As you said in Delta (Part 3) Case 5 :- As we can see a short call option gives rise to a negative delta – this means the option position and the underlying move in the opposite direction. This is quite intuitive considering the fact that the increase in spot value results in a loss to the call option seller.
You will have to take delta as per the position you have. For long call and short put, an increase in underlying delta is added up. FOr short call and long put, the delta gets added when the price declines….and vice versa. So keep the position in perspective.
Hi Karthik,
since there is an exact same movement in the futures contract as in the underlying, it means that whatever change is in UV, same is change in Futures, which means delta of futures never change which concludes to the gamma of future contracts to 0
Yes, that\’s right.
so this means that for every 1 point movement upwards, the premium will go down by 5 for the combined position? and for every 1 point movement downward the premium will increase by 5?
Thats right, since the combined delta is 5.
Hi,
My question is in reference with this above:
Number of lots traded = 10 lots (Note – 10 lots of ATM contracts with delta of 0.5 each is equivalent to 5 Futures contract)
Option = 8400 CE
Spot = 8405
Delta = 0.5
Gamma = 0.005
Position = Short
The trader is short 10 lots of Nifty 8400 Call Option; this means the trader is within his risk boundary. Recall the discussion we had in the Delta chapter about adding up the delta. We can essentially add up the deltas to get the overall delta of the position. Also each delta of 1 represents 1 lot of the underlying. So we will keep this in perspective and we can figure out the overall position’s delta.
Delta = 0.5
Number of lots = 10
Position Delta = 10 * 0.5 = 5
Shouldn\’t the delta of the combined position be -5?
Since we have sold 10 ATM call options adding deltas would be = -10*0.5 = -5?
Yeah, but you still read it as a delta of 5. The -ve sign indicates the direction of your trade.
Ya ya right the intrinsic value is 0. The 4 i have written absolutely wrong. But below that line i have written that IV=0. So basically the premium value is just the time value(1.75).
Yes.
Hi, You have said everywhere that time value and intrinsic value can never be negative
Here is one option
Option type -CE
Time to expiry-1 full month(may or may not be relevant)
Spot -48
Strike-52
Prm – 1.75
Here sire the itrinsic value is 4 but prm is 1.75 which is less than 4 hence
IV = 0(spot-strike, but it is negative so will take 0 right?)
1.75= 0 + ( theta/time value)
So here the time value is 1.75?
Pls solve it, i maybe confused
Thanks in advance!
Yash, this option has 0 intrinsic value. How did you get R? Yes, since the option has 0 intrinsic value, the premium is attributable to just time value.
the gamma of the Futures contract is 0, since delta is always 1 and wont change.
Thats right.
Karthik, Good to see such an amazing dedication from you. Hatts off.
May I have your attention for the below points. Forgive me if i sounds stupid,
1. Gamma very sensitive around ATM becasue the market players believe instrument getting into ITM high around ATM?.
2. Strategically, Look for higher gammas if you are a long player\’s and when it comes to writing look for stability ( lesser volatality, so premium is secured without much directional risk?)
3. Can we have long term portfolio constituted by options with negative correlated assets?
Thank you for addressing.
Big fan.
CAnt wait to study rest from here. Good day.
1) Yes, at ATM the chances of ITM and OTM is equal
2) Hmm, sort of 🙂
3) Possible, but this has to be rigorously test before taking live
Happy reading!
Hello Karthik (hi)
Gamma of future Contact?
As delta of future contract is always 1 So Change in delta will be 0.
So Gamma is determine change in delta. it is determine how delta could be change? And here no changes in delta.
So according to me gamma of future contact will be always 0.
Will be happy to hear u back 🙂
Absolutely 🙂
Glad to have my queries solved by you, sir. Rarely seen anyone ( author) solving readers queries himself.
Happy reading, Rajat!
In this gamma part 2, example 1.
Nifty spot = 8326
Strike = 8400
Option type is =CE
Moneyness of option = Sllightly OTM
in the above example, moneyness should be slightly ITM instead it was typed as slightly OTM.
Correct me if i am wrong.
No, it is slightly OTM, right?
Sir,I hv a question
Today nifty spot-10768
Nifty 9500CE-686
Now suppose nifty falls till 10300 till expiry and hence it\’s premium will fall 468 points to 218(since it is Deep ITM and hence premium will fall same as of spot),now will buyer of this option stand to loose(686-218) or gain(10300-9500-686)?
If left to expiry, the buyer will gain the difference between spot and strike.
sorry sir for providing misleading information , the charts i was scrutinizing was of the strike price newly taken .
one more thing sir , is this really you who are answering our queries , or a hardworking professional traders resolving our queries ?
Lol, it is really me, Rajat. All Hindi queries are answered by my colleague, Kulsum as I can\’t read/write Hindi well.
hello sir ,
sir I was trying to scrutinize option charts , what it come into consideration that , options charts have somewhat less day candles than expected by me . options charts were showing some 4 -5 day candles only .
sir is there anything i am missing or they have lesser candles say 5-6 only ?
Hmm, are these illiquid option charts? Can you please check that?
Hi Karthik,
I tried of to replicate a scenario like this.
Spot Price::8870
Current Delta::0.8
Strike Price:: 8900CE
gamma:: 0.0025
What will be the new Delta when Nifty touches say 9350?
So I found out that for a 480 point jump Change in delta turns out to be 480*0.0025=1.2 which is impossible as it will flatten out at 1.
This got me a bit confused at first but after going through the comments section read your explanation on applying calculus. So I guess I got my answer. Thanks for the same. (Maybe in the chapter you could have added this case scenario as well. Just a humble suggestion.)
And btw I really do hope I don\’t have to apply these calculus stuff ever while calculating greeks. 😉
You don\’t have to apply calculus, Atrijit 🙂
Thanks for the suggestion though.
Hi Karthik
I have skipped Fundamental Analysis uptill now. Just curious to know if I have to do option trading, do I need to go through that??
No, they are two different topics, Udbhav.
Gamma is rate of change in delta. In future contract delta is constant i.e. 1. Since no change in delta means gamma would be zero.
Yup, that\’s right.
Hi Karthik,
In physics / mechanics the third derivative of the displacement is not \”speed\”. But it is called as \”Jerk\”, which is first derivative of acceleration w.r.t. time. (Rate of change of Acceleration w.r.t. time).
Speed and velocity are more or less same.
The first two are correct – i.e. velocity & acceleration.
Eventhough if we replace the above name the remaining explanation is very clear and quite good. Thanks for it.
Thanks Mandar. I don\’t even know why attempted that analogy 🙂
In the opening example in this module, won\’t the change in premium be equal to change due to delta (21) and also change due to gamma (6.0375)? Intuitively, as the spot changes, the delta changes instantaneously, so there is a second order effect in the change in premium. New premium = 26 + (21+6.0375) = 53.0375
True, in reality, the change in continuous, but that would be hard to explain as a concept, hence I\’ve taken a stepwise change.
the change in underlying to time; distance traveled= velocity*time (premium=delta*change in underlying) is only valid if acceleration(gamma) is zero. kindly guide me through this.
Hi Karthik
Change in Premium = Delta * change in spot i.e 0.3 * 70 = 21.
I think the above formula is valid only if gamma =0 ,i.e., delta be constant. In your example above, Gamma = 0.0025. Hence the value of Delta is changing continuously with change in spot price.
Analogously, if we are relating gamma to acceleration, delta to velocity, premium to distance and
Yup, you are right. These variables change continuously/real-time, but explaining that would be quite complicated, hence I\’ve taken a stepwise change.
Thank you sir
Welcome!
1) Hai sir gamma value should be low for selling options. Or it should be high . For ATM strikes ?
2) when I am doing delta hedging in morning my position slightly positive coming to closing time my position was in negative what was the main reason
1) Should be low so that it does not impact delta much
2) Hard to comment on it Jaya, you need to evaluate it across multiple factors.
AS I READ ALL THE COMMENTS ON THE VALUE OF GAMMA FOR FUTURE CONTRACTS IS ZERO. BUT NO ONE ILLUSTRATED WHY.
HERE I AM EXPLAINING WHY… CORRECT ME IF I AM WRONG..
AS THE DEFINATION OF GAMMA, GAMMA IS THE RATE OF CHANGE OF DELTA.
FOR FUTURE CONTRACTS, THE DELTA IS 1 AND IT IS CONSTANT.
HENCE THE RATE CHANGE IN DELTA (i.e GAMMA) IS ZERO…
HOPEFULLY I CLEARED IT
Yes sir, thats right.
\”Strike values below 80 (65, 70, 75 etc) are ITM and values above 80 (85, 90, 95 etx) are OTM options.\”
either my understanding is wrong or there is some error in the graph or the text you have given.
the graph talks about these values as spot values, not strike values
and hence spot values below 80 will be OTM, above 80 ITM
Hmm, no, I think the explanation is correct. Please do double-check, request you to re-read this.
The value of gamma for futures is zero
Yup!
Thanks Karthik. I am surprised that you are still active on this links. Wonderful commitment to spread the knowledge.
I read in one of the questions above that there was also a module on \”quantitatives\”. Where is it ?
I am a person from non mathematical background with zero knowledge of calculus and I feel that would be truly helpful to me.
Also do you know any good book which can help me learn all the quantitative background of maths and stats for derivatives.
Thanks
Of course, I kind of live here 🙂
Do check this module – https://zerodha.com/varsity/module/trading-systems/
gamma of the futures is zero
Yup, thats right.
Hi sir,
I’m new to options. Whatever I know about options is learnt from your publishing’s only.
As you said, gamma is rate of change of delta, why is it positive for put.
Delta for put always decreases from OTM to ATM to ITM, its differentiation should be negative.
Please correct me where I’m going wrong
Raghu, gamma is +ve for both options. But I do get your point, I need to find an answer for this myself. Will get back to you.
Ok..thanks for clearing..so what does it basically means is Greeks help us in deciding a fair price..is it right ?
Since greeks play a crucial role in determining the true value of the option, it helps us in establishing the fair value. You can use the Black & Scholes calculators for this.
Delta,theta and gama do tell us about how premium will change but is not still the demand and supply game ? Won\’t it depend on the bidder ? Because practically if anybody is bidding he/she won\’t do the maths for every change and it can be anything random..so how does it go?
Of course, besides all these Greeks, demand-supply dynamics play an essential role in pricing. You cannot ignore this aspect of the market as well. This is the reason, option trading is all the more complex 🙂
Hi Karthik, just a clarification on gammas, in the calculations of delta for a particular option we have kept the gamma constant as the underlying moves.. but will the gamma also not change as the underlying is changing and the option is moving between OTM, ATM and ITM?
Yes, Gamma too changes and that leads us to the 3rd order derivates. Institutions dealing with lots of funds get into this and hedge away gamma. For retail investors the risk arising out of change in gamma is quite small, so one can ignore it.
Sir
If delta of futures contract is always closed to 1 then its gamma must be close to zero as delta of futures is more or less a constant. Correct me if I am wrong.
Thanks
Thats right, gamma is 0 for futures.
Sir
From where one can have the values of delta, gamma, theta and vega on real time basis for any particular derivative ?
Regards
You should probably check Sensibull for this.
Gamma of Futures contract will be 0 , since its delta is not changing , the rate at which it changes (gamma) must be 0
Thats right, Pravin!
Hello Karthik
You have asked a question and asked us to write our answer in comment box. That\’s why I am trying to answer to your question
\”What will be the Gamma for future?\”
I have paused studying further and trying to answer to your question first. Let me know whether I am right or wrong
Ans. : Since delta of future always remain 1 then there should not be question of Gama I think. So No Gama
Regards
Satish Baichwal
That\’s right, Satish. There is no gamma for Futures.
[…] 13. Gamma (Part 2) […]
Hey Karthik !
Really great work.
I just had a quick doubt …in the section \”13.2 – Estimating Risk using Gamma\”. When the trader is trading 10 ATM CE . I understand his delta per lot would be 0.5 since it is an ATM CE. However, Shouldn\’t his overall position Delta should be -ive 5 since he is shorting CE ( 0.5 * -10).
Either we consider the sign with Position or with Delta.
My long Call Options have a delta between 0 to 1
My long Put Options have a delta between 0 to -1.
So by that logic, when I am shorting, either Delta sign should change or sign in front of potion should change ( to indicate I am short).
Extrapolating above logic equation in section 13.2 should like this according to me :
Delta = 0.5
Number of lots = 10
Position Delta = -10 * 0.5 = -5 or Position Delta = 10 * -0.5 = -5
Also, if you look from another perspective….When you are long Future, your direction expectation is \”Spot going up\” and when you are Shorting Calls, your direction expectation is \” Spot not going up or going down\” so that you get to keep the premium when option expire worthless. CONSIDERING both bets are on opposite direction shouldn\’t their position Delta be of opposite sign too.
I am a bit confused with this part. Some clarity would be great. 🙂
Hoping to hear from you
When you are long futures, the directional expectation is that the spot will go up. This is same as long call. When you are short call, you expect the market to not go up. Similar to shorting futures. So different signs 🙂
In this example you have given above..
\”Now, assume Nifty moves 70 points against him and the trader continues to hold his position, hoping for a recovery. The trader is obviously under the impression that he is holding 10 lots of options which is within his risk appetite…
Let’s do some forensics to figure out behind the scenes changes –
Delta = 0.5
Gamma = 0.005
Change in underlying = 70 points
Change in Delta = Gamma * change in underlying = 0.005 * 70 = 0.35
New Delta = 0.5 + 0.35 = 0.85
New Position Delta = 0.85*10 = 8.5\”
What will happen if that 70 points move in trader\’s favour?? Please explain!!!
It means that the option transitions more into a ITM option, which means the delta goes closer to 1 and starts behaving like a futures instrument.
My bad. As I read again the the sentence makes sense. Probably stating the same as \”CE options below 80 (65, 70, 75 etc) are ITM…..\” will make it more clear
Thanks, will try and fix that 🙂
Shouldn\’t the line \”2. Strike values below 80 (65, 70, 75 etc) are ITM and values above 80 (85, 90, 95 etx) are OTM options.\” read as \”Strike values below 80 (65, 70, 75 etc) are OTM and values above 80 (85, 90, 95 etx) are ITM options.\”
Yeah! That\’s right, thank you
Cheers!
Hey there!! Karthik
When you say, \”An inexperienced trader can be caught unaware of this and still be under the impression that he is well under his risk radar. But in reality his risk exposure is getting higher\” in the view of a trader shorting ATM options, which have high gamma, which means they have greater risk, i understand all of it, the one thing i need to clarify is,
when you say risk, i believe that it\’s risk related to volatility, how quick can the premiums change, and this factor doesn\’t change the fact that the maximum amount one can lose no matter what is the premium or (premium*no.of lots), so in a trade shorting ATM option or high gamma option if one is aware of the fact that they should risk more than a trade involving low gamma option coz high gamma premiums move faster, one can be confident enough to take a short trade on ATM options (high gamma options) right?
It is actually the risk related to the delta, the change of delta (which is dictated by gamma) and its overall impact on the position. Higher the gamma, higher is the risk. Of course, volatility is also a risk factor, depends on your position…but that is out of context in this discussion. Btw, the maximum amount that you can lose in a long position is restricted to the premium paid and for short positions, its the margin blocked.
What is gamma-vega covariance factor?
Hmm, I\’m not sure about this, Vidit. Let me check.
Thank you karthik ji
Good luck!
Dear Karthik ji,
i want to know the difference between shorting a call option and buying a put option, How it is difference from view of risk and profit.
Suppose today Nifty 50 was around 11525-30 about 14:00 . and i am sure that nifty will drop at least upto 11500. Now what should i do if i am in intraday trading. Selling Call option Nifty at 11600 or buying Nifty put option of 11400. i am new in options and today it was my 2nd trade plan. I know about shorting Equity. but not sure in this position how a trader should plan?
thank you
The difference is in your expectation of the volatility. If you think the volatility is high and you expect the volatility to go down (and also expect the market to go down), then you are better off writing a call option and pocketing the premium? Or if you think the other way, i.e volatility is low, expect it to go up (and the market to go down), then you are better off buying the put. This is because if the volatility is high, the premiums are expensive so you should be looking at selling. If the volatility is low, premiums are cheaper, so you are better off buying the premium.
If you are trading intraday, I\’d suggest you trade with futures for a bit, till you get a complete hang of the options market.
The trader is short 10 lots of Nifty 8400 Call Option; this means the trader is within his risk boundary. Recall the discussion we had in the Delta chapter about adding up the delta. We can essentially add up the deltas to get the overall delta of the position. Also each delta of 1 represents 1 lot of the underlying. So we will keep this in perspective and we can figure out the overall position’s delta.
Delta = 0.5
Number of lots = 10
Position Delta = 10 * 0.5 = 5
sir it would be -5. short 10 lot i.e -10*0.5 = -5
Yup, but the delta is additive. You need to add this to the delta value that existed before the change. This will give you the new delta.
Hi Karthik,
In the section 13.2 shouldn\’t the positional Delta be -10*0.5 = -5? And when the position moves against, it means the spot moves +70 meaning, it is moving towards the saturation side and hence new delta=0.5+0.005*70=0.85. And new positional delta = -10*0.85= -8.5
Can I say for a Futures contracts Delta is always +1 and positional Delta is +1 when it is long and -1 when it is short?
Rajesh, I think someone else had a similar query on the delta value, have posted a reply. Can you please check the comments section please?
Yes, futures delta is always 1.
How the gamma values 0.0025 and 0.004 were taken
You get that from the Black & Scholes formula.
Sir,
In Gamma (Part2) 5th page,
It has been mentioned that trader is short 10 lots of Nifty Call option and Delta = 0.5.
Query 1 – For Short call – Delta = -0.5 right?
and
Query 2- If Nifty moves 70 points against him, then Change in Delta = 70×0.005 = 0.35..So New Delta = -0.5+0.35 = -0.15 right ?
So New Combined Delta = -0.15×10 = -1.5 right?
Why does Delta has been taken as 0.5 instead of -0.5 as mentioned in Query1 for Short Call and therefore New Delta instead of -0.15 arrived at 0.85.
Please clarify the above 2 queries.
1) Yes, provided you\’ve shorted ATM calls
2) Yes
The algebraic sign is to differentiate short versus the long.
hi Sir,
what is the reason for ATM to have highest gamma? Why can\’t the gamma be same for all the moneyness ?
ATM options have the highest probability of transitioning to ITM, hence the gamma is highest.
Sir here ur saying Gamma is -ve for puts when the spot moves up but in this module u have stated unlike delta Gamma is positive for both call and put.
You can consider it as positive and it gets deducted (for PUT option) when mkts go up.
https://drive.google.com/file/d/1kZ6D6Jy6noAt-Km8qrbgsg7fWG0q5e2Y/view?usp=drivesdk
Sir Gamma and theta are always positive numbers for both calls and puts but why here they are negative and what is values of Greeks indicating here.
These are just reporting conventions, Srinath. Negative theta indicates the number of points it decays by each passing day, since its technically a loss, its shown in -ve. Gamma is -ve for put when the spot moves up. Hence -ve.
Sir varsity app is good I liked the related links,expert opinion and quiz part even I took the certification of technical analysis and completed it successfully on 1st attempt with 220points.But disappointed that there is no comments section here I learnt most things through comments section in varsity web please include comments section here also.
I\’m glad you liked the app, Srinath 🙂
Including the comments can be a huge task. But will bounce off the idea with the team.
How to calculate gamma…. Considered as 0.0025
You could use any basic B&S calculator to get the exact value of Gamma. I\’d suggest you check this – https://sensibull.com/
sir ,
I am trying to find delta and gamma of USDINR spot 71.80 , strike CE 71.75 ,but delta showing 1 , it should be 0.5 ? (using option calculator of pi , voltality 0.004 , interest rate 6.50 )
I think your volatility input seems a little off. Yes, nevertheless it should be around 0.5. Can you please try here – https://zerodha.com/tools/black-scholes/
yes sir , it should be implied volatility , i was trying to calculate volatility through pi option calculator , thats why wrong calculation , thank you sir
Good luck, Nitin.
Basically!!!!! Where can we find the delta and gamma values for the options.
Any option calculator will give you this information.
I dont know any option calculators as i am noob in stock market, What would you suggest as a option calculator (like is there any site or application)
You can check this, Hari – https://sensibull.com/
Gamma of future is always 0 as delta is always 1
Yes sir, thats right.
Hi Karthik,
Enjoying reading through!!
Now, here is trick question for you – In the earlier chapters, we had discussed that the Delta of the Futures contract in always 1, so what do you think the gamma of the Futures contract is? Please leave your answers in the comment box below 🙂
Would the Gamma be \”0\” for a Future Contract?
Thats right!
Hi Karthik,
I have been wanting to write you for quite some time so here I go today. Many thanks for writing these lessons/chapters. They are all awesome. Since I wanted to understand options, I straightaway went to options. They are all written so well and with such depth that I haven\’t seen in many study materials those are on net. Thanks a lot for taking pains to write each and every module, chapter, and so on. I really appreciate it. Thanks to Zerodha too for making it available on-line absolutely free of cost! Gratitude folks!!
Now the question- I could not understand why different gammas has different values at peaks (i.e. at ATM) for different strikes? I could not find this question in the long list of questions asked before? And How are these values derived? meaning what makes 80 CE ITM Gamma value 0.004 and 120 CE ITM Gamma at 0.003 (referring to gamma vs spot graph featured above) ?
Do I get an email notification when my question is answered? would appreciate one.
Thank you in anticipation Karthik.
Thanks for the super kind words, Abhijit.
These are three different strikes, hence the gamma value changes. But the point to note is that the gamma peeks when the strike reaches the ITM status and this is true for all options (call or put) and across all strikes.
No email notifications, the comments run up to 100\’s and it will soon start annoying you 🙂
Gamma for futures contract will be zero as there is no change in Delta, and when delta is constant then there in no question of Gamma Having non zero value.
Thats right, Pradeep.
Hello sir…
My question is THAT you said going short on ATM is risky as slight increase in the underlyimg changes the delta by greater margin(which is not possible in deep ITM and deep OTM).
BUT same thing is applicable for going long also,If underlying prices fall.
Then going long is as as risky as going short.
Then why you warn in going short if both are equally risk…..Or is it just because we already presume market to be bullish?
You quote [Note – By no means I’m suggesting that you should not short options. In fact a
successful trader employs both short and long positions as the situation demands.
I’m only suggesting that when you short options you need to be aware of the Greeks
and what they can do to your positions.]
Please explain this.
And sir your varsity project is really good and upto the mark.And i really wonder that its free..Although i have acxount on zerodha but still you are doing a great job sir.
When you short options, you are also short on Gamma, which is the rate at which the delta changes. When the position goes against you, the gamma too goes against you. This does not happen when you go long, Edward. For this reason, the risk of writing options is higher.
Sir Is there a way to publish it in epub format or mobi format to read in a kindle because pdf format is not supported well on kindle
Need to look into that, Mayank. Thanks.
hi Greetings, Thanks for the excellent stock market lessons , The gamma of the Futures contract is Zero 🙂
Yes, Kuldeep, the gamma of futures is 0, hence the delta is 1 🙂
Hi, Varsity is just amazing guys! Keep up the good work!
I have a question in this chapter. I understand that the risk position changed from 5 to 8.5 in the above example when a trader is shorting his position on call options. However if a trader has a long position on call options, then to my knowledge whatever be the change in the gamma, the risk remains to the extent of the premium paid right? So basically a change in Gamma against my long call position will not make much difference as the risk is only and only the premium amount and nothing more than that. Is this understanding correct?
Yes, when you are long, the gamma risk is contained. In fact, when you are short, the gamma risk is the highest.
Gamma for Future is 0 as Delta for future is 1 every time. Since it’s constant, it there is no change in delta. Hence, since gamma value changes delta value when price of underlying is changing, gamma is 0.
Mathematicaly, derivative of a constant function is zero.
My question is then if delta for future is 1 why don’t equal number of points go up or down on a future of a stock and it’s spot?
Also on practical examples, since the above is true, gamma won’t be zero since delta is not constant always.
That\’s right, the gamma of Futures is 0.
Btw, Futures and spot move in tandem.
Sir please write a complete chapter on hedging using put option. Lot of doubts on it. Can I buy 2 put options or complete lot of 75 fir nifty.
The futures have a delta of 1, so to completely hedge this, you need to ensure the delta is -1 from the options position. I will try and write something ard this soon 🙂
Hi Karthik,
I don\’t know how to thank you for pulling me towards stock market trading! Every chapter loads my brain with lot of new content. It is so refreshing to learn lot of new things. Keep up the good work. It might be exaggerating to say, but it is truth, there are hardly better teachers than you in the real world. You are awesome! Content is awesome in every sense! And kudos to you for replying to every comment with such love!
Thanks a ton!
Hey Avinash, thank you so much for the kind words. I\’m glad you are finding your time worth while here 🙂
Happy learning and good luck 🙂
Really an awesome experience learning this!
If only other academia had such clarity!!
Souvik, I\’m really glad you liked the content here. Happy learning!
derivative of a constant is zero so futures with delta \”1\” will have gamma value \”0\”.
Perfect!
Futures have a delta of 1 and therefore a gamma of 0.
ATM CALL OPTION 100CE HAS A DELTA OF 0.5. WHEN THE ATM OPTION MOVES TO ITM,(SPOT PRICE RISES TO 110 FROM 100). THE DELTA CHANGES TO 0.65.THE DELTA HAS CHANGED BY +0.15. IS THIS CHANGE BECAUSE OF GAMMA
Yes, the rate of change of Delta is captured by Gamma.
Hi Karthik, I saw that options oracle started supporting NIFTY, BANKNIFTY and NSE stocks – http://www.pasitechnologies.com/2015/08/happy-independence-day-to-all-indian-as.html
Is that correct?
I;m not sure, Pradeep. Have you checked out Sensibull?
What is the max and min value of gamma? Like you defined delta value of OTM, ATM and ITM
Gamma can hit close to zero on the lower end, but there is no upper cap (theoretically).
But for ITM gamma becomes saturated..so if there is no upper cap then it should not become saturated..please correct me if m wrong!!
In fact, Gamma has a bell shape curve. At its peak, it starts to decline.
Hi karthick, I want to learn about stress testing and backtesting. Can you please help me into this?
Check out https://www.streak.tech/ for backtesting, Santosh.
Thank you and what about Stress Testing…?
Stress testing is a bit complex, involves multiple scenario generations. I\’m not sure of any platforms which can do this.
Hi,
I had a question regarding the movement in the premium wrt delta, as you said gamma is acceleration so shouldn\’t the delta change at every tick in the underlying. Which would form an arithmetic progression with gamma as the common difference.
Delta =.3
Gamma =.0025
So, with every tick up in the underlying the new premium should move by
.3 + .30025+.30050…..So on
In fact, this is how it works, Animesh. It is on a continuous basis. For sake of simplicity and ease of explaining, I had to take a step approach where I\’ve assumed the price moves in steps.
Hey thanks a lot for clarifying .
Good luck!
kindly post the link for quants
Which quants, Rupali?
the gamma of the futures contract is zero.
thanks
Yup, and hence the delta is fixed to 1.
Hello sir, according to the first graph when the spot price increases the delta for put option becomes more negative but in case I (one) of the example as the price moves up by 10 points The Delta becomes less negative ?
BTW thank you so much sir for sharing your wisdom with us ?
Welcome! Keep learning 🙂
This depends on which option and which position you are looking at. As the price moves higher, long call and short Put gains more delta. If the price drops, short call and long PUT gains delta.
Hello karthik, In one of the examples above options = 8400CE And position = short . But we buy a call option when we expect the price to go up, so shouldn\’t the position be long ?
If you are short on the call option, then you essentially expect the prices to go down. Likewise, long put. If you are short on the Put option, then you expect the price to go higher, likewise, long call.
So does this mean that now he is going to suffer a loss or his profit is going to decrease as the price is going to decrease ?
Yup.
Thnx a lot
Cheers!
Hello Karthik,
From the last graph of gamma vs spot price, can we say as strike price increases (for any option call or put, buy or sell) the maximum gamma value decreases?
Yes, this increase has to happen with respect to time and speed of the market.
Got it now sir, thank you so much
Welcome. Happy learning, Aishwarya!
Hello Sir,
Sorry for troubling you with many questions. I am new to options in fact to the market.
I dont get it when you say long gamma and short gamma. I understood, ATM options have high gamma as the delta is in take off and acceleration phase.
\”In fact you can be more precise and say “shorting options carries the risk of being short gamma”.
What does this statement mean actually sir??
Thank you so much for responding all queries.
Aishwarya
Gamma, unlike delta, is only positive for both long and short options. The gamma dictates the rate at which the delta moves. If you are short on an option, then essentially you are also short on Gamma. Like in any position, if the position starts moving against you, you have the risk of a loss. Its just that short option position carries significantly larger risk compared to long options. I\’ve only tried to express this risk in terms of the Gamma.
Delta is additive i.e. we can add delta, what about Gamma and other greeks ? If they are also then please give example also.
You cannot really add the other greeks like Delta.
Great work Karthik!
I had a concern though, the statement \’when you short options, you are shorting gamma\’ is still unclear. If you could further delve into this aspect and enlighten us.
Thank you for the amazing write-up.
This is quite straightforward, Ashish. Gamma is always a positive number – and not like the DELTA which can take -ve value based on the position you take. So when you go long on an option, you are also long on the gamma, likewise, when you are short on an option, you are also short gamma.
Very well explained sir… last line is very true 😛 lots to read before i go to sleep 😛
Good luck and happy learning, Azeem!
Hi
Here we are calculating delta change considering 70 points change in spot price.
for eg current delta is .3 and if gamma is .002 so new delta will be =.3 +(.002*70) equals to 0.44
Now I am sure in real world delta calculation happens for every single point change in spot price so for every point change in spot we use to get new delta as per calculation explained above. Am i right?
The delta calculation explained here is only an approximation. Remember, when we say 70 point change, we are talking about \’direct\’ change of 70 points. In reality, it does not work that way.
Hi,
Gamma for the future contract would be zero as delta for future is constant.
Yes, the delta of Futures is 1.
Thank you.Your material is simple to understand.
Please clarify my doubt
Initially, you are assigning values for delta as 0.2, 0.8 etc.. for Delta 0.05, 0.025 etc..
How can we fix those values? Are those are estimated values?
kindly reply me
Thank you
Rajesh – I\’m unable to understand this bit – \”assigning values for delta as 0.2, 0.8 etc.. for Delta 0.05, 0.025 etc..\”, can you please rephrase this?
Pretty sure your first diagram delta vs stock price is wrong for the put delta.
Put delta doesnt start at 0 and move to -1 it starts at -1 and moves to 0.
The two curves should be shifts of each other not mirror images.
Not really. Read this chart starting from the ATM position.
Dear Karthik Rangappa,
First of all, thank you very much for putting up varsity. I learned a little bit of FA and TA through some classes. Futures and options classes are priced too costly and was searching for alternatives. That is when I landed here. When I finished all your options module, to my surprise, I noticed that I did not even take a single line of notes for the first time in learning anything in my life. All just went, straight into the head ;). Such was the manner how the concepts are explained. Referred many of my friends to this site.
I will be doing my first options trade next week :). So I am doing a quick recap of all the modules. While doing so, I also noticed that there is a slight confusion in the delta vs spot price figure. May be you need to remove the spot price caption at the bottom. Going by delta vs spot price in the figure, it conveys that as the spot price increases delta of the put option goes from 0 to -1. I think this is what Fbish pointed out. In such case for put option, the call option delta curve would just shift down.
If we want to go by OTM, ATM and ITM labels, then we may need to remove spot price caption below. It may lead one to interpret that spot price increases from left to right.
Thanks again Karthik Rangappa and Team Zerodha. All your sincere efforts are highly appreciated, deeply regarded and will be remembered through out my journey in the markets.
Vetriselvan, thank you so much for such kind words. I\’m really happy you liked the content here.
Quite a few people have pointed this on the spot vs Delta chart. The trick is to start from the center of the graph and then look to the right (where the spot increases) and then to the left (where the spot decreases)…and observe the behavior of both Call and Put Delta. Anyway, I will see what I can do to make it easier.
Anyway, good luck for your very first options trade. Hope you learn and earn well!
Thanks for the reply and your wishes :).
Starting from the center makes it easier.
You may consider putting separate labels for put and calls along the curves. Starting from the left for calls, it would be OTM, ATM and ITM and for puts it would be ITM, ATM and OTM with blue and red colors. Alternatively, you may just remove the labels and draw arrows from the centers towards the left and right saying decrease and increase in price respectively.
Thanks Vetriselvan, I will try and do that 🙂
Sir you are too good! Thanks a ton!
Happy learning!
In the options calculator, what values should be taken as implied volatility and Interest? On the specific stock derivative on nse webpage their is a dash in place of value for volatility. Please enlighten. 🙂
You can check for IVs in the Option Chain page on NSE. They publish the IVs for individual stocks / strikes – https://www.nseindia.com/live_market/dynaContent/live_watch/option_chain/optionKeys.jsp?symbolCode=-10002&symbol=NIFTY&symbol=NIFTY&instrument=-&date=-&segmentLink=17&symbolCount=2&segmentLink=17
And the interest value?
Take the 91-day t-bill as a reference rate.
Thank you karthik sir.. indebted for your guidance on truly each and everything! ?
It\’s a pleasure!
Karthik,
This is an excellent series. I found it only in Sep 2017 and I am reading it for the \’n\’th time, just to get my fundas clear. I really appreciate your patience in answering all the questions too ! Hats off to you ! (I have just opened an account in Zerodha 🙂 )
Considering that this article was written in July 2015, I hope it is not too late for me to ask these questions:
1. I don\’t think I have understood the difference between short gamma and long gamma. Is it that if you have taken a long position, it is long gamma and if you have taken a short position, it is short gamma ?
2. Let us say that an option is ATM, where the gamma is the highest. Now whether the price moves up or down, the gamma is going to decrease in the same way (because the gamma curve is like a bell curve – I have assumed it to be symmetrical about the ATM). With this, if I have shorted the option, the risk of price going up is the same as the reward of price going down, isn\’t it ? So why is it dangerous to short an ATM option, considering that the reward is equally good ?
One reason I can think of is that as the price increases, the Delta also increases and hence it has a cascading effect (thus increasing my losses, if I have shorted) whereas when the price falls, Delta decreases so as to minimise the overall effect a bit, thus reducing my profits a bit. In other words, the losses I incur by a move of x points upwards in the spot price will be more than the profits I make by a move of x points downward. Is it ?
Welcome to the family, Chengappa!
1) Yes, from the gamma perspective, long position is often called long gamma and short positions as short gamma
2) Since ATM options have the highest gamma they also tend to be the most sensitive options. It\’s like this – assume you are short simultaneously on an ATM option and also short on an OTM option. Now if the market moves against you, then obviously you will lose money on both these short positions…but you will lose much more on the short ATM position compared to the OTM option.
Karthik,
I understand that the unfavourable market movement affects the ATM options more than OTM options because of high gamma of ATM. For example, if I have bought an OTM call and an ATM call, if the price comes down, the drop in premium is more for the ATM call, right ?
So let us say I have bought an OTM call and after a day, market moves favourably and now my option is ATM. I expect the price to go up further. Is it better to:
1. Leave it as it is (and risk the premium coming down steeply if the price comes down)
2. Square off the ATM call and buy an OTM call (I can even book the profit and but an OTM call with the original amount)
Thanks,
Chengappa C B
Yes, the ATM call drops more as the ATM option is most sensitive to directional movements i.e Delta
1) Depends on your trade set up and the targets you have set. Also, if you are holding an option which has transitioned from OTM to ATM, then you will have enough cushion in terms of profits.
2) Again, depends on your risk appetite 🙂
As we have seen position of ATM options is most sensitive to changes in underlying therefore the effects of gamma on it but why is Gamma of an ATM option highest?
Also I wanted to know why theta of a deep put option is positive? (Though it should have been posted in other chapter, I am posting it here for the sake of convenience.)
You actually answered it yourself 🙂
Think of gamma as a representation of the sensitivity of an option to the underlying\’s price movement. ATMs clearly are the most sensitive. Given this, the gamma is highest for ATMs.
About Theta – not true. All options lose money with respect to time.
hello karthik,
i have a question which may sound funny. i have gone through all chapters till now but there are too many mathematical calculation & seriously looks horrible to me (not a academic person at all). my question is that-
\”suppose i am very bearish on a particular contract and i decides to buy a way far out of money put with next month expiry (since i am extremely bearish on it) which is available at almost free of cost lets say may be around Rs. 0.80 – 1. so before initiating the trade should i look for delta & gamma, when there is nothing on stake.
No, if you are convinced about your view, you can do this….i.e buy way OTM option with ample time to expiry.
Sir,
Does premium also comes to zero on the day of expiry?
No, the value of the premium will depend on the intrinsic value of the option.
sir,
how the delta and gamma are calculated ?
Black & Scholes model helps you calculate these values.
In the example of calculating risk using Gamma, shouldn\’t we consider negative sign before the number of lots because we have taken a short position?
i.e. position delta = -10 * 0.5 = -5.
then, when the market moves against me, new gamma = 0.05*70 = 3.5.
therefore, shouldn\’t the new delta be = -5+3.5 = -2.5?
Please correct me wherever I\’m wrong.
No gamma is a positive number…and remember, we are only trying to estimate the risk in terms of number of lots here.
The Gamma of a futures contract would be 0 right?
(As the differentiation of a constant is always 0)
Yup…this also explains why the delta of a futures is a constant 1.
New Delta = We know the Put option gains delta when underlying goes down, hence – 0.5 + (-0.04) = – 0.54.
I think here should be -0.5+0.04= -0.46
Makes sense, I guess someone earlier had posted a reply as well. Request you to double check. Thanks.
New Delta = We know the Put option loses delta when underlying increases, hence – 0.5 + 0.04 = – 0.46.
I think here delta= -0.5-0.04=-0.54.
Yes, Puts lose delta when market moves up.
On Sec 13.2 Estimating Risk Using Gamma
Position – Short
When the underlyning moved by 70 points would the position not slightly become OTM for him and delta of the over all position be reduced rather going up from 0.5 to 0.15 rather than 0.85
He is short call and the assumption is that Nifty moves higher by 70 points, so the option becomes ITM.
Hello Sir, I have the same query in Section 13.2(Estimating Risk using gamma)
As we are shorting the call option and Nifty is increasing by 70 points, won\’t the moneyness change from slightly ITM to OTM and hence the delta be less than 0.5?
No Sanat, think about it from the strike and the spot perspective. With 70 point increase, the 8400CE becomes more ITM right? So the delta actually increases.
Hi
Right now I am holding 12900 qty of option 9500CE at the average price of rs.3.00. But currently the price is rs.1.15. Can you suggest what can I do now.can I hold it or sell it. Another 7 trading days only available for match. The loss is 23 k now.
Vijay, this really depends on your conviction. If you feel the markets can make a move higher then 9500, then please do hold, else sell it and book your loss.
In \”Case 1 – Underlying moves up by 10 points\”, the new delta should be -0.5 – 0.04 = -0.54 as delta is loses its value when the underlying price goes up so its value must decrease. It is also clear from graph of delta vs spot price for put options that value will decrease. Similarly in case 2 answer should be -0.46.
Delta of a Put option decreased when the underlying increase, hence-0.5+0.04 = -0.46 is correct. Remember, for Put option, delta is negative to capture the effect of decrease in delta for increase in underlying.
Karthik
Please suggest if this summarization is correct understanding:
Type of Option Long or Short Market Status Delta & Gamma Effect Long / Short Gamma
=================================================================================
Call Long Moves Up Delta + Gamma X (+Points) Long Gamma
Call Long Moves Down Delta + Gamma X (-Points) Long Gamma
Put Long Moves Down -Delta + Gamma X (-Points) Long Gamma
Put Long Moves Up -Delta + Gamma X (+Points) Long Gamma
Call Short Moves Up Delta + Gamma X (+Points) Short Gamma
Call Short Moves Down Delta + Gamma X (-Points) Short Gamma
Put Short Moves Down -Delta + Gamma X (-Points) Short Gamma
Put Short Moves Up -Delta + Gamma X (+Points) Short Gamma
I have difficulties in understanding this one, maybe I\’m missing something here. But my gut says you could be right 🙂
Sir since ITM is similar to future contracts, is it wise to trade them like futures using technical analysis with a lower margin ?
Thank you.
They behave similarly but they are not the same 🙂 …having said that, yes you can attempt to do that for deep ITM options.
I have doubt (don\’t know if it is already answered)
How do we calculate Gamma and Delta in first place??
Its derived from the B&S model.
Thank you Sir…
Welcome!
I have not disrespected your ways, it\’s me poor in calculus. :\'(
It means if price movement rests its value changes but during the movement, no value get affected? And if the movement lasts for less time the change in premium is high? Am I wrong somewhere?
Sorry Nil, I\’m bit lost on what you just said – can you please break this down for me? Thanks.
1. When spot price starts to change, the other values of an option get affected once the spot price reached a higher/lower value than earlier.
2. The values don\’t change until the spot price reach a predetermined price (either high or low)
3. If the spot price shows a big movement within few moments then the premium changes rapidly or price movements in large periods gives lower rate of premium change
Summary: Spot price 8326 changes 70 points twice within less time than the change of 140 points.
So, Big movements within less time , Higher premium
Big movements in higher time, Less premium
Hope you have understand my confusion.
Looking for your reply
This is somewhat true – \”Big movements within less time , Higher premium
Big movements in higher time, Less premium\”.
This one is not correct – \”The values don’t change until the spot price reach a predetermined price (either high or low)\”
Thank you, Karthik. Your quick response makes me more enthusiastic to tackle further. Hope you won\’t mind if I come back to you again.
Please do fee free to post as many queries as you want, it will only enrich the forum!
Hi Karthik,
Thanks for your way of teaching… it\’s good.. I missed the opportunity to read much earlier. Now come to the above point…
Problem is : There is a difference in premium when calculating of movement of 70pt + 70pt & in single stroke 140pt.
As per your one of the Answer the Delta movement is real time… If we calculate for every point movement from 1 to 140 separately
we will get the correct Premium… right?
Thanks.
Yes, the continuous calculation is the best approximation to the actual value.
Sorry Karthik, if I have confused you with my confusion. My question was not about the directional view rather it was on the premium change that took place from OTM to ITM in your example.
Nifty Spot = 8326
Strike = 8400
Option type = CE
Moneyness of Option = Slightly OTM
Premium = Rs.26/-
Delta = 0.3
Gamma = 0.0025
1st example
Nifty spot raised 70 points up i.e. (8326+70) = 8396
@8396
Change in Premium =0.3 * 70 = 21
New premium = 21 + 26 = 47
Change in delta =0.0025 * 70 = 0.175
New Delta = 0.3 + 0.175 = 0.475
New Moneyness = ATM
2nd example
Nifty spot raise another 70 points up i.e. (8396+70) = 8466
@8466
Change in Premium = 0.475 * 70 = 33.25
New Premium = 47 + 33.25 = 80.25
Change in delta =0.0025 * 70 = 0.175
New Delta = 0.475 + 0.175 = 0.65
New Moneyness = ITM (hence delta should be higher than 0.5)
Here in the above two example 8400 Call option has moved from Slightly OTM to ATM and then to ITM giving a total premium of 80.25.
Now if Nifty change for 140 points up in one step rather in two as above, say
Nifty Spot = 8326
Strike = 8400
Option type = CE
Moneyness of Option = Slightly OTM
Premium = Rs.26/-
Delta = 0.3
Gamma = 0.0025
Nifty moves up by 140 points i.e. (8326+140) = 8466
@8466
Change in Premium =0.3 * 140 = 42
New premium = 42 + 26 = 68
Change in delta =0.0025 * 140 = 0.35
New Delta = 0.3 + 0.35 = 0.0.65
New Moneyness = ITM
Why there is a big difference in the case of premium when the OTM transits to ITM in both cases? So my question is how to rectify such confusion, not directional view?
My bad, I completely mistook your question. There are two explanations for this –
1) Mathematical explanation – Technically speaking the change in premium, delta, and gamma are all defined for 1 point change in the spot price. So when I say there is a 70 point change in spot, I tend to directly multiply the 70 points change with delta (or gamma) to get the premium value..but note this is just an approximation. To get the true value for a 70 point change in spot, I will have to calculate the change in premium by changing the value of delta (and gamma), for 1 point at a time….and I will have to iterate this 70 times. This is when when i get true value of the premium. In fact gamma/delta are instantaneous values and I will have to do this one step at a time. An alternate way to do this is would be by integrating (recall your school calculus) over the change in premium.
2) Easy explanation – Note, when the spot price changed 70 for the 1st time, the delta changed from 0.3 to 0.47 and for the 2nd 70 points, the change in premium occurred on a higher delta, therefore higher premium. Whereas when you took the 140 point change directly, this happened on a smaller delta i.e 0.3, thus leading to a lesser premium when compared to two 70 point change
Hope this clarifies.
Calculus? You are kidding right!
But thanks, somewhat you have put me in one step further to dealt with my confusion although I still have to ask you for some more recognition
Say at 10 am = Bought 8400 CE @ 26 (Slightly OTM), spot 8326
11 am = Spot goes to 8396 @ 47 (ATM),
12 pm = Spot goes to 8466 @ 80.25 (ITM)
or else,
at 10 am = Bought 8400 CE @ 26 (Slightly OTM), spot 8326
12 pm = Spot goes to 8466 (140+) @ 68 (ITM)
So if I want to square off my position at 12 pm what will be the consequence according to the above follow up?
Not kidding 🙂
Calculus plays an important role in derivatives!
Either ways, the same explanation that I gave above holds true. Also remember when such a rapid move happens on a intra day basis the effect on premiums will be much higher.
Hey Karthik,
Your every response to public doubts and the articles encourage people to trade before they opt out due to risk taking in markets.
I got confused with the below points, hope you\’ll rectify
1. In your 1st two example showing a change in the delta with respect to Gamma with 70 points up (in each) changes the moneyness from OTM to ATM and lastly to ITM giving a premium of 80.25 keeping the New Delta at 0.65.
My question if Nifty changes by 140 points up directly (irrespective of 70, 70) although the moneyness becomes ITM from OTM. But giving a premium of 68 at Delta 0.65.
How to get a proper view on this ?
2. Every Underlying or Index has it\’s lot size stated on NSE website. Can we choose lots below the stated. Say Nifty has 75 market lot, can we take 20 lots for trade or we have to trade on 75.
The directional view has to be developed based on TA, FA or say quants. Check this – http://zerodha.com/varsity/chapter/getting-started/
No, you cannot change the lot size, you will have to go with what the exchange prescribes!
Above you mentioned \” Notice the gamma value is low for OTM Options (80 and above). This explains why the premium for OTM options don’t change much in terms of absolute point terms, however in % terms the change is higher.\”, I get that premium doesn\’t change much in terms of absolute points because of low delta but how does low gamma affect relative change in premium?
Well, if the gamma is low, then the premiums don\’t change much. However if the volatility increases drastically or if the market moves in favor then option premiums for low gamma options tend to move…this is when you will see OTM options doubling in value. Recent example was the way L&T options reacted to a 14% increase in the stock price.
Dear Karthik Sir Thanks for yet another good article on options on scientific background. You triggered my memories on Differential Calculus and Physics. The delta vs spot_price curve looks to have a perfect mathematical pattern. I found the curve y = 1 / (1 + (1/(x^4))) is best matching the delta vs spot_price curve. Let O be Deep OTM, A be ATM, I be deep ITM and S be spot price. Then x = ((O – S)(A -I)) / ((O – A)(S – I)). If you plot this, you can see the curve created matching delta curve. So gamma is first derivative of Y = 1 / (1 + (1/(x^4))) which is Gamma = (4(x^3)) /( ((x^4) + 1)^2)
Yes Gamma is the 1st order derivative…in fact you can differentiate this further to get the 2nd order derivative :). 2nd order is used to hedge posistions especially when you are running a huge trading book. For small retail positions this is not really required.
several time i see in some website \”don\’t short put option (normally)\” , can you please explain….
Yes, simple reason being that the panic spreads faster than greed, in other words its much faster for the market to fall 100 points than go up 100 points. Hence shorting options can be a bit scary.
This is in response to your trick question on GAMMA.
I feel GAMMA does not apply to futures as the DELTA is constant ie 1 for FUTURES.
Please let me know wether I am right or wrong.
Bingo 🙂
dear karthick,
i have a logical doubt . suppose the nifty spot is trading at 7800 , and i decide to buy 7600 call option it is deep itm contract. BUT IF IAM WRITING THE SAME 7600 CALL IT WOULD BE AN OTM CONTRACT ISNT IT. THE CONTRACT WHICH IS ITM FOR AN OPTION BUYER WOULD BE OTM FOR AN OPTION WRITER ISNT IT
No!!
A option is either ITM, ATM, or OTM and it remains the same for both option buyer and seller. In the example you have quoted the option will be an ITM option for both buyer and seller.
Also i wanted to know that does gamma have a range like that of delta ?
Not really, Gamma peaks for ATM options and cools off for ITM/OTM options. Hence the gamma graph looks like an inverted parabola.
Since the derivative of a constant is zero .
Delta for the future contracts is constant and hence the gamma for future contract would be zero
Alternatively – If Delta = Gamma * change in the spot
so delta = 0*Change in the spot = 0
Perfect!!
CONCERN REGARDING EXAMPLE MENTIONED IN POINT 13.1 :-
1) first we consider 70 points upwards , premium appreciates .
instead of considering a 50 point downward movement . let us consider a 70 point drop .
in this case the underlying is back to original state with no profit & no loss .
but when we calculate new premium , it is a t a loss and depreciates to 36.85 ….. am i correct or have i made a mistake ?
2) CASE-2 :-
the underlying falls 70 points and gains back 70 points…. again no profit ,no loss
but in this case also , the premium is at a loss at the value = 34.75 .
PLEASE DO CORRECT ME IF I AM WRONG .
in this kind of scenario , why & when should anyone consider option trading other than spot or future markets ?
thank you
You need to factor in the fact that with the change in underlying both the delta and Gamma changes. The calculations in the next step should be considered with the new values in perspective. Hope I\’m not confusing you more 🙂
Hi sir
I am really thankful to you for providing so many insightful articles. Its very easy to read and best part is its applicability in the real scenario. You are amazing.
I have one query. In 13.2 example … since we are short on 10 lots Nifty 8500CE so Delta would be -ve as i have done below. Please clarify.
Number of lots = 10
Position Delta = -10 * 0.5 = – 5
Perfect!
Dear Karthik,
After getting inspired I am planing to write Call options that are slightly OTM.
Could you please tell when exactly an option is considered to be ATM. Is it when strike Price falls within some price band around spot price say when Strike Price = Spot Price ± some %age of Spot price ? What is that %age ?
What ideally should be delta, gamma and theta values to write OTM call options ?
ATM is when the strike price equals (or approximately equals) spot price.
Also please dont write options early in the series, wait for few…its best to write options after 15th of …also please avoid writing ATM options.
Good luck.
Dear Mr Rangappa,
At the end of Para 13.3 you made two statement as given below:
(a) Never short ATM or ITM option with a hope that they will expire worthless upon expiry
(b) OTM options are great candidates for short trades assuming you intend to hold these short trades upto expiry wherein you expect the option to expire worthless.
I couldn\’t understand the basis of these statement.
Would be grateful if you could explain it.
Both the statements hinges on the same fact – towards the expiry OTM and ITM options have a great chance to remain OTM or ITM, hence they can expire worthless….therefore they are great candidates for shorting. Whereas ATM could be a bit tricky…it has a 50 – 50 percent chance of expiring as a worthy contract/not worthy contract…hence no point taking the risk to short these options.
Thank you for your explanation. Now I feel how silly my doubt was. ???
🙂
Zero
As we know from elementary mathematics that \’derivative\’ of a constant (i.e. delta = 1) is 0.
As the vehicle is moving at a constant speed, gamma for Futures would be Zero :p:p
Please correct if wrong :d
Yup!
The gamma for Futures (also other cash products) where delta is 1 meaning the rate of change in price is in perfect correlation to the change in Price of the underlying, would be Flat, since there is no curvature on the Delta curve during the life of the product.
Sir, Today Heromotor spot price went up from 2714 to 2738 almost 24 rs up. but ce 2850 for July hardly changed from 4.6 to 4.65 (.05) only whereas ce 2850 for August rose from 33.0 to 45.0 significant rise. Why its so. Cause July ce will have less time value hence IV change shall be % wise more and August ce will have more time value so effect of IV shall be less % wise. Also, what about IV change both should be same or not? This is crucial from selecting not only strike price but also expiry date also. Please elaborate. –Thanks
Yes, what you said is true – we have less time for expiry in July series where as the August series has more time to expiry. Strike selection is an important topic, will certainly talk about this.
thanks for your reply one more question/confusion, point 3 &5 below the greeks graph says
\”Notice the gamma value is low for spot values between ATM and ITM (80 and above).\” — point 3
\”The gamma starts to decrease when the strike starts to transition from ATM to OTM (80 and below)\” — point 5
Should it not be ITM (80 and BELOW) for point 3 and
OTM(80 and ABOVE) for point 5?
or am i really confused?
Hey, thanks for pointing this out. I had kind of messed up this narration. Have fixed it now, please do have a look to check if it makes sense.
(y) looks good now , thanks
Thanks for pointing it!
Hi
When i go to http://www.moneycontrol.com/stocks/fno/marketstats/options/gainers/index.php
and filter for top gainers , all options , CE , all expiry . I seem to get companies with phenomenal growth for the day (eg 14900% in a day for Bajaj auto CE 2700 today )
but when i check that same option at that same strike price and same expiry i get completely different numbers in the option chain for Bajaj Auto.
Am i doing something wrong ?
These numbers are different every day across moneycontrol and NSE option chain .
Mehul – I\’m not sure why this happens, I would suggest you stick to NSE website, they provide the most reliable market information.
Awesome is the word for your efforts, knowledge and presentation skills Karthik, I am trading (or I must say gambling 🙂 ) options since 2007 with absolutely no knowledge of all these factors and now I know why am I in huge loss :). I am still unable to grasp all of it but this is the best thing so far and my dream of becoming full time trader now has a new hope !!!
Question :- When does the delta change for given option? for example if spot is at 8000 and 8050 ce is OTM with delat say 0.3 and spot moves 100 points to 8100 in 4 hours making 8050 ITM at what point will delta change? is it time dependent i.e end of market or start of market or is it price dependent i.e every 20 points etc?
Thanks for the kind words and appriciation 🙂 I hope you find all the success in trading and everything else.
About your query – Delta (and other greeks) changes real time as and when the markets move.
There is a mistake from you in chapter number 13.3.
You wrote that when the spot price is below 80, the call option with strike 80 is in the money and above 80 is out of the money. It should be other way around. Spot above 80 should be in the money while below 80 should be out of the money.
PLEASE CORRECT THIS MISTAKE>
Not a mistake Amarjeet, it is correct.
We are talking about a call option here. So strike is 80, spot is 80…so 80 is ATM, all strikes below 80 (like 70,75) are all ITM and above 80 (85, 90) are all OTM.
Gamma of futures contract should be \”zero\” as the delta of futures contract does not change at all so the rate of change is constant so the Gamma of futures should always be constant and because change in delta of futures contract because of change in spot price change is zero so the gamma of futures contract should be zero
Perfect!!
The gama decreases when a call option transits from ATM to OTM and ATM to ITM. due to the lower gama the change in premium is minimal with respect to the change in underlying. since, the ITM call options have a higher delta the change in premium in points term is higher even though the gama plays the drag. would this be a correct assessment karthik?
You said \”The gama decreases when a call option transits from ATM to OTM and ATM to ITM. due to the lower gama the change in premium is minimal with respect to the change in underlying\” —-> This is correct, however do remember in terms of absolute points change it maybe minimum but % wise, it will be a reasonable number.
\”since, the ITM call options have a higher delta the change in premium in points term is higher even though the gama plays the drag\” —–> Right on. However Delta is highest when Options are near ITM…but at ITM gamma is lower. ATM delta is around 0.5, but the sensitivity at this point is high as the gamma is the highest at ATM.
Hi Karthik….
When would you upload Option Strategies Module?? I am eagerly waiting for the same….
Regards,
Abhijit
Hi Karthik…
When would you upload option strategies module??….I am eagerly waiting for the same…..
The current focus is to finish Option Theory…few more chapters here…once we are done with Options Theory, we will start work on Options Strategies. I guess sometime next month we should get started on Options Strategies.
Hi Karthik,
Thanks for reply… and also I would like to thank you for such good quality, easy to understand study material by you on Varsity. I never seen such material on internet and too at one place. I am new to share market, I was doing trading blindly, now stopped everything and doing study with Varsity modules. Really thanks for your great efforts. Please keep it up…God Bless You…:)
Regards,
Abhijit
Thanks for your kind words Abhijit. It is indeed both encouraging and motivating for us. Please stay tuned for more.
In extension of Amit post: Actually the spot movement depends on many factor like TA, fundamentals and current news, global developments etc. This is a normal concept. I want to know is it possible that TA will be always dominating other factors? How to judge the more effective factors. At times we have seen that even after the quarterly results are good the script price goes down and vice versa. Is it that there TA was having more power? Examples are SBI, Infy, Kotak B etc.
You always need to take a holistic view. There are many factors that affect the stock price form a short term perspective, although only business fundamentals matter in the long run. As a trader you need to develop a sense for all these factors and never isolate a certain factor as more dominant. How to judge these factors and assign a weight to the price movement is something you will develop as you spend more time in markets.
Thanks,
But options and future are valid for 1 month only or future may be for few months which I thinks is shot term and we have to analyse the market like a short term trader. Hence for Options all factors will matter. How to slowly rope in all factors may be of option\’s trading. This was my point.
Understood your point, one of the readers (I guess Amit) suggested that I do a case study where I consider all points and factors and plug things together. I think thats a great idea I will do it towards the end of this module. That should answer most of your concerns.
Good work Karthik. Really liked the way the concepts has been put across in a very simple language. Is it possible to provide a module to explain starting from TA on an underlying to identify the direction of the underlying and thereby identifying a strike price using greeks.
Great idea Amit, thanks. Towards the end of this module I will include a case study based on your suggestion.
Is it possible to define gamma w.r.t. delta in place of underlying price as the second derivative may define based on the first derivative also apart from the base variable. Like distance, change in distance is velocity and change in velocity is acceleration. This may bring the delta calculation direct.
My second question is that why we have to worry more about gamma when options are at ATM or otherwise as gamma is constant for practical purpose………………..Why short position are more affected by gamma?
Thanks
Yes, you can treat Gamma as the 1st derivative as Delta, no harm with that. When the option hits ATM status, then Gamma hits maximum value. See the graph posted in the chapter. Also since Gamma is always a positive number, shorting options carry the risk of \”Short Gamma\’. Hence I say short positions carry \’short gamma\’ risk. However this should discourage you for shorting options, juts bear in mind the fact that when you short Options, you are short gamma.
Sir we have range for delta +0 to 1 & -0 to -1. Similarly what is the range for Gamma so that we can judge high & low.
Its difficult to estimate the range for Gamma…from my experience a Gamma of 0.005 is considered quite high.
2.Values below 80 is OTM and values above 80 is ITM. Sir This is confusing. When ATM is 80 the >80 is OTM and <80 is ITM. Is my statement is Ok?
Oops, thats a mistake. Since its a call option, it should read \”Values below 80 as ITM and values above 80 are OTM\”. Thanks for pointing this out, will make the corrections.
What earlier printed was correct right. Because it is call (80CE) and hence Spot price below 80 the call becomes OTM and spot price above 80 makes call to be ITM.
Assuming the spot is at 80, strikes such as 60, 70, 75 etc are all ITM, and above 80 such as 85,90,100 are all OTM.
Hi Karthik,
First of all; excellent ,excellent work…..I have read a lot of material (books, websites, platforms, trading mentors etc etc) but none of them have been as concise and simple as your content is. You can really \”Teach\” ..hats off. ….
Coming to my question:
1) If i am a regular nifty futures trader, trading say 10 lots on a regular basis, i can instead trade 20 lots of nifty ATM options (only buy CE/PE) for the same effect (positive or negative return) …..If my trade is in my favor and delta keeps on increasing, i need not adjust my position since the increased delta is improving my return……However, if it is going against me , i may need to adjust (reduce) my position based on the delta of the CE/PE i am holding???? If i am only buying ATM options, position going against me may also mean that delta is reducing ? and therefore my risk may also be coming down? It is more a question of the rate of change…..i.e the reduced position delta is within my initial risk range or not???
Thanks for the kind words and encouragement Prashant 🙂
I\’m not sure if I\’ve understood your question completely…but if it is what I think, then here are my thoughts –
If you buy an ATM option and the position starts to move in your favor the both Gamma and Delta works in your favor as the option transitions from ATM to ITM. However if you short options (ATM in this case) then more than the Delta you need to be worried about Gamma as you are essentially short Gamma when you short options …and ATM options have the highest Gamma value so you are taking on a large risk.
This also means you need to constantly tweak your position to ensure you are always short ATM option and not really ITM or OTM. This incurs logistical expenses…for that sense its better to just trade futures. However there are many trading secretaries (like Dynamic Delta hedging) which requires you to substitute options for futures. We will talk about it more in the subsequent modules.
Ok Thanks for your response…..For clarity, lets take the below scenario…..As of now, assume i am long 10 futures at 8471. I have my stop around 8400……..Now lets assume instead of futures, i have 20 option lots of 8450 CE…….When it goes in favor, it will probably give me more than futures….But if it goes against me, lets say Nifty closes at 8430 tomorrow, am i likely to lose more money than in options compared to what i would have lost in futures…Guess i am trying to understand what happens to delta when a position goes back into slightly OTM from ATM and then if the position needs to adjusted accordingly (in case of LOng CE @8450)
Long futures 10 lots = Long ATM calls 20 lots
In the example you have quoted you are comparing long futures 10 lots @ 8471 with 20 lots of ATM options ATM strike. ATM has a delta of 0.5.
So if the market moves from 8471 to 8430, then it falls by 41 points.
On Futures you will lose 41 * 10 * 25 = 10250
On Option you will lose 41*0.5*20 *25 = 10250 (approx)
Hence Long futures 10 lots = Long ATM calls 20 lots.
But after this move the story changes. The Option is no longer ATM …it becomes OTM, with delta of lets say 0.4. Consider the market moves 60 points up from 8430 to 8490 –
On futures you make = 60 * 10 * 25 = 15000
On Options you make = 60 * 0.4 * 20 * 25 = 12000
So as you can see once the option moves away from ATM status, it no longer becomes a surrogates for the futures contract. In order to maintain the equivalence you always need to adjust the option to ensure you are dealing with ATM options.
Karthik – I have heard a lot about this open source software \’Options Oracle\’ by Samoasky technologies. What is it used for and how is it beneficial?
I\’ve personally used Options Oracle extensively, I must admit the software was one of its kind. I guess they stopped supporting Indian markets and hence I lost interest..or something else happend which stopped me from using OO. Cant recollect the exact reason.
Some of the things I used to do with the software –
1) Calculate Option Greeks and Option Prices
2) Plot P&L of strategies upon expiry and before expiry
3) Stress test the strategy for change in inputs such as volatility
4) Plot Volatility cone and volatility smile
5) View max pain values
I will include all these topics in the coming chapters, except for Max Pain…which will be included in the next module.
Does PI support all the above mentioned features?
No, it does not for the moment. However we will probably have a tool to evaluate these parameters sometime soon.
Thanks karthik
You guys are doing an excellent job
What software do you use now
Any recommendation for beginners and pros
I use Kite.
Where can we find all these delta gamma theta in kite or in PI
can we find these in kite mobile app also?
Not as of now, but do check this – https://zerodha.com/tools/black-scholes/
Thanks for easy explanation on gamma. You had asked about gamma for the future contract. It is having fixed delta, 1 so no change in the delta means gamma of future contract will be zero. Please correct me if I am wrong.
Perfect 🙂
Hi Karthik,
Why Gamma of future contract would be 0?
It should be 1?
As new delta = 1(Delta)*0(Gamma) = 0
but if Gamma is 1 then
As new delta = 1(Delta)*1(Gamma) = 1
You do have a point, Amit. I\’ll get back to you on this.
The change in delta is 0 (gamma). Therefore new delta = old delta + (gamma *delta).
i.e. new delta = 1 + (0*1) = 1
same ans Zero
Gamma of Futures will be ZERO due to nil change in value of DELTA which is 1.
Yes, thats right, Ajay.
hi kartik
thanks for clearing doubt.
i like your new pic.
waiting for chapters on vega and theta. when will you upload???
Thanks 🙂
Working on the Theta chapter…should be up by next week!
Sir, why u removed quantitative concepts module?
We have it Keshav. Its just that we decided to include the taxation module we have removed that for time being. Will certainly have a module on that topic.
Thanks for the excellent work that you are doing Karthik Sir.
How many chapters have you planned for Options Module?
Not sure how many chapters but there are at least 5-6 major topics that needs to be covered. This may happen over the the next 3-4 chapters (or more).
I think I know today why they say that don\’t trade options if you are a novice and blindly buy OTM options with the hope that you\’d become rich overnight 🙂
I can appreciate complex mathematics Karthik – Would you suggest any book in particular (preferably by an Indian author who has kept indian indicies and stocks in perspective) for options? I am suddenly getting very interested and I will like to utilize the interval between which the chapters are posted here.
Couple of other generic questions:
1. Does it make sense to trade naked call/put options with say 1 lot nifty or is it just a bad idea altogether?
2. In your practical experience, are there folks who only trade options and nothing else?
3. In your practical experience, is it very difficult to make money with options? Also, what is better? Trading intraday or with 1/2/3 months time frame?
4. This one is really from the heart: While we know a lot of super rich value investors, why do we not hear of any super rich derivative traders? (Please do not take this question otherwise – Being an individual retail investors feels like a closed door with not much authentic information. Since you are hands-on in the field, you\’d be the appropriate person to ask)
Really looking ahead!
Saurabh – Options trading is a different animal altogether. One needs to be aware of many different aspects involved. I\’m really not sure which book to recommend, I found some of the books that I\’ve read previously quite shallow. Maybe I\’ve not updated my library so may not be the best person to answer this for you.
Coming to your other questions –
1) No harm trading 1 or 2 lots of naked options – lot size is not much so you don\’t risk anything significant. But neither will this create any significant wealth for you. In fact I do this quite often just to test few random ideas.
2) Yes there are many people trading just options – you can trust me on this
3) You certainly can make money trading options – but you need to set your expectations right (ref section 1.3 – http://zerodha.com/varsity/chapter/background/). Trust me if you can consistently make 2% a month trading options you are doing a phenomenal job. Unfortunately most people perceive this a small return and aim for a higher return, in the process blowing up their account. So my take on this – aim for small but CONSISTENT return. Also, I prefer to trade with slightly longer duration than intraday. I avoid intraday because I don\’t find the time and commitment it requires.
4) You have a valid point – I agree we all get to read about successful Value Investors but not many derivatives traders. I really dont know why. But this does not mean they dont exist. There are many traders who generate significant amount of money trading derivatives…cant speak on behalf of other brokers but we do have some really good traders with us. We had the opportunity to interview some of them here – https://zerodha.com/z-connect/category/zerodha-60-day-challenge
Good luck and please stay tuned. I can guarantee you that Zerodha will put up everything you need to know about Options trading, just give us a little more time 🙂
Thanks for the inputs Karthik.
Does zerodha provide a virtual trading a/c? It would be of great help if there is. I tried the one on NSE (Pathshala) but don\’t get how it is showing my MTM as +ve when I in fact know that it is in the red. A simulated environment would really help!
Saurabh, we do not have a virtual trading platform as of now. But that is certain something we plan to do in the future.
sir what is naked options?
When you buy an option without any hedge, then its referred to as a naked option. All single option positions are naked. For ex : buying a call, buying a put, shorting call etc.
Hi kartik.
Very very thanks for this chapter. Although chapter has some minute printing mistakes of decimals and some calculation mistake(which doesn’t matters at all) but it is a very good and clear chapter which boosts my concept about gamma.
I have two questions-
1. In the topic estimating risk using gamma you have given-
New position delta = 0.85*10=25. What is means??? Please clarify
2. Suppose , for any underlying–
Spot price=8000
Strike price=8200
Premium=100
Option type=CE
After sometime,
Spot price 9000
Premium=800
If one square off his position at current price, will his position be square off because deep itm options have very less volume. Is any volume issue occurs???
Futures have gamma=0, since delta is always 1(answer to your question)
Glad you liked it 🙂
New position delta = 0.85*10=25 —–> this is an error it should be New position delta = 0.85*10=8.5
You can square off the position anytime you want…as long as there are volumes (counter party).
You are right on the value of Futures\’s Gamma 🙂
So what if there is no volume my position will be still open?? In the meantime if market reverse should I had to cut position in loss??
If there are no volumes, then there is not much you can do. You should cut if you feel the need to and there is sufficient volume to do so.
It is really commendable work that you are doing.
My doubt is how is the gamma value arrived at?
Gamma value (in fact delta, theta, and vega) values are all calculated using a mathematical model called \”Black & Scholes Options Pricing Model\”. We will briefly talk about this in the coming chapters.
hi, went through the chapter and found the presentation a little harried than the others. calculations were off the mark and in places no decimal points are incorporated. karthik, were you not involved in this chapter?
Raj, thanks for your feedback…can you please point out the errors, will make the necessary changes?
so what do you think the gamma of the Futures contract is? 😮 ans it pls.
Zero
The gamma of the future contract will be Zero.
Yes Sir.
Hello sir,
Thank you for helping us. Sir my concern is with the Delta vs. Spot curve for put option. As spot value increases the delta also increase.
Case 1 – Underlying moves up by 10 points
Delta = – 0.5
Gamma = 0.004
Change in underlying = 10 points
Change in Delta = Gamma * Change in underlying = 0.004 * 10 = 0.04
New Delta = We know the Put option loses delta when underlying increases, hence – 0.5 + 0.04 = – 0.46
Case 2 – Underlying goes down by 10 points
Delta = – 0.5
Gamma = 0.004
Change in underlying = – 10 points
Change in Delta = Gamma * Change in underlying = 0.004 * – 10 = – 0.04
New Delta = We know the Put option gains delta when underlying goes down, hence – 0.5 + (-0.04) = – 0.54
Kindly pardon me if I have misunderstood something. Please help me in this.
Shakti, thats right. As the underlying decreases, the PE option delta gains in value and as the underlying increases, the PE option delta loses in value.
Thank you sir, just got it. Here negative sign just shows that the if one gains other loses value.