

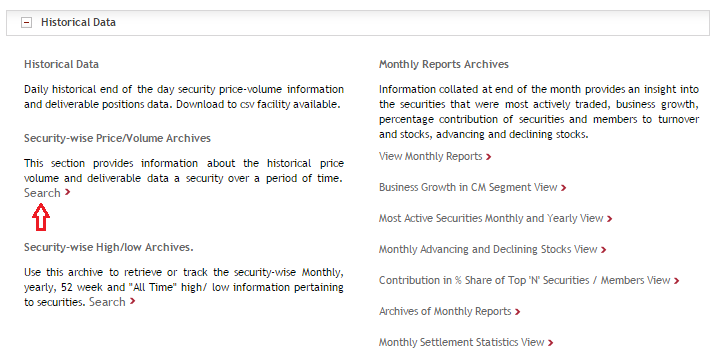
16.1 – Calculating Volatility on Excel
In the previous chapter, we introduced the concept of standard deviation and how it can be used to evaluate ‘Risk or Volatility’ of a stock. Before we move any further on this topic I would like to discuss how one can calculate volatility. Volatility data is not easily available, hence its always good to know how to calculate the same yourself.
Of course in the previous chapter we looked into this calculation (recall the Billy & Mike example), we outlined the steps as follows –
- Calculate the average
- Calculate the deviation – Subtract the average from the actual observation
- Square and add up all deviations – this is called variance
- Calculate the square root of variance – this is called standard deviation
The purpose of doing this in the previous chapter was to show you the mechanics behind the standard deviation calculation. In my opinion it is important to know what really goes beyond a formula, it only enhances your insights. In this chapter however, we will figure out an easier way to calculate standard deviation or the volatility of a given stock using MS Excel. MS Excel uses the exact same steps we outlined above, just that it happens at a click of a button.
I’ll give you the border steps involved first and then elaborate on each step –
- Download the historical data of closing prices
- Calculate the daily returns
- Use the STDEV function
So let us get to work straight away.
Step 1 – Download the historical closing prices
You can do this from any data source that you have. Some of the free and reliable data sources are NSE India website and Yahoo Finance.
I will take the data from NSE India for now. At this point I must tell you that NSE’s website is quite resourceful, and in terms of information provided, I guess NSE’s website is one of the best stock exchange websites in the world.
Anyway, in this chapter let us calculate Wipro’s volatility. To download the historical closing prices, visit – http://www.nseindia.com/products/content/equities/equities/equities.htm and click on historical data and select the search option.
Here is a snapshot where I have highlighted the search option –
Once you hit search, a set of fields open up, filling them up is quite self explanatory – just fill in the required details and hit ‘Get Data’. Do make sure you get the data for the last 1 year. The dates that I have selected here is from 22nd July 2014 to 21st July 2015.
Once you hit ‘get data’, NSE’s website will query your request and fetch you the required data. At this point you should see the following screen –
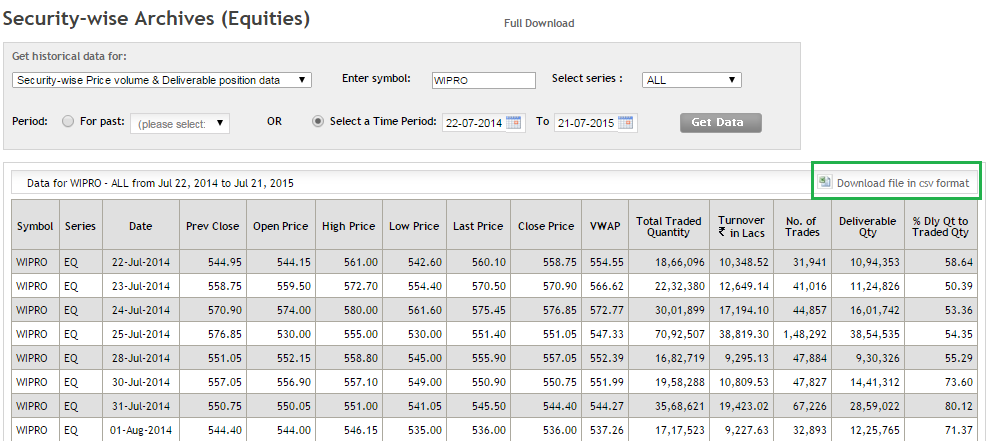
Once you get this, click on ‘Download file in CSV format’ (highlighted in the green box), and that’s it.
You now have the required data on Excel. Of course along with the closing prices, you have tons of other information as well. I usually like to delete all the other unwanted data and stick to just the date and closing price. This makes the sheet look clutter free and crisp.
Here is a snapshot of how my excel sheet looks at this stage –
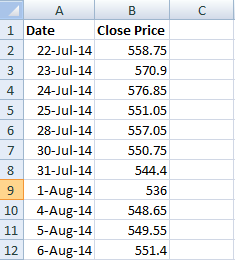
Do note, I have deleted all the unnecessary information. I have retained just the date and closing prices.
Step 2 – Calculate Daily Returns
We know that the daily returns can be calculated as –
Return = (Ending Price / Beginning Price) – 1
However for all practical purposes and ease of calculation, this equation can be approximated to:
Return = LN (Ending Price / Beginning Price), where LN denotes Logarithm to Base ‘e’, note this is also called ‘Log Returns’.
Here is a snap shot showing you how I’ve calculated the daily log returns of WIPRO –
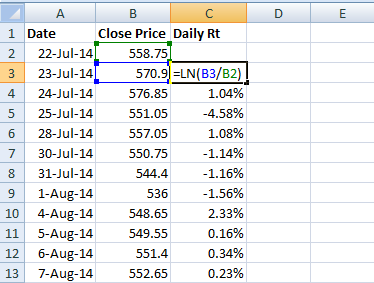
I have used the Excel function ‘LN’ to calculate the long returns.
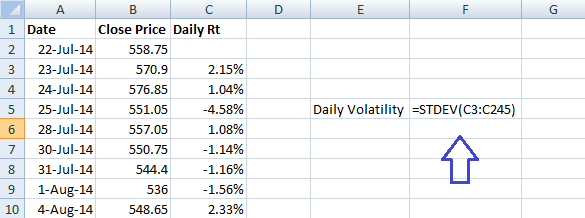
Step 3 – Use the STDEV Function
Once the daily returns are calculated, you can use an excel function called ‘STDEV’ to calculate the standard deviation of daily returns, which if you realize is the daily Volatility of WIPRO.
Note – In order to use the STDEV function all you need to do is this –
- Take the cursor an empty cell
- Press ‘=’
- Follow the = sign by the function syntax i.e STDEV and open a bracket, hence the empty cell would look like =STEDEV(
- After the open bracket, select all the daily return data points and close the bracket
- Press enter
Here is the snapshot which shows the same –
Once this is done, Excel will instantly calculate the daily standard deviation aka volatility of WIPRO for you. I get the answer as 0.0147 which when converted to a percentage reads as 1.47%.
This means the daily volatility of WIPRO is 1.47% !
The value we have calculated is WIPRO’s daily volatility, but what about its annual volatility?
Now here is a very important convention you will have to remember – in order to convert the daily volatility to annual volatility just multiply the daily volatility number with the square root of time.
Likewise to convert the annual volatility to daily volatility, divide the annual volatility by square root of time.
So in this case we have calculated the daily volatility, and we now need WIPRO’s annual volatility. We will calculate the same here –
- Daily Volatility = 1.47%
- Time = 252
- Annual Volatility = 1.47% * SQRT (252)
- = 23.33%
In fact I have calculated the same on excel, have a look at the image below –
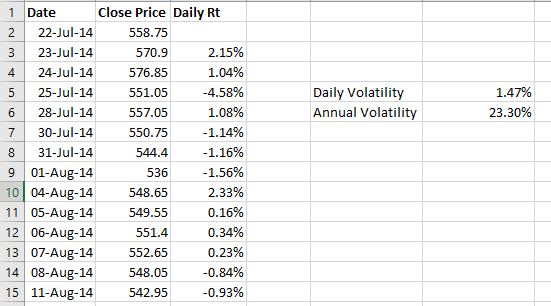
So with this, we know WIPRO’s daily volatility is 1.47% and its annual volatility is about 23%.
Lets double-check these numbers with what the NSE has published on their website. NSE publishes these numbers only for F&O stocks and not other stocks. Here is the snapshot of the same –
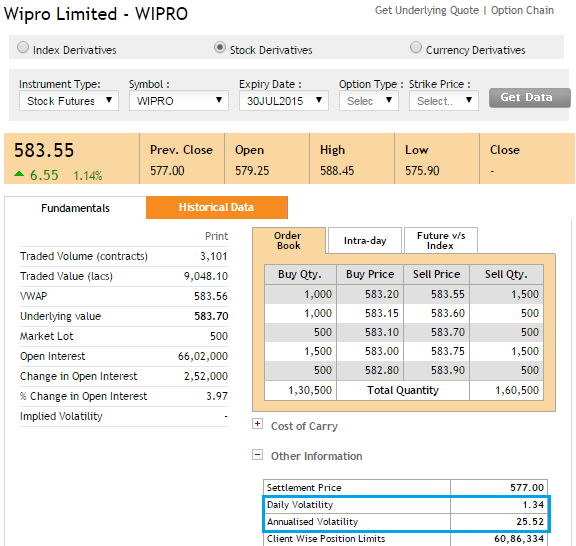
Our calculation is pretty much close to what NSE has calculated – as per NSE’s calculation Wipro’s daily volatility is about 1.34% and Annualized Volatility is about 25.5%.
So why is there a slight difference between our calculation and NSE’s? – One possible reason could be that we are using spot price while NSE is using Futures price. However, I really don’t want to get into investigating why this slight difference exists. The agenda here is to know how to calculate the volatility of the security given its daily returns.
Before we wrap up this chapter, let us just do one more calculation. Assume we directly get the annual volatility of WIPRO as 25.5%, how do we figure out its daily volatility?
Like I mentioned earlier, to convert annual volatility to daily volatility you simply have to divide the annual volatility by the square root of time, hence in this particular case –
= 25.5% / SQRT (252)
= 1.60%
So far we have understood what volatility is and how to calculate the same. In the next chapter, we will understand the practical application of volatility.
Do remember we are still in the process of understanding volatility; however the final objective is to understand the options greek Vega and that really means. So please do not lose sight of our end objective.
Please click here to download the excel sheet.
Key takeaways from this chapter
- Standard Deviation represents volatility, which in turn represents risk
- We can use NSE website to get the daily closing prices of securities
- Daily return can be calculated as log returns
- Log function in excel is LN
- Daily return formula = LN (Today’s Value / Yesterday’s Value) expressed as a percentage
- Excel function to calculate volatility is STDEV
- Standard Deviation of daily return is equivalent of daily volatility
- To convert daily volatility to annual volatility multiply the daily volatility by the square root of time
- Likewise to convert annual volatility to daily volatility, divide the annual volatility by the square root of time
As the steps taught earlier for example of billy and Mike and let the close price as runs then previous we add all the runs and average it and then subtract the average from the actual observation but now we are calculating percentage change in just previous price and current price as in daily returns steps. Please explain why it is different as I am unable to understand. In the last module first finding the mean then subtract it with each value then find the variance and lastly SD. BUT in this calculating daily returns steps is difficult to understand as mean will be different continuously.
https://zerodha.com/varsity/chapter/volatility-calculation-historical/
Excel link in this chapter is no longer available. Can you please check and upload it again?
Can you try downloading from another browser?
Hi Karthik
How would you calculate if there is a stock split in between? This is not only for volatility but for all other calculations in various modules where the data is required for extended period of time say 5 years or 10 years?
Thanks
Kalyan
Then you need to readjust the data and use the clean data for your calculations.
Thanks. Can you please consider adding a module on how to clean data for analysis when the time period is long say 5 years or more or there are many events like stock splits, takeovers or splits (like Tata Motors) etc?
This is a request from my side for your consideration.
Regards
Kalyan
Hey Kalyan, check this – https://youtu.be/MX-6rdHDPbE?si=HO-R00QpaVXxpiwA
Thanks
Happy learning 🙂
Hi Kartik
on NSE website I\’m unable sight Historical data for Nifty 50, thats to calculate daily returns and SD .
Ah, they must have changed the file location. I\’d suggest you contact them.
Hi Karthik I am unable to download the excel files from the click here option in the above mentioned topic
Can you try from another browser? Usually that works.
https://www.nseindia.com/report-detail/eq_security
https://stoxbox.in/mentorbox/marketopedia-old/options-trading/calculate-volatility-on-excel
I have found this. As you can see all the data is same as Varsity.
As they say, imitation is the best form of flattery 🙂
Hi Sir,
I tried to calculate the Annual volatility of Wipro dtd from 14th Aug\’24 to 14th Aug\’25 i.e of last year.
The result calculated as below:
Daily Volatility = 4.66%
Yearly Volatility = 74.01% (Daily X SQRT(252)
The same I checked in NSE website
Daily Volatility = 1.68%
Yearly Volatility = 32.10%
Why there is so much difference? or am I making any error while calculating?
Please help sir.
I am not able to paste the screenshot of NSE website.
https://www.nseindia.com/get-quotes/equity?symbol=WIPRO
I just paste the data from NSE website.
52 Week High (23-Jan-2025) 324.60
52 Week Low (07-Apr-2025) 228.00
Upper Band 265.81
Lower Band 217.48
Price Band (%) No Band
Daily Volatility 1.68
Annualised Volatility 32.10
Tick Size 0.01
There could be some difference, primarily due to the fact in the way volatility is computed – in our procedure we give equal weights to all data points to figure variance from trading perspective, but in NSE\’s method variance is computed largely from margins perspective. I think they give more weightage to the recent data points.
Thanks Sir for replying !
But what I should do here, Shall I go with our calculation for range?
One more question
Where to find the Nifty Daily and Yearly Std Dev ? As I can see the Stock\’s Std dev but same is not available for Nifty in NSE Website.
Or Am I missing anything ? Please guide.
Sandeep, I think its still there on NSE website, maybe they changed the location. Alternatively you can use AI tools to figure this now 🙂
Yes please, you can do that 🙂
sir i checked on nse website and they had given volatility estimates for non fno stocks as well. example gtl infra.
could you please comment on it\’s reliability.
Hello Sir,
Could you tell me the reasoning behind why do you take one year time period for volatility calculation?
To get a sense of the yearly volatility.
+Hello Karthick,
I like to thank you for your effort to educate us with such an approach which is so easy to understand. I just have a small doubt which is more related to the calculation. Just one doubt with respect to the below snippet
Daily Volatility = 1.47%
Time = 252
Annual Volatility = 1.47% * SQRT (252)
= 23.33%
How we came to a conclusion of 252 days since from my opinion it should be 243 days
Thanks Souvik, the idea is to take the total number of trading days. 252 is the usual number of trading days in a year.
for the daily volatility calculations of Wipro stock, we are taking the previous close and the current close into consideration.
Would it not be accurate and reflective of the daily volatility if we took (days close – days open)/days open
as a measure of the daily volatility.Would the results be different ?
Here, volatility is measured by the returns and on the price movement. So if the idea is to calculate volatility of price returns, then the current formula makes sense. However, if you want to calculate the volatility of price movements, then yes, what you suggested makes sense.
You have given a snap shot of Wipro details from the NSE website and have shown that the annual volatility matches the one which we have calculated from daily volatility.
But how is annual volatility calculated from first principles (not from daily volatility)
Will if be the Stdev of (close of the last day of the year – open of the first day of the year)/( open of the first day of the year) for the past several years ? Approx how many years should be taken ?
You can take last 1 year daily data Bhushan. That will work. Taking the last day or the tear and first day of the year will still give you just 1 day;s of data and not yearly.
No Sir, I haven\’t made any such changes.
I Calculated it purely based on what I read in this chapter & copied the data from the NSE site.
Kindly Enlighten me more?
You can check this Aditya – https://youtu.be/MX-6rdHDPbE?si=qbculG4XBhKvSm8P
Hello Sir,
I have a Doubt. Kindly Help.
If I check Daily and Annualized Volatility of Dabur as of now:
https://www.nseindia.com/get-quotes/equity?symbol=WIPRO
Daily Volatility 1.74
Annualised Volatility 33.24
& the calculated Volatility of Dabur comes out to be
Daily Volatility 4.756509385
Annual Volatility 75.0564521
https://1drv.ms/x/c/a6df9bade8b2fec2/EVIKWYZsD_FPsfHl99rrsL8BwEpEs1HIm5iOjkWrIGGbJQ?e=jVk9iu
Why is there a Mis Match?
I have Shared Links of both.
Aditya, have you made sure the data is cleaned for bonus, splits, and other corporate actions? Usually that is one common mismatch area.
I think this is the valid link for NSE historical data now: https://www.nseindia.com/reports-indices-historical-index-data
Ah you found it, thanks for sharing it here 🙂
Hi Karthik,
The link to historical data is not valid anymore…
http://www.nseindia.com/products/content/equities/equities/equities.htm
This leads to a stle page and it needs to be updated.
They keep changing the site, need to look for where its hiding now 🙂
Hello Karthik.
Thank you again for so wonderful explanations. Can you please check the wipro excel? You have used sqrt(365) well as here you have used sqrt(252) to convert daily SD to annual SD. Hence here Wipro\’s annual SD is 23.33% well as in Excel Wipro\’s annual SD is 28.04%. Which time should we use 252 or 365? Thank you.
Ah, sorry about the confusion Rahul. Please consider 252, the actual number of trading days. Thanks.
While calculating daily returns, do we have to separately calculate like B3/B2,B4/B3,B5/B4 …. till all 252 ratios or is there any simpler method to do that?
If you are doing it on excel, it is one click calculation right?
in excel sheet ,it is written in bracket that =STEDEV(C3:C245).STEDEV means standard deviation & C 245 MEANS NO. OF WORKING DAYS IN A YEAR OR SOMETHING ELSE?If 245 denotes no.of days than formula c3:C remains confusing.Is it C3:C2 OR????
C3 to C245 indicates the range within which the cells are selected to calculate the standard deviation.
Daily volatility =STEDEV(C3:C245) in the snapshot above the blue arrow in chapter 16 is confusing. Can u help me with this?
What exactly is confusing Hiren? Do let me know.
Hi Karthik Sir,
Actually I could\’nt get the concept of sq. root of time? Like how you have arrived with the number of 252?
There is a mathematical derivation for this. I dont know the math part, but end useable result is square root of time 🙂
A small correction. At the the end of step 2 it is written “ long returns” which I think should be “ log returns
“.
That’s all
Thanks
You have done a Great job sir
Ah, thanks for pointing that. Let me check 🙂
Sir in time you have taken the value as 252. How you have taken this value?
252 = Number of trading days.
Sir i am having three questions regarding this chapter
Q.1 – The data you have taken is the spot data or futures data
Q.2 – For the daily returns why you have not taken the formula –
Daily Return (%) = ((Today closing price – Yesterday closing price) * 100) / Yesterday closing price
Q.3 – In the screenshot above you have used LN(P3/P2) and the values in the first two cells are 558.75 and 570.9 respectively. And with this formula the value is coming 0.009. So how should i use this formula correctly to match with the excel value?
1) Spot
2) Its the same thing, try it on a data set 🙂
3) Convert this to %.
Sir i am having three questions regarding this chapter
If \”Daily Return = Y;day’s price/Today’s price -1\”, then in the excel screenshot you have put ln(b3/b2), where I assume b3 is today\’s price and b2 was y\’day\’s price. It is confusing, can you please clear it up?
Thank you
Sorry, I made a typo.
Daily Return = Today\’s price/Y\’day retrun, this will give you return, but then you will have to subtract 1 to express this in %.
Daily Return = (Today\’s price/Y\’day retrun) – 1. Here don\’t have to subtract 1 as its already baked in the formula.
But both are essentially the same.
Hi Karthik,
If I need to to calculate the daily average, I should add up the daily returns and divide by the number of days, right?
eg: for a year with 252 days (sum of daily avg of 252 days)/252, in this should I divide by 252 or 251 as the first day\’s daily return would be 0.
Thank you:)
Daily Return = Y;day\’s price/Today\’s price -1
Hi,
We are taking closing rice of previous day as opening price for the next day? It may differ everyday.
Yes, the close price and opening price need not be the same.
Hello karthik,
Can you please explain the difference in vol. calculation by using spot, forward and future prices? please it will help to understand better. Thanks!
The technique is the same and does not differ, Rahul.
Why 252 as time?
Thats the number of trading days.
HI Karthik, thanks for explaining things in such a layman language.
I have a question on Nifty daily returns graphical representation in attached excel file. What does it represents?
How I can interpret this info of these two numbers on chart. Bin array of 0.10% and o.26% is getting maximum frequency of 89 and 88 respectively.
Or
How I can relate back aforementioned info to nifty spot?
Sorry, I\’m unable to see the graph. Bin array is basically the size of the bin, a distribution of return range. For example all returns from 0.5% to 1%, will be contained within the 1% bin.
Not sure if that helps 🙂
hi karthik
Iam unable to compute SD on the excel sheet.I tried for Nifty, either the log function retuens a null value or the SD returns a divide by zero error. Can you help?
Ah, it must be a syntax error Suriya. Please double check each step, thats the only way to fix it 🙂
How did you get the LN output in percentage?
YOu can use excel.
hi sir,
loved every module so far on options trading.
Time is the number of the trading days?
please specify because i\’m new to this topic.
Thanks, Priyanka. Yes, time refers to the number of days till expiry.
If we have more than 1 year (say 3 years) of daily returns , how can we calculate the annualized volatility.
Yes you can, but I\’d suggest you take 1 year data, thats good enough.
CAN SOMEONE PLEASE SHARE DIRECT LINK OF NSE SITE PAGE WHERE ANNUAL & DAILY VOLATILITY OF EQUITIES AND CURRENCY BE FOUND ?
They keep changing the page, best if to look for it under historical data section on the website.
Hi Karthik, thank you for this blog.
If I want to find the volatility 10 days from today, will it be
(Daily volatility) x (10)^0.5.
Have I got it right.
Daily vol * Sqrt(10) – this should work.
Hi Karthick,
Just I have doubt using Historical Stock price as a variable will be comes under Monte Carlo Distribution? if you clarify that It would be great for my academics.
Thank you.
What variable are you talking about, Ram?
252 ?
252 = number of trading days in a year.
Thank you so much for all your efforts Karthik.
Also, I can see you have responded on almost every comment which is very appreciating.
My question here is that I tried the same steps which you have mentioned for Wipro stock just for trial.
However the date range is from 15th Jan 2023 to 15th Jan 2024 (One year).
My figures are not matching with the NSE website.
I am getting 1.26% as daily volatility and 19.68% as annual volatility.
On the website daily volatility is shown as 1.45% and annual volatility is 27.70%.
Can you please help?
Thanks Gaurav. Yes, the difference exists becuase NSE looks at the \’recency\’ of data and gives weight age to recent price movements. Their interest in calculating volatility if from margin collection perspective. Where as in our method, we are paying attention to the variance from average returns i.e. volatility. Hence the difference.
MY QUESTION IS WHEN CALCULATING ANNUAL VOLATILATY, WE NEEED TO MULTIPLY SQUARE ROOT OF TIME WITH DAILY VOLATILATY. HERE THE TIME VALUE HAS BEEN CONSIDERED AS 252.
FROM WHERE THIS TIME VALUE 252 CAME? PLEASE CLARIFY
Becuase volatility and time are proportional by the factor of time. Time in case of trading is 252 days after adjusting for weekends.
Hi Sir, Can you explain what is the format of time we need to include in the formula ?
Volatility = Sqrt of time.
hello sir I tried To apply =STEDEV(C3:C248) this formula in exel but I am getting error it says formula contain Unrecognized text
and Exel file is also no downloading
I clicked multiple time to download it but nothing happened
Not sure about the error, you will have to debug this by following the cues on excel itself.
About downloading, I\’d request you try and download from another browser.
How to download historical data now? The Nse site has changed too much.
Rishu, only the links have changed, but both exchanges still provide the end-of-day historical data on their sites. Do check once.
I saw your video where you said that you can forecast volatility by comparing historical volatility and implied volatility. Currently NIFTY daily historical volatility is 0.72. ATM IV is 8.7 from Sensibull. So should the comparison be between 8.7% and 0.72% ? I\’m not sure whether this comparison is right, since ATM IV is always significantly high compared to Daily historical average or is the implied volatility figure I assumed wrong?
That wont be right Sathish. The comparison works as a quick and dirty method. In this case, you are better off considering the ATM IV.
As volatility is nothing but standard deviation,so to get range we should subtract and add from mean of daily returns .but we r not doing here y so?please answer me
We are, do check the subsequent chapters.
The above calculation was very productive. I have one query. in the calculation of Annual Volatility, time is taken as 252 , it should have been 242. Correct me if I am wrong; I have taken 242 as time because these many are the total number of days.
Totally baffled because of this 252 vs 242.
Thank you.
Ah, it should be 252 right? 252 = total number of trading days?
Dear Karthik sir
In case of Weekly expiry series, from which day Theta starts playing out more?
Hello Karthik,
Nice mathematical approach, able to follow it very well.
However, I did not understand what is the meaning of “Return” when you are defining daily returns.
Secondly, how is Daily Average calculated ??
Third, how is Daily Return different from Daily Average to Daily Range?? Can you add or explain this as well.
Thanks
Varun
Daily return is the % change in stock prices, Varun. I\’ve shared the example of calculating the daily return in the chapter itself.
Dear Karthik sir
How can we use the concept of volatility smile while trading? Kindly explain with an example.
Yes, I\’ve explained Volatility smile in the subsequent chapters.
Sir,
(i)To calculate the daily/annual volatility, you have suggested to calculate in with a look back period of 1 year. Sametime, you have suggested to get the data of daily spot close prices of instrument (stock EQ/index) from NSE website. Now, we have an option in zerodha terminal called \”Table view\” where similarly we are given with a populated excel sheet of instrument (stock EQ/index). Can we use this data from zerodha in \”Table view\” to calculate the annual/daily volatility of stock/index?
(ii)Alternatively, can you please share the link of NSE website from where we can also get the historical data of index spot prices as well as any stock EQ historical data? (The link you have shared in material no loner exists)
(iii)Also, after calculating the annual/daily volatility of a particular stock EQ/ index, request you to kindly share the link from where I can crosscheck my daily/annual volatility findings.
1) Yes, idea is to get the data from a good source
2) Goto NSE India > Market data > Script or Index of your choice. For example, this one – https://www.nseindia.com/get-quotes/equity?symbol=ADANIPORTS
3) This, I\’m not sure from where you can.
Dear Karthik sir,
Does a gap up/gap down increase volatility of that particular stock/index?
Yeah, it does add to volatility.
Sir,
Will you pl tell how to get the volatility data for a stock from the NSE web site referred here?
Dear Karthik sir,
Do candlestick patterns, indicators work in VIX chart too so that we can predict the VIX?
Ah no, I\’d suggest you dont use CS patterns on ViX 🙂
Hi Kartik,
While calculating annual volatility by the square root of time from were did you get the time value = 252
252 is the number of trading days in a year, Deepak.
how did you come up with 252 as time … may look silly . no of entries in excel are 245
252 is the number of trading days in a year, Nikhil.
Hi,
As you said to download the file to calculate the daily return from NSE, i think NSE the website got makeover and currently it is redirecting to error page.
However, i tried to figure out the url, not sure that is correct or not, pasting it below
https://www.nseindia.com/get-quotes/derivatives?symbol=NIFTY&identifier=OPTIDXNIFTY27-04-2023CE17700.00
Question 1:
Can you please confirm whether that is the url
Question 2:
to calculate the Mean and SD, do we need to have 1 year data or 3 months past data is sufficient enough. Because, i see that NSE is allowing to retrieve past 3months data only, if not we are getting duplicate records.
Can you please through some light on this
1) You\’d want the historical data of stocks I guess. Look for a stock symbol, in the stock page, look for historical data (its there in one of the tabs)
2) Both are ok and is dependent on how you intend to trade in the market
NIFTY daily volatility comes to around -0.01% according to my calculation. This is taken from 1 year data. Is there anywhere I can cross check this information, as NSE only gives this information for deliverable securities? Or if you can, please let me know whether this is right. Thank You.
NSE or maybe Sensibull you can check to validate the data? Btw, most places they calculate the volatility keeping margins in perspective.
hi karthik, can you tell me when converting the daily volatility to annual, why are we multiplying or diving the returns with the square root of (365)??
You need to multiply or divide by time to scale up/down the volatility. There is a mathematical derivation for this, you can look it up online if you interested in the math part.
To get the daily volatility, do 1 year of historic data will always require?
What if we use 6 months of data? Will it conclude the daily volatility range?
You can use 6 months also, you will get the daily vol of 6 month. I generally prefer 1-year data.
how can we look for volatility on NSE official website now to double check and for nifty from where to get the historical data
You can check the option chain on NSE. I\’d even suggest you check out Sensibull for this.
Sr. the Average/Mean that we have to consider is of DAILY RETURN right ?
Yes, that right Rohan.
Excel link at the end of section is not working
Please try using another browser.
while converting daily volatility to annual volatility you have used factor of square root of time
where time is 252
My question is what exactly is 252
252 = the number of trading days in a year.
No issue, I downloaded from another site
Cool.
Hello sir, that link to open excel sheet is not working…
Can you try downloading this from another browser?
What is this time constant you\’ve used here \”252\”.
Its the number of days in a year.
Possible typo below:
\”I have used the Excel function ‘LN’ to calculate the long returns.\”
Should be \”.. log returns.\”
That\’s what I meant. Will fix the typo 🙂
Hi Karthik,
In your explanation your above you have shown the closing price of ten days for calculating the Volatility. And in the excel sheet given in your article has the data for almost an year (245 days). Could you please help me understand what is the right number of days to consider for calculating the volatility?
Regards,
Sudheer
Sudheer, so these are conversions based on yearly and daily calculations. So if you have calculated yearly vol, then you can scale it down to 10 days or whichever time frame you\’d need. Likewise, with daily vol…you can scale it up to 3 months, 6 months or whatever time scale you\’d want.
Hi karthink,
if we are trading a credit speared on on a particular stock and that stock daily volatility is [ 2.5 ]. and Nifty daily volatility is [1.08], so if i have created same credit speared on nifty with same MAX RISK and i have received 1000 rupees as primum so should i compare this with a stock which has 2.5 daily volatility and if that stock is fetching me 1000*2.5[2500] as primum then only i should consider trading on that particular stock ? or should i consider stock beta ?
The risk profiles of both stock and Nifty are completely different, Amal. So are the returns. Comparing Nifty, a basket of 50 stocks may not make sense with a single stock. I\’d suggest you go with your risk appetite and how much you are willing to risk on the trade 🙂
hii kartik sir, the excel file which is there in Volatility Basics is not downloadable.
Let me check, meanwhile can you try from another browser?
Hi, i just want to know that you mentioned as you calculated average of 0.04% and mentioned from previous chapters we can see the calculations, but previous chapter you dicussed about the daily volatility and annual volatility to find from wipro stock but never mentioned the average %. so please explain if i missed somewhere
I\’m guessing its in an earlier chapter, and I must have generally said \’ previous\’ chapter. Can you kindly check once? Thanks.
Why you have taken 252 days as time period for annualized return ?
Number of trading days in a year = 252
Hi Karthik,bI just have one doubt in whole calculation part the daily volatility in case of the nse screenshot shows 1.34 while when we do according to the formula that is daily volatility=annual volatility/√time period (that is 252) why do we get the daily volatility as 1.60?
There is a slight difference in calculation, and this is because NSE gives more important to recent trading days to calculate margins. In our case, we give equal importance to all data points.
If we use in excel =STDEV(-1.67,1.33,-0.67,2.33,-2.67,1.33) answer is 1.96 around while in previous chapter it was 1.79 in billy and mike’s data
Are the data sets the same? Can you check if its STDEV and not any variations to the SD function?
Kartik sir tell me when you check
dear sir how time here is 252 can you help me with this
252 = Number of trading days in a year.
If we use in excel =STDEV(-1.67,1.33,-0.67,2.33,-2.67,1.33) answer is 1.96 around while in previous chapter it was 1.79 in billy and mike\’s data
Hmm, need to double-check this once. Let me do that today.
hi kartik sir while using STDEV function in excel i got different answer other than using manually calculation first find variance and then its sqrt
i took example of last chapter billy and mike \’s put all 6 value and then use STDEV fun in excel and answer is different pls help me
Most likely, you\’d missed some step. Its unlikely to get two different numbers. Can you please recheck again?
Hi Karthik
Thanks a lot for putting together your thoughts on this complex stuff in such a simple way.
I have one question on Volatility, when you used daily closing price for one year as in example for July 2014 to July 2015..the volatility calculated is daily volatility for that period?
if we take 10 day\’s closing price and calculate volatility, then is that a daily volatility for that 10-day period? and can it be used to calculate annualized volatility by multiplying SQRT(252)?
If we take 5 year closing price and calculate volatility, then is that an annual volatility for that 5-year period? or something else….
Yes, if you calculate the daily volatility, then you will have to scale it accordingly by multiplying it with Sqrt of time. If you calculate for 10 days, then divide by sqrt of 10 to get the 1 day vol and then multiply with Sqrt of 252 for yearly volatility.
Hi! Thanks for the crystal clear explanation. But the historical data which I tried to download shows different closing prices for WIPRO(22-jul-2014 to 21-july-2015). More over when I tried to download the excel it is not getting downloaded. Please provide the proper link so that I can calculate and understand the concept better.
Maybe it is not cleaned up. Maybe try downloading from BSE website?
Hey, please help me with this.
Suppose I calculated the standard deviation(1SD) of nifty for the last six months and its 0.0109. Hence the daily volatility is 1.09%. Now volatility for the next three months(63 trading sessions) comes out to be 8.65%(1.09*√63).
Now how do I calculate the range for the next three months. So the upper range would be avg+ 8.65% or spot +8.65%.
Spot plus 8.65%.
Sir, why did we use the LOG (LN) FUNCTION to calculate Daily return?
I have explained this in the chapter and comments, request you to look at it once. Thanks.
Hi Karthik, I think the reason why we are seeing a difference between what shown on NSE website and your calculation is because I think NSE is taking SQRT of 365 instead of 252. When I take 365, it comes very very close to NSE number. Not sure if this is so, but just wanted to point it out.
Yes, this could be one of the reasons. This is called the time count convention. We are using actual by actual, so in that case, we consider 24 trading days (ignore weekends) and 252 total trading days. Or you can use 30 monthly days and 365 days in a year, which NSE seems to be using. Either way you need to be consistent with what you use, cant use 24 and 365.
NSE द्वारा
★ निफ्टी फ्यूचर में भी डेली और ऐनुअलाइज्ड वोलाटिलिटी दी जाती है
और
★ India VIX भी दिया जाता है
और दोनों का प्रयोग डेली, वीकली, ऐनुअल रेंज संभावित रेंज निकलने में होता है
तो
★ india VIX और निफ्टी फ्यूचर की ऐनुअलाइज्ड वोलाटिलिटी में अंतर क्या होता है,
★ दोनों की वैल्यू में अंतर होने से एक ही चीज की रेंज अलग अलग मिलती है
ऐसा क्यों?
Dear Karthik,
I am unable to figure out why LN is used It is mentioned Long Returns which i am unable to figure out. Can you please explain if time permits? Also can we just work this out without Natural Log .
Dear Karthik,
Can you please clarify on that LN function used. It has been mentioned a s Long returns which is confusing for me.
Please see the earlier comments.
Dear Karthik,
I am unable to figure out why LN is used It is mentioned Long Returns which i am unable to figure out. Can you please explain if time permits?
I\’m copy pasting an earlier reply for a similar query –
Here is the exact calculation for determining the price range
1. calculate daily log returns
2. calculate mean & SD of log returns series
3. 68% confidence interval is current price * exp (mean*time +/- SD* sqrt(time))
4. 95% confidence interval is current price * exp (mean*time +/- 2*SD*sqrt(time))
The process involves computationally intensive tasks such as calculating log returns, calculating exponential of a value etc.
Under the following circumstances, the above calculations can be approximated with more simpler calculations
1. Short periods of time: When time is small, (mean * time) is so small that it hardly makes any difference to the final value i.e. mean * time << SD * sqrt(time)
2. When daily percentage movement 20%, recalculate with accurate method, otherwise you can process with approximation.
unable to download excel sheet. 🙁
Sir,
In question asked on July 20,2022,
I didn\’t get the clarity,sir.As all the closing prices of an year(22nd July 2014 to 21st July 2015) has already been taken up for daily return calculation,why again seperately we need to calculate annual volatility.
Daily return is on a per-day basis, you need to find the yearly from this right?
Sir,
In the Image given just above step 3,the return of 22nd and 23rd July is not shown and also in the very next image only 23rd July daily return is shown,why is it so,sir?
For return calculation, you need two reference prices. If you want to start from the 22nd, then there is no data on for 21st, right? Hence you cannot proceed.
Sir,
Instead of using the formula for calculating return ,why this formula Return = (Ending Price / Beginning Price) – 1, is used, can\’t we calculate return just by subtracting ending price-beginning price.
Sir,Please tell where I went wrong
That will give you the absolute change in price, you divide the absolute change by y\’day\’s close you get the return.
Sir,
dates that have selected in the calculation to calculate the daily return is from 22nd July 2014 to 21st July 2015, that\’s a total year.As it has involved daily closing prices of an year,can\’t it be considered as annual volitility.why is it required to multiply the answer with sqrt.255.
Because the number of trading days in a year is 252, not 365.
Thanks for clearing doubt,sir
Sir,
First of all thanks for the work you put in to make all these study materials and also in answering the queries.
Sir,few doubts
1.Daily return formula = LN (Today’s Value / Yesterday’s Value) expressed as a percentage.
As it is used to calculate the daily return,why yesterday\’s value is used here.
Also,in step 2 of Calculating Daily Returns
Return = (Ending Price / Beginning Price) – 1
Here in formula,it is beginning price,is the open price of the day being meant here as beginning price,I ask this because in pic of the excel sheet just below this formula,it\’s shown LN(B3/B2),B2 and B3 are closing prices, aren\’t they?
2.in the step 3,\”After the open bracket, select all the daily return data points and close the bracket\”.
What all are the daily return data points mentioned here,which all values are said to be involved in daily return data points.
1) Return is calculated based on a reference value. For daily return the reference value is y\’day\’s closing price
2) Ending price = today\’s close and beginning price\’s is y\’day closing price
3) Just y\’day and today\’s close.
Hi sir,
How can we find intraday volatility?
Is there any method to find intraday volatility?
Is ARCH a good method to find intraday volatility?
Thank you sir.
Yeah, the ARCH and GARCH models are good but quite computationally intense.
Dear Karthik sir,
The chapter says the formula to calculate Log returns in Excel is LN(Today’s price / Yesterday’s price).
But what is the formula to calculate the % returns ?
Normal return = (Today price/Y\’day price )-1
Dear Karthik sir,
The chapter says the formula to calculate Log returns in Excel is LN(Today\’s price / Yesterday\’s price).
Similarly what is the formula to calculate the % returns ?
Yup, that is correct.
Hi ..thanks for such detailed chapters on Option..I dont think such resource exist anywhere else in web…for Free of Cost..
Now for my query ..Can you pls share me exact link where I can Snapshot for Future option ( like you shared for Wipro in NSE website)..Tried searching could not found..
Thanks in advance….
Rajiv
Rajiv, NSE has changed the site. Goto the home page and click on derivatives section.
Now a days, I am going through one of varsity module 5. Each topic was very well explained in each chapter by you. currently I am stuck at calculation of annual volatility. I could not find \”Annualised Volatility\” value calculated by NSE at the link provided in chapter. I can see \”security wise delivery position\” and \”Value at Risk in %\” over there. I had calculated annualized volatility of a stock according to method taught by you in this module. How can I cross check whether it is correct or not?
Hardik, I think NSE has changed the location of file. Maybe check the bhav copy file once?
If there is a person like you to teach and support ,I WILL become a very very successful trader and then I will declare that I have two gurus. 1)Mr.Eckhart tolle, my spiritual guru and 2) Mr. Karthik Rangappa my trading guru.
For calculating annual volatility from daily volatility why time is taken as 252 , while it should be 1 year ?
252 is the number of trading days in the year.
Hi Kulsum,
Thank you for your reply, sorry for replying late. Yes, the link is working, seems there was an issue with my Opera browser. tried a different browser and its working. Thank you for looking into this.
Sir ,
I have an account with Zerodha , my client code is mentioned above, can you please check whether the download excel link is working or not. Not able to download the excel sheet. Thank you.
Hi Bhaskar, we have added the link again, could you please check now? There seems to be no issue with downloading the excel.
sir how to calculate volatility for 1 hour or smaller time frames???
That will be tough, the closest thing is to consider 1-day volatility.
Hello sir, how do we calculate daily average return of index or stocks?
I\’ve explained that in the chapter itself, Nipul.
Hi Karthik,
Very good efforts to explain concepts in a simple form that that can be understood by most people.
Reference to above calculations, when we calculate daily volatility by using Annual Volatility, the number 1.60% does not match the daily volatility number (1.34%) of NSE. Assume NSE is using different data to calculate the annual volatility versus daily volatility, like Annual Volatility could be calculated by calculating the standard deviation % of annual data of the stock as well, using closing prices for each of the past years. What are your thoughts on the same?
Also, for intra day volatility can\’t we use the same logic as we used for daily volatility calculations but instead applying it on the respective frequency\’s data e.g. when calculating minute level volatility, one can use minute data points. However, the question is how much data is enough to calculate volatility?
Avinash, I think NSE uses a slightly different approach, wherein they calculate the volatility keeping margins in perspective. So they kind of give more importance to the recent data points compared to the technique taught here, wherein there is equal weightages to all the data points. Hence the difference.
Sir,
I have tried to download your excel sheet but its not downloading to refer.
I have under stood how to calculate standard deviation as u mentioned, but mean u have not mentioned but its imp in next chpter for normal distribution. So
daily avg/ mean =sum(daily return) / no of rows
for above sheet wipro= Sum/243=0.012
I got this value.
is this correct value?
No of trading days = 252 days, not 243.
Another related query as while explaining you have always taken a year\’s data and calculated log returns and then converted it into the time frame as an when required,ex-15dys,30 days.However can we not directly find the log returns of only 30 dys and calculate the Standard Deviation??
If you take monthly time series (12 data points per year), you will directly get 30 days\’ data. The same goes for taking weekly data.
Hi there!
A small query regarding time,do we always have to consider 252 days as number of trading days or it may change?
Thanks in advance!!
252 is the average number of trading days in a year. Plus or minus 3-4 days.
Sir, Suppose I calculated daily and annual volatility from period 11-04-2021 to 10-04-2022 then when my daily and annual volatility data expires ? In a nutshell, When I come to know I have to start calculating such volatility for next period ?
It kind of stays good for at least 1 week, you can recalculate again after a week. Technically, you can calculate the next day also 🙂
Can someone please tell me how to get the data for Bank Nifty and Nifty 50 to calculate daily returns, SD.
Its what you can find in the chapter right?
Hi Karthik sir, How you Calculated Annual Volatility
I didn\’t understand SQRT(254)
Annual volatility = Daily volatility * Sqrt (time).
Time = Number of trading days which is 252.
Dear Karthik sir,
Can we download the historical closing values of Nifty and Bank Nifty, i am unable to locate.
Please share the link.
It should be available on NSE site. Look for it under \’market data\’.
one doubt regarding the calculation of annual volatility. should we take square root of 365 days for calculating annual volatility or 245 days ( as actually there is only 245 trading days after sundays , saturdays and holiday )
YOu can consider 252 days, which is the actual number of trading days.
I am new to option world but I am serious in making study. I am not good in mathematics. My question is now a days nseindia publish VAR and extreme loss rate and not volatility. Can you explain what it is how it is useful https://www1.nseindia.com/live_market/dynaContent/live_watch/get_quote/GetQuote.jsp?symbol=SUNPHARMA&illiquid=0&smeFlag=0&itpFlag=0
In previous chapter you explained standard deviation and explained method of calculation. But in this chapter you have calculated by calculating LOG METHOD what is difference
Rajiv, VAR, and extreme loss are for calculating margins. For volatility, you can calculate using the same technique that we discussed in the chapter. Log method is just another technique to calculate the returns. You can stick to the regular method.
Sure! Thanks a lot!
I don\’t know why but link you provided for downloading excel sheet of Wipro is not working. It just redirect but doesn\’t download anything
Can you try another browser, please? Thanks.
Here is quick question- We have calculated the volatility for underlying by using its past 1 year data and then we proceed to calculate the range for it for next some days as per our interest. So how much past data I should use when I have to calculate range let say for next one week (Assuming I am thinking about trading weekly contracts). Should I go with same classic past 1 year data or should I give more weightage to recent data. Or should I go for more than past 1 year data? Please clarify
You can consider both actually to develop a wider perspective. Start with 1-year data and then maybe 3 months as well.
Karthik Sir, in the downloaded excel sheet i am getting 28.04% instead of 23.3% dont no why!
Ah, not sure myself Muthu. Need to check.
from where we get historical data of nifty 50 or bank nifty
YOu can check NSE site for this.
Hi. Why are you using log returns and not a simple – current close price / previous day close price?
Thanks.
Have explained that in the chapter/comments, request you to please check the same.
Hi kartik,
I just want to confirm about the global market situation that impact the nifty prices in India? Kindly explain sir or My link you share.
People are earning only on the basis of global market. How much is it true sir
Would obliged and thankful for your response sir,✨☺️
Ujjwal, that cant be true. You need to have a view on both global and local markets. Trading on the basis of global cues alone cannot be an edge.
why time is taken as 252 while calculating annual volatility ?
252 is roughly the number of trading days in the calendar.
Can anyone tell me from where I can double-check my volatility calculations on NSE website? The information provided there now is different from what is there in the screenshot in the article.
Dont think NSE publishes volatility information anymore.
while calculating annual volitility time is taken as 252. how we got this ?
It it the count of rows of daily data for one year we downloaded that is equivalent to 252?
Thats right, Manoj. 252 is the number of trading days in a calendar year.
Good article.
I cross-checked with NSE figures. I think they are using 365 days, not 252 days.
Must be.
Hi,
While calculating weekly volatility, from Friday end of Day to Thursday expiry, What should be the value in sqrt time, no. of trading sessions remaining i.e. 4. Right?
Thats right.
I calculated the avg daily return of Nifty 50 index for the past 11 years(2010-2021). It comes out to be -0.04. Does the negative sign requires to be dealt in a different way or should I follow the same procedure because the Avg Annual return is coming out be -10%.
Hmm, I\’m not sure if the number is right. Markets have trended up quite well since then. Maybe you should double-check? 0.04% is ok, but I\’m not convinced about the +ve sign.
STDDEV function is no more supported in the latest version of the excel sheet. When it\’s calculated for the TCS using STDDEV.S function from 17-Dec-2021 through 16-Dec-2021, abnormal difference around 5% between what NSE is showing for the Annualized Volatality vs the calculation using Excel.
Ah is it? I\’m still using the old version. Can you check if there is stdev.p, if yes, can you use that and check?
shouldnt monthly factor be root 21 , as 21 working days in a month ( by logic that 21*12=252 )
Yup, you can consider the actual number of months assuming you are considering the yearly number of days as 252.
thank you sir , followup will be :
how to convert month wise average to
> week wise average
> day wise average
> annualized average
and
how to convert month wise volatility to
> week wise volatility
> day wise volatility
> annualized volatility
yes sir i will look to it i use shorter time frame than 91-21 thank you so much sir
hoping for a positive reply
Best is to first convert to daily and then scale the daily to whichever time frame. If monthly is 7%, the to convert monthly to daily, you have to divide by sqrt of time…so in this case it will be 7%/Sqrt(30). This will give you daily.
Now from daily, you can convert to any timeframe for example if you want 45 days, then daily vol * Sqrt(45).
Hey Karthik , I hope you are still active here on the forum answering doubts –
I have data from 1991 april to 2021 november ( monthwise) and i have found the standard deviation of 30 years and 8 months .
1)the volatility / std dev i have found : is it called month wise historical standard deviation/volatility ?
2) can i convert this to weekly or annual or daily standard deviation of this historical month based volatility ?
I have also found the mean ( month based historical ) for the same
3) is it called month wise historical average ?
4) can i convert this to weekly or annual or daily averages of this historical month based average ?
4 questions above
hoping for a positive answer
thank you
Aditya, yes, I\’m active across the entire portal.
1) Yes, that correct
2) Yes you can
3) Yes
4) Yes
YOu can convert any time frame to any time frame you\’d wish, there is no problem with that. By the way, I don\’t think taking 30 years SD is helpful, market dynamics have changed completely over these years. SD is best across the last few years.
Sir time 252 how?
252 is the number of trading days in a year.
Hello Sir,
I could get the historical closing price for 1 year for all the stocks but how to get the data for Nifty and Bank Nifty.
Monali, I\’d suggest you get in touch with an authorised data vendor for this. Make sure you get the continuous futures data.
Can not download excel sheet, can you please share on my email ID
Hi Karthik! My question is regarding the calculation of annual volatility. You have mentioned that in order to convert the daily volatility to annual volatility just multiply the daily volatility number with the square root of time. But I did not understand how you got the 252 figure in the example of Wipro. There are 365 days in a year so should it not be the square root of 365?
252 is the approximate number of trading days in a year, Devansh. 365 is the total number of calendar days in a year.
The difference in your calculation and Nse calculation for annualised volatility number is because you multiplied the SGRT with 252 and NSE does that with 365 days
thanks love your content
Thats right Madhu. There is (could be) another reason. NSE uses a lambda approach wherein they give more weightage to variance in returns for the recent few days as opposed to our approach where we give equal weightage to all returns. NSE\’s idea of volatility is to figure how much margins to charge given the recent volatility in the market, and our idea is to figure the riskiness of the stock over a period.
Hello Karthik,
I am not very good with excel sheets. Is there a formula to calculate the Daily returns for the entire year? it is time consuming to calculate individual rows. Thanks in advance
Victor, I\’d suggest you look at Sensibull for this.
The time used in calculating volatility(here252) , how do we get that?
252 is the approximate number of trading days in a year.
Hi Sir,
To convert to annual return i need to consider the number of trading days last year right?
Yes, which will be in and around 250 trading days.
Sorry for this silly question…I am very much new to stock market..so hope you don\’t mind. My question is why time value is 252 ?
252 is the number of trading days in a year Om, hence that number.
Sir,
Can we calculate the volatility of bank nifty using the method explained in this chapter.
OR is there INDIA VIX like tool available for Banknifty?
Yes, you can.
Why we use log to distributre the return? and we take time as 252??
Karan, I guess we have discussed this in the comments section already. Can you please check once?
Got it Sir! Thanks for the prompt response.. really appreciated!
Learned a lot.. still learning.. thanks for the quality contents and efforts..
Happy learning, Prashant.
Hello Sir,
But from NSE data annual volatility showing 25.52 seems derived with 365 days and we have taken 252 trading days. Please confirm.
252 is the number of trading days in the year (approximately). I\’d suggest you take both and see which one you get better results in.
Hi Sir,
What period should we use to calculate historical volatility comparable with Nifty India VIX?
Depends on your trading stye, you can check at least 1-year data.
Thanks a lot for the detailed explanation Karthik.. Couldnt imagine the kind of efforts would have gone in to build this wonderful modules.. Really appreciate your teams effort on this.
we are not able to download the Excel link attached here.. is the link chagned?
Thanks, Nilakantan. Checking this.
I have question. We calculated annualized volatility using daily returns.
Therefore, if we calculate volatility using annual prices, then both the value should be same. But they aren\’t! Why?
Volatility is based on returns, not prices, Kunal.
How you have selected time as 252
I guess so, Manjunath.
Very insightful. I am not able to download the XLs from chapter 16 n 17, could you pl check.
Checking. Meanwhile, can you try downloading it from another browser? Thanks.
from where i can get daily and annual volatility on NSE site?
I\’m not sure where they are publishing this info, Vicky. Its best if you can check with NSE directly.
Hi Mr. Karthik,
Your lessons are very simple, practical and interesting.
Keep up the good work.
I have a query in the above chapter
For calculating volatility, time was considered as 252, why?
raja
Raja, 252 = number of trading days in a year.
Excel sheet link is not opening ? Another way to get the sheet ??
Dear Karthik,
Thanks a lot… I will go by our calculations… But Will keep on troubling you again again, if and whenever I am stuck… in different modules…
Please do, good luck 🙂
Dear Karthik,
I am absolutely new to the Stock Market but it has always been fascinating me since my student times. But I neither got an opportunity to learn nor did I ever got a good material or teacher to make me understand the stock market. But Varsity has been so nicely designed in a step by step manner that it\’s actually easy to learn and understand all the concepts. You have even taught the formulas for coming to the values which are already given on different websites, which is the best part as we should also know how to calculate. Thanks to you mate for all this.
As I mentioned to you in the beginning that I new to the stock market, hence, I will be coming out will lots of questions, which you or many other sisters or brothers may feel are useless, but I love to be clear on every doubt.
Now my question to you here is regarding the Volatility.
1. We have discussed about the calculation of volatility and based on the excel sheet you have given, it\’s on the basis of four years. I have prepared similar kind of spread sheet in my excel. Now I wanted to know, that the Daily and Annual Volatility already available on the NSE website is based on how many years data?
2. When we calculate the 1SD, 2SD, 3SD, which Volatility Data to use – the one given on the NSE website or the one to which we have reached by our calculations?
Thanks for all the kind words, Abhigya 🙂
1) NSE data is probably for a year, but their approach to calculating volatility is different. They do this with an intention to calculate margins, hence give more weightage to recent data points, unlike the method described here wherein there is equal weightage for all the data points
2) I\’d suggest you use the method described here.
Hi Karthik,
Can we not rely on the volatility provided on NSE website? Is there any benefit in calculating it ourselves when they\’re so close?
You can, but the NSE calculates the volatility by keeping margins in perspective. Hence they give more weightage to the recent data points so the NSE\’s volatility will be different compared to calculating it via the stdev function.
Sir, what about the number of trading days in the NSE website(has considered 365days for Annual volatality). Ideally the no. of trading sessions should be used which is 252days in our case??
I\’m not sure what they use, I guess they take in 365 days. Maybe you should check with them.
Hello Sir,
I tried to calculate the Volatality using Standard deviation(from 4June\’20 to 4June\’21) but there is a huge difference in the daily volatility and the annual volatality.(Though it is of futures but the difference is significant, can this be considered??). I have tried 4-5stocks but the case is the same for every stock.
Can you please check in the excel sheet and let me know if i went ahead correctly.
I am sharing the google drive link where you can check the sheet.
https://drive.google.com/file/d/1OGxpJnIV5NUS_2VrtyNuj8lAxksuo4dk/view?usp=sharing
Also for calculating the Annual Volatality, in the NSE website , the daily volatality has been multiplied with the sq. root of 365 instead of 252?? Since there were 252 trading days during the above period, so the daily volatality should have been multiplied by 252. Isn\’t it??
Thank you.
The difference between NSE\’s volatility and the way you\’ve calculated is because NSE calculates volatility from a margins perspective. NSE gives more weightage to recent data points where as in your calculation, it does not weigh the data points. HEnce the difference. I\’d suggest you stick to your method to get a fair sense of what the volatility of the stock is.
I am very new to Stock Market. So, my question might seem very trivial 😅. Still asking, Why has time been taken as 252 in the calculation?
252 = number of trading days in a year 🙂
Sir! How can I get to know about the range of the underlying by using the percentage(In NSE website they provided Daily and annual volatility in percentage).
YOu can make these calculations yourself, it is quite easy. Have explained the method in the chapter itself.
Hi karthik sir,
nice explanation.
i would like to ask why you took time 252 to calcualte annulasied volatility.
as on today I calculated the volatiity for wipro then it came for daily= 2.3% , and annulasied= 35.5% but on NSE website it is showing for daily=2.89% that is ok but annulasied =55%. can u clarify plz
252 = number of trading days in a year.
NSE calculates the volatility keeping the margins in perspective. Hence the difference.
I never knew options are going to be this much easy,All thanks to you Sir. By the way Sir I am facing 1 problem, Sir when i am trying to get data for nifty(symbol). for last 1 year it is showing \’\’no records\’\’ Kindly help SIR. 🙂
Apoorva, what data are you trying to look for?
I calculated Wipro Daily and Annual Volatility ( 15/05/20 to 14/05/21)
I got answers
Daily: 2.21%
Annual: 42% (251 days)
While you cross-checked at nse website ( in the last pic highlighted by a blue box), I am unable to crosscheck at nse. ( historical data is showing only historical price not daily nor annual volatility)
Also where I can check Nifty annual volatility?
thank u sir
https://www1.nseindia.com/live_market/dynaContent/live_watch/get_quote/GetQuote.jsp?symbol=WIPRO&illiquid=0&smeFlag=0&itpFlag=0#
Its on the NSE site, please check the details once in Bhav copy. But the values will anyway be different since NSE now calculates volatility from the perspective of margins.
In calculation of annual volatility where does 252 come from? Is it number of total trading days in a year? If yes then how to know the number of total trading days in previous year?
Yes, 252 is roughly the number of trading days in a year.
Hey Kartik. You have used the formula of LN here while calculating daily volatility. However, when we have to calculate the final values (+1SD, +2D etc.) we have to use exp function. However, when the values are more than 1 (X>1 for e^x) the values go too high. What to do in such a case? For eg. some stock can have an annual average return of more than 100%.
Priyank, you can stick to regular calculation itself (non log).
Thank You for the rich value you provide on the internet.
I calculated along the steps for \”TATAMOTORS\” for the past 1 year but my data and NSE\’s data differ quite a bit.
For e.g My daily volatility is 0.66% while NSE\’s 3.55% and My annual volatility is 10.53%but NSE\’s 67.90%. Where did I go wrong?
and Why is the time value \”252\” while calculating annual volatility?
NSE calculates volatility mainly in terms of computing margins, which differs from the regular way of calculating volatility.
Thank You for the rich value you provide on the internet.
I calculated along the steps for \”TATAMOTORS\” for the past 1 year but my data and NSE\’s data differ quite a bit. So asking for help. 1. Why is the time value \”252\”
252 = Number of trading days in a year.
HI,
Pls can you able to say in volatility annual calculation has been selected as 252. What is a logic behind this. Pls explain why 252 selected it is a constant valve or any other parameter.
252 = number of trading days in a year.
Sir, today is Friday and it\’s past 4 PM so the trading time for today is over.
I have calculated daily volatility using past one year return.
I want to know the volatility of the next expiry of nifty weekly options i.e. coming Thursday (06 May, 2021).
So what will be the formula?
(i) Daily Volatility*SQRT(6) (Saturday, Sunday, Monday, Tuesday, Wednesday, Thursday, i.e. taking both trading holidays and expiry day into consideration)
(ii) Daily Volatility*SQRT(5) (Saturday, Sunday, Monday, Tuesday, Wednesday, i.e. taking trading holidays into consideration but not expiry day)
(iii) Daily Volatility*SQRT(4) (Monday, Tuesday, Wednesday and Thursday, i.e. taking expiry day into consideration but not trading holidays)
(iv) Daily Volatility*SQRT(3) (Monday, Tuesday, Wednesday, i.e. not taking both expiry day and trading holidays into consideration)
Please answer. Thank you.
Amit, either (i) or (iii), both are used. I\’d prefer (iii).
In the start of this chapter it’s written –
Square and add up all deviations – this is called variance
While it must be divided with no of observation as per last chapter.
It’s contradictory Pl check
hey karthik! loved the module… just couldnt understand one thing that why did you take time to be 252 when u took the data for an year?
Thanks Pranav. 252 = number of trading days in a year.
Hello Karthik,
A wonderful and simple explanation of such complex topics. Thank you for making option easy n simple for me to learn, understand and analyze.
Why are you calculating log daily returns, any particular logic behind it?
Thanks for the kind words, Chandan. Returns can be calculated using log or simple returns. Usually when the data set is large, it\’s the log return.
Hi Karthik, I never had so much clarity on greeks before I read your content on Varsity. I cannot thank you enough for what you have given me FOC. My doubt. The calculation of Wipro Daily returns, Standard Deviation, Daily Volatility done on 23rd Jul 2014 is based on the yearly data until 21st Jul 2015. Right?. But on 23rd July if I want to do the calculation, how will I get the data of 24th July, 25th July, and so on?. In this case, should I take data of 1 year from 24th July 2013? If I take data for 6 months I should take 126 days?.
In an option chain, there is volatility for each strike price. Is this also Annual volatility?. I use the Interactive Broker portal to trade US stocks. I can see an IV at the top on the Option chain and also with each strike price. How are the 2 different. Sorry, too many questions. Appreciate your response. Thanks
Thanks, Ajay. The data can be downloaded by subscribing to a data vendor, who will supply you with the daily dump of data. Yes, IV is usually an annual number. I\’m not sure what that means, maybe you should check with them 🙂
Hi
Please refer to you last part of the tutorial, reproduced below.
So in this case we have calculated the daily volatility, and we now need WIPRO’s annual volatility. We will calculate the same here –
Daily Volatility = 1.47%
Time = 252
Annual Volatility = 1.47% * SQRT (252)
= 23.33%
Can you please tell how you deduced time as equal to 252. In actual there are 244 trading sessions in the trading year selected for excel calculation.
Thats right, a year has roughly 252 trading days in a year.
Hi!
Good work! Where did you pull-out the time of 252 from? In your excel sheet it\’s not 252, it\’s 365. So please explain that. For monthly, I have to sqrt 30 days and weekly 7 days, right? And yearly 356
Thanks a lot.
Tayaan, 252 is the number of trading days in a year.
got it from tradingqna
https://tradingqna.com/t/why-stock-returns-are-calculated-in-log-scale/806
Glad, was about to post the same link 🙂
Karthick
First, Thank you. Everything i know about the markets, f&o etc is from here.
why ln to calculate returns?
Dear Sir,
I did download the Nifty historical data and calculated avg, std etc.
But it is constantly annoying to calculate this every week manually.
Is there better way like a website or anything that does this?
Could you recommend such a site?
Jatin, maybe you should check Sensibull site, they may have a this ready.
Hello Kartik,
So far so good,
Just to relate the current part of excel calculations with the previous chapter where you have taken the examples of Bill and Mike.
Just correct me wherever I am wrong.
In this chapter the Nifty closing prices are nothing but runs scored by Bill and Mike in the previous chapter.
The Daily nifty returns (which are log returns in % percentages) are nothing but deviations from Mean.
Here we did not calculate the Mean as excel allows us to use a shortcut to calculate standard deviation by using the direct formula \”STDEV.P\” on the values of deviations from Mean.
Thats absolutely correct, Rajnish! Keep going 🙂
Dear Sir,
In your last calculation you converted annual volatility to daily volatility.
= 25.2% / sqrt(252) = 1.60%
The nse website got 1.34% as they used 365 days while you used 252 days.
Isn\’t your calculation more accurate compared to the NSE as markets are not open on the weekend and that .3% can sway entry and exit points.
I\’d like to believe that, but many traders find comfort in sticking to the exchanges\’ convention.
Thanks, Karthik. Got it.
Good luck!
Hello Karthik,
Thanks for the detailed learning. Quoting from your session \”So with this, we know WIPRO’s daily volatility is 1.47% and its annual volatility is about 23%.
Lets double-check these numbers with what the NSE has published on their website. NSE publishes these numbers only for F&O stocks and not other stocks. \”
I\’m unable to find this on the nse website. Could you help pls.
Priya, you will have to scout through NSE\’s site. They keep changing the site often 🙂
Okay, I have almost understood how it works. But why is variance linearly proportional to time? Shouldn\’t S.D be the term which is linearly proportional?
Check the reply to your previous comment.
Hey Karthik,
Can you provide me with a link with a clear explanation/derivation for why we should multiply or divide by SQRT(252). I googled it and I do understand it has something to do with the variances adding up but I don\’t think I understood the full derivation.
Check this – https://www.macroption.com/why-is-volatility-proportional-to-square-root-of-time
hello karthik,
so to calculate the weekly volatility form daily volatility do we need to multiply the daily volatility by sqrt(5) or sqrt(52)??
thanks you.
5, since there are 5 working days in a week.
Sir you\’ve mentioned here that to convert daily volatility to annual volatility, multiply the daily volatility by the square root of time; and the time value is taken as 252. What is 252 here? Are they the number of trading days between 22nd July 2014 to 21st July 2015?
252 is generally the number of trading days in a year.
Bro How Can I Get All Days Return In % By One Click, It\’s Hard To Apply Formula Everyday And Find Return For Everyday, How Can I Do It Easily?
Sahil, not easy unless you program this.
Thanks Karthik.
is volatility on daily and annually calculated at each day EOD.
YOu can calculate volatility on both daily and EOD basis.
HELLO KARTHIK, WHY YOU TAKE 252 UNDER LEBEL TIME WHILE CALCULATING ANNUAL VOLATILITY?
252 is the number of trading days in a year.
Is it possible to trade options, using price action and indicators just like we do with stocks, without considering the options greeks? If yes, what would be the difference? If no, why?
Yup, you can.
Sir I am looking for the historical data to download for NIFTY to do the calculations and I can\’t find it. (in this chapter we downloaded WIPRO)
I\’d suggest you look for it on NSE website.
Hello sir, thank you for your clear explanation. I am wondering how can I get data for NIFTY options in the derivatives section. I want to learn how to do projections for NIFTY options. Could you suggest me a few tips on doing projections for NIFTY options?
thank you!
What kind of data are you looking for? Do check here – https://www.nseindia.com/market-data/equity-derivatives-watch
Hi Sir, i have one confusion what if we calculate standard deviation of price itself in place of standard deviation of return. Like i have calculated standard deviation of daily return (21 days) for Nifty at 0.57% whereas standard deviation of absolute price comes at 172 points as on 31st Aug 2020. now 172/11387 comes at 1.51%. why there is such huge difference in absolute and SD of return?
You cannot do this on prices, as prices trend to trend, and are not normally distributed. However, stock returns are normally distributed, which is what I\’ve explained in the chapter. You can apply principals of SD only if its a normal distribution.
Thanks for all your effort, this is awesome.
There is a discrepancy in data between the downloadable excel sheet and what has been taken for annual volatility calculation in this article.
In excel the time value is 365 where you have written 252 in the article. Kindly clarify.
Thanks for pointing, Bipin. Let me check this.
Sir, I calculated the volatility for HDFC Bank, it shows annual volatility of 96%, seems there is a stock split and I can\’t able to get the clean data.
As an alternative, can we use the value from current month Future Contract from the NSE website. 🤔
You need to ensure that the calculations are run on clean data which is adjusted for splits and bonuses.
Suppose i bought a share at 500, with Reward to risk as 1:1 , i would keep SL at 496 and imaginary target at 504, and when the price reached 504, i would manually change SL to 501 so that at least my capital is preserved. Or sometimes modify SL to price little less than target in this case let\’s say new SL is 503 and SL gets hit and price increases from there on. So booking only small profit even though things were going good.
And given the fluctuations in prices, I face a difficulty while deciding at what value should i keep new SL, whether it should be little above buy price or at target price ?
(NOTE – currently BO orders are not available to trade due to increased volatility , this statement can be seen in Zerodha\’s Bulletin segment)
I hope you got my question 🙂
Got it. YOur technique of trailing is right. If I were you, I\’d buy at 500, SL is 496. I\’d trail the SL to 500, if the underlying moves to 504. If The underlying moves further ahead, lets say 508 or 510, I\’d increase the SL to 502, @ say 512, SL moves to 504….the point is that you have to wait for the underlying to move in your favor and then trail accordingly.
Sir, When to start trailing your stoploss ? I have tried to do it while trading but found that i am not able to properly make decision regarding it
Can you explain how you did it?
Sir,
Your work is commendable, these modules are really helping many new traders like me. I understood almost everything till this chapter along with evolving crystal clear concepts of market. All thanks to you Sir!
Just two questions i have. (i) In calculating annual volatility why you put the figure 252 in the formula and second thing is when i downloaded the same excel file you mentioned above there in which you have placed the figure 365 instead of 252 in the Excel Sheet Formula.
Please clarify
Thank you Sir!
Glad you liked the content 🙂
1) 252 is the number of trading days in a year and 365 as you know is the calender number of days. NSE considers 252, I\’d suggest you do the same as well.
Thanks again Karthik for your insights. This reinforced the thought to wait patiently for the opportunity from market.
Good luck 🙂
True, it depends on how much premium we are collecting. Say after calculating nifty upper range, we identify a strike trading at 20Rs premium, then returns works out to be ~1.25% [ 1500/127000 ] which is still decent returns.
But not sure if we get such strikes where Rs.20+ premium can be collected consistently.
Possible, you just need to track the market and you will get an opportunity sometime during the series, especially when there is a spike in volatility.
Hi Karthik,
With Nifty options lot size 75, margin requirement for collecting premium comes some where around 127000.
returns after adjusting brokerage looks very less. I agree this is consistent approach, but considering risk/reward,
do you still think returns are decent enough ?
Hmm, depends on how much margin you collect right? Also, the thumb rule is – anything higher that 2% a month is worth considering.
In Kite, for any given stock, if you go in fundamentals in kite, you show the Beta of the stock right ? for what period do you calculate that Beta
Ah, that comes from tickertape. We don\’t compute that.
For Beta calculation what period is considered idea.
Sometimes companies use 60 month period / 24 month period etc.
Also, what period does Zerodha use in calculation for beta
Regards
We dont calculate beta. But yes, you can take the last 12 months data at a minimum.
No sir. I don’t no how to increase the decimal points sir?
Excel has a feature for that, request you to please check online for this.
To find the estimated range over a period of time of any stock or index , we need daily standard deviation/volatility and Daily Average/Mean. In this I am able to calculate the daily S.D of nifty index but daily average of nifty index is showing 0% when I calculate with log daily returns sir. So I am unable to calculate that and I tried many times. So can you please tell how to calculate that daily average/mean or what is the daily average of nifty index sir.
0%? Did you try increasing the decimal points?
Hello sir,
First of all thanks for those wonderful content sir. After reading all I have a doubt. I am able to calculate the daily volatility and annualised volatility Of nifty index and got similar results with what they published in nse website. But I tried calculating daily average of nifty index for tooo many times but I couldn’t get the values it shows 0%. Can u please tell how to find that or if possible kindly share the daily average of nifty index alone. It will be helpful for many of us. Thanks in advance sir.
I think its good if the values match with NSE\’s. But which average are you talking about?
Hello Sir,
For calculating Historical volatility, what is the minimum period to be taken in to consideration (Close prices). For example I tried 01-01-2019 to 17-07-2020 the value of 1 yr SD I got is 26.68%, where as when I considered 01-01-2016 to 17-07-2020 the value of SD is 18.6% but actual nifty spot Annualised volatility is 35.73 %. there is so much difference in the values, so how much data to be considered for calculating Annualised volatility.
You get different values for different time period. I\’d suggest you stick to 1 or at the most 1.5yrs, this should be good enough.
What if the stock is split during the time period. Will the volatility calculation using the above method still holds true?
Yes, it does.
Hi Karthik,
No I am taking ln[today’s value/y’day value] only. I had no idea about the other formula. After log method when I took average I got negative result.
Ok, in that case, the stock has clearly trended down quite a bit.
Hi Karthik,
I did download you excel and copy pasted your formula only. But that gives me daily returns. I need to find out the Daily Average return. So how to do this? So I put Average(C3:C247) [Column C contained all the daily return percentages] and it got me -0.14%. Stock was in a downtrend in the last 1 year.
But my question is how should I use this negative value to calculate the stock Range? a couple of chapters later you demonstrated how you got Nifty 16 Day Range. So with a negative value how to do that? Do I take a Mod value?
And also if you can please answer my other question .Is there any readymade source of these data? Or you prepare this everytime manually?
No, my question is for the daily return itself, how are you calculating the return? Is it the regular way i.e. [today\’s value/y\’day value]-1 or are you taking the log values i.e. ln[today\’s value/y\’day value].
I\’d suggest you take the log method.
Hi Karthik,
I faced one problem while calculating the \”Daily Average Return\”. In one of your later chapters you demonstrated how I can calculate the range of a particular stock for the next n number of days using
1) Daily Average Return
2) Standard Deviation
So I decided to download last 1 year data of ITC. I calculated daily return like you showed in this chapter. I calculated Standard Deviation similarly. Now when it comes to Daily average return I just used the AVG function on the entire column of daily average.
The Average daily return came out to be negative! Now I am perplexed as in how to proceed. Can you suggest how to proceed now?
On another note I found NSE website contains daily volatility data,but is there anywhere i can find daily Avg return and the daily SD(or 1SD,2SD) range data ready made. Or do you also download the excel everytime and manually calculate the same?
Atrijit, did you use the simple return of log returns? I\’d suggest you use log returns.
@Karthik Rangappa : First of all I thank you very much. I have learnt a lot from Zerodha Varsity. The way everything is explained is so lucid.
Could you make a video about the new nse website or could you provide some links if any. I need to know what the resources data free available, where we can find useful insights just like walk through of the site.
Thanks, Soman. NSE\’s website is an ocean of resources, takeaways too much bandwidth. Plus they keep upgrading the site, so will be a tough thing to do 🙂
Hello sir,
I cannot understand the logic behind multiplying one day volatility with square root of the timespan to get the volatility of that particular span and vice versa.please explain.
PS:Thank you for the amazing content!
Roshan, there is a mathematical derivation for that. Not sure if we should get into explaining that 🙂
very good content
i have one doubt in excel , you considered 365 days for calculating annual volatility . but in the article , you considered 252 days can you please rectify ?
Hmm, 252 is the trading days, whereas 365 is the calendar number of days. So it is really up to you which convention to stick to. I\’d prefer the trading number of days.
I was able to work around the issue by shrinking the bin width. Rest of the calculations have also panned out effectively with respect to 1SD & 2SD. Thank you again for all your help and the study material.
Super! Happy learning 🙂
I can try to increase the bin width which would reduce the bin array. I had two questions in this regard:
1. How important is the bin width formula i.e. (Max – Min)/50? If not very important, I can put a higher number for width to reduce the arrays.
2. Also I wanted to confirm that, through the frequency formula, what we get is the number of times a value is repeating in the range of one bin array to another i.e. If bin array = 13, 11, 9, 7….., through the frequency formula I would get how many times numbers ranging between 13 & 11, 11 & 9, 9 & 7….. are repeating in the bin array?
1) The denominator bit of that formula is very flexible. Try shrinking the bin width, if you increase you may get more bins with 0 values.
2) That\’s right, frequency gives us the frequency at which observation occurs.
Thank you. I was able to execute the formula with your advice but there\’s a separate issue with the result I get. Some numbers in my bin array that feature in the percentage returns are showing 0 frequency after the formula. how could I rectify this error?
Hmm, that means there are no observations across these bins. Can you try reducing the number of bins?
Hi Karthik, Thank you so much for the material that you upload for us learners.
I had a query regarding the excel sheet that you uploaded. It calculates the daily returns of nifty with normal distribution. I have been able to find out the Max & Min percentage returns along with the Bin width value. I have also been able to create the bin array by adding the bin width to the Min percentage returns till i had the Max percentage returns.
What I am stuck at now is how to find the frequency of the percentage returns through this bin array. When I use the frequency formula, the cell value keeps incrementing and I dont see that happening in the sheet you uploaded. Further, I have tried using the dollar signs to stop the incrementing from happening but it ends up giving a value of 1 for each bin array.
What is the possible way to stop this from happening?
Are you directly pressing enter? You need to press \’Ctrl+shift+enter\’, when using an array function on excel.
Hi Sir. Perhaps you may like knowing that I am studying your articles on Volatility very deeply, so that I can master the subject.
I refer to the example where you calculated conversion from Annual SD to Daily SD by dividing the Annual SD by SQRT(252) (perhaps 252 is the no. of trading days in a year). Step 2 then multiplying the daily SD with SQRT(NO. OF DAYS) for which no. of days the SD is required. Fine.
I am reading a book titled \”Mastering Short Strangles: Trading Analysis of Real Trade included\” written by Pradip M. where the writer wrote:
\”Given the Realised Annual Volatility of 16.8% , we get 1SD movement of 4.73% for a period of 29 days. The calculation arrived as below: 1 SD for 1 day = 16.8/sqrt(365) = 0.87935219 and then 1 SD for 29 days = 0.87935219*sqrt(29) = 4.735456466 …\”
Request your examination on this matter. Thanking you in advance for a reply.
Thats right. When you want to convert daily vol to annual vol or any time frame, you multiply the daily vol by sqrt of time. However, if you want to calculate the daily from annual vol, then you divide it by sqrt of time.
Thanks. Amazing to see quick reply from you. Appreciated.
BTW, I was so confused for FnO but the way you have explained entire stuff; i am excited to trade :). Thanks for nice theory.
Thanks
Happy learning, Uday 🙂
Hello
during daily to annual volatility calculation, why time factor is considered as 252 and not 365? from your screenshot for Wipro, annual volatility is 25.5, 25.5/SQRT(365) = 1.34. which matches the daily volatility in the screenshot.
Similarly from NSE website for INFY, daily volatility = 2.55, annual volatility = 48.77; calculation 48.77/SQRT(365) = 2.55, again matches.
Can you help clarify pls?
Thanks
I\’ve considered the actual number of trading days, but I guess NSE has considered the total calendar days. Please do stick to NSE\’s convention.
Hi! Karthick..
Thank you so much for the knowledge.
I also have the same problem/doubt while calculating the volatility for longer period for the stocks which has fallen a lot
Thanks & Regards
Hemakumar D
Use log returns, that will help.
hi Karthik,
If we select the daily closing data of any scrip for finding its std. dev. instead of getting its natural logarithm (LN), what isthe result? I know the answer will be wrong but still want to know the importance of LN.
Stock prices can trend, but returns are normally distributed. Do check the chapter for an explanation.
Hey, i have gone through comments, i was able to figure it out, thank you!
Happy trading!
Hello,
I have a query regarding the relevance of volatility calculated by us and as available on NSE.
So, I calculated the daily volatility and it comes out to be very different as given on NSE, please guide me if I have committed any mistake.
[img]https://i.imgur.com/GuU5oBl.png[/img]
The above date pertains to the period 22 may 2019 – 21 may 2020
[img]https://i.imgur.com/XOllZep.png[/img]
However as per NSE, Volatility turns out to be very different.
Yes, the vol as per NSE is to calculated keeping margins in perspective. We calculate keeping trading in perspective.
Sure, thanks.
Thanks you very much Karthik for your reply…Good bless you and all traders.
Manohar Nadkar
Happy trading!
Thanks for the reply, I have another query . I did a Vol for ITC from 2019 May to April 2020, and daily returns were calculated on a log scale. I get a negative average of -0.20 / daily . So when converting to annual x 365 days it’s a – 74.05 % for 1 year. How do I work out the sd for these values ?
1. Should is go for a longer period to calculate log returns, as the last 1 year ITC has been on a downward trend so returns are obviously in negative ?
1) This is the problem with -ve returns, happens when the stock has trended down for a long time. I\’ll get back to you on this.
Hi, thanks for such nice e-book..very informative,
if I want to caluclate weekly & monthly volatility then formula like this–wkly vol = daily volatility sqrt(5) & mothly=daily volatility sqrt(21)
and i calculate 9 days vol. then 9days vol. =daily volatility sqrt(9)
pls guide.
Thanks a lot
Manohar
Yes, that\’s right. You have to multiply daily vol with SQRT of time.
Sir ,
Which Version of R Software is recommended ? I am I Unable to Download Foptions into it . I want to get Volatility Smile , Volatility Cone using R . is there any Traning Centers who teach R from a scratch ? .
I\’m not sure if I;m capable of answering that.
I did a daily Vol calculation for HUL from May 2019 to April 2020, there seems to be a big deviation from what I calculated using excel vs the nse website . Daily Vol as per my calc is 2.7 vs Nse 3.11 which one should I go with ?
Yes, that is because of the way NSE calculates Vol. They do this keeping margins in perspective. To trade, you go with the technique described here.
[…] https://zerodha.com/varsity/chapter/volatility-calculation-historical/ […]
Range Calculation with 15 days SD
15 days Nifty
upper 6.35% 9979.11 9998.45
lower -8.86% 8551.73 8587.49
Premium market lot
SELL 10000 CE 73 75 5475
my first trade based on quantitative strategy learned by you, sir!! I was off the view that there are 68% chances nifty won\’t cross 10000 in next 15 days!! today premium is down by 50% .
Good luck, Anil. Stay profitable 🙂
Thank you so much! Karthik
Thoroughly enjoying the course. Your examples and explanations theory is amazing and very practical.
Happy reading and trading 🙂
I got to know the calculation of NSE, though complex compare to what I have learned through this module.
Both give a different lower and upper range which in turn gives the different prospective of index/stock range.
which calculation to use to get a better range of index/stocks?
Yeah, from my understanding, NSE\’s volatility computation is wrt to computing the margins from a day to day perspective. They do this by assigning highest weightage wrt the most recent data. YOu as a trader need to give equal weightage to the last 10 o 15 day data, which is what happens when you compute volatility in the way described in the chapter. I\’d suggest you stick to this method.
Hello Karthik,
I am not sure if you are aware of it, but https://in.tradingview.com/screener/ is a great tool. It has daily/weekly/monthly volatility column along with 100 other features 🙂
It has a button to add new columns. Click on it and then you can add volatility.
Yeah, TV is a great platform 🙂
how to check NSE calculation?
I think the calculation technique is available on their website, you need to look for it.
I agree with you. What bothers me is if I have to plot the hist. vol (nse calculation) vs the implied vol, and hist. vol (log returns) vs implied vol the gap between the 2 plots would be different and hence my assumption of IV might be wrong for the underlying. Right?
Double-check your IV with Sebsibull\’s IV chart – https://sensibull.com/
This is how NSE calculated the daily and annualized volatility.
Current Day Underlying Daily Volatility = Sqrt (0.94* Previous Day Underlying Volatility ^2 + 0.06* Underlying Log returns ^2)
Annualized volatility = Current Day Underlying Daily Volatility * sqrt(365)
Yes, I\’m aware of this. The thing is the NSE gives more weightage to previous day\’s vol, this makes sense as they need to charge margins to accommodate for the present day vol. However as a trader, you need to give equal weightage to past volatility as well, that would be a better way to deal with this.
Sir,
I am trying to calculate the daily returns & annual returns of the NIFTY using STDEV formula but the result varies from nse website.
from 9/5/19- to 8/5/20 by using your formula my result is as follow
Daily Returns 1.962%
Annual Retuns 31.15%
but as per NSE website its 3.30 and 62.98. what could be the reason?
Can you please check how NSE is calculating the returns?
ok.. It will be really helpful if you can update your findings on the the comparision between two approaches as and when it is done. Also, if I want to calculate volatility of NIFTY index, can I use INDIA VIX as a alternative?
With your calculation we get IV Rank as 100 for most of the days in this period. Has the change in formula done by nse considering this high volatility period we are in?
IVs are generally very high of late, Arun. So this could be a legit change.
Should we follow the steps followed by you to calculate annualized volatility or should we use the formula used by NSE? Which one is more relaible?
I\’d say mine, but the difference is too much 🙁
Doing a bit of research myself on this.
Sir ,
i was trying to download the historical data of SBIN Since 2000 . there is a huge difference in what i get on NSE website and the Historical data of SBIN on Zerodha or Money Control . if MoneyControl or Zerodha confirm that SBIN has been trading between Rs.,20- Rs.,400 , But Data on NSE shows Well above it – it even Goes to > 1000 even >3000 . is something wrong that i am doing while selecting the data ?
Money Control : https://www.moneycontrol.com/india/stockpricequote/banks-public-sector/statebankindia/SBI
Zerodha : https://www.tradingview.com/x/G7qVzuNQ
NSE :
https://www.tradingview.com/x/G7qVzuNQ Between 500 – 1000
https://www.tradingview.com/x/G7qVzuNQ Between 1000- 3000
Please Clarify
It may not be adjusted for splits and bonus. I dont know about other sources, but I\’d suggest you stick to Zerodha.
Hi Kartik,
If the Daily Volatility is available on NSE website.
Would there be situations where in we would need to calculate this using the given formula.
Thanks in Advance.
Not required if it is readily available.
Hi Karthik.
(a). For calculating daily return, you used Return = LN (Ending Price / Beginning Price), instead of Return = (Ending Price / Beginning Price) – 1 (which is equally convenient for MS Excel perspective). Both these formulas will give some minute difference in values. I just wanted to ask if this simplification carries an underlying practical purpose, or is it just for the sake of simplicity.
(b). At the beginning of the chapter, you laid out steps for calculating the standard deviation. There is a small typo here. In these steps, you forgot to divide the sum of squared deviations with the number of observations.
1) This depends on the time frame you are looking at. For short term (like 6 months or so), you can use the simple arithmetic value, for more than that, use the log function.
2) Ah, isit? Let me check this.However, if you are using excel, you can use the =STDEV() function directly.
thanx sir for this valuable knowlege sir but in 2015 wipro were trading at 250-300 in june how come there is a diffrence in future price
i m new to share market
The futures price is slightly different from the spot price. Do check the module on futures pricing.
Hi Kartheek,
Here is the link – https://www1.nseindia.com/products/content/all_daily_reports.htm
from above link we can download daily volatility.csv.. Please download the same we can see how NSE calculating the Volatility
Thanks, Praveen.
Thanks, Praveen. Looking into this.
Hi,
If its not possible to reveal that pdf here please let me know through my mail id.
Thanks
Abini
Hi Karthik,
I am doing my project in Risk-Return Analysis of Futures and Options. So if I am using this formula that you provided it would be only accepted if I would be able to provide the source of this formula. Is there any books or journals from where you got this formula so that I could keep it as the reference?
Regards
Abini
Ah, dont remember. But these are generic formulas that everyone uses.
Hi Kartheek,
As per the NSE website the volatility calculation is Happening like this.
1. Log returns they calculating as LN(Today close/Previous close) or LN ( beginning price/ending price)
2. Daily Volatility calculating as Daily Volatility = Sqrt(0.94*D*D + 0.06*C*C)
Note: D = Previous Day Underlying Volatility and C=Underlying Log Returns i.e. LN(Today close/Previous close)
3. For annual volatility they considering 365 days instead of 252 days.
May be we need to update our tutorial or can u provide some more insights on above 3 points?
Praveen, can you share the link for this? Thanks.
Sir
In the MS Excel sheet you have provided in the last line of this chapter, there you have used 365 days to compute the annual volatility (which comes out 28.04%) but in example give above, it is 252 days. I think it should be the number of actual trading days i.e. 252 days.
Thanks
252 is the right convention, Akash.
So, for a Stock which has negative returns LOG is best!
Anyhow, I\’ll try both of them(LOG & LN) and see which one is more accurate for both short and long terms.
Thank you!
For long period data, its best to use log. Btw, both LN and Log are the same.
But, In the WIPRO example you have used LN(Today\’s close/Yesterday\’s close).
Now, we are using LOG(Today\’s close/Yesterday\’s close)?
May I know why?
On a short term basis, there is not much difference between regular returns and log returns. The difference occurs when you extrapolate for long term basis, this gets further magnified when the returns are -ve. Hence.
Hello Karthik,
I\’ve downloaded 1 year data from NSE today i.e., on 17-04-2020.
I\’ve calculated Average, Standard deviation and Estimated range for AXISBANK as you\’ve calculated in this module.
Daily AVG = -0.25% ; Daily SD = 3%
Yearly AVG = -64.22%; Yearly SD = 54%
With the above values, the 1 year range would be
Upper Range = -10.32%
lower Range = -118.11%
I know that these numbers doesn\’t make any sense as they both turned out to be negative.
My doubt is :
1. Do I need to remove negative sign in the average?
2. Or is there any other way to do these kind of calculations as the stock is beaten down to hell from 800 to 300 levels giving completely negative numbers during the calculation?
Harsha, I\’d suggest you calculate the stock returns on log basis, which log (today\’s close/y\’day close)….and not the regular % basis. Here are the brief steps to follow –
1) Calculate the daily returns using a log basis
2) Use the daily return to calculate the daily avg and daily SD
3) Convert the daily values into yearly numbers
4) Calculate the range % using these yearly numbers
5) Convert the range % back to regular scale (remember you are dealing with log scale)
6) To convert the long % value to regular scale, multiply the range value with exponential
Sir,
I calculated daily and annualized volatility of L&T for last 1 year as per the above calculations and it came as 2.44% and 37.95%.
But on NSE website the respective figures are 5% and 95.61%. It is nowhere near to my calculations.
Can you please explain what can be the reason.
Thanks.
I really don\’t know how NSE is calculating Volatility. Maybe you should check with them for an explanation 🙂
@karthikrangappa i have calculated daily volatility and annual volatility of wipro, sail, and idea but when i cross-checked the answer on nse website it shows no similarity .
I tried multiple times checking whether I did it wrong but the answer i got is totally has no close to the volatility available on nse website. which one should I consider?
Go with NSE\’s. Please read the comments above, Abhi.
Hi Karthik ,
Can we use the same calculation to calculate the volatility for 15 minutes or 1 hour.
Yup, you can.
sir. thank you for the knowledge that you shared with us but according to your formula I tried to figure out the volatility of Reliance industries but the difference between the two(daily as well as annual volitily) that is which is calculated by me and that published by the NSE website has a lot of difference. So as asked by lot of people what could be the main problem in my calculations whether m I taking the wrong closing prices or it can be some other problem.
I\’m really not sure why the difference exists, Rahul. I\’ve pointed out a few possibilities in earlier comments, maybe you can check and verify.
hello sir, i am unable to find historical data of nifty .i followed the link and after entered symbol name nifty but its showing NO RECORDS,
Thanks a lot once again Mr. Karthik. I am kind of new to this zerodha system….how do I write to ChartIQ? any mailid? And by the way on a more theoretical level, SD is being calculated here to find out the volatility of the stock. Moving average is a concept in data analysis, used to smoothen the data. Now, if at all I am taking moving average of SD data don\’t you think it is counter intuitive? I am trying to smoothen a parameter which is otherwise supposed to give me the \”jerkiness\” or volatility!!!! Anyway as suggested by you, I will write to ChartIQ if I know the mailid. It was pleasure discussing the concept with you.
I found their email ID on their website – [email protected] , https://www.chartiq.com/
Please do share your findings here. Thanks.
Thanks a lot for your response. But as you know, every answer creates a new question :). Let me put things in perspective. As explained in the study material/notes above, you first calculate ln(previous day\’s return/today\’s return) and on a rolling 14 days\’ window you calculate the standard deviation. So today\’s standard deviation value has been obtained from natural logarithm of return ratios of last 4 days. Correct? NOw what is the role of moving average? Which parameter is actually taken on a moving average basis? YOu have clarified most of my doubt, please clarify this one.
Regards
Ok, I get it. I guess it\’s calculating the SD of the 14-day simple moving average. I\’d suggest you write to chartIQ directly for this 🙂
Please explain in details. I am not talking about Bollinger band. Go to zerodha platform, select any stock or any index and from”studies” pull down menu select STD DEV. Now see the parameters…… as such they don\’t have any role in regular STD DEV calculation. Even before coming to Zerodha/trading/share market I had some formal training in statistics…… I can not figure out the role of those parameters here……surely something is there which I am missing…..so please explain precisely what (14,2,MA) means. By the way thanks for noticing my question.
It is the same – A 14-day standard deviation, calculated on the closing price, gives you the value of 2SD. This is plotted as a simple moving average. Also, if this is not clear, I\’d suggest you speak to chartIQ directly to get clarity on this.
Hello Karthik,
Can you please help me with the following doubts:
A. On NSE\’s website, annualised volatility is calculated as daily volatility*sqrt(365). Shouldn\’t it be AV= DV*sqrt(252) ( Assuming there are 252 trading sessions in a year)
B. As per NSE\’s website, Infy AV as on 02.04.2020 is 97.21. Does it mean that there is 68% probability that infosys price may move from current spot +- 97.21% in a one year time frame?
C. IV is always overestimated and options premium accounts for the same. Is there a source that can give an estimate of about how much is it overestimated by making a comparison with HV?
D. Is IV mentioned in option chains on Zerodha Kite daily volatility? Also, does IV changes with option expiry for the same contract? For ex 8500 Nifty CE with current month and mid month expiry?
Thank you.
A. Ideally yes, but some stick to 365. Depends on the time convention
B. Yup. Its not a % though
C. You can try Sensibull
D. Yes, IVs do change
Firstly, big thanks for the great modules you have created for beginners.
I have quite a basic query. In the example, i assume that you have used data of 11 trading days to calculate daily volatility. As annual volatility is calculated by multiplying daily volatility by square root of 252, how does one calculate 10 day historical volatility? Is it by multiplying daily volatility by square root of 10.
Yes, thats right, multiply the daily vol by sqrt of time. Time can be 10 days or 252 for annualised value.
Please explain in details. I am not talking about Bollinger band. Go to zerodha platform select any stock or any index and from\”studies\” pull down menu select STD DEV. Now see the parameters…… as such they dont have any role in regular STD DEV calculation. Even before coming to Zerodha/trading/share market I had some formal training in statistics…… I can not figure out the role of those parameters here……surely something is there which I am missing…..so explain precisely what (14,2,MA) means. By the way thanks for noticing my question.
14 = Period over which the STDEV is calculated. You can change this to whichever period you want
2 = The number of STDEV, you can change this to 1 or 3
SMA = For simple moving avg. YOu can change this to EMA as well.
In Zerodha trading platform when one selects STD DEV as one of the oscillators, the accompanying parameters by default are period (14), standard deviation (2) and moving average (simple)……. completely confused, how these parameters come into picture, what role they have, as std dev calculatin shown here (in zerodha varsity and same with standard test books also) such parameters have nothing to do with std dev calculations….. please tell me what am i missing.
YOu must be talking about the Bollinger band or something similar. These are the core parameters which make up the STDEV indicator.
[…] 16. Volatility Calculation (Historical) […]
Thanks (as usual) for your valuable time and response. I think I\’d tried both 252 and 365 numbers, no luck. Spot wasnt used for calculation, let me check out with it. Regards!
Good luck, Sachin.
Hi Karthik,
You are doing great job of not only educating, but also answering queries patiently. Hats off to you.
Just sharing my observation. Calculated volatility of Nifty future (based on future price and not spot price) as per method mentioned in this write up. Getting volatility as 1.27%, while NSE is showing 3.34%. No where close.
In the Comments section of this page, I\’ve seen many other users experienced such mis-matches for whichever equity/instrument they cross-checked. I tried the method of NSE\’s volatility calculation (it is mentioned in the daily volatility download report from NSE site), but using that also I\’m not able to come close to 3.34% volatility.
In case you know reason behind this difference, please share.
Regards,
-Sachin
Sachin, I\’d suggest you calculate the Volatility for both Fut and the spot, across both 252 and 365 days. Also ensure the time series matches, ensure your data is also clean. Volatility is a simple formula, it should not show up so much difference 🙂
To calculate annual volatility from daily volatility you have used time as 252 days; whereas in the excel sheet (the one we can download from the link given by you) you have used it as 365. Which one is correct? Similarly for weekly volatility, should we use time as 5 days or 7 days?
I\’d suggest you use 252 / 5 — represents the actual number of trading days.
Hi,
From the historical data for Wipro in above sheet, the close price is almost above 500. But, when I had back check using Zerodha graphs, the equity price of Wipro never went above 500. instead it is trading between 200 350. May I know why there is a difference? While downloading historical data, which series should I consider (like EQ or All)?
Regards,
Arun
Arun, you need to look at EQ series and I think the difference is because of this.
Sir,
In this chapter, you have demonstrated the calculation of volatility using past one year data. I have some queries:
1) What will be the effect if we calculate volatility using lesser data (say 15 days, 30 days, 60 days, etc.) ? Will it be reliable ?
2) What will be the effect if we calculate volatility using larger data (say 3 years, 5 years, 10 years, etc.) ? Will it be reliable ?
Regards,
Rahul Mishra
1) Nothing wrong, especially if you have a short term trading horizon (1 or 2 days)
2) I\’m not sure about the effectiveness of this. Intuitively, this may not make sense as most of these strategies are designed for short term trading.
Nice Explanation. Thank you.
Could you please let me know from where and how we get the 52wk High and 52wk Low of Historical volatility ?
Hmm, maybe you should check with Sensibull for this.
Sir,
I want to create a positive and negative range using the volatility of any given stock, would you be kind enough to help me out.
Doubts –
1. Can I use the LTP or closing price of previous day or should I use average price (traded value/trade qty?)
2. How to calculate the upper (positive) range and negative (downside) range
I have already explored the volatility report and figured out the daily volatility figures that\’s available there, however not sure about how to use them all together to have my top and bottom ranges that stock will normally range in 68% of times.
1) I\’d suggest you use the close prices
2) You can use the the same volatility function and the standard deviation approch, Prateek
Karthik thank you for all your efforts in making difficult things so easy to understand. I have few questions and please excuse me if i ask some stupid ones. Thank you in advance.
1. The Implied Volatility that NSE India website provides in its Option Chain is that IV in percentages?
2. Kindly help me in calculating IV with a demo example?
1) Yes, its in %
2) Estimating IV is a complex task 🙂 However, historical volatility is fairly easy as explained in this chapter.
yes…i am using data as mentioned on nse website.
Hmm, but make sure the data is cleaned up for corporate actions, even if the data is from NSE.
Dear kartik,
it was a beautiful journey with the modules and the kind of thorough knowledge of greeks and their impact on options..it really changed my way of trading options..but i have some doubt on calculation of volatility with the formulas u have given in the module..when i apply the same formula on wipro as u ahve mentioned in module it gives exact figure..but when i apply same formula on other stocks there is a huge differnece between my calculations and the one provided on nse website..plese help me with that.
Hmm, I guess the problem could be with the data points. Are you sure you are looking at clean data? Cleaned for bonus and splits?
Dear Sir, I calculated the same using your excel sheet for WIPRO (tenure 26/9/18 to 25/9/19) daily volatility is coming around 2.3% and annual volatility is approx 44 %. Then I checked the data on NSE site which is showing Daily Volatility 1.36% & Annualised Volatility 26.03%. Why this result is not matching??
Hmm, are you sure you are using the same time period? Also, make sure your data is clean for bonus and splits.
if i buy an usdinr option at price 0.0025 and the next day it shows the ltp at 0.0000 (-100%) then what happens to the contract do it get square off before expiry?
It will expire worthless unless a major move in your direction happens and the option premium picks up value.
SIR, HOW TO CALCULATE MEAN OF DAILY RETURNS?
Nilesh, just run an average function the daily return time series.
Hi,
Why you take 365 as no of days to calculate annual volatility/standard deviation because there is roughly 242 days in a year when stock market is open as we can see in excel sheet where you calculate volatility.
242 is the right number, Hemendra.
If annualized volatility is provided on NSE site,do i need to calculate on excel too?
Nope, you can use the same.
sir,
just like u explained the way to calculate annualized volatility, out of daily data. in similar way, how can i calculate annualized volatility out of intraday data?
for say, at 10:30 AM, i want to see the annualized volatility (of underlying) of nifty, based on 60 ticks of data (60 minute).
Intraday volatility is a little difficult to extrapolate. Even if you do, wont be too accurate. I\’d suggest you dont do this.
Sir/Madam
I am trading in Bank option for past 2 months. I am beginner in trading. I have lost big money in some trading. I am trading with out SL & Target. Is it possible put SL & Target in Bank option trading. If it is possible please send link to the above mail.
Yes, you can.
Very much grateful for your kind reply Karthikji. I got it. It\’s my silly mistakes to have not identified that i must be multiplying or divide with Sq root of time in any no. of days we desired that we learned in this chp.
But anyway this is what opinion of wisdom is all about!!
Thank u again & have a great evening 🙂
Hahah, don\’t worry about that. Happy reading!
Good morning Karthikji
Ah sure here I got it regarding clarity on annualised volatility.
1)But only one doubt is in volatility smile concept sections u\’d mentioned that \”Volatility is least at ATM strikes & increases as further we go away to ITM & OTM side\” So naturally ATM volatility will be at support or at lower side compared to annualised one ? Kindly correct me here in this situation
2)Whether we must compare monthly or weekly options ATM with annualised volatility?
Need ur opinion 🙂
Your courtesy, thanking you so much 🙂
1) No, it is difficult to correlate this. Cannot really say that the ITM/OTMs would act as support as the volatility is different at these strikes
2) You can always convert volatility in the time frame you like by either multiplying it with Sqrt of time or dividing it (based on your requirement)
Good morning Karthikji
With ref to above mentioned questions rply…
Yes definitely reading & understanding isn\’t one time affair or thing. One need to polish himself/herself in visiting basic to advance time & again. So keep on reading & enhancing myself with writing imp notes too. We\’re enough fortunate that u\’d authored & mentored us 🙂
》Yeah regarding one of last doubt here, I mean can we compare annualised volatility & current IV for rough comparison. For eg. Nifty annualised volatility is 16 & current IV of say Nifty 11650CE strike is 8. So can we design spread trade with this rough comparison in stocks/index. Although I\’d huge respect for above annualised volatility calculations work that I still do but I\’m saying out of my idea if this rough analysis between annualised & current IV works too ??
Pls correct me with ur opinion
Thank you 😊
Yes, you can compare the annualized volatility with current IV, but make sure you are comparing it with ATM strikes (which has maximum liquidity), and not OTM or ITM strike.
Good evening Karthikji,
Although I\’ve read most of your modules long back around 2 yrs ago but I kept on visiting & revising varsity esp options, technical & fundamental analysis so have to ask questions accordingly in comment sections each time doubt arises…
Although u\’d made volatility understanding as simpler with your fabulous writing as walk in a park 🙂
In this particular Chp I understood fully the ground work for historical data works & I do it on excel too. My questions is
1)Since the Chp heading is calculations for \’Historical Volatility\’. But at the end of chp there\’s annualised volatility estimation or daily volatility but historical volatility is not visible anywhere ??
Is annualised volatility & historical volatility can be treated roughly equal as an average over long time ???
2) where to find out historical volatility reliably ? ?
I\’m glad you continue to like reading Varsity 🙂
1) Historical volatility is the base for calculating the annualized volatility. The bulk of the chapter is focused on calculating historical volatility.
2) Historical volatility cannot go wrong as it is a 2 step calculation. I\’d suggest you do this as described in the chapter
Time = 365
Annual Volatility = Daily Volatility% * SQRT ( ? )
** ? = Time OR Todal Trade days which i choose ? **
T= Time, which is the total traded days. So you can take 252.
THANKS FOR THIS USEFUL INFORMATION !
* * * *
Q.
Daily Volatility = 1.47%
Time = 365
Annual Volatility = 1.47% * SQRT (242) [ TIME = total trade days – 1st day ]
= 22.40 % is right or wrong ?
Thats right, Lalit.
Isn\’t there any method to use a common formula for all the data?
No Ram, unfortunately, that is not available 🙂
Hey Karthik,
While calculating the daily returns in Excel did you manually type all the formulas like LN(B3:B2) and LN(B4:B5)?
Yes, I would imagine so. Why?
A chapter for delta hedging.?
Will try and put that up sometime soon.
Respected Sir, appreciate the level of hardwork for extremely simplifying the concept of OPTIONS.
Thanks for the kind words! Happy reading 🙂
sir, I couldn\’t get the intuition behind multiplying SQRT(365) to convert the daily volatility into annualized and dividing SQRT of 365 with the annualized volatility to get daily volatility can u pls throw some light how are they working
Volatility and time have that inverse relationship, Sahil. It has a complex mathematical explanation, let me check for a link which explains this.
in this module we learn how to calacute any particuler stock volatility , but how to find most volatile stock on NSE&BSE have more then 5000 stock listed. i hope you understand my qustion /
Vishant, the only way to do this is to find the volatility of each stock and make the assessment. It is best if you can program this and track the volatility.
ok. by the way we can downlode data of high beta stock on NSE stie right ?
and thanks for this type of study matirial its easy and very usefull.
I\’m not sure if NSE gives you this list, you may have to calculate this based on the historical data.
sir, while downloading security wise data(equities) from nse site, when we put \”ALL\”, DATA OF SEGMENTS LIKE EQ, E1, BE is also downloading. so even if we downloading for 365 days, it is showing data for more than 400 days. my doubt is, to draw volatility should i exclude all other data and take only equity?? (for this i select only EQ and press get data). or should i definitely need all segments data and compulsorily check \”ALL\” and then press get data? please clarify sir.
THANK YOU
No, you need to download only EQ segment. The rest is not really needed.
thanks for the quick reply sir.
am really thankful to you sir for providing zerodha varsity.
i read all chapters 1 yr back when i just started trading.
and i come here to refer some topics when i need some clarification.
everytime i revisit , though i re read same topic, i get to learn a new thing.
i think gaining real time experience and brushing basics again and again really helps a lot (as we tend to overlook some basic things in the speed of the market).
your work, the way you put the content really amazes me becauses u stressed areas where ppl go wrong or what ppl really need.
THANK YOU SO MUCH.
Thanks for the kind words, Lokesh. Yes, re reading the same thing after you\’ve gained some experience is an amazing way to unlearn and learn again. Good luck to you, Lokesh!
Hi Karthik, Let me start by appreciating your team\’s effort in providing an extremely valuable resource like varsity to all the novice traders like me. This comment is regarding one of your posts on the \’wall\’ of varsity app regarding the relationship between \’India Vix\’ and IV of the options. for the context of other readers, they can read the \’opinion\’ in \’ The Wall\’ of \’vasrity\’ mobile app by the name \’ Implied volatility and the associated mystery!\’. last week, I have observed hat the India vix has touched 20s but the IVs ATM options of April series is around 15. I thought that IV will rise along with the India Vix and I also have a directional view that Nifty will move up in the coming week. since I have a directional view and also on the view of IV but not sure of the timing which it will take place, I bought the ATM options .After bought the CE the IV dropped further to 13 and I had to book a loss. your article has cleared many of my doubts but here is my doubt sir, In my understanding when India Vix is high, Nifty fluctuates violently and accordingly the deltas of the ATM options also should fluctuate violently and so the premiums of the options, resulting in higher IVs of ATM options But that did not happen in this case. According to your article, India Vix is estimated from the option IVs but are\’nt option IVs a function of India Vix also resulting in a cyclic relationship? how to analyze the effect of India Vix on the options? Please correct my understanding.
I\’m glad to see this, now I know there I at least 1 person looking at the wall apart from me 🙂
India ViX is derived from the IVs of the ATM calls and put. IVs are independent and is derived from the price, and this gets fed as an input to compute the ViX, so there is no cyclical relationship.
Thanks for your clarification. \’The Wall\’ indeed is a very good initiative. My first task everyday morning is to check it . Keep up the good work. I am waiting for all the modules to be updated in the mobile app. Also it would be helpful if the comments are also enabled. Since I could not ask the doubt there, I thought this is the most apt chapter and posted my doubt here.
Neehar, I\’m glad you liked it. I hope we will have a notification for the Wall soon 🙂
We are also updating all the modules soon. Working on it. Unfortunately, we can\’t have comments on the app, it will be a huge challenge to manage. But we are exploring alternatives.
I tried the formula to calculate volatility with WIPRO and INFOSYS I get totally different values compared tot the NSE values what am I doing wrong here For WIPRO I downloaded the data from 9-Apr-18 to 5-Apr-19 and the values I get are Daily volatility=0.022771937 and annual volatility = 0.435057254 but in NSE site as per today I get these values Daily Volatility=1.56 ,Annualised Volatility=29.74 now for the INFOSYS I get these values of data from 6-Apr-18 to 5-Apr-19 Daily Volatility =0.044771493
Annual volatility = 0.855358176 but the NSE website gives these values Daily Volatility=1.18 ,Annualised Volatility=22.50
And What should I do calculate the Daily Average Return should I just take mean of the Daily returns which I calculated in the sheets
Sorry for the long post 🙂
Ajay, are you converting the daily vol to annual volatility properly? You need to multiply with the square root of 252.
Karthik in the example spreadsheet that you gave it has the formula of sqrt(365) and now if I use sqrt(252) I get the value around 36.15% the Nse site gives 29.74 % is this variance considerable ? Or is it common to have such difference
I think its ok, you can consider average volatility of around 30-34%. You won\’t be off by a large margin here.
Hi Karthik
While converting daily volatility to annual volatility, you considered time as 365 days. Wouldn\’t it be proper if we consider 250 daily trading sessions, and hence multiply by SQRT(250)?
Yes, 250 or 252 gives you the trading number of days.
Hello Karthik,
I have a question on Implied Volatility. It is said that IV of the ITM should be considered by making any decision, right!
Now, as the index/stock will move up or down, the ITM will change often. Hence will be strike price change and also will the IV, as it to taken based on the ITM, right! So if one wants to compare/study IV movement wrt index/stock, should we change the IV accordingly to the Strike Price?
Regards
Anand
Anand, you look at the IV of an ATM strike and check the volatility level. Once you do so, the strike may transition from ATM to OTM or ITM, this is ok.
Hello Karthik,
Thanks for the answer.
First of all, the question I had asked, was about ITM… which was completely wrong. I was supposed to write it as ATM.
Still, you answered correctly.
Now, coming onto the right track… Which ATM Stirke Price should be selected, when say, NIFTY is trading at 10450.00, ignoring the multiples of 500\’s. I mean to say that the Calls/Puts, in case of NIFTY, having a strike price as 9500, 10500, 11500.. like on, don\’t have volumes. The best ones are in the multiples of 1000\’s.
One more to add… should the IV, Open Interest and other greeks are to be considered for the NEXT month contract? If yes, then when… from the start of the contract or near the ending of the contract?
Regards
JB
Anand, ATM strike is the strike which coincides with the market price. So if Nifty is trading at 10450, ATM will be either 10400 or 10500.
Why you have don\’t calculated exact trading days insted of 365?
There are 252 trading days in a calendar year, Uday.
Hi karthik,
Is there any standard formula for calculating volatility.
For eg: Annual Volatility- Daily Volatility*SQRT(365), similarly if we want to calculate for 7 days, or 30 days etc.
Thanks,
Manish
Manish, replace the 365 by the number of days you are looking at.
We get Daily and Annual Volatality for all stocks directly here:
https://nseindia.com/archives/nsccl/volt/CMVOLT_22022019.CSV
sir ,
If I have to find 7 days volatility of nifty with the help of ATR band , so the atr band settings like period 7 , shift 1 and weekly time frame. correct ?
Yes, more on that here – https://zerodha.com/varsity/chapter/supplementary-notes-1/
Thank you Sir
Welcome!
I am curious to calculate my own IVR..Help me out with calculating 52 weeks high iv and 52 weeklow iv
Hi,kartik well explained topic..i am not a statistics guy but want a quick help from you..as you have calculated here daily volatility and annualized volatility.How do i calculated 52 week high volatility and 52 week low volatility.I want to calculate iv rank for any stock and formula needs an input like this IV Rank=100 x (the current IV level – the 52 week IV low) / (the 52 week IV high – 52 week IV low) .I can fetch current iv from NSE option chain.please help me in calculating my input 52 week iv low and 52 week iv high..
Gautam, I think Sensibull should provide this – https://sensibull.com/
What if I want to calculate realized volatility for 5 years. Do i do as above, that is, multiply the stdev by sqrt(252) ?
Realised volatility in a sense is the historical volatility 🙂
thats ok. Am asking that if I want to calculate the 5 year historical volatility, do I take the stdev of daily returns of last 5 years and multiply by sqrt(252) ?
Yes, calculate the avg and multiply by sqrt of 252.
Thank you sir for explaining the topics in a great manner and that too explaining almost every topic on stock market. Sir I wanted help from you on understanding how to calculate 2 standard deviation so that I get 95% probability levels.
Thanking you in advance for your help.
Vivek,
1) Calculate the average of returns
2) Calculate the standard deviation of returns – this is 1SD
3) Add and subtract 2*SD from the average returns, and you will get the 2SD.
Dear Karthik,
I was trying to calculate the average return for few shares like L&T finance holding, Sunpharma, Jetairways and Yesbank. Calculated log return from 22 Dec 2017 to 21 Dec 2018. Now since each of their shares have gone down so their average daily and monthly return is coming out to be negative. Now how should i calculate their returns for the purpose of finding SD 1 and SD 2 in case I want to take a trade on the basis of Volatility. Kindly guide
Also now IV is not mentioned for different strikes. Where can I track the same?
You should probably check sensibull for this – https://sensibull.com/
Calculate the average return
Calculate the SD of returns
Build the range by adding and subtracting the avg return from the SD
If the stock has trended down, there is nothing we can do to alter the equation.
Dear Karthik,
I was trying to calculate the average return for few shares like L&T finance holding, Sunpharma, Jetairways and Yesbank. Calculated log return from 22 Dec 2017 to 21 Dec 2018. Now since each of their shares have gone down so their average daily and monthly return is coming out to be negative. Now how should i calculate their returns for the purpose of finding SD 1 and SD 2 in case I want to take a trade on the basis of Volatility. What should I do. Do i need to take the range for longer period if return is coming negative for one year I am calculating.
Sukhdeep, use shorter term time periods like 6 months. Also, as an alternative you can also use ATR.
Dear Karthik
I am thinking seriously about working in HFT and algo trading firms. I want to know some of the advanced mathematical concepts, probability and statistical techniques that are used. Can you tell me a few references where I read these?
Thank you
Prafulla
I\’d suggest you run through the Trading Systems module here – https://zerodha.com/varsity/module/trading-systems/
Dear Karthik Sir,
How can we get adjusted stock price of stock. As after bonus declare of stock its price gets half (in case of 1:1), but in NSE historical data we can not get the adjusted price and for this I am suffering to calculate volatility in case of Infy (as 1:1 bonus declare by management in Sep 4, 2018).
Bhimalendu, usually NSE has clean data. Anyway, I\’d suggest you download the data from Pi.
Hi Karthik,
Could you share the way data cleaning is done. For retail investors/traders like me, who track and trade a set bunch of stocks, that could be very helpful.
Hope that\’s not too much of botheration 🙂
Thanks
Shernik, this can be quite tedious. It is best if you can download the data from a professional data source.
Hello Kartik,
Where to find Bank nifty daily volatility. I am getting a daily volatility of 1.90 for the period from the very beginning to 29th Oct. I want to cross verify. Please guide me. Thanks
Check the \’other information\’ section at the bottom of this page -https://www.nseindia.com/live_market/dynaContent/live_watch/get_quote/GetQuoteFO.jsp?underlying=BANKNIFTY&instrument=FUTIDX&type=-&strike=-&expiry=29NOV2018
Thanks. For trading in Bank Nifty Options, do i have to calculate Volatility based on Bank nifty spot price or Future price. The site which you have referred shows the Volatility of Bank Nifty Future price. To trade in Bank Nifty options we refer to the Bank Nity Spot price. Where do i find Bank nifty Spot price Volatility? Kindly clarify. Thanks
You certainly can take the futures, Shekar.
Dear Karthik,
Just wondering if Zerodha Sensibull has any plans to introduce a volatility lab ( something similar to what interactive brokers ) are offer.
I would request you to watch the video below to give you an idea of what I\’m talking about. Obviously you don\’t have to watch the entire video, just watch for 1-2 mins and you will know what am I referring about.
https://www.youtube.com/watch?v=zT1H4vjMTjc&t=367s
Thank you very much for all you do to make our trading experience better.
Best regards
Ron Kalra
I\’ll bounce this off with the Sensibull team, Ron. Thanks for sharing.
Good evening sir
I followed the same steps as yoy have told to calculate std dev. And for wipro for todays date i got standard dev 0.31 with formula =STDEV(E3:E245)
so this 0.31 is absolute or in percentage…
I mean this is 0.31% or do i need to multiply it with 100 now to get std dev %.
Thank you
Coz 31% daily volatility seems a bit unlikely.
But i assured you i followed all the steps….
And with formula =STDEV(E3:E245) AS per my excel sheet gives me 0.31…
So is this 0.31 already in percentage?
Please tell me if i am wrong
Your daily rate was in percentage so i changed my formula to =LN(B3/B2)*100
is this correct approach or this is the main root problem that i am getting my daily standard deviation as 0.31(or this 0.31 value is already in percemtage)
And thanks for you previous reply in delta 1 chapter….that cleared my query.
Have replied in your previous comment.
31% is very likely for stocks, Edward. The index\’s volatility itself can go up to 22-25%, so for individual stocks, this is very common.
It should be expressed in %, so that would b 30.1%.
While calculating daily return(using LN) your values are in % but mine are not in %.
Your calculation-
23-Jul-14 570.9 2.15%
I am calculating the same
23-Jul-14 570.9 0.021511917
how to get 2.15% in my case?
Are you using excel? If yes, maybe you should convert it to %.
Got it – your line expressed as a percentage 🙂
Cheers!
In this chapter you have calculated daily return of wipro using MS excel formula up to that I could understand but how you are calculating \”mean\” i.e average daily return is not clear to me please help me to understand.
Again, I use excel for this. Use the function \’=average()\’ for this.
Hi Karthik,
I did the similar calculation for TCS from 24thAug2017 to 24thAug2018
And I got the following values which are different from the values on nse website
Daily volatility=4.67
Annual volatility =89.33
Please let me know where am I wrong
Someone commented earlier, I guess the difference is because NSE is using the opening prices for these calculations whereas I\’ve used the previous day closing.
Hi Karthik,
I am absolutely loving the way the content has been written. Excellent work done!
Wish I had come across this earlier.
Was just playing around with the data of Wipro for the same period as in the example.
The reason for difference between NSE\’s calculation of daily volatility and your calculation could be because it appears NSE took LN(Close Price/Open Price) while calculating daily return whereas you have taken LN(Close Price/Prev. Close Price). By using this formula, I\’m getting daily volatility as 1.34%.
Keep up the good work! And thanks a ton!
Aditya, this could be one of the reasons, thanks for digging up 🙂
Also, thanks for all the kind words, keep learning 🙂
Hi Karthik,
Thanks for your sharing your in depth details in options. I would like to know where we can get the companies financial/latest update (specific date information) before getting air.
This will be updated on their website, under the investor section.
What\’s up to every one, the contents present at this site are really remarkable
for people experience, well, keep up the good work fellows.
Hello sir,
Could you please tell me from where we can get Historical Implied Volatility Data for stocks and Indices?
You will have to extrapolate this, Mehul. Quite a cumbersome process. Do check out Sensibull.com for historical IVs.
i calculated the daily and annual volatility based on above calculations for nifty and banknifty.
Nifty
Daily Volatility 0.65%
Annual Volatility 12.37%
bank Nifty
Daily Volatility 0.85%
Annual Volatility 16.17%
Please advice if the above calcualtion is ok
When traders talk about high volatility and low volatilty what is the percentage that you would say is high and low.
Can we refer india VIX for nifty and bank nifty?
What is the ideal volatility % for Nifty and bank nifty?
Annual Volatility = Daily Vol * Sqrt (365)
= 0.65% * Sqrt (365)
= 12.41%
You can refer to India ViX to get a perspective on how high/low the volatility really is. Also, there is nothing like ideal volatility 🙂
Hi,
Please see below link
https://drive.google.com/file/d/1zbOGojgXNkBNE7I5urm8JeFE4C1w54Oy/view?usp=sharing
As per my understanding one needs to buy call when volatility is low and sell when volatility is high
Today i bought a 10700 call when india vix was low. Surprisingly the market fell down in the morning and india vix was rising. To minimize the loss i hedged it with a put and scraped out with minute profit though this is a loss as i havent considered the brokerage charges and the end number of transaction costs. Kartik please tell me where do you think I went wrong?
This is really frustrating. Market is indeed a brutal place .It doesn\’t give a 2nd chance.
1.Why is india vix volatility is falling when market is rising?
2.Which volatility should I refer ? India Vix or implied volatility?
When I saw the charts later I rued my decision of closing both the positions. If I could have held out on my call positions i could have made a decent profit. Panic got the better of me today. In last 10days I have missed such trades since last 10 days.
1) Shyam, in general, ViX increases when markets fall and ViX cools off when the markets increases
2) If you are trading Nifty, then I think India ViX should be good.
Holding to winning position requires a great deal of mental makeup, not really an easy 🙂 Hopefully, with time your trades will also evolve. Good luck.
Ohh I didnt know about this.
When traders talk about shorting when volatility is high which volatility are they referring to?
Also should we refer VIX for bank nifty also?
ALso i was checking the implied volatility for nifty 10700/750/800 CE yesterday. They were in range of 7.5-8% . and VIX was 11% .
Now how do I interpret this.
Sorry for bugging you with all these queries. Its just that last 10 days have been really frustrating
They are referring to IVs. ViX for Bank nifty may not be the best match, but nevertheless, you can. The comparison tells you that the IV for these options are lower.
Good luck, Shyam. Take your time to learn, the market always has 100s of opportunities.
So in short I need to buy when vix is falling and sell when vix is rising?
Yes, pretty much so assuming you are tracking other variables as well 🙂
Can we calculate intra-day volatility ? Please revert.
Hi Karthik,
For calculating yearly volatility you have taken 365 but in actual there would be close 250 working days so not sure which one to take 365 or 250. Please throw your thoughts if 365 should be taken and why?
You can actually take 252 as these are the total number of trading days.
hii karthik,
can i perform the same calculations for base metals & bullions???? does it make sense??
Yes, you certainly can.
how to use daily volatility for intra day trading?
Do check this – https://zerodha.com/varsity/chapter/volatility-applications/
Hello sir,
I have a question when we calculates historical volatility, i guess this is the volatility of nifty50 underlying or nifty 50 futures right sir,
i calculated same for last last year it worked out almost 9.25%. but how to Relate this volatility to particular option strike i mean we have lots of strikes available from DEEP ITM to DEEP OTM. in which some strikes has 12%VOL. 15%,40%55% or may have 75% volatility. let say i took a naked call buy Strike10700 @112/- with IV @19%. then will i say like\”The historical volatility of Nifty 50 is @9.25% but this particular strike has volatility @19% so it is expensive Right Sir but i did not understood point here. How can i relate nifty option volatility to nifty underlying
in my sense we can take a good trade in nifty future by assessing nifty underlying volatility but not in option.
is somebody asking me to BUY 10700 strike @112/- because volatility looking low as compare to other strikes which has high volatilities like 25%,32%21% or like that Then i will reply him NO Dudei can not take this trade because i dont have historical data of this particular strike to calculate its Historical volatility i only have volatility smile and cone option to decide but thats not appropriate to me
OOOhhh. i dont know i have able to tell you what i am talking here, i really missing some features such as audio massages, video post, snapshot posting here. i tried google drive link posting but it was saying your comment is awaiting for moderation and yet not answered. Sir please please please provide some mutual interacting platform where peoples in need can directly approach you by audio video massaging or youtube live facebook live, because only reading and writing is not sufficient. if you say i can pay you for that
Thank you sir…..
That would be on Nifty 50, Index (underlying) and not on Nifty Futures. Although, you can calculate the same for Nifty futures.
Considering the underlying\’s volatility to an option\’s strike volatility is only a crude approximation, Ankit. However, you can look at the strike\’s implied volatility and get a better sense of how the volatility is playing out. If the implied volatility is over 25% then yes, consider that as high. Or if the IV is around 8-12%, I\’d consider this as low.
I\’m very active on Varsity, so please do drop your queries and I will try and respond back as soon as I can.
Good luck and happy trading.
Hello sir
Could you provide me the link to download split adjusted historical stock prices? I googled but didn\’t get any save this https://www.nseindia.com/products/content/derivatives/equities/adjust_in_case_corp.htm
Thanks
You need to check with an exchange authorized data vendor for this, someone like Truedata will help.
Hello sir
I calculated the stdev for Mothersumi stock and it was 2.59% but on nse website it was 1.56%. I checked the minimum return from my excel sheet and it was -33.35% on July,5\’ 17. But when i saw the chart it was smooth. Then i realised it might be a case of stock split, and it was.
My question is: Does the stock split affect the standard deviation of its daily returns? If it does then how could we calculate the correct standard deviation?
Thank you 🙂
Not really, in case of split, please consider the price chart adjusted for corporate actions.
People are telling good things about you, many are giving blessings also, how do you digest so many +ve words ? Because some people can\’t handle success.
Please answer below questions as well
1.) In comments you have written about ATR also, how close ATR is in comparison to volatility ?
2.) How closely BETA of a stock and volatility ? Since if market moves some % then stocks movement is based on BETA.
Santosh, if there is one thing that market teaches is to stay grounded! One should never take such things for granted 🙂
1) ATR is a good proxy for volatility – you can use it as good as Vol
2) Beta measures the sensitivity of the stock wrt to an index, vol, on the other hand, gives you a sense of how volatility the stock is to the overall market.
whe i downloded the csv file from NSE website for calucating volatility i noticed something. please check the historical data of kotak bank for last 365 days. 8th march 2017 data is given 2 times. and see the closing price 490 & 817. what is this? is this an error? if it is then such errors may lead to huge differences if unnoticed. whats the solution?
Will try and check this Chinmay.
sure sir..
Hello sir,
Is implied volatility on NSE option chain is anualised
Let\’s say I am going to open an call position on the basis of volatility I expect the volatility will increase till coming budget
So my market view for 7 to 8 days from now
When I compare this volatility with historical volatility I got confused
Is there any way or any tool to decide what should be implied volatility for next couple of days
Or or should I need just avoid volatility and buy an ITM option and play Just intrinsic value…..
OR
In other case I am looking for a long strangle on Nifty 50
When I compare the Nifty 50 index performance near or on the day of budget I found that generally nifty to take an upward Trend firms slightly bullish on Nifty from now and expect and level of 11100 before middle March
I\’m not guessing this I did some math on Nifty historical performance near budget
No just volatility confuses me.
Sir you did very good work in your city on volatility but I found something that it is not sufficient to understand volatility for practical purposes.
I personally found we need something more to understand volatility practically
So I request you sir, you personally put some lectures or video on YouTube or something like this
This will be a great help for us
I found just reading of volatility not enough to play or use volatility
Thank you sir
We will soon make few announcements on Option tools. I\’d suggest you stay tuned on that. Meanwhile, if you expect the volatility to increase, then yes, buying an option makes sense. I\’d prefer to trade ATM/Slightly ITM option considering the time to expiry is quite short.
I will try and create a volatility mini-course on youtube.
Difference in volatility due to taking day is 365 .Actual working is less 261
Ok.
Karthik – Let me start off saying it has been a great pleasure going through your blogs. Hats off to you for making this easy for newbies like me!
Now, my question: Based on the steps you have given to calculate daily and annual volatility, I did the same exercise (on Jan 4th 2018) for Bank Nifty by first downloading the historical closing prices from NSE (period Jan 1 2017 till Dec 31 2017), getting daily returns, then getting the average and STDEV. I got daily avg as 0.14% & hence annual avg as 51.95%. Daily volatility calc came upto 0.77% and annual volatility as 14.7%. NSE showed daily volatility as 0.64 & annual volatility as 12%. I think I am slightly off but is my calc correct so far? I ask this because I got stumped when I continued:
With annual avg as 51.95% & annual volatility as 14.7%, I am now getting upper limit of 66.65% and lower limit of 37.25% which doesn\’t seem correct because I believe the lower limit should be a negative number which is only possible if annual volatility is lesser than annual average but it is not in my case. Hence the lower limit is now higher than CMP! What am I doing wrong?
Harsha, you get a +ve lower range when the stock or the index has trended positively for the look back period you have considered. Likewise, you will get -ve values when the asset has drifted downwards. A mix of both +ve and -ve when the asset has been sideways (with probably a slight directional bias).
Hmm, makes sense, thanks. I was wondering if I was doing a mistake somewhere…
Good luck and happy learning, Harsha!
What should I do when annualized daily return is more than annualized volatility?
Not sure how this is possible because the annualised volatility is a multiple of daily volatility and time. So annual volatility is always higher than the daily volatility.
Thanks Karthik.
In Excel,
Annualized Daily Return (365 trading sessions) = Average Daily Return * 365 = 0.07%*365 = 24.52%
Annualized Volatility = Daily Volatility * 365 = 0.67%*sqrt(365) = 12.79%
Range with 1SD is more than cmp on both cases for next year (37.31% and 11.72%)
Does this mean stock is on a bull run or Am I doing something wrong here?
Yes, you do tend to get such numbers when the stock is in a good (up) trend.
Hi Karthik
How to calculate historical volatility for the purpose of estimating IV ranking? More specifically, is that calculated from SD of underlying or using historical IV data?
Thanks
Pankaj
You can use the \’=STDEV()\’, function in excel to calculate the historical volatility. You can check the present day IV with historical IV, this will only give you a fair idea.
Thank Karthik. How to obtain historical IV?
You can use the excel function =\’STDEV()\’, for this. Have explained the same in the chapter.
In next Chapter
one of example you have mentioned
Daily Average Return = 0.04%
Annualized Return = 14.8%
How did manage to Get Daily Average return or Annualized return
what is formula to get et Daily Average return or Annualized return ???
Please advice
The calculation is explained in detail in the same chapter, Venu. Please go through it once. Thanks.
Hello Kartik,
Inputting the data into Zeroda BS option pricing formula with Nifty yesterday underlying close at 10210.85 for a strike of 10300 call with expiry as 26/10/2017, 15 30 hrs ,current day AV as 12.26 and RBI 91day treasury bill yield as 6.07 outputs to 38.58 as the call option price.But if the same is input to as 24/10/2017 as expiry dates shaving of the 2 day trading holiday ,option call price reflects to 27.81(settlement price is 28.45). Diwali one trading hour would compensate to that.So my question is , Is not imputing calendar days give distorted results in option pricing.
It would be appreciated if in the expiry column the default time is set as 15.30 hrs instead of 23.59 hrs. On a detailed analysis coupling economic analysis data.fundamental analysis data,technical analysis data,quantitative analysis data and scientific analysis data(price equating to an object and applying the principles of newtonian motion , chaotic motion and butterfly effects) the calculation done taking calendar seconds an year seems to be wrong in the underlying and its subsequent expression in derivatives which even Nse calculates and it ought to on market activity timelengths and not on continuous timelengths.
Najeeb, I understand. We are working on something better for options.
If you want I can send the excels on which I have done working ..
Sure, maybe you can do that to [email protected]. Thanks.
Hi Karthik,
Content is very well developed. Thanks for this.
I tried calculating annualized volatility for five different scrips but except HDFC bank no scrip is giving perfect or near to the actual number. I had compared with NSE website.
I had followed following steps.
1) Download last one year closing price from NSE
2) Calculate daily returns
3) Calculate SD
4) calculate annualised SD by multiplying with SQRT(365).
I am not able to calculate the correct Volatility. Can you please help. I am existing zerodha client.
I think NSE has a slightly different approach in calculating the volatility. By the way, how much is the difference? If it\’s not much, then I\’d suggest you ignore it.
Difference is huge sir. Almost double in some cases
I need to figure this out, Parmar.
Hi Karthik,
I am sure that there is a special place in heaven for guys like you !!!
Have been reading the Varsity Modules for some time now. They are great.
I have a few queries & would be delighted to have your feedback (whenever you get the time).
Query A
I downloaded the historical data for ONGC, Reliance, Bharat Electronics & Wipro. The daily volatility & the annualised volatility dont match at all.
I am using the same LN(b3/b2) / STDEV function & am getting results that are more than 3 times the actual daily / annual volatility posted on the NSE website.
What do you think is the issue ?
Query B
Can you suggest a few books to read only by Indian authors & mainly relating to the Derivative Segment.
Thanks
Thanks for the kind words, Nerav 🙂
Query A –
You need to convert daily to annualised volatility. Cannot really compare daily to annual without this conversion.
Query B –
Frankly, I\’m a little out of touch on the latest books related to derivatives. That leads me to an interesting question – what do you think is missing in Varsity that can be plugged to make you more confident about markets? I\’m asking this because Varsity, at least according to us, has most of the things you need to get started on derivatives 🙂
Karthik –
1. Are Market holidays like Saturday and Sunday also considered (for time value) while calculating the Theta value? Then as your said Friday makes more sense.
2. While selling options, Is it that by the last Thursday of the month, the strike price shouldn\’t hit the exact target number or is it like
even if it is near the target we lose?
Thanks!
Ash.
1) Yes, it does
2) Yes, last Thursday is when the expiry happens, so the spot should be higher than strike (for calls) and lower than strike (for puts) for the option to be profitable, anything else you lose money as an option buyer.
I was talking about option seller not buyer, like under what scenario at expiry will he be able to pocket the premium?
If I sell the 10000 nifty index call and upon expiry the market is at 9999, can I retain the premium and be profitable? Even though the difference is just 1 point.
Yes, as long the spot price is less than the strike (in case of calls) and more than the strike (in case of puts) the option seller can retain the entire premium.
Karthik.
Any foreseeable impact of delta decay(charm) vega decay(veta) gamma decay(color) on theta especially in leaps.Apart from gamma do any of the second degree and third degree derivatives has any impact that we need to analyse any of these?
The 3rd order matters if you have super large account size, where a small impact can cause a large Rupee value damage. For a typical retain book, it does not have any impact (at least as far as I understand).
Kathik, One doubt ,What will be the percentage decay of the option on a daily basis daily supposing the underlying stays at at the money(theoretical) till the life of the option .Also is there any relation in percentage between daily volatility and theta decay percentage when underlying at the money? Please guide.
If all else equal, the loss in option premium owing to time decay is equivalent to the theta of the option.
If the volatility increases, then the premiums also tend to increase. This is especially true when there us fewer days to expiry.
Hi Kartik,
Thanks for the plethora of information you disseminate for free.To my knowledge Nse publishes the previous day daily DV and current day DV and AV in (view all end of the day reports) in market reports for around 1620 stocks.I find these SD calculations based on a closing price basis.Where can i get an intraday volatality measure say like for a tick and for time frames during a day(I minute ,5 minute, 15 ,minute likewise)?
Intraday vol is not available, Najeeb. YOu will have to take the daily vol and make estimates.
Regarding annual volatility calculation as the sum count(number of observations) comes to 245 wont it be an error if gone for 365., a situation of 4.98 days of volatality and 2.02 days of zero volatality.Had it been annual return calculation 365 seems ok.Pls guide.
Can you please rephrase this? I\’m a little confused.
Standard deviation is seen taken based on the closing price of the traded day.This year the total number of trading days is 245 after shaving off weekend days and trading holidays.Leap year have 364 days.So normally we have 5 days volatility and 2 days of 0 volatality.Holidays need be considered too.Hence I wrote 2.02 days of non volatility .If the observation is the annual traded days is it not logical that annual volatility ought to be on the number of trading days too .Nse takes 365 days where may US traders take it as traded days.Which is more accurate ?
Got it.
I personally prefer 252 days, but I guess many prefer 365 considering NSE uses the 365/365 day count convention.
Karthik Rangappa many many thanks for explaining the volatility and greeks n find it useful.one doubt- for calculating weekly/ monthly volatility , one should multiply the daily volatility by sqrt of 7/30. is it that much only or we should take into account anything else? also if we use weekly/monthly close values then the volatility obtained using the abovementioned procedure is weekly/ monthly volatility and no further corrections are required? please answer
regards
girish
To convert daily volatility to yearly, simply multiply by Sqrt of 365….and to convert to monthly, multiply it by sqrt of 30. Basically, you have to multiply by square root of time.
Dear sir,
where do we get the data of average volatility of stocks & index to compare whether current volatility is high or low?
I guess you are talking about historical volatility. This has to be derived.
sir,why does zerodha only allow stock options to sell and not buy;any specific reason?
Of course, you can buy stock options. No restriction as such.
sorry sir,i meant to ask in BO as it shows buying calls is enabled only in nifty.
I guess it\’s best if you can give a call to our support center.
Hi Karthik,
I downloaded Maruti data for past one year from NSE site and have tried to calculate Daily Volatility which comes to 1.38 but on NSE it is coming as 0.88. Data taken is from 2nd of Aug 2016 to 1st of Aug 2017.
Any specific reason for it.
Not sure, I think there could be a date mismatch?
Hi Karthik,
Learning a lot for Varsity., Lot of things are getting clear and helping me to trade well. Between i wanted to share a technique which will reduce time spent of downloading data and doing various calculations.
We can actually automate this Volatility calculation using the Google Sheets ( aka Google Excel) , Creating a sheet and using Googlefinance formulas ( https://support.google.com/docs/answer/3093281?hl=en)
Ex: I Can create a new Google excel sheet and in cell A1 use the formula =Googlefinance(\”NIFTY\”,\”PRICE\”,TODAY()-300,TODAY())
The above formulas gives data for last 300 trading days and we can then use other formulas linking to this data, which gets updated every day.
Hey Chetan, thanks for sharing this information. I wasn\’t aware of this at all, owe you one now 🙂
Hi Karthik,
Instead of Manual Daily volatility calculation, better we can refer NSE itself ( Derivative ) …
Sure, you can do that as well 🙂
When i calculate historical volatility using B3/B2-1, the result differs a bit from what i calculate using logarithmic returns. According to you which is better?
For under a year, use simple returns…for multi years, I\’d suggest you use log return.
First of all,
thanks sir for these wonderful lessons but i have two queries that.
1. Should we also consider Rakesh Jhunjhunwala\’s money or investment as smart money?
2. can we calculate volatility for nifty for the month through india vix as we know that if we want to calculate the next month volatility through india vix say a month then the formula is (Vix / sqrt (T))%.
If we want to know that what is the monthly volatilityof nifty based on india vix (current-11.53),
we should divide 11.53 to square root of 12 (t-12, 12 30 days in one year) So the expected volatility based through vix for the month would be 11.53/3.464 =3.32%.
This expectation of monthly range of nifty can be used by the people who use options especially option writers.
Example, shorting option above or below the expected monthly range of nifty.
Sir, my question is can i use this method for the calculation of expected range
of nifty?
1) Yes, simply because he trades with a much larger capital base.
2) Sort of, but the best way to forecast Vol is by a volatility model, like GARCH. Unfortunately, I\’m not too sure about the math behind that
Having said, you can still use the method you have mentioned for a quick and dirty calculation.
Hello karthik sir,
I had calculated volatility for many times but a question is raising in my mind that if daily volatility information already available on nse website then why we have to calculate this everytime ( pls… don\’t assume me lazy) infect i like to do calculation every time as it improves me
By the way can we also use NSE\’s data to set up a trade…..offcourse what you will order me to do i will do the same your advice matter me because i tried a lot lot lot to understand option before ariving at varsity at the end varsity gave me the brake..
& you and your guys the reason behind thanks a lot….
Ankit, thanks for all the kind words about Zerodha Varsity 🙂
If the data is readily available on NSE the go ahead and use it. You can utilize the time saved for doing something more productive.
Sir how to practically use volatility?
Have explained this across all the chapters. Check this in particular – https://zerodha.com/varsity/chapter/volatility-applications/
Karthik,
In some US market intermediaries provide that data with their software but in India we don\’t have it. I know it\’s a management decision but if you guys come up with this feature it will be really awesome for option traders ?. Just a thought
Thanks.
We are trying to put up something around this, may take some time 🙂
Hello Karthik,
How is it possible to have historical IV for stocks (in a index form)…thanks in advance
Rajib.
Not sure if there is any source for this. I agree, it would be nice to have this data.
Sir
How to get historical data for currency too
Tried to get but failed….
Explore RBI website, you may get it.
Sir if this simple calculation for volatility works better than what is the need of that fancy IV numbers published in NSE option chain
IVs are extract using Garch models. It is quite complicated.
Sir,
Shouldn\’t we be dividing by no of trading days instead of constant 365???
For markets it is usually the total number of trading days which excludes weekends and public holidays. This comes to about 252 days.
Is there any place (on NSE or elsewhere) where we can get historical IV (min & max) to check whether the current option is trading at above or below the mean of IV?
Dont think anyone publishes this info.
Hi Karthik,
I think this might be an out of the topic question, but wanted to understand what all technical/fundamentals we need to check in a company\’s stock if we are planning to pick that up for Options trading ?
Also, how do we pick up a particular stock for intraday options trading ? Your insights on this please.
Thanks
Tirth
Tirth, frankly you can ignore the fundamentals when you are doing a short term trade. However, remember, whenever there is any strong fundamental news around a stock be doubly sure about the trade.
From a TA perspective, it really depends on what you are following. I personally prefer MA and candle patterns.
Hi Karthik,
I computed the volatility for Wipro and SBI as on 21st March, 2017 with the NSE data as explained in the lesson. For Wipro, the results were matching with NSE data (1.19 % vs 1.16 %). But for SBI, the calculated volatility was double (1.94 %) vs the quoted (1.10%). For Cipla, the calculated daily volatility was 1.45 % whereas the quoted value was 0.98 %. What can be the reason for this difference? I enjoy your lectures. Thank you!
Ratinam, I\’ve noticed the difference as well. One possible reason could be the day count convention…i.e the number of days in a year you maybe considering 365 while NSE maybe taking 250 or 252 days.
Karthik, I am afraid the values are daily volatility. Days count are not yet in the picture.
Got it. Where did you source your data from? Did you download the data from NSE itself?
Yes, Karthik. From NSE. I downloaded the csv file for the past 1 year.
Not sure Rathinam, I need to check this. Will get back to you on this. Thanks.
Sir can i know the intuition behind converting daily volatility to annual volatility?
I.e why are we doing SQRT 365 days ? Can\’t we simply do the power to 365 days?
Looking forward for ur reply
No, there is a mathematical reason for using the Sqrt. I\’ll try and post a link which explains this.
Ok sir! Looking forward!
Cheers!
is there any source from where we can get the implied volatility of all F&O stocks of Nifty together and where they are also arranged as per their rank? eg- from 1st rank (highest IV) to last rank (lowest IV)?
No, not that I know off 🙂
Are you planning to launch this in zerodha trading platforms? I feel this should be present in all trading platforms.
We are working on this, will make some interesting announcements around this soon.
Hi karthik,
I have bought a 1040 CE option @9.25 6 days before the Infosys Q3 results for FY16-17 year and the spot was trading at 965 on the day of option purchase.In the run up to the results day,the spot slowly moved to 1000(the day before the Q3 results) and premium went to 16.25(because of the delta?).However on the results day the stock gapped up @ 1030 went to a high of 1040 and finally closed @975 and the premium came down to 5.So i have few queries over this trade.
1.Is it because of so much of volatility on the results day that the premiun came down by 11 points?
2.Even though the volatility cooled off and spot came to 975 ,the premium was trading @ 5 much lesser than the price(9) when spot was trading @ 965.Why is it so?
3.Also what could have been done better in this trade.I later came to know naked trades are dangerous.I made this trade to just guage my understanding of options.
Thanks in advance for you help
Sudheer
1) Yes, volatility is one of the prime driver of option premium….especially on results day.
2) Again, it is because of volatility. In fact, when you bought the option, the premiums were probably inflated (again thanks to volatility)
3) Check the case study here, you will appreciate it as its executed on Infy (aroud results time) – http://zerodha.com/varsity/chapter/case-studies-wrapping-it-all-up/ , section 23.5.
Can we use this daily volitality formula in intraday trading/BTST to determine what price level it can go next day considering the present days trend
Yes, I do know people who use intraday volatility to set up trades. But really not sure about the success rate here.
But sometimes the daily gain is negative. Then how to calculate? Is the data readily available on any site?
Nope, not that I know off. Also, -ve gains does not matter.
Hi karthik,
Can you tell me how to calculate the range of the historical volatility in last one year for index/stock? Actually I need the HV range over last one year period.
You need to calculate the daily volatility and then identify the max and min volatility to get a range. You should be able to do this on excel.
Does the volatility take into consideration the trading holidays for annualized volatility or is it calculated on the full year i.e 365 days
I guess NSE takes into account 365 days, so I guess its ok to stick to this particular time count convention.
Hi Karthik,
I am not understing the fact that how will i determine where a particular option Strike is costly or cheap.
From the historical volatility i can derive the 1 SD which will provide me the range in which the underlying is likely to remain with a probability of 68%.
But as the implied volatility changes everyday, how can i deduce whether the option is costly or cheap ?
Also, what is concept of IV rank ?
The valuation of the option is really based on the premiums which in turn is dependent on things like Volatility. So one really needs to compare today\’s volatility with the historical volatility to identify the expensiveness of options. Sometimes even due to market inefficiencies the prices can vary drastically from the fair price, making the options cheap or expensive.
Is it not appropriate to calculate log of net-working days than calendar days? supposing in a year there could be only 260 to 240 trading sessions when the price of share can move up or down.
Both these conventions are practiced, some people prefer 252 days while others prefer 365.
Hi Karthik,
I have a query regarding returns calc. What is the difference b/w returns calculated using Log function and Normal formula (End price/ Beg price – 1) ?
Log function brings all the numbers to a single plane (natural log), therefore gives a real sense of how the returns pan out.
Sir small correction:
\”Square and add up all deviations – this is called variance\”- should changed to \”Square and add up all deviations and divide the sum by no of observations – this is called variance\”
Hey, thanks for pointing this.
Thanks for explaining the concept with simple steps and in a easy language!
Welcome!
Thanks a lot for the prompt reply and inspirational interview of Joby. I have a few more lessons to go before I start trading. But trading
definitely I will do.
Good luck Sir.
My age is 70 years. I have basically no knowledge of Excel. I am able to follow you till Step 2. In Step 3 in point 4 you said–After the open bracket select all the daily return data points and close the bracket. In the bracket you have put C3:C245. Where do you get C245 from?
I want to get a firm grip of Options before I venture into trading.
Sir, knowing excel is not a must for successful options trading. In fact, there are people without basic education qualification who are otherwise very successful in trading, check this interview – http://zerodha.com/z-connect/zerodha-60-day-challenge/winners/10th-std-pass-market-wizard-from-thrissur
By the way, C245 refers to the cell which contains the last value in the list.
Hi,
noted the online calculator provided, the data is coming far different. though it\’s helpful
can you help to provide anything in excel worksheet which can backtest our results and payoff graphs on daily basis for working.
Check this – http://avasaram.com/
HI,
have checked this site, but there\’s no data they have provided for indian stock exchange triall all optiosn and strategies finder or charting screener,
it;s just nothing coming over there for indian stock market. seems only related to USA markets.
Please help!!
I understand, but thats the best option I know off. Will keep you posted as and when I find something reliable.
HI,
can you advice historical volatility for check options greeks, or you can provide any options greeks calculator for india stock market.
NIFTY or other options contracts.
Have a look at this – https://zerodha.com/tools/black-scholes
The difference between your calculation and NSE could be because NSE seems to be a Weighted one.
It uses 0.94 for the \”Volatility till yesterday\” and gives 0.06 for \”Today\’s Volatility\”.
If you download the Daily Volatility, this formula is mentioned in the column header..as given below
Date, Symbol Underlying Close Price (A), Underlying Previous Day Close Price (B), Underlying Log Returns (C) = LN(A/B), Previous Day Underlying Volatility (D), Current Day Underlying Daily Volatility (E) = Sqrt(0.94*D*D + 0.06*C*C), Underlying Annualised Volatility (F) = E*Sqrt(365)
Hey, thanks so much for clarifying this. Will download the data and have a look.
Hi Karthik,
Thanks for the learning. I am a bit confused.
From the above can we say that SD and volatility are the same ?
Yes, Standard deviation is a measure of volatility aka Risk.
Hello Sir,
What\’s the formula for calculating the implied volatility of particular asset say nifty on a live basis. In the Nse site when they use to give the implied volatility. I have just wondered how they arrive at the calculation. Just eager to know.
Regards,
Sonjoe Joseph
Calculating the implied volatility is a fairly complex task. I\’d suggest you take ViX values as an alternate to Nifty\’s implied volatility.
Thank you sir
Excellent Sir,
Sir , how we get a daily and annul Volatility details from NSE, and Sir can i use daily volatility data for intraday trading using uptrend SD and Downtrend Sd and Variance.
Thanks
Check this – https://www1.nseindia.com/live_market/dynaContent/live_watch/get_quote/GetQuoteFO.jsp?underlying=INFY&instrument=FUTSTK&expiry=31MAR2016&type=-&strike=-
Make sure you click on \’other information\’ to see the volatility details.
Yes, you can use the SD values for intraday.
Sir,
Where can we get scriptwise Implied Volatility data ?
Check the option chain on NSE, they usually publish it.
Can we get \’daily average return\’ data from the nse (or any other) website like the daily volatility and the annual volatility.
Nope, no where that I know of.
How many types of volatility are there? what is implied volatility, India vix, volatilty index
Varun – all these are explained in the chapters related to Volatility.
can you please share the path to check volatility published by nse site
Here you go –
http://www.nseindia.com/live_market/dynaContent/live_watch/get_quote/GetQuoteFO.jsp?underlying=INFY&instrument=FUTSTK&type=-&strike=-&expiry=25FEB2016
click on \’Other Information\’ right hand side, bottom.
when I am calculating return by formula LN(today\’s closing price/yesterdays closing price) it is coming in .00077 format and not in percentage % format.
what to do to get these values in % format?
Just click on the cell, and format it to %. Alternatively multiply the value by 100.
Hi Karthik,
In 20.2 VOLATILITY CONE, can you please explain how was the annualized realized volatility calculated. You have explained how to calculate Volatility using historical data ( I believe the volatility calculated above in the earlier chapters was Historical volatility).
How did you calculated the realized volatility shown in the table Expiry date against annualized realized volatility.
Is there any other data to be used to calculate realized volatility?
Regards,
Dev
Devandra, I\’ve been wanting to put up the excel for a long time. This piece has been authored by someone else and I\’ve been waiting for the excel so that I could upload the same.
Thanks,
I searched on the internet for calculating realized volatility but couldn\’t find an easy way to get through…I could only find methods to calculate Historical Volatility, but not as easy and comprehensive as explained in your module. really appreciate your efforts…
Is it possible for you to email me websites or source where I can find one.
Regards,
Dev
Realized volatility for today, is historical volatility for t\’row 🙂
HI,
Thanks…Just finished reading module for Options…worth reading and so much to take in and analyze. Thanks again for the simplified explanation.
When can we have the excel sheet on realized Volatility calculation(the one you have been waiting for authorization)..please get it ASAP.
Regards,
Dev
Thanks Dev, I\’ve been chasing the guy as well, but cant really push him much as he is getting married next week 🙂
I have tried a lot but i could not get the calculation right for the volatility cone in the chapter 20 module 5-2. we chatted earlier aswell. i checked the website and found that you have uploaded the volatility cone excel sheet in april 2016, but couldn\’t find the source. can you help me with the link. i have been persistently trying to match the calculation with the no\’s in the chapter but i am not able to get it right. Can you please help me with the link.
Regards,
Dev
You can download the excel and check out the calculation, this is there are the end of the chapter.
Hi Karthik.
Thanks a ton…at last i did find it…went through the calculations…now i got to dig the gem…lol
thanks again.
Regards,
Dev
Good luck, Dev 🙂
Thanks.
Welcome!
How much sample data required for calculation Standard deviation and average?
6 months to 1 year should be good.
How can i get the currency data the way you got it for WIPRO?
Check this – http://www.nseindia.com/products/content/equities/equities/eq_security.htm
I have checked with the Simple returns formula as well for Axis Bank,
I am getting a Daily Volatility of around 2.14% and Annualized Volatility of Around 40% which is far more than mentioned on NSe Website. i.e. 28%
Can you Calculate once for a better understanding .
Date = Axis Bank for past 365 days
Will run through the calculations and figure out whats happening Vikas.
Hi Karthik First of all i will like to thank you for explaining beautifully all the concepts be it technical, fundamental or Volatility Related.
i have been reading all the concepts from past 1 month and now i will like to work on Delta for Volatility based trading.
although i am very thorough with the practicals but i wanted my theory to be clear as well.
i have a small doubt related to calculation of Daily And Annual Volatility. the Example which you have shown in – Wipro Date ranging from 22nd July 2014 – 21st July 2015.
Now when i repeat it on Wipro It gives the exact same answer.
but when i tried it on all other current stocks like axis bank and be it nifty and compare it with Nse website there is a vast difference. can you help me with it.
i am attaching the snapshots below.
please help me
why is there a huge difference between my calculation based on the same formulas which you have provided in this module and the one provided on the nse website.
please reply asap
PS – The The Range of Data of Axis Bank is exactly last 365 days.
Sure, as I mentioned please try with futures data once.
Vikas – I suppose you are using the spot data, can you try this with futures data?
I tried it with futures data as well but the difference is huge. Have Nse changed their calculation methods or am I making a silly mistake. I don\’t know but I proof checked it several times. It\’s the same 40 % for axis bank where as Nse website states it around 20%
Please throw some light on the issue Sir
Sorry typo error in the above comment
Nse website states 28%
Are you using simple return or log returns to calculate the daily returns?
Sir I am using log returns formula which you have mentioned above in the module
Sure. Can you please check with simple returns once? Simple returns is calculated by dividing today\’s close over yesterday minus one.
sir,
i calculated nifty daily volatility as per my calculation daily volatility is 0.76% and in nse website is 0.81% i think calculation is fine right? and i have i a doubt as per your excel sheet i download nifty 30 days data and calculate and i got above volatility (.76) and also get 14.60% anual volatility , and i edit equation to F5*SQRT(30)for getting one month volitily and i got 4.19% am i right? please guid me !!
Perfect Sarath. Your calculations seems to be right.
sir as per daily volatility .76% ,if nifty yesterday close is 7800 so we can expect nifty will go 7740-7859 range(7800-(7800*.76/100 to 7800+(7800*.76/100) today is it right?
Sarath – suggest you look at the calculations here – http://zerodha.com/varsity/chapter/volatility-applications/
Section 18.1
Karthik, help me to understand how do decide entry and exit points delivery with target of 2-5%.
Have you given this a shot – http://zerodha.com/varsity/chapter/support-resistance/ ?
Ahesan4004
http://www.nseindia.com/live_market/dynaContent/live_watch/get_quote/GetQuoteFO.jsp?underlying=WIPRO&instrument=FUTSTK&type=-&strike=-&expiry=26NOV2015
CAN SOMEONE PLEASE SHARE DIRECT LINK OF NSE SITE PAGE WHERE ANNUAL & DAILY VOLATILITY OF EQUITIES AND CURRENCY BE FOUND ?
i have spent 3 days on NSE website …… didn\’t found the page from where this screenshot is taken .
Ahesan4004
here is link
http://www.nseindia.com/live_market/dynaContent/live_watch/get_quote/GetQuoteFO.jsp?underlying=WIPRO&instrument=FUTSTK&type=-&strike=-&expiry=26NOV2015
By the way wat r u doing for 3 days on nse website 😉 🙂
for some foolish reason , kept on visiting historical data section and downloaded csv of almost everything .
i will bookmark this link now .
this is the first time i have trouble navigating websites .
Good luck, stay profitable!
THANKS A TON sir ….i hope i am not causing you too much trouble ……. i really appreciate your great work ….. hope someday we can meet , so that i can thank you personally 🙂
This is not trouble 🙂
Hope to meet you as well !
its okay yaar
just kidding….. Hota hai starting me aisa hota hai….NO problem
Stay hungry , Stay foolish.. (To learn new things in life)
🙂
Check this – http://tradingqna.com/25033/volatility-volatility-indices-currency-derivatives-website
Sir, Iam getting max historical data in NSE for 2 yrs. Where to look for more than 2yrs .
Regards
Change the years…date it back to older years and you should be able to get it. You can also try contacting them – http://www.nseindia.com/global/content/contact_us/contact_us.htm
Why annualised volatility of NIFTY changes everyday ? According to the excel provided by you it remains almost constant. On 18/11/2015 annualised volatility of nifty was 15.49% and on 19/11/2015 it is 16.49%. According to the excel provided by you guys it comes to around 20%. Same is the case with bank nifty and other instruments.
Thank you.
T Barua
Volatility is a function of price. If the price moves drastically then volatility also changes. This must have been the case here.
Sir, The values shown for Daily and Annual volatility in NSE site are with 1 yr data or some other. kindly clarify. Thanks
Yes, it is for 1 year.
Hi Karthik Sir,
I am trying to load data of Nifty for volatility calculation. but It says no record found…..Why so?? Data for other stocks are being loaded by not for Nifty. please help me…
You can download data only in 1 year slots, try this link – http://www.nseindia.com/products/content/equities/indices/historical_index_data.htm
Its working Sir….!!! Thanks…!!
Welcome!
Sir, What is ATR and how to look
Regards
ATR is Average true range…its an indicator. Its a method identify the volatility of a stock or index. Standard technical analysis software packages have ATR indicators.
sir , can you give direct link where this daily and yearly volatility is shown ? also can you show the same data for currency ?
i tried to find on NSE but was not able to get it .
thank you
Unfortunately, this is the only spot (as far as I know) on NSE where this information is present. I\’m not sure about commodities. Sorry about that.
1) instead of calculatin volatility on our own using excel …. can we simply reply & use the NSE READINGS ?
2) CAN SIMILAR VOLATILITY calculations be done for currency & commodity as well ?
3) for commodity we do not have options availability ….. can volatility be of any use for simple futures trading ? if yes,how ?
1) You can. Worst case you can even look at ATR (for intraday)
2) Yes
3) You can use it to place stop loss. Check the chapter on volatility applications.
We can use VIX,right.
Does Gamma really helpful in trading.
It does, especially when your trading book is large!
You have already solved the nifty range from upper to lower. I am interested to down load the data and work to solve it. So kindly let me know the dates from which date to what date the data has been used. I Shall be grateful to you for your this act of kindness.
Sir please refer to the excel …it has the dates as well.
I down loaded wipro from 22/07/14 to 21/07/15 and found out the daily return for each column and then added. The total was 0.01745. Now how to find the av. daily return. Is it to divide the total with 242. or some other method is to be used .
You have solved nifty for 1 year or so on. I want to solve it of my own. CMP shown is 8337. May i know the data from which dates is employed.I shall download it my self and calculate like you.
Please do not mind the trouble i am putting you in.This will improve my solving capacity.
Please select all the values in the daily return column and use the =AVERAGE function in excel. Also, just follow the instruction the excel, it should help you through.
Great. i was able to calculate STDEV or daily volatility and then annual volatility by your method.Here i multiplied the daily volatilty with 365 when the data was for 248 days.
Sure. Do remember to scale daily vol to annual vol you need to multiply it by square root of time.
I downloaded the price of asianpaints for a year from 17/10/14 to 16/10 /15. Total days involved were only 248 and not 365.May be because of holidays. Now to find out the mean are we going to divide the total value by 248 or 365? I found for finding annual deviation we are multiplying daily returns with 365. And for finding daily returns we divide annual deviation by 365. I do not understand the principle. Please elaborate the fact.
thanks
Yes, although there are only 252 trading days we end up taking 365 days. This is because of something called as the \’Day count convention\’. NSE uses a particular day count convention called Actual by Actual, which requires them to take 365 days in the denominator, hence we use the same.
Can we get data on metals,crudeoil like wipro.If yes what is the source. Can you explain this data so that we can trade in metals and crude oil.
i like to trade in MCX.
regards
You can, just check with http://neotradeanalytics.com/
Thank you so much for the lesson.Really very simple to learn.Keep up the good work.
Thank you 🙂
this calculation possible in amibroker
Not sure, I would suggest you to check with http://www.neotradeanalytics.com/ for this.
Hi,
I have one doubt.
How do we find all the above mentioned calculations for a Stock which has been Split/Bonus within past year?
is there any suitable change for the excel sheet calculations ?
For Example : Infy has been changed from 4000 to 2000 to 1000 in just 1 last year
Yes, for this the data has to be clean and adjusted for splits and bonus. Usually data vendors such as http://www.neotradeanalytics.com/ do this for you.
The neotradeanalytics site seems to be shutdown. Can you explain what do you mean by cleaned and adjusted ? Can we ourselves not do it ? Please explain with an example.
Yup, unfortunately they shut shop. Check https://www.truedata.in/ instead.
Clean and adjusted usually refers to cleaning up the data for corporate actions such as – splits, bonus, special dividends etc. Doing it yourself can be quite challenging considering these things happen everyday…for some stock or the other.
karthik, i just calculated the daily volatility of glenmark. i found that there is a difference of 1 % between my calculation and that published on NSE…could this be because i extracted data for the last 6 months(closing price) and the NSE probably does it on a 1 year data? i used the =STDEV() for the same. thanks.
Yes, that does make a difference.
How often do you calculate and update daily returns for use in trading? As these values are used for calculations in chapter after this, do we need to calculate it with new data every day
If you are writing options once a month it makes sense to do the calculation once that month.
How can i get the NIFTY data the way you got it for WIPRO, am typing NIFTY, but no records are shown!!
Try this link – http://www.nseindia.com/products/content/equities/indices/historical_index_data.htm
thanks karthik, how do i drop and drag the formula? i am not proficient with the usage of excel.
You can check the excel tutorials here – http://chandoo.org/wp/2009/08/17/rows-and-columns-excel-formulas/
Karthik, while calculating daily return for hindustan petroleum using =LN() , the same is displayed as 0.061547 and, not in percentage points. how do i convert the same into %age? secondly, do we have to individually calculate for all the dates i.e the whole year one at a time using the above formula? or is there a formula to do the same in one go for all 365 days? calculating daily returns for all the
respective 365 days individually seems to be a humongous task. do clarify. thanks.
Raj – keep the cursor on the cell which contains \’0.061547\’ and then select the \’%\’ symbol that you can see in the Excel window. This button is placed right below the word \’General\’ which is somewhere in the top middle. Once you do this the figure should change to 6.1547%. Also you need not have to do this individually for all 365 day, just drag and drop the formula and it will automatically get calculated for all days.
Hi Karthik,
One question regarding daily return calculation.
By using ((570.9-558.75)/570.9)*100 this formula daily return is :2.12%. But we are getting 2.15% using log base e.please tell me, Why you use log base e over linear return or even log base 10.
Thanks in advance.
Check this – http://tradingqna.com/3574/why-stock-returns-are-calculated-in-log-scale?show=3574#q3574
Hello Mr Karthik,
Eagerly waiting for next chapters….kindly update the same…
In a day or 2 🙂
Thanks for update…
I know that you would update chapters in strategies in coming days but I want to know are there any strategies for intraday option trading? and what are those?
Abhijit – this is a hard query for me :). At the moment I wont be able to comment on this, so please do bear with me.
Today nifty index suddenly showed a huge spike at 11Hrs which may be due to the no change in rate cut/behaved due to some other issues. How the programmed index which is running through the market partcipants immediately behaving according to the current scenarios? Is there any manual feed/input to the programmed exchange? If yes, then insiders are the players whose odds are high compare to the normal traders.. can you clarify.
No Vasanth – nothing like that happens. Index is like a car which can go at a speed dependent of the accelerating capacity of the driver….similarly the index derives its values which is dependent on the underlying stocks. No one can manipulate this. Suggest you read this chapter – http://zerodha.com/varsity/chapter/the-stock-markets-index/
also wanted to ask, if annual volatility can be calculated with the help of a formula from a daily volatility by taking 365 days. how to calculate monthly volatility? by taking no. of days in a month i.e 30 or 31? or 20/22 i.e. actual no. of trading sessions?
Since we are taking the full calender of 365 days, it makes sense to take the actual number of days in the month i.e 30 or 31.
Since we are taking the full calendar days i.e 365, it makes sense to take the actual number of days in the month i.e 30 or 31.
karthik,
how the volatility effect the option premium like delta ,theta .
We are getting there sarath 🙂 The idea is to understand volatility completely before understanding its effect on Options premium.
1. How to determine whether volatility is high or low for a particular stock option? For certain stocks the number can be interpreted as high whereas the same number can represent low for others. So what is the indicator based on which we can say it\’s high or low for a particular stock? Is it by comparing the annualised historical volatility number with current IV number?
2. What is the expected time for an option volatility to raise before an event ? is it one day or five days or more than that?
Krish – super valid questions.
1) Yup – you are right here. To evaluate if today\’s volatility is high or not wrt to historical vol…one of the methods is to compare today\’s implied vol with historical vol. More on this topic in the coming chapters.
2) Cant put a number for this – but usually about 1 trading week before the event vol starts to increase. Disclaimer – This is purely from my personal observation, could be wrong here.
Hi Karthik
Using the daily/annual volatility, can we also calculate the range of the stock/index for the next day?
Shankar
Yes, we can do that…in fact chapter 17 (will be uploaded next week) will discuss this.
Is there any resource readily available to project the Greeks value during market hours depending upon the movement? Calculating Greeks during market hours is difficult in intraday trading…
Not that i know of…but my experience tells me that over a period of time you will develop a sense for this and kind of start approximating the values in your mind 🙂
hi kartik,
i have a doubt what is liquidity?
Liquidity is the ease at which you can buy or sell shares from the market – you can read more about it here – http://zerodha.com/varsity/chapter/nifty-futures/ (refer section 9.2).
sir,ofcourse its good but it will be applicable in reality,ithink the simpler ur the better,correct me if iam wrong
Simplicity is relative 🙂
I know there is chapter coming on option strategies, but what I read so far had following thought, can you verify if it make sense?
Using the daily volatility we can predict how much can given stock move in next few days, so using this info couple of days before expiry can give us high probability trades for example, Syndicate Bank has volatility of 2.5% with CMP of 99.7, if it continues downward move its closing price on Thursday (expiry) should be minimum 92.xx, which means PUT option of SP 90 will be OTM and end up expiring worthless that means if we short it today at CMP of .40, we have high chances of earning .40 * 2000 800 RS in 4 days. I was tempted to say we have sure shot chance , but then nothing is sure in Market 🙂
Makes sense?
That part \”nothing is sure in markets\” certainly makes sense 🙂
Btw, yes you are more or less heading the right way, its just that we need to be aware of certain probabilities when it comes to such trades. I\’m writing about this in the upcoming chapter. Please stay tuned.
(y) yep, eagerly waiting for next chapters
The next chapter is taking a bit longer…but I\’m hoping it will be worth the wait 🙂
🙂 no worries, going thru TA section till then.
Awesome!
What will be the monetary consequences, if i leave this to settle by exchange in respect of brokerage+taxes+Short term capital gain? ( talking about the example given by WANNBETRADER)
It is always advisable to close ITM options before expiry to avoid the STT trap. We have a nice article explaining this, check this – http://zerodha.com/z-connect/queries/stock-and-fo-queries/stt-options-nse-bse-mcx-sx
and marked proved again that nothing is sure in market :)… it fell more than 9% today so the OTM put is not ITM with value from .40 to 1.40 :)…
🙂
Hi Nitinji,
I have a query….right now the market is trading sideways,1 day it increases & few days it decreases….so my query is what option strategies should i employ for trading nifty options in such a volatile market…its very difficult to make money in such a market.
Any strategy that involves a credit and benefiting from time decay would be a good I suppose. Example – short strangle, straddle etc.
Infact as i was thinking about it, i have this question for futures too, derivatives as per definition move as per the movement of the underlying, but the derivative itself is also being traded, so what determines the price of the derivative, the derivatives supply demand dynamics or the movement of the derivatives underlying or both? e.g. nifty futures is a heavily traded derivative but is the spot market single handedly determining its price ?
A derivative derives its value from its respective underlying. Its unusual for the derivative to influence the price of the spot.
Hi Karthik,
I would like to congratulate you on your stellar effort in making such a complicated topic so easy to digest. If i ever succeed in trading it will only be because of you, varsity and zerodha, i say it from my heart.
I am absolutely new to trading, i am having a confusion regarding options. What i understand is the option greeks are responsible for the change in the option prices, but there is also a separate demand-supply of each option which is created by the writers and the buyers of that particular option, so what moves the option premiums the demand supply interaction like in spot market/futures or the greeks alone(the individual options demad suppy has no role to play in setting the price) or both
A 2nd question, from the current nifty option chain i see that the 8400 slightly OTM puts price have appreciated but the slightly ITM 8400 calls have fallen, does it mean the market is getting more comfortable with the idea of nifty falling below 8400 in the next 3 days, is that a case for buying slightly OTM puts, i dont have the confidence/conviction to trade, i am trying to confirm my understanding by thinking in terms of a trade. Cannot thank you enough for what you have done for me.
Happy to read this Rajdeep…btw, if you succeed in trading (I hope you do), then its because of your heard work and nothing else. Coming to your query –
Option premium are a function of many factors, the essence of which are captured by the Greeks. For example the demand supply situation causes directional movement and thats captured by Delta. Effect of time is captured by Theta, volatility by vega etc. So Greeks capture all the necessary price variable
Regarding the 2nd question – Puts have appreciated due to two factors – Markets and fallen and volatility also has increased. You will understand and appreciate the effects of volatility over the next few chapter. Please stay tuned.
Fabulous :-)… Wish I was so eager to learn during my school days ,lol.
I wish so myself, I was never a good student 🙂
Hi karthik, appreciate the excel calculations. makes it very simple for all of us. as far as options concerned , for e.g a put . the stock could fall to a particular price at various times and the option premium could be different at those times. i bought a put of lupin, and at one time the stock was at 1700 and the put was trading at 5. the stock went up to 1710 and when it re tested 1700 again the put was trading at 3 this time. is there a way to determine at what premium the option could trade at same stock price points at different times of the day. will you be touching upon this? thanks a ton.
Raj, what you have quoted is a very practical situation. The main reason for this would be changes in volatility. As this mini series on Volatility evolves, I\’m sure you will get the answers yourself. Please stay tuned till then 🙂
Thanks for such a in depth practical calculation. However, can we calculate intra-day volatility ?
You can, this requires few higher order quantitative techniques.
Hello Karthik Sir,
Can you please tell me about those high quantitave techniques or provide me a link for the same if possible.
Thanks
Rahul
Rahul, quants is a very broad topic, Rahul. We are discussing few techniques here – https://zerodha.com/varsity/module/trading-systems/