
22.1 – Why now?
I suppose this chapter’s title may confuse you. After rigorously going through the options concept over the last 21 chapters, why are we now going back to “Call & Put Options” again? In fact we started the module by discussing the Call & Put options, so why all over again?
Well, this is because I personally believe that there are two learning levels in options – before discovering option Greeks and after discovering the option Greeks. Now that we have spent time learning Option Greeks, perhaps it is time to take a fresh look at the basics of the call and put options, keeping the option Greeks in perspective.
Let’s have a quick high-level recap –
- You buy a Call option when you expect the underlying price to increase (you are out rightly bullish)
- You sell a Call option when you expect the underlying price not to increase (you expect the market to either stay flat or go down but certainly not up)
- You buy a Put option when you expect the underlying price to decrease (you are out rightly bearish)
- You sell a Put option when you expect the underlying price not to decrease (you expect the market to stay flat or go up but certainly not down)
Of course the initial few chapters gave us an understanding on the call and put option basics, but the agenda now is to understand the basics of call and put options keeping both volatility and time in perspective. So let’s get started.
22.2 – Effect of Volatility
We know that one needs to buy a Call Option when he/she expects the underlying asset to move higher. Fair enough, for a moment let us assume that Nifty is expected to go up by a certain percent, given this would you buy a Call option if –
- The volatility is expected to go down while Nifty is expected to go up?
- What would you do if the time to expiry is just 2 days away?
- What would you do if the time to expiry is more than 15 days away?
- Which strike would you choose to trade in the above two cases – OTM, ATM, or ITM and why would you choose the same?
These questions clearly demonstrate the fact that buying a call option (or put option) is not really a straightforward task. There is a certain degree of ground work required before you buy an option. The ground work mainly revolves around assessment of volatility, time to expiry, and of course the directional movement of the market itself.
I will not talk about the assessment of market direction here; this is something you will have to figure out yourself based on theories such as technical analysis, quantitative analysis, or any other technique that you deem suitable.
For instance you could use technical analysis to identify that Nifty is likely to move up by 2-3% over the next few days. Having established this, what would you do? Would you buy an ATM option or ITM option? Given the fact that Nifty will move up by 2-3% over the next 2 days, which strike gives you maximum bang for the buck? This is the angle I would like to discuss in this chapter.
Let’s start by looking at the following graph, if you recollect we discussed this in the chapter on Vega –
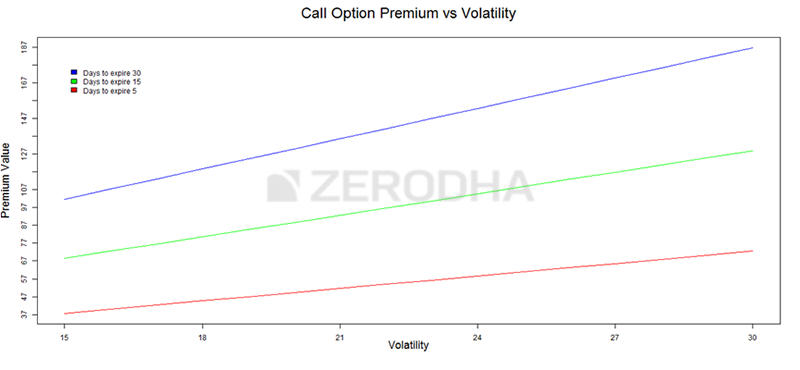
The graph above depicts how a call option premium behaves with respect to increase in volatility across different ‘time to expiry’ time frames. For example the blue line shows how the call option premium behaves when there are 30 days to expiry, green for 15 days to expiry, and red for 5 days to expiry.
With help of the graph above, we can arrive at a few practical conclusions which we can incorporate while buying/selling call options
- Regardless of time to expiry, the premium always increases with increase in volatility and the premium decreases with decrease in volatility
- For volatility to work in favor of a long call option one should time buying a call option when volatility is expected to increase and avoid buying call option when volatility is expected to decrease
- For volatility to work in favor of a short call option, one should time selling a call option when volatility is expected to fall and avoid selling a call option when the volatility is expected to increase
Here is the graph of the put option premium versus volatility –
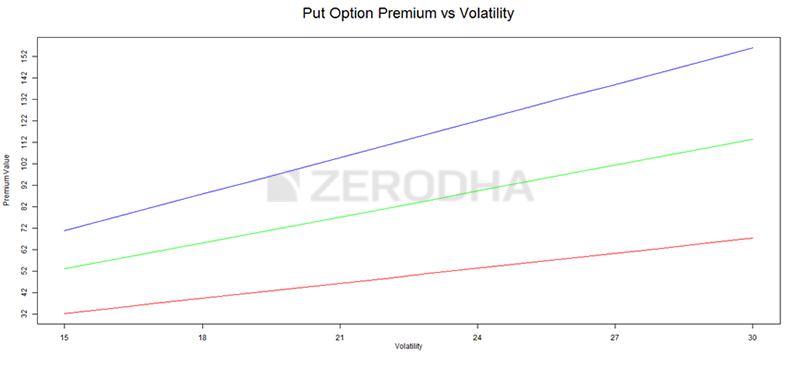
This graph is very similar to the graph of call premium versus volatility – therefore the same set of conclusions hold true for put options as well.
These conclusions make one thing clear – buy options when you expect volatility to increase and short options when you expect the volatility to decrease. Now the next obvious question is – which strike to choose when you decide to buy or sell options? This is where the assessment of time to expiry comes into play.
22.3 – Effect of Time
Let us just assume that the volatility is expected to increase along with increase in the underlying prices. Clearly buying a call option makes sense. However the more important aspect is to identify the right strike to buy. Infact when you wish to buy an option it is important to analyze how far away we are with respect to market expiry. Selection of strike depends on the time to expiry.
Do note – understanding the chart below may seem a bit confusing in the beginning, but it is not. So don’t get disheartened if you don’t get it the first time you read, just give it another shot
Before we proceed we need to get a grip on the timelines first. A typical F&O series has about 30 days before expiry (barring February series). To help you understand better, I have divided the series into 2 halves – the first half refers to the first 15 days of the series and the 2nd half refers to the last 15 days of the F&O series. Please do keep this in perspective while reading through below.
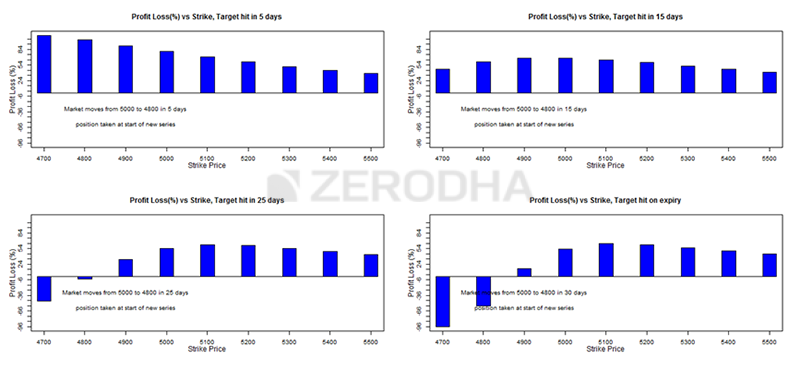
Have a look at the image below; it contains 4 bar charts representing the profitability of different strikes. The chart assumes –
- The stock is at 5000 in the spot market, hence strike 5000 is ATM
- The trade is executed at some point in the 1st half of the series i.e between the start of the F&O series and 15th of the month
- We expect the stock to move 4% i.e from 5000 to 5200
Given the above, the chart tries to investigate which strike would be the most profitable given the target of 4% is achieved within –
- 5 days of trade initiation
- 15 days of trade initiation
- 25 days of trade initiation
- On expiry day
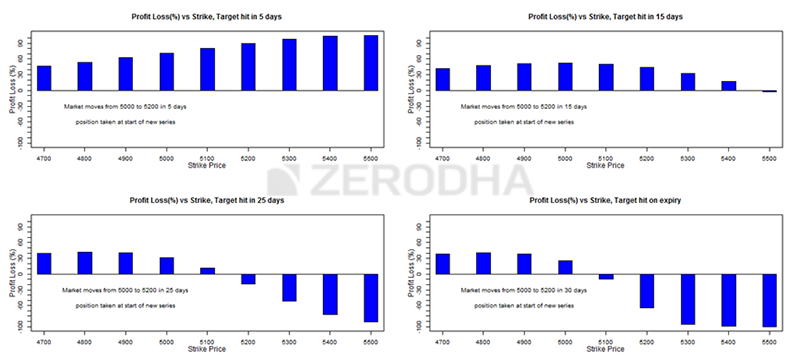
So let us start from the first chart on the left top. This chart shows the profitability of different call option strikes given that the trade is executed in the first half of the F&O series. The target is expected to be achieved within 5 days of trade execution.
Here is a classic example – today is 7th Oct, Infosys results are on 12th Oct, and you are bullish on the results. You want to buy a call option with an intention of squaring it off 5 days from now, which strike would you choose?
From the chart it is clear – when there is ample time to expiry (remember we are at some point in the 1st half of the series), and the stock moves in the expected direction, then all strikes tend to make money. However, the strikes that make maximum money are (far) OTM options. As we can notice from the chart, maximum money is made by 5400 and 5500 strike.
Conclusion – When we are in the 1st half of the expiry series, and you expect the target to be achieved quickly (say over few days) buy OTM options. In fact I would suggest you buy 2 or 3 strikes away from ATM and not beyond that.
Look at the 2nd chart (top right) – here the assumption is that the trade is executed in the 1st half the series, the stock is expected to move by 4%, but the target is expected to be achieved in 15 days. Except for the time frame (target to be achieved) everything else remains the same. Notice how the profitability changes, clearly buying far OTM option does not makes sense. In fact you may even lose money when you buy these OTM options (look at the profitability of 5500 strike).
Conclusion – When we in the 1st half of the expiry series, and you expect the target to be achieved over 15 days, it makes sense to buy ATM or slightly OTM options. I would not recommend buying options that are more than 1 strike away from ATM. One should certainly avoid buying far OTM options.
In the 3rd chart (bottom left) the trade is executed in the 1st half the series and target expectation (4% move) remains the same but the target time frame is different. Here the target is expected to be achieved 25 days from the time of trade execution. Clearly as we can see OTM options are not worth buying. In most of the cases one ends up losing money with OTM options. Instead what makes sense is buying ITM options.
Also, at this stage I have to mention this – people end up buying OTM options simply because the premiums are lower. Do not fall for this, the low premium of OTM options creates an illusion that you won’t lose much, but in reality there is a very high probability for you to lose all the money, albeit small amounts. This is especially true in cases where the market moves but not at the right speed. For example the market may move 4% but if this move is spread across 15 days, then it does not make sense holding far OTM options. However, far OTM options make money when the movement in the market is swift – for example a 4% move within 1 or say 2 days. This is when far OTM options moves smartly.
Conclusion – When we are at the start of the expiry series, and you expect the target to be achieved over 25 days, it makes sense to buy ITM options. One should certainly avoid buying ATM or OTM options.
The last chart (bottom right) is quite similar to the 3rd chart, except that you expect the target to be achieved on the day of the expiry (over very close to expiry). The conclusion is simple – under such a scenario all option strikes, except ITM lose money. Traders should avoid buying ATM or OTM options.
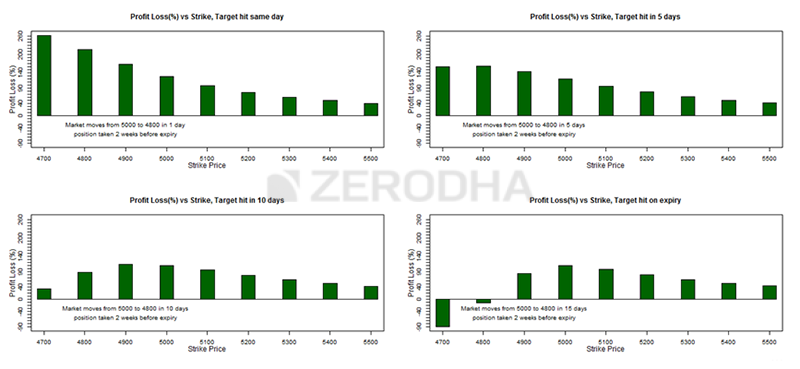
Let us look at another set of charts – the idea here is to figure out which strikes to choose given that the trade is executed in the 2nd half of the series i.e at any point from 15th of the month till the expiry. Do bear in mind the effect of time decay accelerates in this period; hence as we are moving closer to expiry the dynamic of options change.
The 4 charts below help us identify the right strike for different time frames during which the target is achieved. Of course we do this while keeping theta in perspective.
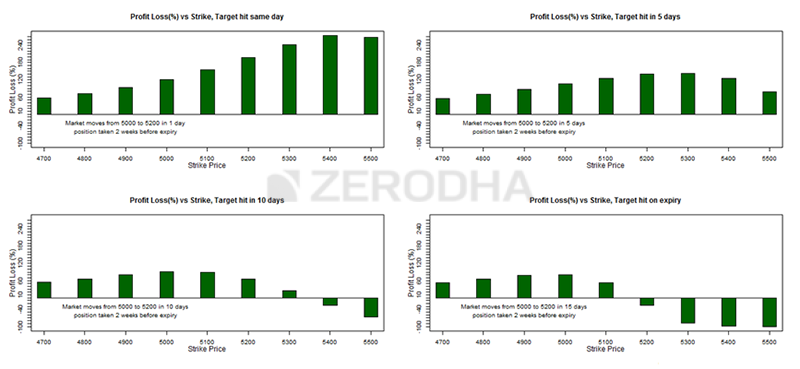
Chart 1 (top left) evaluates the profitability of different strikes wherein the trade is executed in the 2nd half of the series and the target is achieved the same day of trade initiation. News driven option trade such as buying an option owing to a corporate announcement is a classic example. Buying an index option based on the monetary policy decision by RBI is another example. Clearly as we can see from the chart all strikes tend to make money when the target is achieved the same day, however the maximum impact would be on (far) OTM options.
Do recall the discussion we had earlier – when market moves swiftly (like 4% in 1 day), the best strikes to trade are always far OTM.
Conclusion – When you expect the target to be achieved the same day (irrespective of time to expiry) buy far OTM options. I would suggest you buy 2 or 3 strikes away from ATM options and not beyond that. There is no point buying ITM or ATM options.
Chart 2 (top right) evaluates the profitability of different strikes wherein the trade is executed in the 2nd half of the series and the target is achieved within 5 days of trade initiation. Notice how the profitability of far OTM options diminishes. In the above case (chart 1) the target is expected to be achieved in 1 day therefore buying (far) OTM options made sense, but here the target is achieved in 5 days, and because the trade is kept open for 5 days especially during the 2nd half of the series, the impact of theta is higher. Hence it just does not make sense risking with far OTM options. The safest bet under such a scenario is strikes which are slightly OTM.
Conclusion – When you are in the 2nd half of the series, and you expect the target to be achieved around 5 days from the time of trade execution buy strikes that are slightly OTM. I would suggest you buy 1 strike away from ATM options and not beyond that.
Chart 3 (bottom right) and Chart 4 (bottom left) – both these charts are similar except in chart 3 the target is achieved 10 days from the trade initiation and in chart 4, the target is expected to be achieved on the day of the expiry. I suppose the difference in terms of number of days won’t be much, hence I would treat them to be quite similar. From both these charts we can reach 1 conclusion – far OTM options tend to lose money when the target is expected to be achieved close to expiry. In fact when the target is achieved closer to the expiry, the heavier the far OTM options bleed. The only strikes that make money are ATM or slightly ITM option.
While the discussions we have had so far are with respect to buying a call option, similar observations can be made for PUT options as well. Here are two charts that help us understand which strikes to buy under various situations –
These charts help us understand which strikes to trade when the trade is initiated in the first half of the series, and the target is achieved under different time frames.
While these charts help us understand which strikes to trade when is the trade is executed in the 2nd half of the series and the target is achieved under different time frames.
If you go through the charts carefully you will realize that the conclusions for the Call options holds true for the Put options as well. Given this we can generalize the best practices for buying options –
| Position Initiation | Target Expectation | Best strike to trade |
|---|---|---|
| 1st half of the series | 5 days from initiation | Far OTM (2 strikes away from ATM) |
| 1st half of the series | 15 days from initiation | ATM or slightly OTM (1 strike away from ATM) |
| 1st half of the series | 25 days from initiation | Slightly ITM options |
| 1st half of the series | On expiry day | ITM |
| 2nd half of the series | Same day | Far OTM (2 or 3 strikes away from ATM) |
| 2nd half of the series | 5 days from initiation | Slightly OTM (1 strike away from ATM) |
| 2nd half of the series | 10 days from initiation | Slightly ITM or ATM |
| 2nd half of the series | On expiry day | ITM |
So the next time you intend to buy a naked Call or Put option, make sure you map the period (either 1st half or 2nd half of the series) and the time frame during which the target is expected to be achieved. Once you do this, with the help of the table above you will know which strikes to trade and more importantly you will know which strikes to avoid buying.
With this, we are now at the verge of completion of this module. In the next chapter I would like to discuss some of the simple trades that I initiated over the last few days and also share my trade rationale behind each trade. Hopefully the case studies that I will present in the next chapter will give you a perspective on the general thought process behind simple option trades.
Key takeaways from this chapter
- Volatility plays a crucial role in your decision to buy options
- In general buy options when you expect the volatility to go higher
- Sell options when you expect the volatility to decrease
- Besides volatility the time to expiry and the time frame during which the target is expected to be achieved also matters
Karthik Sir, Is there any strike table in case of weekly expiry similar to the case of monthly expiry you have explained in this chapter ?
Sir what will be table for option selling?
Hi Karthik,
Great explanations on the topic. Is it possible to get the data/ spreadsheets that have built the blue and green column graphs. I am trying to build intuition around how strike of 4700, 4800, 4900 are profitable when ATM strike = 5000 (since premium & Greek values are not known/ indicated in the example).
Thanks!
Thanks Jha, unfortunately dont have the spreadsheet relating to that 🙂
Hello Karthik,
For intraday,ITM (1 strike away) will be good choice right?
I mean, just for Points and sqare off
Not for shorting 🙂
hi sir,
thanks for detailed write up on volatility, forgive me if the question is lame. When we are sure about the increase in price of infosys by 4%. 5000 to 5200. buying call option beyond 5200 (OTM) is not meaningless?. profit= 5200(target price)-5700(OTM strike price)-premium. which means buying otm leads to loss?
Along with that, you also have to look at time to expiry 🙂
Hello
More or less understood what has been written here but did not quite get the logic behind this. like why will the ATM option not be profitable even if the target is reached in 25 days. if its going to expire in positive?
Becuase there are other factors at play and not just the movement of the underlying Mansi. You need to consider other greeks.
I think the target and strike prices are different here. Target is 5200, but the strike price is what you choose to buy. Remember, the strike price is expected to be lower than the spot (for call buyers) only on expiry, but you can square off even before the expiry if your target of 5200 is achieved. As long as the market is moving up, you will make money, but the charts tell you which strike price will fetch you the maximum.
Yes, target can be anything, its your call. But strikes are fixed.
Thank you!
Sure, good luck Pranav!
I read the next chapter and the case study about trading volatility around RBI Monetary Policy event answered the second question. It seems that there can be easy pickings in options markets.
~Thank you!
Ah ok, I just posted a reply 🙂
Dear Karthik,
Thank you so much for explaining the interaction of input variables in such a simple manner. If I knew the topic and tried to explain, I would have shown partial derivatives and 90 people out of 100 would have walked away 🙂
I have two questions:
1) Please look at the fourth/last chart showing the profitability of call option when the target of 5200 is achieved on expiry. Shouldn\’t the profitability of the strike price of 5200 should be -100%? On expiry, the option is worthless (strike price of 5200 and spot price of 5200) so my entire investment is lost.
2) This is more of an intellectual curiosity about arbitrage in interlinked financial markets. Consider that an important event, say FED Policy meet, is to be held after a few days, and there is no agreement about the expected decision on interest rate policy yet. For some reason, say limited rationality or market inefficiency, volatility of the underlying asset has not increased yet but we expect it to increase when we are close to the event. This would make options more valuable at that time. Since I can borrow to buy options today and sell them when volatility increases to make profits, the price of options should already be higher today. Or is the constraint of limited rationality / market inefficiency of the underlying binding on the option also and the price of the option will be low today since the realized volatility of the underlying has not increased yet?
My guess would be that efficient options markets would not give an easy opportunity to profit from widely anticipated events, so the option price would have increased already. This would be reflected in the implied volatility of the option. If true, this could be a reason why we use implied volatility rather than realized volatility.
Glad you liked the content, Pranav.
1) The idea is to showcase which of the strikes has are likely to profit if the underlying was to move in the expected desired direction. Point to note is that it is not necessary to hold to expiry.
2) This does not happen. The nature of markets is such that it likes certainty. Whenever there is uncertainty or confusion, the implied volatility always increases, and when this happens option values increases.
Hope that helps 🙂
Sir in the blue chart series in the second chart you have. mentioned that buying an ATM option or slightly OTM option is good, but you have not mentioned about ITM option. But in the chart it is clearly visible that ITM options is also profitable. So can we buy it or not?
If the underlying moves, most strikes turn profitable, but the question is which amongst them is the most profitable. Thats what we try to find.
These above examples are for put and call buyers rights? and not writers?
That\’s right.
Are these above examples based on assumptions or they happen on day2day basis?
These are not assumptions, these happen regularly in market 🙂
Strictly speaking based on the summarised table, if we were to initiate a long option position on a Thursday (weekly index expiry) with the expectation of the target being achieved on the same day:
1) would that be considered 2nd half of series and same day –> OTM option
OR
2) 2nd half of series and expiry day –> ITM option
Ofcourse, it is more nuanced than this
The point to note here is that if there is enough time to expiry, then you can consider an OTM option even if you expect the target to hit the same day. Otherwise, you can consider ITM option. So yes, time to expiry does make a difference. Also, more nuanced yes, especially since there are other factors at play – delta, volatility etc.
In that case how do i figure at what strike should i enter the trade Karthik? Are there any thumb rules?
Coz in this chapter we specifically discuss the payoffs with respect to number of days it might take to reach the target right? So just trying to figure how do i match both and figure a strike.
You can take the same trades, just that the timelines shrink. Also, do use Sensibull to figure the payoffs for strategies where the position will be closed before expiry. You will get an approximate view on the payoff.
Hi Karthik
How to figure whether the target hitting will happen in 4 days or 14 days?
That wont be possible, Malavika. You can only figure what could be the likely target, but how many days it would take to hit that target is something you cant figure.
it would be good if you reupload the charts and graphs with some clarity. all your graphs and charts are very hard to read. and some of your link are outdated. it\’s been 9 years , it would be good if you update the entire module.
Thanks, yeah meaning to do that. Will do.
Hi,
Great job sir. The whole module is very informative.
I also agree with the point that option shorting could have been explained the same way option buying has been described.
Thanks
Thanks Ayush. Point noted 🙂
Sir,
I have \”zero\” idea of options in practical scenario.
Just wanted to know the below:
1. Whether all stock options have monthly expiry (Last Thursday) and all index options have weekly expiry?
Sir,
Could we trade options in currency/commodities market just like we trade in equities?
Yes, you can. There are options on currencies and commodities.
Sir,
Thanks so much for all your answers.
I want to club this statistical approach with TA & FA to trade for a little prolonged time say for weeks. What would be your advise on this approach?
Thats probably the right way to go about 🙂
Sir,
Suppose we are on the 5th day since a stock is falling. Before starting to fall, the stock\’s price was 100. The stock\’s 7 day SD is say, 10%. Then we can say that the stock was supposed to trade between 90 and 110 during the 7 days from falling.
(i) Suppose on the close of today i.e, 5th day , the stock is trading close to 90. Can we infer that the statistical analysis is confirming that the stock price is likely to increase from tomorrow (6th day) till atleast 7th day?
Please confirm Sir.
Yes, but its only a possibility and no certainty 🙂
Sir,
Suppose today\’s closing price of a stock is 100 and the daily volatility is 2%. Then we can say that the stock will trade between 98 and 102 on tomorrow.
In respect to the above, can we long on the stock if it comes to 98 and short if the stock prices reaches 102 on tomorrow?
Yup, you can. Back test before you trade. Also, 2% is 1SD, maybe you can test 2SD.
Sir,
You had responded to one of my queries as \”There are quantitative technique which traders use to predict the future move\” ….. Can you please help me with a source or advise how can I able to learn that technique? I am specifically want to know this as this could help me club with other directions and to take the trading decision accordingly.
For Quants, you will have to take this approach – https://www.cqf.com/
Sir,
(i) Is IV data annualized?
(ii) Like ViX, is IV data says for the upcoming 30 days or is it an instantaneous value?
Yes dude, its annualized.
Sir,
Besides TA to know whether a stock/index will rise during the upcoming period, is there any statistical study available which can predict the probability of a stock moving up/down too?
There are quantitative technique which traders use to predict the future move.
Sir,
To predict range of a stock\’s movement, say for tomorrow, which data will be better to consider while calculating the range? Is it the historical spot data or IV of ATM strike?
I\’d suggest IV of the ATM strike.
Sir,
In NSE website and under derivatives section of a particular scrip, we could find data against Daily Volatility & Annualised Volatility.
(i) Do these figures mean the same as we calculate the historical realized volatility from excel through last 1 year spot prices?
(ii) If the above answer is \”Yes\”, can I alternatively consider this data without actually calculating the historical volatility through excel? Your viewpoint please.
(iii) Do NSE publishes this Daily Volatility & Annualised Volatility through stock futures or they consider spot prices? Any idea please.
1) No, this could change given the fact that the exchanges calculate volatility from a margin perspective.
2) Although different, you can use these numbers without calculating as majority of the industry uses these numbers.
3) Mostly spot as far as I know.
Sir,
I meant to know that is there any approach (as per probability wise) to understand whether a particular stock/index will rise or fall in an upcoming period of time?
Ah, sorry, I mistook your earlier query. While volatility as a measure gives you a sense of the price band, it wont tell you if the stock is moving up or down. Maybe you can use some TA here to develop a view.
Sir,
You have nicely described process for upper limit and lower limit probable range of a movement of stock/index.
In between, could you kindly tell if there is any study of futuristic prediction of whether the price of a stock will decrease/increase in terms of probability also? If yes, request if you could kindly help me with the same.
You can use the volatility based projection for stocks as well.
Sir,
Suppose I want to gauge current Nifty 50 Index volatility. Can I do with all the options below?
Method 1: I plotted the historical Nifty 50 index volatility of all the past 252 trading days and plot today\’s volatility in the graph to understand where it is now.
Method 2: I plotted the volatility cone and then plot the IV of various strikes to understand.
Method 3: I compared ViX with annualized historical volatility.
Method 2 & 3 you can. Not sure method 1 is possible. The input for calculating volatility is a time series data, so if you want 1 year volatility, then you will have to give 252 days of daily return as the input to get the volatility number.
Sir,
We find ViX fluctuates in real time during the trading day. Likewise,do IV also changes in real time whole through the trading day?
I\’m finding it confusing…you\’ve asked so many queries related to the same thing so many times 🙂 Please consolidated and ask.
Sir,
(i) I am finding that we are comparing the historical volatility with IV. Now as I understand IV is a forward looking volatility of the stock. Now, is it that we are taking this forward looking IV to mean the current volatility only? Pls confirm. I am messing here.
Yes, its current volatility.
I can\’t understand 1st half and 2nd half of the series
If there are 30 days to expiry, then 1st 15 days is 1st half and 2nd 15 days is considered 2nd half.
Sir,
Please confirm if both the below will signify for buying generically:
(i) IV Hisorical volatility
Sir,
Please confirm if I am right on below:
(i) We can know the historical realized volatility through excel calculation.
(ii) We can know the current volatility through IV of strikes. If I am wrong here, please put your thoughts.
(iii) We can know the future volatility through ViX
1) Yes
2) Current IV of the strike, but not a generalization for the market as such.
3) Like I mentioned earlier, you can use it as a rough indicator.
Sir,
Like ViX, is IV also a forecast volatility?
It is not a forecast, but rather an estimate.
Sir,
We know VIX, is a real-time market index representing the market\’s expectations for volatility over the coming 30 days. Now, does the IV also forecasts volatility for the upcoming 30 days or does that predict the volatility for the remain period of the expiry of the option? Please help.
You can use it as a proxy for where the Vol will go over the next 30 days.
Sir,
1. Is there any source from where I could get the realized historical volatility of Nifty 50 index of the past 1 year for all the respective trading days?
2. Can I get the realized historical volatility of some stock of the past 1 year for all the respective trading days?
1.Not sure
2.Not sure
But I think you can calculate this yourself on excel.
Sir,
Can the below be correctly inferred to gain understanding from volatility perspective?
1. Compute historical annualized volatility and compare with today\’s IV of strikes.
2. Compute historical annualized volatility of ViX value and compare with todays ViX value
When today\’s IV is half of historical annualized volatility and today\’s ViX is close to -2SD of historical annualized ViX, then we may look to buy.
Yeah, thats fine. But see my previous comment as well 🙂
Sir,
You had suggested in one of my previous query that I will need to compare historical volatility with ViX to understand market volatility in general.
With the view of the above, could you kindly confirm which method should I apply to know the current situation of Vix?
Method 1:
Compute historical annualized volatility of Nifty 50 through spot data and compare this with ViX. If today\’s ViX<historical annualized volatility, then buy else sell.
Method 2:
Compute historical annualized volatility of ViX value. If the present ViX value is close to -2SD of historical annualized volatility of ViX , then trigger to buy and if present ViX value is close to 2SD of of historical annualized volatility of ViX, then trigger to sell.
Your thoughts will help me immensely here.
The interpretation is correct, but I\’m not sure what you are buying and selling.
Sir,
During my last three communications with you, regarding comparing historical volatility with today\’s volatility, I could understand that the same could be done by two methods in general:
(i) Compute historical volatility and compare with ViX.
(ii) Compute historical volatility and compare with implied volatility (Preferably with ATM strike).
Am I correct on the above or missing something?
Implied volatility if you are comparing strike specific volatilty and Vix if you are looking for market volatility in general.
Sir,
In one of your answers, you have said “Yes, essentially it is about predicting where the volatility is headed and basing your option position that that volatility view. GARCH is a complex piece, you can generally stick to simpler practice of looking at historical volatility with respect to today’s volatility.”
Now with respect to above, how shall I compare today’s volatility with respect to historical volatility? Can I approach like below?
(i) Compute annualized volatility till yesterday with all past 1 year historical data.
(ii) Again compute annualized volatility taking past 1 year historical data and also today’s data.
(iii) Then compare the above two data.
Kindly confirm if it will work.
You can compute historical daily volatility and compare it with today\’s implied volatility.
Sir,
In one of your answers, you have said “Yes, essentially it is about predicting where the volatility is headed and basing your option position that that volatility view. GARCH is a complex piece, you can generally stick to simpler practice of looking at historical volatility with respect to today’s volatility.”
Now with respect to above, can I compare today’s volatility with respect to historical volatility like below?
(i) Compute annualized volatility till yesterday with all past 1 year historical data.
(ii) Look the IV of strikes.
(iii) Then compare the above two data.
If the above process is good, which strike’s IV should I consider to compare with historical volatility.
Yeah, that works. Not sure about the comparison of individual strikes but you can certainly look at ATM strike\’s vol for a proxy of volatility.
Sir,
In one of your answers, you have said “Yes, essentially it is about predicting where the volatility is headed and basing your option position that that volatility view. GARCH is a complex piece, you can generally stick to simpler practice of looking at historical volatility with respect to today’s volatility.”
Now with respect to above, can I compare today’s volatility with respect to historical volatility like below?
(i) Compute annualized volatility till yesterday with all past 1 year historical data.
(ii) Look the Vix value.
(iii) Then compare the above two data.
Is the above process a right way?
Yes, that works. But remember, this is a quick and easy method.
Sir,
In one of your answers, you have said \”Yes, essentially it is about predicting where the volatility is headed and basing your option position that that volatility view. GARCH is a complex piece, you can generally stick to simpler practice of looking at historical volatility with respect to today’s volatility.\”
Now with respect to above, can I compare today\’s volatility with respect to historical volatility like below?
(i) Compute annualized volatility till yesterday with all past 1 year historical data.
(ii) Look the IV of strikes.
(iii) Then compare the above two data.
If the above process is good, which strike\’s IV should I consider to compare with historical volatility.
Sir,
In one of your answers, you have said \”Yes, essentially it is about predicting where the volatility is headed and basing your option position that that volatility view. GARCH is a complex piece, you can generally stick to simpler practice of looking at historical volatility with respect to today’s volatility.\”
Now with respect to above, how shall I compare today\’s volatility with respect to historical volatility? Can I approach like below?
(i) Compute annualized volatility till yesterday with all past 1 year historical data.
(ii) Again compute annualized volatility taking past 1 year historical data and also today\’s data.
(iii) Then compare the above two data.
Is it that want you want to mean? I am perplexed.
Sir,
In one of your videos, you have taught how to compare the historical volatility with respect to IV and thus forecasting upcoming volatility. Now, my query is which strike\’s IV should I consider here to judge the volatility situation for now w.r.t historical?
Sir,
Regarding volatility, you have given concurrence on the below in my last comment.
—>Simply take the historical annualized volatility of the spot till yesterday. Compute 1SD,2SD,-1SD,-2SD. Compute today’s annualized volatility of the spot. If today’s annualized volatility is somewhere around 2SD, the volatility is expected to drop else if it is around -2SD, it is expected to rise.
Now, if we could understand simply through the above only regarding volatility, what is the specific purpose of volatility cone?
Please help to understand.
Volatility cone is a simple visual representation of volatility (spikes), using which you can spot opportunities related to volatility variance. I know \’volatility variance\’, sounds off, but you know what I\’m saying 🙂
Sir,
1. Request you to kindly comment if the below process could be followed while analyzing volatility of today?
—>Simply take the historical annualized volatility of the spot till yesterday. Compute 1SD,2SD,-1SD,-2SD. Compute today\’s annualized volatility of the spot. If today\’s annualized volatility is somewhere around 2SD, the volatility is expected to drop else if it is around -2SD, it is expected to rise.
2. Also, kindly comment if the below method will also work to analyze volatility?
—>Understand how far we are from expiry. Based on that we compute the historical annualized volatility of the same no. of days from the expiry for the previous 15 months. Then we draw the volatility cone. Then we look today\’s implied volatility of strikes and try to find out if any of the strikes is there around 2SD/-2SD and accordingly choose to sell/buy respectively.
3. If both the above methods are good, then I would request you to kindly help understand which one should I go? Also, request your more advice please.
Sure, I think you could take the 2SD approach. I think its easy to backtest it as well. I\’d suggest you do. Not sure about 2, have never dealt with long dated options.
In the \”Effect of Time\” section explained above, the following 2 assumptions are taken,
1. Option is of monthly expiry.
2. Volatility increases.
Do charts explained with the above 2 assumptions hold in other cases like for options with weekly expiry or volatility decreases etc.?
Yes, the option behavior is the same, regardless of the type and expiry. Only thing that changes is the timlines.
if you buy option nearer to ATM just few minutes before expiry , whether we need high margin money
Yup, you\’d need.
Sir,
Is there any genuine place which shows the forecasting volatility of the upcoming days?
Not that I\’m aware of.
Sir,
You have discussed somewhere in your module as below:
To follow below steps while trading options:
1. Feel the directional movement of the underlying first.
2. Long when volatility is going to increase in upcoming days and vice versa.
3. Strikes to choose based on time to expiry.
Based on the above understanding, regarding the above point 2., did you want to mean prediction of upcoming volatility of strikes through plotting volatility cone or prediction of entire volatility of the underlying through some other methods like GARCH etc.?
Afterwards, you have discussed through various days to expiry and selected the strikes. I believe you have tried to mention the entire India VIX. If that is so, how can we forecast/predict the future volatility. Please help
Yes, essentially it is about predicting where the volatility is headed and basing your option position that that volatility view. GARCH is a complex piece, you can generally stick to simpler practice of looking at historical volatility with respect to today\’s volatility.
Is there a source where I can understand the trends in the indices – mainly NIFTY and BANK NIFTY. I\’m know basics of TA and many a times I\’m able to build conviction as well. But since I\’m new at it I would also want to listen to more experienced people and what directional view they have?
Can you help me on where can I find such content or any TA ideas on indices that are reliable?
There is nothing specific to indices, Siddhanth. TA as a concept works the same across all assets. So if you know how to use TA on RIL, then it is the same way TA on the indices as well. The only thing you need to know is the difference in the underlying assets.
1. What is the exact practical use of the BS calculator? I already understand how it works and what output it gives to us when we give it certain inputs. What I\’m not able to understand is what situation do I use a BS formula and for what broader purpose?
2. Do you believe in \”Quant Finance\” where trades are placed on the basis of complex formulae without human intervention. And why?
1) You use that to factor in all variables that impact options and calculate the premium based on these variables.
2) Quant has a lot more statistical and mathematical reasoning for trades. If you like those reasoning, then maybe you will like quant 🙂
Providing additional detail regarding the above query posted, I\’m talking about purchasing a BANKNIFTY 48300 CE, either 16APR or 24APR as expiry.
Thats ok. Please do check my previous message.
Hi Karthik,
Wonderful content on Options specifically, learnt a lot and its very surprising this is for free. Thanks a ton!
Coming to my query, as of today (04/04/2024), based on technical analysis, I believe that BANK NIFTY will reach 48500 (currently trading close to 48100) in the next 7 days.
Now I have 3 expiry options:
1. 10 APR (6 days) – obviously, theta too high hence no point talking about this expiry
2. 16 APR (12 days)
3. 24 APR (20 days – monthly expiry)
Questions:
1. Since the upmove is expected to happen in the next 7 days, I will buy either an ATM option or 1 or 2 strikes below ATM. Which expiry should I choose? – 16 APR or 24 APR?
2. Is there any technical or behavioural difference between monthly expiry and weekly expiry of index options?
1) Since you are buying options, its best if your option has time value. So, either 16th or 24th. For a buyer, theta works against…so more time to expiry, the better. Its the exact opposite for sellers.
2) More time, better for buyers as theta is lower, otherwise for sellers.
Hello Karthik,
Sure. You have explained the premium variation with respect to time i.e. call/put option bought in the first half (first 15 days) and 2nd half (last 15 days) of the F&O series.
NIFTY Index options are available with one week expiry (weekly contracts). In that case,
1. How are the first and second half relevant here?
2. If no market/corporate events are happening in a particular weekly options contract, would volatility play any crucial role?
Please let me know.
Thank you,
Yogesh
1) You can divide the week into two halves and apply the same theory.
2) It does play a crucial role regardless 🙂
Hello Karthik. What is the significance of \’first-half\’ and \’second-half\’ in the context of index options, considering that these options can be traded with weekly expirations?
Ah, can you pls share more context?
Hello Karthik,
Thank you for your response.
It is not clear to me how profit will be more in OTM compared to ITM, with change in time to expiry.
My understanding is with increase in time to expiry, profit at ITM will also increase from that of OTM.
e.g. (I have used some random numbers to exemplify my concept)
For the 5 days of trade initiation
Profit of 4700 CE will be 525 = (500 intrinsic value + 25 premium increase for changing ITM to Deep ITM)
Profit of 5500 CE will be 15 = (15 premium change for changing Deep OTM to OTM)
For the 15 days of trade initiation
Profit of 4700 CE will be 550 = ( 500 intrinsic value + 50 premium increase for changing ITM to Deep ITM)
Profit of 5500 CE will be 40 = ( 40 premium change for changing Deep OTM to OTM)
For the 25 days of trade initiation
Profit of 4700 CE will be 590 = ( 500 intrinsic value + 90 premium increase for changing ITM to Deep ITM)
Profit of 5500 CE will be 65 = ( 65 premium change for changing Deep OTM to OTM)
On expiry day (30 day ) trade initiation
Profit of 4700 CE will be 620 = ( 500 intrinsic value + 120 premium increase for changing ITM to Deep ITM)
Profit of 5500 CE will be 85 = ( 85 premium change for changing Deep OTM to OTM)
The graphs shown for Long calls to be executed in first half of the cycle is different from my understanding.
Hence it would be helpful if you kindly help to rectify my concept.
If my concept is corrected for these set of graphs I hope I will be able to apply the same knowledge to other graphs as well.
Regards,
Manas
The way to think about this is – with more time to expiry, the volatility will be higher as there is more time for uncertainty to play out. So OTM options premiums which are already higher due to volatility and time will only get more expensive, which means the buyer of OTM will benefit much more than the ITM ones.
Hello Karthik,
Thank you for your response.
It would be helpful if you kindly elaborate more.
My understanding is – premium is directly proportional to volatility. Also higher premium works in favour of Option writers and against option buyers in general.
Please confirm whether above understanding is correct.
If above understanding is correct, please explain how following statement holds true.
\”For volatility to work in favor of a long call option one should time buying a call option when volatility is expected to increase and avoid buying call option when volatility is expected to decrease.\”
I\’m trying to identify if any point I have missed to understand.
Regards,
Manas
Yes, premiums are a function of volatility. Yes, higher premium favor option writing, but this has to be on the back of premium being expensive and not fairly valued.
If after you buy an option, the volatility increases, then obviously the premium will increase, which is what the buyers would want.
The query is related to first four graphs in the section 22.3 – Effect of Time.
I\’m, confused about the logic behind this result.
Let me try to analyze four charts related first half of the charts.
For the 5 days of trade initiation ( top left chart), the profit is expected to be maximum, if the call ends in ITM. But in the graph it is seen the profit is maximum at OTM.
It is true, due to the effect of volatility the value of premium may rise or fall for Buy calls. But if calls expire in ITM, intrinsic values will increase the profit. Hence it is not clear why OTM buy calls result maximum profit.
I\’m trying to understand how this result will vary with number of days from expiry.
Regards,
Manas
These graphs are only to the extent of delta movement, but yes, it is true that with volatility increase the premiums too increase and decreases likewise.
Thank you for your response.
If my understanding is correct then it contradicts following statement –
For volatility to work in favor of a long call option one should time buying a call option when volatility is expected to increase and avoid buying call option when volatility is expected to decrease.
Please confirm.
Yes, and its not just true for a call option, but options in general. When you buy an option, you will gain if volatility is low at the time of buying and is expected to go up after you buy.
I would like to understand following implications of volatility –
For volatility to work in favor of a long call option one should time buying a call option when volatility is expected to increase and avoid buying call option when volatility is expected to decrease
Higher the volatility higher the premium. My view is – with higher premium , major portion of the profit will be taken away from intrinsic value. Hence with same intrinsic value at the expiry higher premium will reduced profit.
Let\’s take an example:
Stock 1
Strike price – 100 CE
Spot price at buying – 80
Premium (low volatility) – 20
Spot price on expiry – 170
Profit = (170-100)-20 = 50
Stock 2
Strike price – 200 CE
Spot price at buying – 180
Premium (High volatility) – 40
Spot price on expiry – 270
Profit = (270-200)-40 = 30
We can see with higher premium (due to volatility) call was not favourable for stock 2.
Please validate my understanding and identify if there is any gap in understanding.
Regards,
Manas
Yes, for this reason we need to time buying a call option when the volatility favors (low volatility) buying not just call but put options as well.
Sir as u explained the strike prices about monthly expiry can we know which strike price to choose in weekly expiry …..?
The method to select strikes for weekly is also similar, its just that the timelines shrink. In weekly strike, think of Tue-Wed as half way through the expiry series. That will help in strike selection 🙂
Hi Karthik,
I have recently started learning Options and I must say the contents that you have put in is mind blowing and it is certainly helping naive investors / tradors like me to understand the entire concept much better. Thank You so much for all your efforts.
I have some fundamental questions –
1. How do we expect the targets to be achieved in 5/15/20 days?
2. For Nifty and Bank Nifty since we have a weekly expiry, which scenario of Strike Selection would be applicable?
Thanks, Niju. I\’m glad you liked the content here.
1) We expect that based on the underlying\’s price action. Look at the momentum of the underlying and figure how quickly the target can be achieved.
2) Again, it depends on the underlying and the momentum. Higher the momentum, sooner is the possibility of achieving the target.
Hey Sir
In this module u gave the example of INFY spot price -5000 , and the scenarios on options if it increased 4% i.e5200
So while discussing the best strikes to buy for eg(2-3) strikes OTM are u considering 5000 as ATM or the amount that we expect the stock to increase to i.e 5200 as ATM.
Like if the target of 4% is achieved in a day far OTM options make more money is this scenario also the same if we chose 1% as the target cause a target of 1% has a much higher probability of being achieved in one day.
Not sure if i fully understand your query, but yes, if you expect the movement to be fast and your target achieves within a day, then OTM is not a bad strike to consider, especially when you have many days to expiry.
Sir, i have a basic question. How to know When a contract opens & where to find/see it. I mean now we are in Aug end. Now already september contracts are trading. But how to know when the september contracts opened? How to identify and expect the october weekly contract opens.?
So when one contract expire, another one is immediately made available. For example, when August expires, from next day Nov will be made available.
I found following on NSE website:
https://www.nseindia.com/products-services/equity-derivatives-nifty50
\”Base Prices
Base price of the options contracts, on introduction of new contracts, would be the theoretical value of the options contract arrived at based on Black-Scholes model of calculation of options premiums.
The base price of the contracts on subsequent trading days, will be the daily close price of the options contracts. The closing price shall be calculated as follows:
If the contract is traded in the last half an hour, the closing price shall be the last half an hour weighted average price.
If the contract is not traded in the last half an hour, but traded during any time of the day, then the closing price will be the last traded price (LTP) of the contract.
If the contract is not traded for the day, the base price of the contract for the next trading day shall be the theoretical price of the options contract arrived at based on Black-Scholes model of calculation of options premiums.\”
Here is my question:
1) If option price is derived from Black-Scholes model then why \”The base price of the contracts on subsequent trading days, will be the daily close price of the options contracts\”?
Next day also it should be derived from Black-Scholes model, what Am I missing?
2) Now if all day price is derived from Black-Scholes model then why the Bid-Price and Ask-Price? as it is already decided by Black-Scholes model. For example, I want to buy call option which has ask-price suppose Rs. 100 but premium is Rs. 90 then what price I will get option Rs. 100 or Rs. 90?
Could you help me? I\’m confused little bit.
Thanks.
1) Because B&S model does not consider the contract\’s liquidity. This has to be considered as well.
2) The answer is same as above 🙂
Hello sir
could you suggest how to assess that market volatility will go up or down in future?
and also can methods of technical analysis be used on india vix to predict market volatility
Pranay, predicting volatility can be a complex affair. There are statistical models, like \’Garch models\’, to predict volatility, but they are fairly complex.
Sir,
During any corporate event/ RBI policy/ political issues, we learnt trading options 2 days before the cooling.
(A) If the incident occurs in the first half, what should be our better decision with moneyness & strike to trade?
(B) If the incident occurs in the second half, what should be our better decision with moneyness & strike to trade?
1) Stick to ATMs in most cases. But then based on your specific strategy strikes can change too.
2) Since direction and clarity would have come, you are free to pick a strike to benefit from directional movement.
Sir,
Thank you so much for your valued comments. Your writings mean so much to a novice like me
Good luck and keep learning, Anirban 🙂
Sir,
I would like if you could go through the below points without skipping. I have tried to put the four combinations of volatility versus underlying price movement keeping the perspective of timing in the same frame. Most of the concepts are received from your chapters only, however, I tried to figure out the entire probable situations in terms of volatility, underlying movement and time to expiry in one frame. Please comment if I have rightly predicted or missing somewhere:
(1) Circumstance-1: Current underlying price is expected to increase
I should try to look for either of the below:
(A) Action-Buy CE options with low volatility (recognized from volatility cone)
From underlying price action perspective-
Strikes to buy (For first half of series) : For target achievable in 5 days-2-3 OTM strikes away ATM, For target achievable in 10 days-ATM/1 OTM strike away ATM, For target achievable in 25 days- Slightly ITM, For target achievable on expiry- ITM
Strikes to buy (For second half of series): For target achievable at same day-2-3 OTM strikes away from ATM, For target achievable in 5 days-ATM/1 OTM strike away ATM, For target achievable in 10 days- Slightly ITM/ATM, For target achievable on expiry- ITM
(B) Action- Sell PE options with high volatility (recognized from volatility cone)
From underlying price action perspective-
Strikes to sell (For first half of series): For target achievable in 5 days-2-3 ITM strikes away ATM, For target achievable in 10 days-ATM/1 ITM strike away ATM, For target achievable in 25 days- Slightly OTM, For target achievable on expiry- OTM
Strikes to sell (For second half of series): For target achievable at same day-2-3 ITM strikes away from ATM, For target achievable in 5 days-ATM/1 ITM strike away ATM, For target achievable in 10 days- Slightly OTM/ATM, For target achievable on expiry- OTM
(2) Circumstance-2: Current underlying price is expected to decrease
I should try to look for either of the below:
(A) Action-Sell CE options with high volatility (recognized from volatility cone)
From underlying price action perspective-
Strikes to sell (For first half of series): For target achievable in 5 days-2-3 ITM strikes away ATM, For target achievable in 10 days-ATM/1 ITM strike away ATM, For target achievable in 25 days- Slightly OTM, For target achievable on expiry- OTM
Strikes to sell (For second half of series): For target achievable at same day-2-3 ITM strikes away from ATM, For target achievable in 5 days-ATM/1 ITM strike away ATM, For target achievable in 10 days- Slightly OTM/ATM, For target achievable on expiry- OTM
(B) Action- Buy PE options with low volatility (recognized from volatility cone)
From underlying price action perspective-
Strikes to buy (For first half of series): For target achievable in 5 days-2-3 OTM strikes away ATM, For target achievable in 10 days-ATM/1 OTM strike away ATM, For target achievable in 25 days- Slightly ITM, For target achievable on expiry- ITM
Strikes to buy (For second half of series): For target achievable at same day-2-3 OTM strikes away from ATM, For target achievable in 5 days-ATM/1 OTM strike away ATM, For target achievable in 10 days- Slightly ITM/ATM, For target achievable on expiry- ITM
I would like if you could go through the below points without skipping. Just a thought, given that so many queries pour in, reading such long queries can get a bit overwhelming. It will be nice if you could break this down into smaller ones 🙂
C1(A) – Yes. But the closer you move to expiry, I\’d suggest you avoid buying options, unless the underlying price movement is heavy, like 8-10% over 1 or 2 days.
C1(B) – Selling options is fine, but I\’d think twice before selling a PE. I\’d prefer selling a OTM CE instead. The reason is that in case of a sudden panic, the price crash can be quick.
C2(A) and C2(B) – Yes.
Sir,
Requesting you to kindly ignore my query from the 3rd & 4th from the last. I am still making modifications in the query. Will send once done to verify.
Sure, I\’ve replied anyway.
Sir,
Considering all other ( Delta/ Gamma/ Vega) fixed, with decay of time, which strike is affected the most through Theta?
OTMs lose time value faster.
Sir,
Again pls correct wherever required:
1. Volatility (via Vega) affects the OTM strikes most.
2. Price transitions (via Delta) affects the most in transition situations of \”Slightly OTM to ATM\”/ \”ATM to Slightly OTM\”/ \”ATM to Slightly ITM/ \”Slightly ITM to ATM\”
3. Price transitions (via Gamma) affects the ATM strikes most.
4. With expiry nearing by, the Gamma (rate of change of delta) shoots up for ATM. Thus we should avoid shorting ATM options and that specially as it nears expiry.
Whereas, with expiry nearing by, the Gamma for both the ITM/ OTM reduces to zero.
5. For low volatility: The delta for CE ATM strikes is 0.5, deep ITM flattens to 1, deep OTM flattens to 0. For high/increased volatility- The delta for CE ATM strikes is 0.5, deep ITM doesn\’t flatten to 1 but it linearly increased to 1 from ATM, deep OTM doesn\’t flatten to 0 but it linearly decreased to 0 from ATM.
Yup, again these are things we have discussed in the chapter 🙂
Sir,
1. What should be our decision for the below circumstantial situations:
Circumstance-1: Volatility high for few strikes as predicted from volatility cone and expected to cool off soon, but price is low for the same strikes as per prediction from price volatility range and expected to rise soon.
Circumstance-2: Volatility low for few strikes as predicted from volatility cone and expected to rise soon, but price is high for the same strikes as per prediction from price volatility range and expected to fall soon.
Should we better avoid these circumstantial situations or there is any other way out to predict?
1) This depends on time to expiry. If there is ample time to expiry, then you can expect delta to have a higher influence on the premium and therefore look at buying options. Else you can avoid buying in time to expiry is short.
2) Same as above. Look at it from time to expiry perspective.
(A) At the first half of series:
(1) Circumstance-1: Volatility low for few strikes as predicted from volatility cone, price is also low for the same strikes as per prediction from price volatility range.
Action: We should buy CE options for the common strikes having low volatility as well as low price
Strikes to buy: For target achievable in 5 days-2-3 OTM strikes away ATM, For target achievable in 10 days-ATM/1 OTM strike away ATM, For target achievable in 25 days- Slightly ITM, For target achievable on expiry- ITM
(2) Circumstance-2: Volatility high for few strikes as predicted from volatility cone, price is also high for the same strikes as per prediction from price volatility range.
Action: We should sell CE options for the common strikes having high volatility as well as high price
Strikes to sell: For target achievable in 5 days-2-3 ITM strikes away ATM, For target achievable in 10 days-ATM/1 ITM strike away ATM, For target achievable in 25 days- Slightly OTM, For target achievable on expiry- OTM
(B) At the second half of series:
(1) Circumstance-1: Volatility low for few strikes as predicted from volatility cone, price is also low for the same strikes as per prediction from price volatility range.
Action: We should buy CE options for the common strikes having low volatility as well as low price
Strikes to buy: For target achievable at same day-2-3 OTM strikes away from ATM, For target achievable in 5 days-ATM/1 OTM strike away ATM, For target achievable in 10 days- Slightly ITM/ATM, For target achievable on expiry- ITM
(2) Circumstance-2: Volatility high for few strikes as predicted from volatility cone, price is also high for the same strikes as per prediction from price volatility range.
Action: We should sell CE options for the common strikes having high volatility as well as high price
Strikes to sell: For target achievable at same day-2-3 ITM strikes away from ATM, For target achievable in 5 days-ATM/1 ITM strike away ATM, For target achievable in 10 days- Slightly OTM/ATM, For target achievable on expiry- OTM
Yes, these are things we\’ve discussed in that chapter itself 🙂
Hi sir,
Thank you for this amazing lesson. I had a doubt regarding selecting a strike based on time to expiry. For example, the assumptions made were \” if you expect the stock/index to hit the target price in 5 days, or 15 days with X no. of days to expiry then buy certain type of option. Using what method can we determine how many days will it for the stock/Index to hit the target price? I have read the TA module as well of Varsity but could not find the answer.
The time target is purely based on the stock\’s momentum. Very hard to estimate this, but TA does help to some extent.
How do we assess the premium with it\’s fair value if we don\’t know the fair value. This is what i want to understand how to derive fair value of an underlying asset particular strike price.
And suppose any underlying asset has weekly expiry which expires on thurseday of the week, so how do we know that what should be the time value of a particular strike , I know how we can calsulate the time value , but what I want to know is, what should be the time value on monday or tuesday or thurseday? is there any way to know it?
Anupam, to find the fair value of an option, you need to use the B&S calculator. This article is a bit dated, but it should give you a good working knowledge of how to use the B&S calculator – https://zerodha.com/z-connect/queries/stock-and-fo-queries/option-greeks/how-to-use-the-option-calculator
Yes, There is . Strike specific fair value can be done. I know one of the Trader who figured it out and takes trade strike specific which has value lower than its fair value while buying and while selling he chose strikes which has its value at premium than its fair value.
For the 2nd part :
I want to know since there are writers at 17800 who took short position by selling at 17800, when will they panic such as if spot price goes to 17900 or 18000 after that they will panic and leave their position, in this way we can predict when short covering can come and took position based on that. Is there a way to figure it out. You know like smart money play us by taking our stoplosses at pivots they assume at this point retailers have put their stoploss In the same way if can figure out where these smart money will panic and cover their losses.
For the first part – yes, this is a simple assessment of premium wrt to its fair value.
2nd part – Yes, if the activity is usually high around a certain strike, and if the market tends to cross that level, then there is bound to be panic with option writers leading to panic square-offs. This is one of the main reasons to track strike-specific open interest activity.
And 1 more thing Let suppose Spot is at 17720 and at 17800 heavy call writing has been done (lets say it is monday). Now for that day or next subsequent days till weekly expiry, I want to understand or kind of predict that at which level of spot price these writers will feel pain or will face loss.
How can i understand that?
So in this case, you can consider 17800 as a price at which there will be some resistance, given that heavy activity surrounds that strike.
But, whereevr I use Option Calculator it asks for implied future price. What i want is to understand at any point of day trading, when I open option chain nd look at strike price and whatever calculation is required, to find the whether the premium of that strike price is at fair or high or low in mind , and understand. Because suppose any strike price, let it be ITM, If its premium is already at high then if market goes against my view then its premium will decay faster as compare to that ITM strike price which has premium at its fair value or below fair value. In this regard can you please help me. How can i do that.
Regards
Understood, but I quite doubt that there is a strike-specific fair value, ready reckoner available. You will have to use the B&S calculator to estimate the fair value. But please do check with Sensibull once.
At any point of time for any strike price of an underlying asset, if we have to understand whether the strike price is at premium value of it has fair value or discounted value, How can we Identify it or find it or calculate it ? Can you please explain on this?
Anupam, so one quick way is to look at any option calculator and get a sense of how the option is priced wrt to the market price.
Hi Karthik,
Thank you for the wonderful explanation 🙂
Are the best strikes to trade same for both option seller and buyer? I went through the chapter keeping the buyer in perspective, wanted to understand what would be the best strikes to trade for a seller.
Thank You
Sort of, Sai. You need to look at this P&L profile of these options like a mirror image for buyers and sellers.
Sir everything I understood but my question is ,these things are perspective from buyers, if I\’m seller ,which is the best strike to select or choose according to time to expiry
The buyer\’s and seller\’s perspectives are mirror images, Divakar.
Hi Sir,
Where do we get this profit / loss probability chart / graphs from ?
That was generated using a program.
Hi Karthik,
This post throws light on Effect of Time on buying an option. How about Effect of Time on Option selling?
Its the inverse of buying. If time decy is positive for buyer, then not so good for seller and vice versa.
Exemplary,honest & practical narration without any reservation. This kind of lectures are available in Indian colleges & universities coupled with suitable infrastructure, I am sure our students will not approach foreign universities for higher education.
Best wishes sir.
Thanks for the kind words, Chandrapalan. Happy learning 🙂
Hi Karthik Sir,
Should we consider first half and second half also in case of weekly expiry of index options?
YOu can consider writing the option on Friday for the upcoming expiry on Thursday.
Also, a doubt regarding ITM and ATM option shorting (might be the wrong chapter for this though).
As per my understanding delta of an ATM option is most sensitive to spot changes, so we should generally beware of shorting ATM options.
But, since the premium price itself of an ITM option is more sensitive to spot changes due to inherently high delta, isn\’t it riskier to short ITM options than ATM options (since the strike would move faster from OTM to ITM)?
Thanks!
Of course, for this reason, you dont short ITM. I\’ve explained this in the chapter as well.
Hi Karthik, absolutely fantastic content you have here! Just needed a small clarification regarding options selling.
So if spot price is expected to rise and IV is low, it should make sense to short put options.
Can you mention which put options would be best for these situations (OTM/ATM/ITM)?
1) Target reached within 2 days
2) Target reached in around 15 days
3) Target reached around expiry
Thanks in advance!
I\’m not very comfortable selling put options in particular, given that they can fall quite rapidly when markets fall. That said, I\’d suggest you stick to ATM or OTM options.
This is incredibly useful but I would like to know if the same logic regarding Effect of Time applies to American Style options as European Style options? Since they\’re less reliant on the expiration date… ?
Thanks!
It does, but the impact of greeks is quicker in American style expiry.
One more question – the above bar charts will be working in reverse for an option seller, right? For example, the seller of the call option will benefit from selling OTM options when the target is expected to achieve by expiry.
Yes, the option seller\’s and buyer\’s payoff are mirror images.
Hi Karthik, I have a question – if by expiry every option goes to zero, then why don\’t people sell them in the beginning of the series or in the middle of the series and keep it until expiry? if the market goes up/down, should it matter because the premium will anyways decay and the seller will benefit from it. Sounds so good to be true, I\’m definitely missing something, please help me understand this
Hi Karthik, one question – In the last chart (green bar chart for the put option), I see that when there are 10 days left to expiry, the OTM option is yielding more compared to ATM or ITM option. However, in the case of Call Option chart (blue bars), I see that when there are 10 days left, it is ATM or ITM that is more profitable. Why is put option behaving this way? Ideally, OTM put option premium should also get impacted when the target is acheived in 10 days. Could you tell me if I\’m missing something?
There is always some fear involved with selling put options, which gets backed into the premiums. Remember, panic spreads faster than greed in markets.
Does this 15 days chart work for weekly expiry of nifty and bank nifty ?
Yes, you can use it.
Heylo sir.. i really loved the insight on the strike price and the table demonstrated..can u illustrate the table for a weekly expiry in the same manner for the correct strike price for reference.
The same thing is applicable, just that the timelines get shrunk.
sir i am trying the effects of time chart on realtime market data and i made a mistake in my calculation thats why i am confused all my doubts are clear now and
thankyou soo much sir sharing this knowledge with us
Happy learning, Shubhashish 🙂
can you please explain me the calculation behind those effect of time graph on choosing strike price or i have to just learn them as they are
Which part are you stuck with? Do let me know.
sir can you please explain the effect of time with real market examples
undertaking theta and permium
Theta is the easiest greek to understand. With the passage of time, the value of options (premiums) keeps reducing. This is true more so when you get closer to expiry.
Sir, first of all thank you so much for explaining each and every thing in a simple and lucid way…so that a novice like me can understand.
Sir can you please brief How can we make same bar charts representing the profitability while shorting options? Thank You sir!
Glad you liked the content, Raj. These are generic charts applicable to both buying and selling. The exact opposite applies to people selling options.
Thanks, Karthick for this key input for buying right options. Does the same logic applied for selling options?
Yes, similar technique Arun 🙂
Hello Sir,
For proper selection of strike for a particular strategy the above charts are useful and to generate these \”P & L vs Strike chart\” I assume following should be the procedure:
1) Generate the option premium price using B & S option calculator on the expiry date
2) Calculate the P & L for each of the strike which requires spot price(already known), strike price and premium value(calculated using 1).
3) Plot the graph
But, this process may take some time. So, is there any platform where these charts are readily available on providing the required inputs?
Thank You.
Samir, you can check the Sensibull platform for this – https://sensibull.com/
Hi Kartik
Thanks for this.
I understood the graphs and the conclusions but I am wondering why the strikes are behaving in the way they are. For eg: Why does FAR OTM gives max returns when target is achieved quickly?
Could you please explain the reasoning behind all the 8 scenarios?
Nikhil, that\’s the intrinsic behavior of options. For a deeper understanding, you will have to dig into the Black & Scholes module.
Hi Sir,
How do we find that volatilty of a particular stock or index has increased or decreased. I use opstra (trading platform) sometimes to check volatility of a stock under Volatility Dashboard and it shows all F&O stock volatility with IV change. Suppose we take TCS as a example IV – 44% and Change in IV – 20%. How they got a value that change in IV is 20%.
1. Did they calculate a historical IV of last one year till 26-06-2022 and on 27-06-2022 then they looked at closing ATM IV on option chain and compare current IV with historical IV. For example I calculated a historical IV of TCS from 26-06-2021 to 26-06-2022 and it valued at 45%, on 27-06-2022 on option chain ATM IV 60%. Does this show TCS IV has increased by 15%. This is a one way to look at IV either it is increase or decrese .
2. Second way, compare yeaterday closing ATM IV with today\’s opening IV from Option Chain. Example yesterday ATM strike TCS 3200 has Average IV of both put and call at 45% ( closing IV @ 03:30 ) and today I will check TCS 3300 ATM strike IV at 55%. It means TCS IV has increased by 10%.
Which one method are they using and for own purpose which one is best way to calculate ? If there is any other way to calculate the increase or decrease in IV. Please let me know.
They are probably comparing today\’s IV with y\’day\’s IV, but I\’m not sure, please do check with them once on the methodology they are using. Both the methods you mentioned are valid, but I\’m not sure which one they are using 🙂
I agree, when volatility go up it drives the premium up for both CE and PE but I am talking about volatility with spot. When market go down volatility go up and vice- versa. Isn\’t it true? If it is true then can be assume that the volatility is expected to increase along with increase in the underlying prices. Clearly buying a call option makes sense. I got this line from above topics.
Yes, its generally true. But there are instances where volatility goes up along with the spot market.
Let us just assume that the volatility is expected to increase along with increase in the underlying prices. Clearly buying a call option makes sense. I got this information from above topics.
What I think Volatility and increase in the underlying price has a inverse relationship. When Index and Underlying go up, India VIX come down as market get a relax mood and no huge panic in the market. Can we think a positive relation between volatility and bull mode.
Ah no, an increase in volatility drives the premium up for both CE and PE.
If the spot is 5000
We are in first leg of the series, start of the month and knows that share price will reach 5200 target.
Let\’s say the 5100 strike price (out of the money) option premium is 20 (hypothetical)
My doubt is
irrespective of when the target hits, even if on expiry.
The buyer of the option will make profit of 5200-5120
Am I mistaken?
Since you said that if it moves in 25 days or by the expiry ATM, OTM all lose money. But it should be profitable upto the point where target is greater than strike + premium
If you are trading before expiry, what you make depends on the premium. More on that here – https://zerodha.com/varsity/chapter/options-m2m-and-pl/
Right Sir!
Karthik Rangappa says:
October 26, 2015 at 7:32 am
1) Increased volatility does not mean market will go down
2)Likewise decrease in volatility does not really mean that the market will increase.
However the reverse is experienced. Even today (May 31-2022) increasing volatility kept the Nifty at bay.
Nifty formed a Doji today. Whats your take,Sir? I suppose, we may see 15900 again.
So what I\’ve stated here is that increase in volatility may not necessarily always translate to a crack in the market, although most of the time it does.
Hi Karthik sir,
1) which factors cause increase in volatily?
2) How can we predict volitity is going to be increase in future?
3) For stocks, how much % do we consider as normal volatility?
1) Greed and fear
2) By observing the markets and events surrounding the markets
3) No set %, varies from stock to stock.
When we are talking about Volatility is it the implied or historic?If implied then the implied will be different for each strike also in the above example you did not mention the current volatility and the change in Volatility we are expecting.You only consider the directional view.
Guide for the same
Thanks in advance!!
Generally its implied, but it really depends on the context of the discussion.
Dear Sir, Thank-you for giving such a wonderful insights. Sir, In previous chapter it is written that If there is ample time for expiry then buy OTM option and in this chapter it is written that Buy ITM option if we are in 1st series of F&O and target expectation is for 25 days.
Generally speaking, ATM is the best for almost all situations 🙂
How do we identify when the IV is going to up or down ?
Rohit, you can consider comparing the current volatility with historical vol to get a sense of how volatility is behaving.
By regular historical range do you mean that one measured by India VIX?
You can consider the regular historical range.
Ok now things are getting really clear. One more thing and I will stop asking you silly questions 😶
I calculated Bank Nifty\’s daily volatility using past 1 year closing prices data (using that STDEV excel function). It comes out to be 1.38%. then I converted it to annualized volatility as =1.38%SQRT(252)=21.91%. Option chain is showing me IV of 33.50% annualized and historical annualized volatility is 21.91%. So I can say that current market implied volatility is higher than normal.
Is this correct way to think like this?
Yes, but that is just an approximation. In this case, I\’d even consider the IV to be in the regular historical range.
Thank you for clarification! Just one more question – When we calculate historical volatility for particular underlying, we get answer in % (like 1.38% on daily basis). And what we see in option chain is just a number for IV like 33.50 something like this. So should I consider 33.50 as 33.50% or do I need any adjustments to this figure?
Its expressed as an annual percentage, so its 33.5% per annum.
Thank you.
Happy learning!
Hi Karthik, how do I apply this to weekly expiry series and for intraday trading. Also is the IV data on NSE website real-time? Can an intraday trader depend on it before choosing a strike? Please advise.
The technique is largely the same for weekly expiry, nothing changes apart from the timeline. For intrday, this may not be fully useful.
2nd option seems better for now 😅
But I don\’t have any idea about how to do that. Can you elaborate it a little bit more please?
Lol 🙂
Calculate the historical volatility of the underlying, I\’ve explained how to in earlier chapters. Compare that to the IV of the option, which you can get from any sites (try Sensibull).
Fine!
When volatility is expected to increase, buying an option makes sense and when expected to decrease, selling makes sense. But how do I know or how do I assess whether volatility is going to increase or decrease? Is there any way I can refer to?
Please let me know!
There are two ways –
1) Develop a volatility model like ARCH, GARCH (which is very complex)
2) Look at historical volatility and look at current volatility and get a sense of where markets are going. Not the most accurate way, but works. This is what most ppl do.
Thank you!
Good luck!
Thanks again for such amazing content!
Things you discussed here are in context that we assume series is on an average 30 day long so we made two part of 15 days each as 1st half n 2nd half. Should the same be applicable to index options where expiry is weekly also?
If yes then:
1) what would be two halves?
2) what will be different target days for 1st half (like 5, 10, 15, expiry)
3) what will be different target days for 2nd half (like same day, 5, 10 to expiry)
If no then:
How it would be?
1) For weekly, you can divide as 3 + 3 days
2) Very tough to generalize since it\’s a super short expiry. I\’d suggest you look at 1,2 and 3 days and see how it goes.
3) Same as above.
Good luck!
A very happy birthday sir. May this year bring along lots of health, happiness and success for you 🙂
Thanks so much, Prashant 🙂
Hi,
I have one question regarding NSE introduced derivative contracts on S&P 500 , Dowjones . It means , we can take positions in US indices but if I check on NSE website no data has available even I contacted my broker , they haven\’t any clue about this. If I open my trading account with US stock broker . I know I can take trade in US derivatives. According to NSE we can deal in derivatives without having an account in US stock agency . Do you have any idea about this . Can I deal in US indices derivatives with NSE and having a account with indian brokers
Thats not possible to offer derivatives without underlying. Also, as per RBI\’s LRS regulation Indians are not permitted to transact in leveraged products.
Sir, can be calculate IVP own on excel
Hi ,
Can we calculate IVR and IVP own on excel or we Have to depend on third Party apps to Check IVR and IVP like quantsapp , sensibull and Many More and All Demand for Money to Check IVR and IVP .
As far as I Got Information IVR is Easy to calculate but IVP is a complex Process to calculate, still can be IVP calculate on excel own .
I don\’t know about other platforms apart from Sensibull, and I can tell you that their data is fairly accurate.
Hi,
We Know , when Demand increases , Premium price to go Up and IV tends to increase and when Supply increases IV tends to decrease . when there is positive corporate announce , it increases the demand for a particular stock , which tends to Rise in Premium and IV .
1. Can we say in bullish Market , IV has also increase . For instance , Axis Bank Rose 40 Points today and I checked IV has also increased of this particular stock .
2. On the contrary , we Say IV increase when Market Falls . As far as I Know , when Market falls Big Investors start hedging their positions by buying puts this means it increase the Demand for put which automatically increase IV of Put Side , How IV has increased for Call Side , didn\’t Get any Reason .
I Have two doubts Here …. can we Say in bullish Market IV increases at Lower Level , on the Other hand in Falling Market it increases rapidly and 2nd doubt , how does Call option IV increase when Market falls.
Generally speaking, when supply increases, prices fall, fear increases, hence the volatility increases, and the opposite happens when demand increases. Hopefully this should address both of your queries.
Hi,
The volatility is expected to go down while Nifty is expected to go up?
I have question on above statement.
Is this , when we talk about buy stock call , we want volatility to go up and when we buy nifty call we expect volatility to go down .
Nope, when you buy an option, you should expect the volatility to increase, because with the increase in volatility, so will the option premium.
Hi,
Selling put option is bit scary . Why ?
Because panic spreads fast resulting in a faster drop in prices.
Hi,
Suppose, We are Pretty Sure that IRCTC price Will increase Again. So, I am planning to Buy a Call of IRCTC but having One Doubt like we Know Theta value is on High near to expiry and I am Sure price Will Rise of IRCTC . So, should I Buy a Call or Sell a Put which One is Better and I should avoid the Taking Buy calls near to expiry even I am Sure About the price Will Rise Again.
Since the stock has dropped, volatility is on the higher side, so premiums will be expensive to buy. I\’d be comfortable selling options. Having said that, selling PUT options is a bit scary 🙂
Hi,
As we know when market will fall, volatility will increase . My question is when there is positive corporate news , it increase the buyers and spot price and we read volatility is also increased when any corporate news arrive . So, can we say in the bullish market volatility is also increases .
I hope , my question is clear
Shubhika, its not just about what happens today, market also factors in what is likely to happen t\’row right?
Hi,
I don\’t get any specific reason , why market has fallen today (20 Oct 2021).
and there are some sector that didn\’t hit like IT sector was positive during the day and Airtel was positive during the day but most of smallcap and midcap were on large hit .
On the contrary, it is also hard to find reasons to justify why the market goes up on certain days 🙂
Hi,
If I am expecting spot price will increase , on the other I compare IV with HV of this particular stock and got result that IV of this stock is high and expecting IV will cool down .
In short my expectations- Spot ⬆️ IV⬇️ .
So, should I buy the stock or sell the stock
Depends on time to expiry. If there is a lot of time, then maybe you should buy, with an expectation that delta will overpower vega. But if you are close to expiry, then I guess shorting the stock and a play on IV is better.
Hi,
We have to consider target and time of expiry before select the right strike. Suppose I am expecting BPCL will achieve the target on the same day and it wouldn\’t achieve at the end of the day . So, should take a risk for one more day either square off the position with involving the sentiments .
Should I give a leverage to the time like wait for one or more days as expecting target will achieve but my expectations is for the same day.
If you arent involving sentiments or emotions, then you will have to stick to the original plan of squaring off the trade the same day 🙂
But its easier said than done, so please treat each trade as it comes. Eventually look for a system based trade setup where you dont have to make decision based on gut feel.
Hi,
I have question regarding expectations on volatility . when we can expect volatility will increase or decease for buying a option and for selling a option .
There are some factors that impact on volatility and we will expect that volatility will increase like monetary policies , corporate news and fiscal policies .
But now days VIX of India is staying flat and no monetary policy announcement in near future . So should I more concentrate on selling of options as there is no hint or expectations and volatility will increase in near future.
Any event which has an outcome that can be adverse to markets tends to increase the volatility. If you sell options, then the expectation is that after you sell, volatility should decrease. If volatility increases after you sell, you will lose money.
Sir,
Is there any proper source(books or websites) like Varsity to understand ARCH and GARCH methods so that I can understand easily As Varsity providing clean and crispy modules.
I\’m not sure, Pavan. I think information is scattered for this.
Sir,
1.how can we know volatility is increase or decrease in coming days? is there any technique to find out?
2.In NSE website, how can I see previous days(like yesterday) implied volatity for particular stock as we can see todays implied volotility in nse option chain? Is there any link, please share.
1) There are advanced mathematical models to do that, Pavan. Look for ARCH and GARCH methods.
2) Again, you will have to use the forecast method. Alternatively, look at today\’s volatility and compare it with historical volatility to get a sense of where the volatility is headed.
Sir last question
How many days are there in this series 30 or 60 or 90 ?
If it\’s 30 then how many halfs are there?
If it\’s 60 then how many halfs are there?
If it\’s 90 then how many halfs are there?
Thanx for this modules
ROughly 30. YOu can divide into two halves, with 15 days each.
Hi sir (2 question)
1. Suppose if my target will hit 5 days (30-5=25) before expiry then which half this option would be first or second
If first half (suppose) then why there is a graph of target hit in 10 days in second half (15+10=25)
If second half then why there is a graph of target hit in 25 days in first half
2. If first half is first 15 days of a month then why tere is a graph of target hit in 25 days
And target hit on epiry which is 30 days
Rahul, think about it this way, the number of days left to expiry defines 1st half of 2nd half of the series. For example, if the series is starting today, then I have the entire series left. I can initiate a position today and expect my target to hit either in 5 days or 20 days.
Hi sir
I didn\’t understand 2 halves part of this chapter
If first half is fist 15 days of a month so why there is a graph of target hit in 25 and 30 days
And in second half why there is 5 and 10 days target hit graph are there when there is already a graph of 25 days in first half
Please reply sir I didn\’t understand this topic
Rahul, its the other way round no? I checked the chapter and its fine I guess.
Thanks Karthik. I guess no good books wrote abt options from an indian. Isnt it?. You can definitely try one
Everything I know is written here 🙂
Hi, one question other than the strategies. Can you please suggest some 2-3 good books an option trader would read must. You have mentioned about \”fooled by randomness\” in couple of places, hence i have go ahead and purchased it. I would like to have more suggestions from you
Anti Fragile by the same author is quite good, Sajith.
I can understand that sir but in graph it is written as 5 days,15 days,25days, expiry for 1st half in effect of time and
Also this mistake is seen in many other modules too pls check the graph sir(NEED CORRECTION)
Let me give this another look, Aravind.
In graph segment sir you write it as 1st
Half(first fifteen days) and in actual you write as like 30 days why it is sir?
But in 2nd half you write it like you said(second fifteen days)
1st half = first 15 days
2nd half = remaining 15 days.
Hello Sir,
How does one predict if a companies IV will increase or decrease?
You have mentioned to someone to look at the historical volatility? (where can I look this up)
How do I utilize this information?
Historical volatility has to be calculated. Have explained this in the volatility chapter.
Thank you very much!
I must say your explanations of how to to put option greeks to practical use is the only one I found online that helps. For someone without a lot of background in mathematics, statistics or financial markets, your explanations really help visualise these principles. Thanks again.
Glad to hear that, Ankit. Happy learning 🙂
One more questions, what are your thoughts on setting stop losses for option trades.
Not a bad idea 🙂
Hi Karthik,
Thanks for creating Varsity, it has been immensely helpful.
I\’m trying my hand at options these days. Could you please help with the following?
1. If a long options position turns favourable, what would be the ideal strategy to close the trade? I suspect that as we approach expiry, vega and theta will lead to drop in premium if the spot doesn\’t move much.
2. If our option strike becomes deep ITM through the course of the series, are there any liquidity risks based on your experience?
3. For a mid month series, can we apply the concepts in this chapter by doubling the time period. Eg: Trade executed in the first 30 days, target achieved in 10 days. Do you suggest only trading current month series for new option traders?
Thanks,
Ankit
1) You can choose to square off the option as and when you approach expiry and your option turns profitable. Unless you want to hold to expiry and take delivery for any particular reason
2) Yes, Deep ITM and OTM, especially for stocks can be an issue
3) Yes, you can.
sir, how can at the money call make loss, if 4% target achieved at expiry ? for example 5000rs atm call premium may be 50 rs and on expiry spot is 5200 so profit should be 5200-5000=200-50(premium)=150. Isn\’t it ?
Gunjan, volatility to has an impact on the option premium. Hence the premium may fall.
Hello Sir,
Like I said, I think the stock will slowly move up towards the end of the month.
I mean no one can predict when exactly the stock would reach said price but it would be safer to purchase ITM/ATM than OTM if I feel my time duration is longer correct??
The issue I am having is liquidity. Lets say I even purchase said ATM option, and the price rises, my option would become deep ITM and I would not be able to see it. So what could I do?
Yes, you are right on the liquidity part. Max liquidity is anyway near the ATM strike.
Hello Sir,
From your graphs you have mentioned that if I am in the first part of the series and I expect my price to come towards the end of expiry one should only take slightly itm and deep itm strikes. This is to counter act theta decay that occurs on OTM and ATM.
Now I am confused when you say one should only take ITM when there is less time.
Harmit, these are general guidelines. The premise really depends on what you expect out of the underlying movement. How bullish are you? If you are highly bullish, then maybe consider ITM or slightly OTM.
Hello Sir,
I hope you are doing well.
Lets say I think HDFC bank will reach around 1560 by mid july/late july end.
I would be looking to purchase July expiry options and from your time graphs it would make sense to purchase Slightly ITM call options.
Assuming my order goes through and I end up with 1 Lot of HDFC bank 1480 CE options July 24 (CMP is 1486).
Now most stock ITM options have low liquidity. HDFC bank slowly but steadily moves towards my target of 1560ish by mid/late july.
By this time my option is deep ITM.
I will not be able to square of my position since it is deep iTM and there is no liquidity.
What should I do about this?
How can I make directional positions like this?
Harmit, if you are bullish, and there is enough time to expiry, then maybe you should consider ATM or slightly OTM option. These strikes would be better for the trade when you have time in your favour. ITM is when you don\’t have enough time to expiry.
Awesome!!
For different stock volatility range changes, how would we know what is the normal volatility for a particular stock ?
Where can I find realized volatility?
You need to calculate this, Vikash.
Karthik, the charts for call and put are different for the same time frame , so basically if we buy (far more OTM) for target to be hit in 5 days then in put we should buy for more ITM ??
Sorry, I dint understand your query, can you share more context.
Hi Karthik, in the first half of series ( first 15 days) in the chart it shows target to be achieved in 5,15,25 and expiry.
didn\’t understand why target to be achieved in 25days when the series is for only first 15days.
I think I have understood it wrong?
A monthly series has roughly 28 days, so 25 days means the target will be achieved towards the 2nd half.
Hi. Can you let me know how is the P&L % vs strike price charts with respect to different time frames have been created/formed?
This is using the R software.
Sir, cant thank you enough for this great content on options
Happy reading, Rohan!
Dear karthik,
(All values for example purpose only)
Suppose today spot price is1000
I bought 1500PE
Next day is the expiry day and it expired on spot price 1200
As market went up i will make loss considering greeks but my spot is less than strike and IV is nonzero (Iv = strike – spot)
Will i make loss? if yes please explain
It depends on the premium you\’d have paid. The intrinsic value of the option here is 300, if you\’ve paid a premium of less than 300, then you will make a profit, else you wont.
Thank you for such a insightful content. I had just one query, how is the profit/loss to strike calculated in the chart used in the example.
That was rendered by a program, Anukool.
If l write a option the premium shold go less for me to make profit
If I buy option the premium should go high
Am I right
Sir but if I write a option and collect a premium of 100
If next day premium is 105 is it loss
Thats right, Bharath. Yes, at 105, you will make a 5 Rupee loss.
I m bearish and Nifty will fall below 14400 but on the expiry
Then I should consider ITM
14800 Put premium is 450
Market should go below 14350 so that I can make profit
2)what wrong in buying OTM
14600 is slight OTM
If Nifty goes according to my thought process
On expiry if strike is 14400
My 14600 will be transited to ITM
Slight confusing over here
Thank you
Just in case the market goes higher or stays flat then the loss on ATM is lesser compared to OTM option.
avoid selling a call option when the volatility is expected to increase
How I make losses in this case
I sold at 100 premium
When volatility increases premium increases,I can get out with profit
When you sell an option, you want the premium to go lower so that you can buy it back at a lower price.
my question here being is that as above in the chart 4 for call options in the first half of the series when we expect the target to be achieved on the expiry the ITM is the only option that makes money and the rest don\’t
but if I buy an OTM option in the first half and target is achieved on the expiry then my OTM option will be converted in ITM option its means that it will also make money(if this is correct then why the other options lose money as per the chart above)
That\’s right, the only risk being that it takes longer than expected for you target to hit, then you will lose a lot more with OTM compared to ITM.
the nifty is currently at 14650 and I am planning to buy a call of expiry on 27th May which one would be more profitable to buy the ITM, ATM or the OTM
I wish I knew the answer 🙂
Those charts were really helpful; is there any similar module with respect to weekly options.
The same holds true for weekly as well.
Hello Sir,
You mentioned that If I feel I can achieve my target by the end of the month I should generally purchase Deep ITM options that have a delta of 0.8-1.
Most of these options don\’t have much liquidity so I am unable to purchase said option. Do I buy a future instead? If I don\’t have enough money to purchases futures should I just by a few in cash and wait?
What about companies like Nam India and Pfizer. They have low liquidity in options so should I buy future instead?
Yeah, if the bet is on direction, then future is a good option.
What are the best practices while choosing strike prices to buy options when it comes to trading in Nifty\’s weekly expiry?
The same practise that you\’d take for monthly expiry options.
Hiii
Sir
Any technical analysis work in option strategy or not?
TA helps in understanding the trend, you can use the trend position trades in options.
Sir having a directional view and looking out for time to expiry are manageable but how do we have a view on volatility? The model of plotting standard deviation and comparing current IV with respect to that explained in the previous chapters isn\’t scaleable if one is looking at several stocks.
Thats right, to get a perspective on volatility, you have to look at the current IV and compare it to the historical volatility. Maybe you should check Sensibull\’s website?
Sir! Thanks a lot for your tireless efforts with regards to educating people about stock market. I\’ve a couple of queries:
1) Nifty and Bank Nifty contracts have weekly expiries as well as monthly expiries. How to decide which expiry to trade for a given situation?
2) If I have a directional view about Nifty, say it would go up, would it be prudent to buy naked call options without hedging them?
1) Decision is based on your trading style. I\’d prefer monthly in most cases
2) Yes, but if you are buying options, do keep an eye out for time to expiry and volatility. Else, if its just a directional view, you may want to buy futures.
Thanks for the learning Kathik!
How much does the demand/supply of an options contract influence its premium viz-a-viz the B&S formula?
It plays an important part, but the B&S pricing kind of acts as a guideline to trade at reasonable prices and not deviate much from it.
Thank you for such an interesting and easy to understand module. You are a remarkable person, for the efforts you have put in and the immense change these efforts can bring. My question is:-
What is a reasonable return in an options trade. And what is unreasonable. For the long term. A rough number.
These are dependent on your expectations from market 🙂
I\’d avoid a naked option trade if the trade-off is less than 10 or 15%, not worth for the risk involved.
Thanx.. I have one more questions.. stock options or index options buying, Which one is better and less risky?
In a sense, Index options are slightly better as an index is technically a basket of stocks.
Hi Karthik,
Thanx for your lessons. I have a question, is it good idea to trade monthly options as positional or swing trading basis or it only good intra day basis?
I\’d suggest swing positions, Rajanya.
Dear Sir,
Is there a link for your description of rho ?
It is shown in the introductory picture but I can\’t seem to find any text regarding it.
I\’ve skipped explaining Rho, Jamna. Thought it, won\’t impact traders, much like the other greeks.
Dear Karthik,
How exactly are we gonna know if the Volatility of several stocks/index are going to increase or not?
Do we just look at the IV on the option chain or look at VIX?
You can observe the general market. For example, market volatility is expected to increase since there is budget around the corner.
Dear Karthik,
How to place stop loss for stock options on kite, may please inform.
I\’d suggest you call the support desk for this, they will help you for this. You can also check this – https://support.zerodha.com/category/trading-and-markets/trading-faqs/general/articles/order-types-and-execution
Dear Karthik,
Please let me know if we can place stop loss for stock options on Kite. Index options, i know, but I am not able to place for stock options on Kite.
Yes, why not. Please do call the support desk, they will help you with it.
The examples have been given assuming the option expires in a month\’s time. Is the same logic to be followed for middle month ( division into 45 days each) and far month (division into 60 days each)?
Thats right.
No no, I am not asking of Writing PE. I asked if Nifty goes down then which is better Writing CE option or buying PE option?
Thanks Karthik,
With the help of this module, I was able to make my first little profit today 🙂
Congrats Raghav! Wishing you all the very best with trading, hope your profits roll!
Hi Karthik,
In here, you said that we\’d learn about hedging with options: https://zerodha.com/varsity/chapter/hedging-futures
Can you please talk about hedging with options?
Hedging with options is a little tricky compared to hedging with futures, as there multiple factors to be taken care of. Hence I\’ve just discussed heading with futures.
Suppose, NIFTY will down tomorrow.
Nifty 14400 CE January expiry trading at 270 Rs.
Nifty 14400 PE January expiry trading at 100 Rs.
So, Call writing or buying PUT option which is better if I have limited money..?
If you have limited money, then I\’d suggest you buy the call instead of writing PE.
Thanx for your reply..
I have another question. Suppose NIFTY down on intraday basis. Is it worth to buy a PE option instead of writing a call option? Because call writing needs huge margin..
If yes, then kindly clarify the difference between writing a call option and buy a Put option..
The decision to buy or sell an option depends on the premium it is trading at, Rajiv.
No No, I asked which expiry I choose in 2nd half of the month?? Either monthly expiry or next month\’s 1st weekly expiry or anything else?
Monthly expiry, Rajiv.
Okk..
And for 2nd half of the month, which expiry is best?
ATM in my opinion 🙂
So, for safe trading purpose I have to choose monthly expiry irrespective of 1st or 2nd half of the month?
1st-month expiry is the best.
Karthik,
If I\’m trading Intraday in Options, in the first week, then which one would be more profitable? ATM or OTM?
I\’m doing ATM now because the Delta and Gamma works in my favor. Or would I be better off with ITM/OTM?
OTM is also fine Raghav.
Hi Karthik,
First of all thanx for your modules. I have a case study on today\’s session i.e 15/01/2021 :
Today Nifty closed at: 14433; weekly expiry will on 21/01/21 and monthly expiry on 28th of Jan. I am a safe trader. I guess Nifty will cross 14600 on 18/01 or in the next day. If I want to intra day trade which expiry I will choose, Ist one or 2nd one and also which strike price??
You are better off with the monthly expiry, Ravij.
Dear Karthik Sir,
Lets say nifty is at 14600.
I am able to sell 1 lot deep OTM call option of 14950 from the Nifty Jan 28 expiry option chain.
Now nifty drops to 14350.
The 14950 option disappears from the option chain.
Does that mean my option strikeprice has been removed to prevent new entries? This would also hamper the volume of that option right?
What should i do?
No, not at all. Once a contract is issued, it stays till the expiry.
Hello Sir,
This is really great content! Thank you!
Can you explain in more detail as to how the charts are drawn to select the strike prices. I understand that due to theta the OTM options loose value if we are expecting the stock/index to make the move over say 15day period. I wanted to know if I can more quantitatively plot the graph and select an accurate strike price.
These are derived out of B&S calcuator.
Hi Sir, there is any possibility of introducing weekly options in stocks in near future?
No idea depends on the exchange Sai.
Hello Mr. Karthik,
Thanks for another extraordinary chapter.
How do I intrepret the same rules/strategies with respect to weekly options ? Please guide me through this.
Everything remains the same, Tharun.
Hi Karthik
Need to understand the concept of ATM, OTM selection wrt to time in expiry bit more in detail. What is the logic behind the selection of OTM when we expect a moderate increase within in 5 days of option which is bought at the beginning of the series? I understand the data shows payoff in various cases. What I wish to know is the logic behind this movement.
The theta decay at the start of the series is lower for options, hence the OTM options result as a better choice. The key, however, is the fact that the underlying will move within 5 days.
Thanks Karthik,
Could you kindly elaborate the for option buying table in terms of weekly expiry.
Also in weekly expiry do we need to apply same table with using upcoming / next week expiry strikes..
The same principals apply, it is just that you have to shrink the timelines from monthly to weekly.
okay now it\’s crystal clear to me , thank you one again
Good luck, Vinay!
i need help once more sir , it is related to the payoff graphs , please explain to me sir why are we losing money with the otm options when trade falls into place after 15 days or 30 days( just before expiry ) as compared to the scenario in which we achieve traget within 5 days .
is it because when we take trade in the beginning of the first half of the series , the premium is high and price does move in our favour in small increments but it moves slowly and because of that the profit that you gain daily is less than the daily loss due to extrinsic value (time decay ). please clarify sir .
Vinay, this is because of the loss in time value. Remember, as and when we approach time to expiry, the value of the option keeps dropping. The thing with options greeks is that the greeks work as a pack on a continuous basis, while some greeks pull the premium up, some push the premium down. The premium eventually moves based that one greek which dominates.
Dear Karthik,
Would consider making such a thing? It would be like a cherry to a cake to your explanations of Vega and volatility.
I will, but this will take some time. I\’m currently fully involved in developing the Personal finance module 🙂
Hi Karthik,
Thanks for the quick reply.
Do you have a graph showing the difference between theta decay for ITM,ATM and OTM from start to expiry?
Hmm, I don\’t think this is available.
Hi Karthik,
Lets say I purchase an OTM and expect to hold it till expiry.
Wouldn\’t the theta decay get set off by the delta acceleration as the option moves from OTM to ITM??
How bad is the theta decay that you suggest I should purchase a more expensive ITM than an OTM even if my spot price is reaches upto my strike price.
Yes, it will offset provided the stock rallies significantly. Theta decay is high for OTM and slightly less for other options, but it does exist for all options.
Hello sir,
I am a little bit confused with this chapter.
For example, if currently Nifty is 12000 and I am expecting it to go to 12500 before expiry (in 28 days) it would make more sense to buy a 12400/12450 CE than buy a 11900 CE right? I don\’t understand why you would say it is better to buy an ITM for such a case?
Let say I am bullish about nifty for the next 3 months and expect it go to 13500 from 12000. Would I buy an ITM CE (11900) with an expiry 3 months from now or an OTM CE (13200) with an expiry 3 months from now?
Keep up the good work.
Trace, the question is by when do you expect it to go to 12500? The strike selection is also dependent on the speed at which the underlying is expected to move. If the move happens slowly over the next 28 days, then you are better off with an ITM strike. On the other hand, if the move is swift, in say 5 days, then yes, it makes sense to buy 12400CE.
The reason we are going for ITM or ATM when there are over 15 days left for the price to hit our target is on one side the theta is eating our premium because of time decay and on the other side, the low delta value of OTM won\’t help the premium to increase much! right?
Yeah, end of the day, the premium is a function of multiple greek interactions.
Does the call/put value when the target is achieved takes into account the GREEKS adjustments or is the value intrinsic?
The option is a complicated instrument, all these factors move in tandem. Its a combination greeks and IV that matters, Ankit.
Sir,
What is the best strick to sell options :
1. for intraday on expiry day.
2. for intraday at the start of the month or week(bank nifty and nifty).
Thank you for actively helping the newbies.
Thanks
-Ganesh
As a thumb rule, always stick to strikes near ATM, works for most situations 🙂
Hello sir,thanks for the great content.
i have a doubt in this chapter.
I am not able to understand that in the first bar chart top left(5 days left for expiry) how can we make money if we buy call option with 5500 as strike price.
as we were having target of 5200 and if we hit the target still we will make a loss because we bought the the strike of 5500 call option as the intrinsic value would become 0 and the premium would be lost. can you please elaborate on this.
thanks.
Since it is in the first week, there will be a bump in premium.
Sir,
What is the best strike to buy for intraday? especially in nowadays situations having the US election, China border conflict, the COVID Vaccine, and an increasing number of patience and banks seem weaker.
in short during the unpredictable direction of the market and volatile market?
Thanks
When in doubt, stick to ATM 🙂
Sir,
many thanks for caring nature.
I have read it in sequential order. I was asking about the graphs for the Shorting call and put as well similar in section \”22.3 – Effect of Time\”.
Thanks
Sure, I hope the sequencing helped 🙂
Hi Sir,
It was a mind-blowing chapter. It\’s best that you decided to reintroduce the call and put options. My thought process is total upside down from Chapters 1 to 22.
Sir, where can I find a similar graph for the \”effect of time\” on shorting calls and put options?
Loving Varsity
Thanks
-Ganesh
Happy to note that, Ganesh! The effect of time on options premium is captured by an Option Greek called, \’Theta\’. You need to study the \’Theta Decay\’ to understand this better. Explained here – https://zerodha.com/varsity/chapter/theta/ , however, I\’d suggest you go in the same order of chapters as we have listed, do not jump chapters 🙂
Good luck and happy learning 🙂
Another great chapter, indeed :). But i have couple of queries.
1) Don\’t you think it is really hard to know when the target will be achieved (in time wise). That is, through Technical Analysis we may have identified Directional view in future, but when the market will arrive at that price, nobody knows, so in that context choosing Right strike becomes difficult.
2) Keeping in mind the above point, should I be using 1 week chart or 1 month chart for Analysis instead of daily chart ?
Thank you in advance.
1) You are right, no one can time the markets. However, in most cases, if you stick to ATM or strikes around ATM, you should be covered
2) I think EOD charts are just fine.
hir sir, In one of the above comment you said \”You are covered for overnight risk in case of options\”, can you explain it.
Thanks,
That\’s because the worst possible losses are already known right i.e. to the extent of the premium paid.
Hi Karthik, thanks for the wonderful chapter,
After reading the chapter about adding delta value.
I thought instead paying high premium for deep ITM with Δ=1, I can buy more OTM contract which can add up to same Δ and with comparably less premium.
And with enough confidence I\’d bought 10 lots of put option for a scrip. 🥴 Hopefully I\’d cover them up without any loss.
Good luck 🙂
Hey Kartik,
This is an awesome article. But it would be great if you could also explain the right strike to short for call/put.
Thank for all your effort.
Bipin, I\’ve done this later in the module.
Karthik Sir, How to use the same table to understand the strategy to be adopted in case of SELLING CALL or PUT. Pl advise. Many thanks for your enriching write ups. regards
The decision to sell or buy the option depends on the volatility and the premium associated with it. Of course, you also need to look at the time to expiry as well. CLoser to expiry, avoid buying options either calls or puts.
Hello Karthik,
Dint understand. Though it is just an indicative pnl,would like to understand how the chart is plotted..which program you are talking about here?
Sorry to bother you on weekends
The program was just a B&S version on \’R\’ package. But then you have sensibull in which you can do the same.
Hi Karthik,
Thanks for the quick response.
For example if you take the first graph for 5 days to expire how the pnl is calculated for each of the different strike price?
This was rendered by a program, also if you see, this is just an indicative P&L.
Hello Karthik,
Thanks a lot for all the information which seems to be explained in best ways for such a complex subject.
Could you please explain how the profit loss versus strike price graph is plotted depending on the time for expiry? Tried but not able to understand
Regard
Deepak
Deepak, I\’m glad you liked the content. Can you please tell me which part you are stuck with? Btw, you can also use Sensibull\’s strategy wizard for this – https://web.sensibull.com/options
hello sir,
All the information int his chapter you provided are crystal clear to me to know what to buy and when.
but one thing I want to know that at what rate we should buy our targeted premium ( I might be messed up with the previous chapters information to came to the answer for this problem )
There is no straightforward answer to that. The rate that you think is ok may not be for me 🙂
Sir,
If i\’m trading intraday in nifty by buying options. is it best to stick to ATM option?
irrespective of time to expiry and volatility.
Yes, ATM is usually the safest options in the event you are not in a position to select an option.
Very precise n practical information sir …how to go about for weekly option regarding selection of strike price according to day days remaining for expiry
The same principles apply to the weekly options, just that the timelines shrink. For example, the first 2 days is considered early in the series, 3rd day as mid-series, and the remaining days as close to expiry.
Hey Karthik! Awesome man.
I want to know how should we select strike price for a call/put in a weekly expiry, as all the above discussion is with regards to monthly expiry. As most people do options in Nifty Weekly expiry .
Happy to learn your insight for a weekly expiry.
Can we generalize the best practices for buying options as you have done in monthly expiry with regard to achievement of target price from X no. of days from initiation ?
Hope you get my Query , Waiting for you response.
Thank You
The same principles apply to the weekly options, just that the timelines shrink. For example, the first 2 days is considered early in the series, 3rd day as mid-series, and the remaining days as close to expiry.
Oh,I was thinking uni dimensionally.Now I have understood.Thank you once again!
Good luck!
Hello sir,
I got another doubt as I read further.You said,
The market may move 4% but if this move is spread across 15 days, then it does not make sense holding far OTM options. However, far OTM options make money when the movement in the market is swift – for example a 4% move within 1 or say 2 days. This is when far OTM options moves smartly.
My question is how it affects if the target is achieved in 15 days?However the target is achieved and the proportional rise in premium will be there right?
I guess Theta may reduce the profitability but not bring loss when market moves up by 4% in first 15 days.Please correct me if this statement is wrong.Also please tell me the extent of theta\’s impact in last 15 days before expiry.
Roshan, options is a function of all greeks acting simultaneously. While the delta moves (direction), your option loses time value over 15 days which offsets the P&L. The extent of theta decay is given by the theta value. For example, if theta is 2, then all else equal premium will decay by 2 on a day to day basis.
Yes,got it.Thanks a lot.
Good luck!
Sorry,I still don\’t understand.Can you please exemplify how the chances of OTM going 100% up is higher than ATM or ITM.
Premiums for OTM is low, so any decent-sized movement in the underlying tends to double up the premium. I think I\’ve explained this here – https://zerodha.com/varsity/chapter/delta-part-2/
Hello sir,
I have a basic question.You concluded that
Conclusion – When we are in the 1st half of the expiry series, and you expect the target to be achieved quickly (say over few days) buy OTM options. In fact I would suggest you buy 2 or 3 strikes away from ATM and not beyond that.
My question is,\”How is OTM strike more profitable than ATM or ITM strike? Since Delta value is less for OTM whereas for ITM the Delta value is already 1 and may remain around 1 because if the spot price increases say by 4%,the ITM is going to stay ITM(deep itm)?\”
The chances of OTM going 100% up is higher compared to ITM or ATM. Hence your ROI is better with OTM in this situation. But you need to time this well, else this may not work out well.
Understood.
Thank you very much!
Good luck, Sudarshan.
Hello Sir,
Thanks for the above reply but I still did not understand why we are facing losses before the expiry.
I mean the graphs are plotted for different days to achieve the target, based on that we cannot conclude P&L right? We will have to wait till the expiry date and based on the intrinsic value we will calculate P&L.
Are we making assumptions that if the target is achieved in 5 days then our spot price on the expiry date will be more than our strike price(if we bought call options)?
Thank You
Sudarshan, thats because the premium gets traded actively. Hence the function is the premium results in a P&L. The graphs are indicative of the likely reaction of the premium for a given price move. Hope this helps, let me know if this is not clear. Will be happy to help.
Hello Sir,
In the P&L vs Strike price graph I did not understood why we were making losses.
For example I bought 5200 CE (Current spot price=5000, 1 lot) in the first half of the series if the target is achieved within 25 days then I would still be making profit right? Could you explain with some example?
If you could tell me how P&L % is calculated here then it could be more clear.
Is the P&L based on the change in premium or is it after the expiry?
Thank You
Its hard to calculate the P&L for profitable strikes before the expiry. I guess you can use https://sensibull.com/index.html for this to get an estimates P&L before expiry. After the expiry, the P&L is fairly straightforward, depends on the intrinsic value of the option.
Thank you so much!
Thank you for your response Karthik. I am aware of stop-loss orders; my question is that why would one buy options when one can buy Futures with stop loss to limit their losses? Say I have a moderately bullish outlook, I can buy a call option, or buy a futures contract (and add a stop loss since I am only moderately bullish). When would one choose to buy the call option instead of the futures contract in this case? I hope my question is clear.
Thanks!
There could be multiple reasons –
1) Margins for naked futures is quite high, but for an option spread its just a fraction
2) The premium can be really attractive making options an attractive choice
3) ROI is better
4) Leverage is better in option
5) You are covered for overnight risk in case of options
Hence traders prefer options over futures. But yes, I do get you point. If I\’m bullish, I can but futures and be done with it. Technically that serves the purpose 🙂
Hi Karthik! I have a very fundamental doubt regarding Futures and Options.
When I can place a stop-loss to limit my losses in Futures, (similar to how I know my maximum loss to be the premium I pay when buying an option) how does an option contract differ from futures? What advantages does an option contract have over a Futures contract?
Futures does not limit the losses like options. So arrest the loss, you will have to place the stoploss yourself. Do check this – https://support.zerodha.com/category/trading-and-markets/margin-leverage-and-product-and-order-types/articles/what-are-stop-loss-orders-and-how-to-use-them
hi karthik .
in this chapter u told which strike to choose for option buyer .
if someone is option seller how he choses the strike .
Hi Sir, I have checked the website of NSE and instead of three options contracts i.e near, mid and last month. There are numerous contracts, nearest is only one week away from expiry and the farthest one extends to 2023. Please explain what\’s happening here?
Also , does the above charts are valid for all those contracts or not, if yes then how should we divide the time to expiry in parts like we have done for monthly contracts.
There are weekly options too, these were introduced after the chapter was written. But nothing really changes here for weekly options.
Sir,
I think you did not understand my question. I am asking that suppose today morning NIFTY is at 9500 and I am expecting that it will gain 2 percent. At what strike price I should buy call option to get maximum return in intraday.
That still depends on the number of days to expiry. If more time to expiry, OTM works, else stick to ATM.
How to select a strike price in both put and call option if I want to square off my position same day. I mean for intraday in case of both nifty and bank nifty. If I am expecting 1 to 2 percent move.
Guess you got your move 🙂
Goto positions and click on exit, that will square off the positions.
I JUST WENT THRU THE CONTENTS AND FOUND VERY INFORMATIVE, CAN U NOT GIVE IN PDF DOWNLOADABLE FORMAT TO ZERODHA A/C HOLDERS ? SO THAT ONE CAN READ WITH EASE……
THANX N
RGDS
PDF is available on the module page, scroll to the end of the page and you will find a link to download the PDF.
Hello,
why the IV of options increases on or 1 day before expiry. All these options will go worthless on expiry. Here I can sell and keep the premium as it will go worthless but Increased IV will kill away the profit as the premium is increasing. does buying make any sense?
IV increases if there is a reason for it to go up, else why would it under the normal circumstance?
I did expect it to rally but because of high volatility, I was not confident to buy @2650 as the decrease in volatility would have been a loss in premium.
so though, the delta would have work in favor but vega would take away all my profits.
I am gaining confidence in developing a view of volatility. But taking a directional call, I mean is too risky.
Thanking you so much Karthik.
Yup, this is exactly why ppl prefer to trade volatility versus direction.
Hello Sir, first thing first, I am really sorry I had been bothering you a lot.
on 20/5/20 I took a call on Bajaj auto based on the normal distribution method and also results were good I expected it to rally.
also as the volatility was very high and I expected it to cool off with expectation to buy it later.
sold 2650PE, volatility was 156 and it did come down to 49 and it worked in my favor. also, delta worked in favor too. ITM to ATM.
Sold 2650 CE, expected volatility to cool so it did from 45 to 35 ideally it should work in my favor. premium did increase from 36 to 58 . but this is in the loss. I could understand delta is not working in my favor, what could be the other reason??
I was going short as volatility was high and it will come down. as I am 7 days away I took Slightly OTM. don\’t know what went wrong.
despite making 60k profit to I am curious hope you understand.
Thanking you is never enough Karthik
Anil, for delta to work in your favor, you need to have a strong directional view along with the volatility. From your comment, I see that you developed a view on volatility but not the direction.
thank you so much Karthik. I did take this call.
1 BUY 2100 CE
3 Sell 2100 PE
I did realize that volatility is very high when compared to historical volatility and it will cool off post result.
Bingo, my sell PE is giving more profits as the volatility is decreasing and prices are increasing. it cooled off from 116 to 76 in a day.
@mukesh, I got the greeks from B & S calculator is available on zerodha site.
today Dr. Reddy and Bajaj Auto lets do the maths!!
Good luck, Anil. Stay profitable 🙂
@Anil gupta
How did you got the
Delta
Gamma
Theta vega
Values
Bajaj Finance
*.posted good results with an increase in NII and good profit during this time along with the supportive provision
*.bajaj finance will go up 8-10 % in 5 days
*.we are in 2nd half of the series
*.go long on bajaj finance for the target of 10%
Spot 1978
Target Expectation 5 days from 19/05/2020
Best Strikes to Trade 1 strike away from ATM: slightly OTM
market lot 250
2100CE 85
IV 116.49
As IV is already high options around ATM are sensitive to spot price
Delta 0.518
Vega 1.2
Theta -8.02
Gamma 0.0011
do let me know if this is the right way to look at it or should I sell 2100PE and collect 200 premium.
Yup, this is a better way to trade a naked option. Your view on the market direction is the key input here.
Hi Karthik,
Thank you for great knowledge sharing.
Can you let me know which chapter covers put call ratio understanding.
Also above table is reference for option buyer then opposite stays valid for option sellers right?
For eg on expiry day if option seller wants to write then best strikes are either Ath or Oth.
Check this – https://zerodha.com/varsity/chapter/max-pain-pcr-ratio/
Yes, the opposite is true for sellers.
To write – it would be the OTM.
Sir,
Please one more doubt.
When i see option chain today, all the PUT strike prices have increased irrespective of ITM/ATM/OTM compared to yesterday. But for the same strikes for CALL, option prices have decreased compared to yesterday. Of course, IV has increased for both put/call when i checked. i am confused. what logic to apply to understand this pricing of call / put. Also IV for call options are 10% less compared to put options. Pl clarify.
That\’s because the market also declined right?
Sir,
Firstly appreciation for such a fantastic subject you have explained. But how can one expect future Volatility? Can you please explain?
YOu need to develop predictive models for volatility, which is a complex affair in my opinion.
Sir,
1) You have given details of which strikes to BUY (for options) considering time for expiry. Will it holds good for SELL options also ?
2) I understand that, option greek values are dynamic (i mean, changes continuously throughout the trading period). Then where to get those live values for analysis if we wish to do trading (buy/sell). I heard,some brokers are providing those data. I did\’nt find it in Zerodha. Is that info is essential before taking trade?. or general applying of rule regarding theta,delta &volatility will do ?
1) Yes it does
2) You can check Sensibull.com for this – https://sensibull.com/
Sir the above chart analyised the 30 days expiry time frame of the future &options
Sir how can we relate it to the current time frame of weekly expires.
The timeline shrinks to a week, the process of analysis remains the same.
Sir for the first point
1. I can wite put option
Is my insight correct.
Yup, you can.
We know that one needs to buy a Call Option when he/she expects the underlying asset to move higher. Fair enough, for a moment let us assume that Nifty is expected to go up by a certain percent, given this would you buy a Call option if –
The volatility is expected to go down while Nifty is expected to go up?
What would you do if the time to expiry is just 2 days away?
What would you do if the time to expiry is more than 15 days away?
Which strike would you choose to trade in the above two cases – OTM, ATM, or ITM and why would you choose the same?
After studying the option module i get the follwing answers for the above questions please correct me if i am wrong.
1. As the option premium highly dependent on volatility so if it goes down the premium will go down but since the nifty is expected to rise it will push CE Premium up so the combined effect of both the situations the premium can increase or decrease slightly, or it can remain in a range so i will choose not to buy the CE option.
2. Since the expiry is only 2 days away the CE option premium will have the least time value, so i would prefer to buy the OTM CE only if volatility is expected to rise in these 2 days otherwise i will avoid trading the option.
3.since the time to expiry is high, volatility can change, option can expire in the money so i will buy slight ITM options.
4. The answer is in the point two and three.
1) No, if Nifty is expected to go up, and vol is expected to cool off, then I\’d prefer to write option rather than buy
2) No, I\’d buy only when there is enough time to expiry
3) I\’d buy provided I have a view on both direction and volatility
4) ATM or slightly OTM
1) Depends on the combined effect of both the greeks
2) YOu need to avoid buying option so close to expiry
3) Yup
Hi karthik thanks for such wonderful explanations. I would like to know if at the initiation i bought ITP options knowing that they are very low now and can bare the losses and doesnt trade them and wait until expiry and after expiry with the intrinsic value im able to generate profits. My doubt is why would any one loose money in options when at the expiry he would get huge returns. I would buy differnt strike prices which are ITM and wait until expiry so that there are huge gains infact choose the lowest strike rate and wait which bounds to give me highest returns . why do anyone loose money in options then?
If only it was that simple 🙂
Markets at the end of the day is an ocean of different opinions, not everyone has the same idea and agenda. Btw, when you buy ITM option, you are paying a price for it which includes a premium on time, which will erode with the passage of time.
Hi Karthik, can you please explain the charts of effects of time in a bit more details wrt to theta and vega. I keep getting lost here. And these charts are used widely in option strategies as well. Or can you direct me to some link/video that explains this in detail.
Sensibull has few videos, maybe you should check them.
Ah, I see thanks
Good luck!
Hi Karthik,
I was curious as to how did you calculate the profit/loss vs strike graph in 22.3 – Effect of Time section based on time to expiry and expected move %. Can you please explain that? Brilliant tutorials btw!
Arnav, that was basically derived out of the B&S calculator!
Hi Karthik,
You frequently mentioned \”if you feel volatility is going to increase or decrease in future\”. How do one get this feeling? All i know is that you have drawn a linear curve of volatility against time to expiry where the volatility always tends to lower values as the time to expiry approaches.
The view on the increase/decrease in volatility comes from your expectation of markets. Of course, there are predictive volatility models to figure this as well. Check GARCH (1,1) models for the same.
Thank you once again for your quick response and sorry to bother you again and again. So does that means that most of the times when VIX goes up Nifty will go down but OCCASIONALLY it might be the other way round. Am I correct in saying that ?
Once again thank you very much for your patiences in answering to all my queries, appreciated !
That is right. Its not a blanket rule.
Thank you for your quick response.
Is it possible that if VIX is GOING UP, NIFTY Will also GO UP. or is it the case that every time VIX goes up, Nifty will go down. Which is true and how reliable ?
Many thanks
Thats possible, I\’ve seen it on couple of occasions.
Hi Karthik,
Hope you are doing well. Now I have a confusion which is not letting me sleep. 🙂
U said we should buy a call when we expect the volatility to increase, ok I understand this part and that\’s what I have been trying to do when I trade options.
But now my confusion has started to grow after reading little bit about India Vix ( not full knowledge which I know is very dangerous ) that\’s why I thought of asking you.
I have seen when the VIX goes up then the nifty falls down and vice versa. So, don\’t u think I should be planning to buy a put rather than buying a call. B\’coz VIX is going up means volatility is going up but the nifty is going down. I hope it makes sense to what I\’m asking.
Infact I was think in case I see VIX going up I will buy put and when I see VIX going down then I will sell call.
Also, can you please let me know what chart should I be considering and giving more importance too. Should I trade looking at VIX and not too much importance to Nifty Chart. Let\’s I see the VIX chart will go up then should I right away buy a put or should I look for a signal ( to short ) in the Nifty Chart.
VERY IMPORTANT :- Is it possible that if VIX is GOING UP, NIFTY Will also GOES UP. or is it the case that every time VIX goes up, Nifty will go down. Which is true and how reliable ?
Many thanks in advance.
Do appreciate everything that you do to support us.
If the volatility goes up (you can take ViX as a proxy), then the premium of both call and put options go up. As a general rule, an increase in volatility implies an increase in option premium and vice versa.
Traders do use ViX for taking cues on trading, but then you need to have a full understanding of ViX, else it can be a futile attempt.
You said we can buy the strick of the option WRT to the volatility index. And VIX tells about the general market movement and what if I want to concentrate on one particular stock (say ITC). How will I look for the Volatility of this option in any particular strick? How about refereing the IV given in the Option Chain table in the NSE website? And even if I see the chart each strick is having different IV value. So, my question here is, how can we come to the conclusion that one particular will move 4 to 5% in a day? Which IV value will fluctuate between 4 to 5%?
You can calculate the historical volatility of the stock and use that as a proxy. Btw, do check out Sensibull, they give out IV charts as well.
Thanks man
Really appreciate your help.
Welcome, happy reading!
Hey, please correct me if am wrong
22.3 – Effect of time
25 days of trade initiation graph, when we buy an deep otm option, we’ll lose money. Time duration is 25 days, means initially the premium is high due to time value of premium. As an effect of time decay, we’ll lose money.
The 200 point increase in the underlying asset won’t help because the delta of deep otm is very less.
But when we buy in itm, the delta value is high which will compensate the effect of time decay and provide us with high profit percentage.
Thats right, the theta is high a the start of the series and reduces as we moved ahead.
Hi. I have two queries –
1) When you say that call option should be bought when volatility is expected to increase and sold when volatility is expected to decrease, but in this case the premium is acting against the buyer and seller i.e. they would have to shell out more and receive less premium respectively.
2) Also, the chart that is presented for selecting the correct strike price – What is the rationale behind it ? I mean is this a standardized chart followed by everyone or is it subject to change ?
1) How is that, Devansh. With the increase in vol, the premiums swell, so you sell when the premium has increased and vice versa
2) No, the chart was created specifically to convey the concept
[…] 22. Re-introducing Call & Put Options […]
Sorry, I mean \’Vega\’ ?
Is the table valid for all values of \’Vega\’, or for some particular values of \’Vega\’ ?
Regards,
Rahul Mishra
Applicable even for the vega values 🙂
Dear Sir,
Referring to the table highlighting the \’Best Strikes to Trade\’, this table is valid for what values of \’Thetha\’ ? Or, is it valid for all values of \’Thetha\’ ?
Regards,
Rahul Mishra
These are generic guidelines, applicable to all thetas.
Dear Karthik.
Is there any practical advice on number of lots to buy.
If I am trading options in Nifty, is there a cap on number of lots, which you may suggest, because there must be sellers if I have to buy and vice versa.
It depends on your overall risk management strategy. Quick and dirty rule – not more than 3 or 4 lots for every 3-5 lacs of capital.
Dear Karthik,
If we cannot fix a target, and just want to gain based on directional movement, what maybe the best selection, ITM, OTM or ATM.
ATM would be the best bet.
Dear Sir
Greetings
I understood concept but fails to understand logic.
Ex. If we buys call option in 1st half & expect to achieve its target in 5 days (Your 1st Scenario)
– The effect of theta shall be minimum as there is ample time to expire.
-ITM option have maximum delta as compared to OTM or ATM.
Then ITM option shall make maximum profit due to high delta if change in premium is due to direction.
How does far OTM option makes maximum profit.
In terms of % change and return on premium than it is the OTM which gives you the maximum bang for the buck. ITM is in terms of absolute P&L.
Sir, i am little bit confused what is 1st half of series and what is 2nd half become you mentioned expiry in both and how could be 25th day in 1st half of series become it should be 14th day in each series . isn\’t it
The halves are basically dividing the number of days in the series into two bits. This is done to explain the various greeks and their impact on the option premium.
Hello Kartik,
Sorry I am writing this problem in this forum .
I experience this problem a number of times usually after 3 PM.
I have a position of bought a CE or a PE . ( I have not recently sold any options ) . When I want to square off the trade , the system rejects with a reply \” You have no funds to sell \” where is the question of funds. I am not writing this option but only squaring off the existing buy position. Today this again happened. I have taken screen shots also of four times rejection .
I have a hearing problem ,cannot discuss this on telephone – 080-40402020 . Neither I could locate your e-mail for complaints. Support panel is useless ,it has its own topics. So writing on this . Where and how do I send the complaint with screen shots. Is there something unusual at 3 PM and after that. I missed a profit of more than Rs.4000/- and I kept trying in desperation till I got it in 5th attempt
Did you have another pending order here? Please check this – https://tradingqna.com/t/doubt-on-margin-required-on-exiting-call-option-in-loss/19044 and this https://tradingqna.com/t/is-margin-required-for-normal-selling-of-call-option/31586
Really a great way to an explanation of the buy or write method duration of the expiry and good help for the beginner like me.
Thank you again.
Glad you liked it, Shashee. Happy reading 🙂
Sir, you told that in intraday we can make profit with change in premium,for example in same day i expect that stock will rise 500 to 510,can i buy any strike price i.e 600 or 650 which is otm.
This depends on the time to expiry and the strike. Far OTM options may not move much. If there is ample time to expiry, then maybe the 600CE may move slightly. However, ATM strike will move.
Hi Karthik,
I would like to thank you for your constant support to young traders and helping them to how to make a good trade and Zerodha always look into the prospective of traders welfare
I have a doubt from chapter 22 (Re-introducing put & call options) the four trade initiation bar charts, i am not able to catch the bar diagrams and how the profit % changes from 4700 to 5500 and here what is original strike price, what premium we have entered in the options
how these figures are changing in change in days could you please throw some light on these doubts please
Vamsi, thanks for the kinds words. I\’m glad you liked the contents here. The bar chart simply shows the most profitable strikes to select given the time to expiry and the speed at which the target is expected to be achieved. I\’d suggest you take a look at the charts again with this perspective.
Many thanks for prompt reply.
100 lots per order ……..is it for intraday or positional???
Is there any per day limit for no. of lot??
Yup, same for both.
What is the maximum limit for no. of lot for NIFTY – OPTIONS intraday and positional trading?
Its 100 lots per order, Rahul.
Hi Karthik,
It is now clear that, apart from time to expiry, time to achieve target is also important in determining which strikes to trade. What are some of the best ways to estimate time to achieve target? Have you covered this in some other chapter?
Regards.
That depends on the momentum of the stock 🙂
Have not covered that specifically, but this is something close – https://zerodha.com/varsity/chapter/momentum-portfolios/
Hi Karthik,
When I look at few of the option prices for some shares, I see a huge difference between call option price and put option price. For ex: I see call option price of a share is 22 Rs and put option price is 45 RS. Both are ATM options. This is like continuing if we go far from ATM. That is , 20 Rs upside call option price (OTM) is half of 20 Rs downside put option price (OTM) and so on.. I see this for 2 months now. Not just for 1 share, see for few other shares as well. 1) Any probable reasons for this.
2) Based on this, can any strategy be applied?
Thanks
Srikrishna
Thanks
Srikrishna
1) This is because of the inherent demand-supply for these options plus the effect of vega
2) Hmmm, maybe something around the put-call parity. Need to explore more.
Good morning Dear Karthikji
Actually all the above mentioned 4 graphical representation across either 1st 15 days or last 15 days with any expected up/down target LOOKS ONLY GOOD IN THEORY!! Kindly don\’t mind me, although u r million miles wiser than us, I\’m stunned that u r suggesting buying naked options. Pardon me Karthikji, I lacked daring to buy/sell any options that\’s naked. Here\’s few questions kindly correct me that if certain things really looks good in theory or can be implemented practically-
1) With Budget coming up on 5th July. We know the market on same day or even on next trading days will most likely have wild swings of at least >1%. Ok we can buy options call/put according to theory & expect volatility to increase. But in reality it\’s very very difficult to buy strikes with low volatility. After June 27th expiry from 1st day of July series there can be number of Nifty strikes which will have Implied volatility greater than normal. So even if we buy strikes, although market will swing on expected lines, but volatility will collapse & we\’ll be in loss till Budget event. The theoretical adage of buying options despite being right in directions & targets are completely negated by high IV from 1st days & here I\’m hesitate to buy options. Am I correct here regarding PRACTICAL point of view 🙂 So what should we do here according to you & how we approach as recent elections showed that implied volatility will be very high in advance on each strikes as we saw since April ?
2)Can strategy like long strangles work ?
3) Can one be really successful with naked buying? Although on last or second last day of expiry Naked Selling can be fruitful b\’coz of time passage certainty but same can\’t be done with naked buying as it has very little scope of any such certainty ?
Thanking you for giving your time for reply 🙂
Harsh, I\’m not suggesting you or anyone here buy naked options. If that was the case, I\’d not have bothered to write this entire module on spreads – https://zerodha.com/varsity/module/option-strategies/ 🙂
1) I\’d suggest you check the Infy case here – https://zerodha.com/varsity/chapter/case-studies-wrapping-it-all-up/ , helps you understand how you can play volatility
2) Long is tough, short may 🙂
3) Naked options are best only if you are absolutely sure about the direction, else its not.
For volatility to work in favor of a long call option one should time buying a call option when volatility is expected to increase and avoid buying call option when volatility is expected to decrease
HOW I WILL JUDGE WHEN VOLATILITY IS GOING TO INCREASE ?
There are 3 ways –
1) You can do this by looking at the volatility cone, explained in this module. But you will have to build this, which can be a problem
2) Assessing the historical volatility against the current volatility
3) Building volatility models which will help you predict it, but then this can get complex and not easy to build.
Hi sir, by the lessons taught by you, I got one idea, I.e. On first 15 days of series buying works fine so I\’ll buy CE or PE according to direction. But on next 15 days of series, if I found a stock to be bearish.. Instead of buying a PE.. Can I go sell a CE option with ATM or slightly OTM?? Will it work effectively or both are same??
Bala, yes this works from the theta perspective.
But Sir
Now There are Weekly expiry
Yes, but the option theory works the same.
Dear Karthik Sir,
First of all, I really thank you from the bottom of my heart for explaining nuisance of stock market in a very clear and simple manner in all modules of varsity, which is really helpful for all, specially for a beginner like me. I have gained good knowledge through varsity. My query is : In this module 5, you have explained how to chose best strike price (ITM/ATM/OTM) for call/put keeping in view of the time to expiry and target expected to be achieved. Obviously this is meant for monthly expiry. But now since weekly expiry also has been started in nifty, does this module apply to the weekly expiry also? If yes, how can we use it for weekly expiry?
Thanks for the kind words, Manoj. I\’m glad you are liking the content on Varsity. Yes, the same is applicable for weekly options as well, it is just that the timelines shrink while doing so.
Dear Karthik Sir,
Prompt reply as usual. Anyways thanks a lot sir.
One more question sir, apart from sensibul, can you suggest some other free website for virtual trading in options.
Thanks, Manoj. I\’m actually not sure about other resources online. I myself used to use excel till Sensibull came about.
Dear Karthik Sir,
First of all, I really thank you from the bottom of my heart for explaining nuisance of stock market in a very clear and simple manner in all modules of varsity, which is really helpful for all, specially for a beginner like me. I have gained good knowledge through varsity. My query is : In this module 5, you have explained how to chose best strike price (ITM/ATM/OTM) for call/put keeping in view of the time to expiry and target expected to be achieved. Obviously this is meant for monthly expiry. But now since weekly expiry also has been started in nifty, does this chart apply to the weekly expiry also?
Dear Mr.Karthik,
Why ITM buy options that are not squared off at expiry attract huge STT? As per option rules , buyer has the right and seller has obligation. Hence penalty should go to seller. This was my understanding. Could you explain?
Ah I need to double check this. But if I were to guess…technically the buyer has to sell the long position to square off. Maybe that\’s why 🙂
sorry Print mistake I write Call option at 31000 Thirty one thousand read as above question
No problem, but it works the same 🙂
I write Call option of BANKNIFTY expiry 4 th April
Call write at 3100
Lot – one
premium Received- Rs 124.15 × 20
What will be my stop loss shoud My stopploss if I expecting minimum loss
Please also give me tips How to calculate stoploss
Any price higher than 20 will lead to a loss for you. So you need to ensure your SL is 21,22…or any other price higher than 20.
If I write BANKNIFTY option 1 lot and till month expiry I did not square off my position . Then my question Is it compulsory to square off our position
Is there is any penalty
In case intraday I write BANKNIFTY is it compulsory to square off up to 3 PM at same day though I am writer
As a writer its not compulsory to square off unless you have margin issue if you are having margin shortage you have to add extra funds to your account or square off. if you are a buyer and your options is in ITM on expiration it advised to square of the positions as you will have to pay STT on your position which adds up huge.
Intraday options writing can be carried forward if you have sufficient margin, you need to convert it into normal and it will be carried if you dont have sufficient margin your broker will square off the position as he cant pay for your overnight positions.
No, as long as you have enough margins to support the position you can carry forward till expiry.
Hi Karthik,
I have few doubts on options.
1. What will happen to my option if it expires as ITM (or) Slightly ITM? For example, I bought TCS 2000CE by paying Rs/-8 as premium and it expired at 2008.50. In this case, am I supposed to pay hefty STT even for 0.50 (2008.50 – Rs/-8 premium paid) ??
2. What will happen to my shorted PE/CE options after expiry? i.e., For example, I shorted TCS 2000PE by receiving a premium of Rs/-7 and the option expired at 2020. Do I need to buy back my short position or leave it till expiry to pocket my premium ??
3. Suppose, I bought 10 lots of TCS 2000PE by paying a premium of Rs/-10 per lot i.e., assuming TCS lot size is 250 I invested Rs/-25,000. On the last day my position expired at 2006. In this case, Do I get the remaining Rs/-4 (2006 – Rs/-10 premium paid) premium or will I loose my entire 25,000 if I don\’t exercise my sell right ??
4. I tried buying 10000 (100 lots) of TCS 2000CE in a single order. But, my order got rejected. I have enough margin requirements. What might be the reason behind rejection of my order?? Is there any rule that I should Buy/Sell only limited lots of options ??
1) Yes, these options attract huge STT and you end up paying more than what you\’ve earned in profits.
2) This again depends on the STT, if the buyer decides not to exercise due to heavy STT, then you are okay as a seller. Else you will have to bear the loss.
3) The option is 6 points in the money, you paid 10, so you will lose 4
4) I think there is a cap of 100 lots per order.
I didn\’t get your second answer. I sold TCS 2000PE and the stock closed at 2020 on expiry day. I would be in profit then!!! Why would I bear the loss??
And for the fourth answer, I have read an article on moneycontrol about a options seller. He said that he trades 1 lakh lots on a good trading day. How that would be possible??
Well, if the liquidity and he sticks to the OI restriction (client wise) is then you can. Why not?
Read this to understand the position wide limits both on member and client wise – https://www.nseindia.com/products/content/derivatives/equities/position_limits.htm
I must have read that wrong, if you\’ve sold a PE, then yes, you make a profit if the option stays at the strike or goes above.
Thanks man!! 🙂
Cheers!
Sorry to ask you this but I had no option
I have sent my details and hard copies to open an account with zerodha but I read reviews on the zerodha kite app. Those were not much positive about hanging and other problems with the server. So what are steps your people have taken to make sure these problems won\’t persist again and again. And what if I had to get loss due to server problems etc.. How will I be compensated. Is it safe to start an account with you or will your people just say sorry after the losses please be positive and its just a general question. I am a bit concerned because it\’s hard earned money I am investing here.
Sudheer, I totally understand your concerns. Yes, we have had issues in the past, and we were quite vocal about it, explaining what exactly went wrong. We put in massive amount of focus, energy, and funds to ensure these things don\’t occur. In the process, we have taken ownership of several critical processes that was dependent on vendors. Despite all these measures and efforts, there are no guarantees, Sudheer. No one can assure you that..be it Zerodha, Kotak, 5Paisa…or even say Google, Amazon, or Facebook.
Having said all of that, please be rest assured that your experience with Zerodha in terms of customer service, product experience, learning, cost benefits are exponentially higher compared to any broker out there.
Thanks for that
I am a Zerodha user for nearly 6 years and active trader for nearly 3.5 years. From my experience I can tell you that Zerodha is on par with HDFC or ICICI on reliability, yes there are few problems, even last monday there was a problem for about 5 to 10 minutes. But the thing is only if you are a intraday trader or HFT( which is not advisable for new trader) or if your position size is too big you have to worry or sweat over these problems.
Anyway if you want a solution, then you can have a backup account with other brokers and park some money there so that you take a counter position incase.
Like Karthik sir mentioned you will grow as a investor or trader exponentially over the years. Markets are like hard task masters and there will always be something new to learn, being with Zerodha does really help a lot.
One more thing, you can see my name in almost all chapters pestering Karthik and Nithin(in taxation) with questions(some silly ones too). They have replied these questions with patience and passion, definitely it will rub on you. So ya, Welcome to Zerodha!!!!
Thanks for that and what\’s the latest version of kite and what about kite 4
Sudheer, its Kite 3.
Thanks for pitching in, Mani 🙂
Welcome Sir 🙂
What means by First half series and second half series
A series has roughly 30 days….so the first 15 days is the first half of the series and the last 15 days is the 2nd half of the series.
Hai thanks to you people sharing such a information and I have a doubt
Can we sell a put or call option on the day of expiry of that specific option
Example: 20SEP2018 NIFTY 10000 CALL OPTION
can we sell it on 20th sep
Yes, you can.
Hai thanks for the answer and what are the best technical indicators for analysis
I personally prefer the moving averages, Bollinger bands, and ATR.
Section 22.3 effect of time – I need help with understanding chart
\”However, the strikes that make maximum money are (far) OTM options. As we can notice from the chart, maximum money is made by 5400 and 5500 strike.\”
How is the profitability high when strike are OTM options? Is this call buyer or call seller perspective?
The percentage change in these options are highest, hence.
Hi Karthik
I would like to understand if there are any weightage assigned to change in Options premiums w.r.t Stock price Vs other factors such as time to expiry / volatility / strike price etc . What I have noticed so far is that change in premiums is primarily influenced by stock price movements & impact of other factors may be negligible . Pls. confirm if my understanding is correct .
Oh yes, Sanjeev, it does. These sensitivities are called option greeks. Suggest you read up the chapters ahead to get a perspective.
Hi Karthik
I was thinking of doing similar analysis like the one described based on time. But you have given all the info. here which is necessary to me. Grateful to you for this chapter. Thank you😊
Thanks
Srikrishna
Good luck, Srikrishna! Keep going.
More complex the things, simple is the answer. your understanding of concept is simply great, more importantly the way of presentation. long live dear
Thanks for the kind words, Santosh. Happy reading!
Please ignore (or delete) the above two posts. Have again made a small error. Apologies for all the confusion. Re-posting the correct version (hopefully)-
Hey Karthik, need your help in understanding something.
I’d sold 375 Jan Nifty 9500 PE @ 11.92 on 13th December, and then further sold 300 Jan Nifty 9500 PE @ 2.7 on 17th January, overall making it as 675 Jan Nifty PE @ 7.82. So far, so good.
That night I got a margin call from Zerodha, so I partially squared off my position the next day by buying 300 Jan Nifty 9500 PE @ 2.7, after which the position came down to 375 Jan Nifty 9500 PE sold @ 4.53. I’m unable to understand how this is possible since selling of 300 Jan Nifty 9500 @ 2.7 & buying the same quantity at same price the next day effectively cancels each other out (apart from the brokerage, taxes etc.). So, my position should have come back to it’s original price of 11.92, and not 4.53.
When I spoke to someone from Zerodha on the phone, he said that this is because options don’t follow the FIFO principle. I know this is probably out of scope for you but can you explain what does that mean? And how the avg price is 4.53 & not 11.92? Thanks!
Hey Milind,
The average price is calculated based on the principle of First In First Out (FIFO). In your case, when you sold 300 quantity of Nifty Jan 9500 PE @ 2.7, the quantities that you bought first (375 Jan Nifty 9500 PE @ 11.92 on 13th December) will be reduced. Therefore, you will be left with 1 lot @ 11.92 and 4 lots @ 2.7. Now your average price will be calculated as [(75*11.92) + (300*2.7)]/375 which will give you 4.54. You can refer to this support article for more information.
Sir u said when we expect in rise in price , we can buy call options…. How to expect?? Is there are indicators for expectations?? When to buy or sell??
For this, you will have to develop a point of view which will help you get a sense of direction. Both Technical and Fundamental Analysis helps you do this. While technical analysis is based on price action, fundamental analysis is based on how the underlying business functions.
Sir which are the technical indicators will help us to find it
I\’d suggest you rely upon the candlestick patterns as opposed to indicators.
Respected Karthiksir,
*Whole heartedly thanks for excellent coaching.*
I trade only in futures since one year on basis of my technical analysis in charating platform. I have started reading stuffs on OPTIONS TRADING very recently.
There are my basic questions.
(1) On Dt.1/11/2018 I assume that Nifty is bullish above 10200. So I decided to buy 10400 CE trading at 150. On the very next day if 10400 CE rise upto 200. At this moment can I get profit by doing square off 50*75= Rs.3750/- even if Nifty has not crossed strike of 10400??? Is it cumpolsary to get profit that underlying *MUST cross strike price*??? As per my understanding this Rs.3750/- is the difference of premiums of 15000-11250???
(2) In Same case. If due to bad effects of some external affairs Nifty started falling on next day and 10400 CE also started falling upto 100. At this moment can I book losses of Rs.3750 as we are doing in future trading??
Please clear my very basic doubts.
1) You can sell it whenever you feel like, no need to wait till expiry
2) Yes, you can book losses and exit the position.
Good luck, Sharad.
Many Many thanks for reply.
(1) My question —> Is it compulsory for underlying to cross strike price to get profit ?? In my first example can I get profit even if the underlying Nifty has not crossed strike price i.e.10400???
You are sincerely requested to solve my above mentioned query.
In presence of so many experienced traders in this forum my this kind of very basic questions are unnatural. Please forgive me.
Please make this chapter available in PDF.
Sharad, it is not necessary for the underlying to cross the strike for you to make a profit. The premium can go higher even before it crosses the strike. However, if you want to hold the contract to expire, then the strike has to cross the underlying for you to profit.
Thanks a lot Karthiksir.
Good luck, Sharad!
Karthik,
For the impact of time on options profitability, i understood the conclusions you have drawn, but i could not understand the underlying reasons for why the profitability behaves in the particular way, like in first half of series, target is expected to be achieved in 15 days, OTM options tend to lose money. Why?
Thanks,
Akshay
Well, that\’s just the way options behave. Understanding options is a completely different ball game, remember it is not a liner instrument like Futures. There are multiple factors at play wrt options, which makes it a bit complex.
I looked at option chains for different scrips and this is what i observed: Value of Theta is highest for ATM options and it decreases for both OTM and ITM options, a graph similar to volatility smile.
Should not the impact of time be equal for all the strikes? Why is it that ATM options are impacted most by time decay?
I need to validate this, Akshay. Intuitively, it appears that the theta should be constant. However, if you think about it, the ATM options are the ones which are the most reactive to greeks.
Karthik,
Keeping everything else constant, for each passing day, Intrinsic value of all options will remain constant and Time value will decrease, Infact ITM and OTM options have more chances of staying where they are and hence their theta decay should be highest. Near ATM options have higher probability of converting from ITM to OTM and vice-versa – so their premium should stay high to compensate for this risk and hence lower Theta decay – But what we observe is the reverse – ATM options have highest Theta decay.
Can you pls throw some light on it..
Thanks,
Akshay
You are right in absolute terms, Akshay. ATMs have higher time decay. However, if you look at it with respect to % change then OTMs have higher time decay.
Sir will the table change for weekly bank nifty options?
Not really, Karthik.
In the last part , a table it appears first part of series and second part of the series, i could not fallow, please explain. In both the cases 5days of initiation, expiry date and the same day reaching target, please somebody explain so i get clear picture. IN a month expiry two series both with 30 days details, I couldn\’t fallow.
The table just splits the time to expiry into two halves..the initial 15 days and the later 15 days (closer to expiry). With this in perspective, we further figure out how the option premiums and therefore the P&L behaves. Based on the P&L, we further identify which are the strikes to choose given the P&L scenario.
Hi Karthik,
Thanks a lot for such intelligent teaching with clarity on Options trading.
1- I am unable to understand from where profit loss % derived at various strike price in
5 days of trade initiation
15 days of trade initiation
25 days of trade initiation
On expiry day
2- what do mean by \’R\’
This was generated using a statistical software called \’R\’. Basically, the entire B&S model was codded into R and these results were derived.
Normally when India Vix is low (16), then market supposed to favour bulls and if vix increases then it is considered favouring bears.
However, when we spot IV of option to be overvalued by volatility come, then we would short the option.
But this contradicts vix volatility ideology, could you pls shed some light on this?
Please pardon the typos, what I mean is , when IV is undervalued we buy may buy PUT option expecting the premium to go higher if we expect the IV to increase.
But when IV is undervalued this also means that there could be potential bull control in near future, hence how can we confidently buy the PUT option
Yes, hence like I mentioned in my previous comment, do not treat VIX as a directional indicator.
Normally when India Vix is low (16), then market supposed to favour bulls and if vix increases then it is considered favouring bears —-> No Bharath, don\’t treat VIX as a directional indicator. VIX only tells you the extent of panic in the market, it does not give you a sense of direction.
Thanks for the clarification
Welcome, Bharath!
Hi Karthik,
I have a doubt after reading about greeks. Let\’s say i am long on XXX18NOV140PE paying a premium of 5. Let\’s say the CMP of XXX is 155. Now since i have taken position at the start of the expiry month, there is still long time for expiry. Assume the volatility was high when i went long, hence the premium didn\’t come cheap. Let\’s say by the time close to expiry (~30 mins before expiry) the volatility cools off and XXX stock price has indeed fallen below 140, say 133. According to the P&L i should be earning Rs 2.
Would the P&L formula still hold independent of volatility dropping and also since premium would be trading slightly low owing to STT trap.
In short, do we necessarily earn profits if the stock price moves beyond strike price +/- premium (+ when CE and – when PE) when we go long? Or can there be a case we incur loss owing to fall of volatility and STT trap resulting in premium being traded cheaply ?
I know that P&L formula holds good only on expiry. Let\’s not assume Rs 2 as a solid number. Just say i should be in a position to earn some positive value
Understood, have posted the reply for your previous query.
Vishal, upon expiry you are entitled to receive the intrensic value of the option. In the example quoted you will receive Rs.7, out of which 5 is the premium paid and 2 is the actual profit.
Yes, the STT has to be factored in. There are times when the option is ITM upon expiry, but the STT is so huge that it does not make sense (close to money options). So STT can eat into your profit.
However, volatility does not impact your P&L post expiry. Remember, Greeks, including Volatility are all factors that affect the premium during the series and not post expiry.
Only taxes are real in life 🙂
Hi Karthik,
Thanks for your reply but i have complicated the question by brining expiry into question. Please reset the query to only below
\”Do we necessarily earn profits pre-taxation (by squaring off and NOT excercising it) if the stock price moves below (strike price – premium) on Long Put or stock price has gone above (strike price + premium) on long Call? Or can there be a case we incur loss owing to fall of volatility and STT trap resulting in premium being traded cheaply ?
i.e., Is the premium guaranteed to higher than the price i took the position at after the above scenarios?\”
If the spot is above strike + premium for the call and below strike – premium for put, then there is a \’great\’ chance for you to make a profit. I\’m using the word \’great\’ simply to convey the fact that volatility/theta/major news can play spoilsport.
Thanks Karthik, that is what i wanted to know. So \”NOT necessarily\” that i will make profit due to greeks even after spot price moves beyond our target!
Learnt a lot from Varsity. Whole heartedly thanks to your wonderful teaching.
A small suggestion, in the current chapter the section \”Effect of time\” is quite difficult to remember because brain tends to reason \”WHY SO?\”, except for theta there is not much reasoning. I know internally it\’s because of Black & Scholes formula & difficult to put out in words.
Thanks for the kind words, Vishal. About the effect of time bit, let me see what else I can do 🙂
here is what I thought would be the calculation :
profitability for the i-th strike = ( expected premium of the i-th strike once the target hit – premium paid for the i-th strike) * lot size
expected premium of the i-th strike = ( absolute point difference for 4 % move ) * delta of ith strike price + (days to expiry) * theta
theta being negative for call option
Karthik, Can you suggest if the calculation is right ?
Broadly yes, but there are other variables as well. Like the vega and theta. You have to assume one of it is a constant while changing the others to estimate the P&L.
thanks a lot, Karthik.
Hi Karthik ,
First of all , thanks for a great article. I just had one question. How did you calculate the profitability diagrams for different strike prices with target hit ? Is it the delta*chg in price – theta for the time to expiry ?
Thanks, Soumya. This was programmed in R, keeping the Black and Scholes model in perspective.
Sir,
If I have purchased 15 Lots of Nifty and paid Margin for it, what is the best time and Rate to hedge the position via buy a Put Option, I am Long term bullish on the market but want to hedge the position due to political uncertainty.
1. At the money ; 1st day of present series
2. At the money ; within 1st week of series
3. At the Money ; always midday of series
4. In the Money ; 1st day of present series
5. In the Money ; within 1st week of series
6. In the Money ; always midday of series
7. 1 strike Out of the Money ; 1st day
8. 1 strike Out of the Money ; within week
9. 1 strike out of the Money ; midday
Same 9-9 possibilities for near month and far month illiquid options
Thanks
Kindly give answer in detail for my problem and oblige
Darshan
The timing is really dependent on the way you understand the markets. Remember this, the delta of futures is 1. Since you have 15 lots, you are long 15 deltas on futures, hence you need to short 15 delta in the options as well, to ensure you are delta neutral.
If you short an ATM option whose delta is 0.5, then you will have to short at least, 30 lots of Nifty ATM options. The problem, however, is that you will have to continuously tweak you position to ensure you are delta neutral.
Sir,
Thanks for your reply, as per my knowledge and feeling 10th-12th day of series is best Rate for Insurance and one strike out of money is best for delta neutral, if you have any Stretdgy to hedge my position, kindly oblige.
Darshan
Hmm, you need to backtest this or at least paper trade this for few expiries before actually taking the strategy live in the market.
Hi Karthik, thanks a lot for the awesome material on Options trading
Is it possible to share the excel file you have used for the calculation of the bar charts (profit loss % vs. strike price)?
Charan, that was the output from an R program, not an excel.
Okay, is it possible to share the logic behind the calculation?
Its explained in the chapter itself.
Karthik,
how can i square off the option before expiry. Also does options have M2M. Can you explain how exchange transfer money between market participants in option trading.
You can square of the position, anytime you wish. No need to wait till expiry. There is no M2M in options.
So you make profit from the change in premiums.. right?
And you do it by selling or buying premium.
Whether the P&L calculation will be same while squaring off before expiry?
Yes, irrespective of a long or a short trade, your P&L is dependent on the change in premium.
Hey karthik
truly appreciate your work. Amazing.
just a quick question – how did you derive the P/L (graphs) considering the strike prices (buying options)? any formulas?
sorry, if i have missed behind.
thanks
The P&L graphs upon expiry is done via excel. The rest via R software.
Your efforts making people understanding market are priceless !!!
Thanks, Arun. Happy learning 🙂
Your hard work should really be appreciated
Happy learning!
Hi Karthik,
Thanks for such a valuable lesson.
I have a doubt – You have shown how to choose strike for call/put options if we want to buy them either at the start of the series or at the second half. However, what if we want to write them. Does the same strike will be applicable for writing also given that all the scenarios are the same?
Ex- In scenario 1, you suggested that to buy OTM which is 2-3 strikes away from ATM options, so the same OTM can be selected to write if I think that the underlying would go down by 4% in next 5 days?
Thanks,
Gaurav
For writing options, I\’d suggest you take the normal distribution method. Basically, identify the range and associated probability and take a call on which option to write. I think this is a fairly decent approach to write option.
Thanks Karthik,
So basically, these scenarios are good to go when they are combined with price action strategies or breakouts right?
For writing we can follow normal distribution technique.
Yup, this is what I believe is the right approach to write options.
Which strike should I select for intraday option writing ?? Is there any thumb rule in terms of delta and theta ??
Stick to ATM if its intraday.
Hello there,
I am not getting what \”2-3 strikes away\” means, though I know what striking price is. Can you please help?
It is with reference to the ATM strike. So 2 strikes away mean ATM + 2 strike.
Hi Karthik,
Thanks for being such an amazing person.
I have started trading options very recently with 10k capital in hand and with that limited money, I have been able to trade in NIFTY and Bank Nifty only.
I trade solely based on EMA, RSI and MACD. The help I want from you is suggest me either equity scrips or indices which I can trade using 10k capital and which are not highly operator driven.
God bless you!
Gerry, I\’d suggest you stick to the indices. It\’s the best when you are starting off.
Hi Karthik,
Tell me if this strategy will work-
1. Next day Expiry-
Today say Bank Nifty or any underlying closes at 26000 and tomorrow is the expiry. I see 25500\’s Greeks on Zerodha BS calculator and it shows premium as 104.5
I predict that on expiry BNF will stay above 25500 and will be in the money at expiry.
25500 opens at 107,
a. That means people are paying ₹3 more over and above the fair premium right?
b. Given the price stays over 25500 till say 2PM, isn\’t it obvious that the premium will be over 104.5 which the Greek calculator has said Yesterday given it\’s expiring ITM?
1) Yes, and this is also a function of market\’s demand and supply.
2) Technically, the premium will be very close to the intrinsic value (considering its expiry day). So the 25500 CE strike will be trading at 500 given the spot is at 26000.
1. For point 2- you mean the 104.5 premium which the calculator gave applies only when the spot is 26,000 at expiry because while giving input to the calculator, I used spot 26,000.
2. Now if I think spot will be 25750, I should input spot as 25750, strike as 25500, expiring tomorrow (Thursday) and then the premium comes to say 99.8.
Today on Wednesday premium is say 110, but the calculator using my predictive close of 25750 said 99.8 for Thursday, then it\’s not a good deal for me given I\’m assuming my prediction will go right.
3. Basically, I\’m trying to get better at price prediction of underlying and not focus on premiums only cos if my prediction is right w.r.t. the underlying and I enter below black scholes Intrinsic premium, then I will definitely earn, right?
1) No, the calculator takes in all the variables you\’d feed in a throw out an answer
2) Input the details as in. Read this for more details – https://zerodha.com/z-connect/queries/stock-and-fo-queries/option-greeks/how-to-use-the-option-calculator
Hi Karthik,
Here\’s my understanding of the first example you gave.
The 5500CE purchased in the first half of the month is most profitable if the target is achieved within 5 days. However, this is a deep OTM Option. Hence the delta would be non-zero (if there is high volatility), but substantially lower than that of the OTM option (linear Delta curve). But, the deep OTM 5500 trades at lower prices than OTM (5300). Even though absolute change is higher for OTM (higher delta), % change for Deep OTM surpasses that of OTM.
Based on the above reasoning, the higher gain for deep OTM is only attributable to the high volatility of the stock, as without it, the delta value would be zero for deep OTM, and there would be no Vega effect on Premium either.
Is this conclusion valid?
I\’d agree with you on this. You need also need to pay attention to the fact that the target is achieved within 5 days of trade taken (especially in the backdrop of more time to expiry). The speed of the market is also very crucial here.
Yes, and the speed of the change is the reason for the high volatility right- %change per day would be high over those 5 days?
Hmmm, the speed of change usually refers back to the directional movement of the stock. A stock can be volatile, but essentially stay put in the same price range.
Hi Karthik..its great to write to you again after a long time..my question is regarding strike price selection
say for eg.. banknifty spot is at 26000..i have identified 26000 as a support zone doing some analysis.. and i think that price is going to go up soon..also, in the 30mins chart the previous swing high is at 26900. so 26900 is the resistance, hence for this i would buy calls with strike of say 26700..my idea behind this strike price selection is since 26700 call is now OTM, as the price starts to move from 26000 upwards 26700CE will soon rise in value and may even become ITM (considering I have enough time for expiry)..however, i did not make use of any greeks here..my entire strike selection was based on guessing levels which price is likely to penetrate by using technical analysis..what do you think of such a way to select strikes?
Frankly, there is nothing wrong here, it is just that being aware of Greeks helps you calibrate your trades better. However, here is a suggestion – when selecting strikes based on any non-greek based approach, I\’d suggest you stick to ITM options.
Hi Karthik,
Nice information on varsity. Really useful for beginners like me. Consider bank nifty expiry week starts on friday and expires on thursday.
1) What should be the difference (spread ) in call ratio back spread to incurr minimum losses.
2) when we should take position for bank nifty in call ratio back spread ? At the expiry of current week for next week ? Or on Friday morning at the time of opening of banknifty expiry week ?
1) I\’d suggest you stick to the classic spread 2:1
2) Ideally, this depends on the situation but yeah, I\’d prefer Friday.
Wow, what a great explanation…. Thank you so much Karthik
Welcome!
Dear Sir,
Can we use the same methodology of strike selection (Nifty -monthly contract) for bank nifty weekly contract also? by considering 1st 15 days as first 3 days.
Thanks.
Regards
S.Lawrence
Yes, you can extend this to Bank Nifty as well.
Sir,
I bought put call of TCS i,e TCS 18MAY3200PE and strike price was 3400 (I think this may be far away from ATM) on dt: 23.04.2018 and noticed that price is moving down ( 25 points fall on the next day) as I expected i.e in my favor. But premium found loosing from 30 to 27.80 i.e 2.20 point down which in term showing loss of Rs 550/- instead of gaining something, i hope, requested you kindly let me know logic behind it please.
Pradeep, this is because the volatility had shot up (remember TCS results were due) and as volatility cooled off, the options reacted. Suggest you read the section on Vega in this module.
Hi
Suppose in first half of series I buy deep OTM CE option with target expectations of 5 days. But instead of 5 days my strike is achieved in 15 days . Why would I lose money then?
I am not able to understand that. Afterall I have achieved my OTM target before expiry .
PS: I don\’t know it\’s relevant questions or not . I hope I am putting it in right way
You may not lose money, but you may make lesser profits.
is it better for a beginner in options trading to trade usdinr options since the capital required for buying options is very less compared to equity/index options and usdinr options have good liquidity as well? What are the things that one should be careful about so that there is no unseen trap (like the STT trap which previously equity options traders faced) when I start to trade in usdinr options?
Is there any calculator/model/method etc. which can help me know about the possible future price of an option contract if I have the current stock price (underlyings value), days to expiry, volatility information, expected future price of the stock?
You can try variants of the B&S calculator for this. By the way, if the expected future price of the stock (on the day of expiry) is known, then the option price will be equivalent to the intrinsic value.
Hi Karthik, Could you please share the excel sheet to generate the P&L graphs at various strike prices as illustrated? Thank you in advance.
Hmm, I afraid I\’ve lost these excels. However, you can take a look the Excel sheets in this module (all chapters have one) – https://zerodha.com/varsity/module/option-strategies/ and use them. It kind of covers whats being discussed here.
Guruji,
The observation is due to back trsting as suggested by you. This was weekly credit strategy when volatility is high.
Dfferent strategy at play (buying call / put) near and at expiry on bank nifty derived after combination of various theories viz.Price action, Square of 9, Elliot waves and Ichimoku which gives stop loss, entry and exit levels of indicies plus moving averages and MACD on 5 / 15 minute chart with robust risk management and strict discipline in place. Just shared my thoughts with you.
Thanks and Regards,
Arijit
Great! Hope success (and profit) rolls your way 🙂
Guruji,
Excellent stuff. If possible, please post table of Position Initiation Target Expectation Best Strike To Trade for banknifty weekly options.
Have you heard of Ed Raman Support and Resistance …sorry for posting this query…
If yes, please let me know.
Thanks and Regards,
Arijit
Will check on the Bank Nifty weekly contracts, Arjijit.
No, I\’ve not heard of Ed Raman\’s S&R. Let us know if there is any interesting information on that. Eager to learn.
Guruji,
It is available as a tool in Optuma but no details given how it is calculated by them nor in the Net.
Observation about weekly bank nifty charts shared for information.
Weekly swing of bank nifty is about 3% viz. 750 to 800 points
Short Strangle on next week bank nifty , at strike prices higher/lower than swing band at thursday.friday, gives return between 2 to 3 % , when volatility is high.
Thanks and Regards,
Arijit
Thanks for sharing your observations. That seems very possible, Arijit. But you need to ensure you are aware of the monetary policy announcement. Bank Nifty can swing wildly around these days. Good luck and stay profitable 🙂
Okay, I have come across the charts of IndusInd bank on daily time frame.
1) Bearish Marubuzo
2) Increase in Volumes
3) Key Support level (now resistance) 1600 was breached, so conciding with 4% stoploss as the high of the candle was 1634.
Now, hypothetically I want to go short on this via put options. Please explain me how to set up. I have understood that strike price should be selected according to the trade initiation and expected time period to achieve the target but still I am not able to predict whether the volatility would increase or decrease. (Let me try and put up questions in consequence and clarity.)
Q1) I have thought to short IndusInd Bank based on technical analysis and getting to know about current NPA situations across the banking sector. So is this mind set logical?
Q2) Lets say, I choose the March, 2018 expiry and there is plenty of time left. The target of Rs 1530 at spot market is expected to be achieved in 5-7 days. Therefore, I would choose far OTM (may be 2-3 strikes away from ATM.) ATM=1600 so I would want to go with PE option at Strike Rs 1560. We should use historical volatility to place a stop loss. I just guesstimated the time period for target. (Please let me know how you would have estimated the time period) *Am I correct with choosing strike price?*
Q3) The Implied volitility is 27.74% for the strike I have chosen. Now, how to forecast whether the volatility would increase or not? Keep aside the statistical model and tell me how do you sense the general perception of volatility keeping our example in mind. [Well, I have also asked for GARCH (1,1) model too.]
Q4) I used the Zerodha calculator of Black & Scholes Option Pricing Formula and got Put option (1560 Rs) premium to be Rs 27 and while checking the option chain on NSE website, the premium for the same strike was Rs 31.80. How do you infer this difference? Should we place order at Rs 27?
[Imp Question] Q5) I saw VIX index and there was a fall in volatility. So, how to take that into consideration?
I know I seem to be too confused and I have read the chapters twice but still I am quiet stuck with volatility part. If you could answer my questions in consequence, that would be great. Thank a ton 🙂
1) Yes, because you have developed a point of view here
2) If you expect the move to happen over 5-7 days then going for 1560 makes sense. However, timing the market is hard, hence I find saftey in ATM options. Yes, you can use historical vol to place SL
3) If you expect the stock to fall, then vol will increase
4) Yes, as 27 seems to be the fair price.
5) ViX is best approximation for the Index not for individual stocks
Good luck!
Amazing. I got the gist of it. Basically, during the consolidation phase, the volatility drops and when you expect a move in either direction, the volatility tends to increase? So if we are expecting a move then we should Long options.
But it would be opposite when there is a key announcement or news in near future. Till that time the volatility would increase because of uncertainty and the the dust gets settled down leading to drop in volatility?
Isn\’t both of the above things contradictory?
Yes, that is true. With respect to the contradiction you are referring to – thumb rule is – high vol (and you expect it to go down), look for selling options, low vol (and you expect it to increase) then look at buying options.
Lets keep aside any mathematical model and I want to try and understand the rationale behind the volatility. For example: Lets consider recent PNB case. The volatility has decreased in the last two trading session. But, news can come up at anytime. So, discard the directions, can this be considered an opportunity to buy options (call or put)?
Hmm, I don\’t think the volatility has really reduced. To assess this, you need to look at the current vol and compare it to the historical vol. Anyway, on another note, I\’d be wary of buying options so close to expiry.
I think I need to develop a mindset and understand various cause-effect relationship. However, I would urge you to describe any other mechanism which can help us forecast volatility as I couldn\’t find GARCH (1,1) volatility.
Also, the greek calculator at Zerodha gives output of call and put option premium. So, according to the calculations that should be the ideal premium one should pay? I didn\’t understand it.
Garch (1,1) is a quant heavy topic, Rinkesh. Let me see if I can break this down into smaller bits and put this across. I\’ll need time for this. Yes, B&S calculator gives you a fair price also called the theoretical price.
How does one predict that the volatility will go up or down?
Models such as GARCH(1,1) helps in predicting the volatility.
I tried many sources but learning GARCH (1,1) model seems tricky. Could you share any simplied source?
It is indeed a complex topic, Rinkesh. Let me look through few sites/articles.
Hi Karthik,
As usual excellent explanations. I have a question about how one decides whether a target is reached within 5,15 or 25 days. I know that we can set our targets using Support and Resistance lines but how to arrive at the timeline for such a trade?
Thanks in advance!
Hmm, this will be a tough call and not an easy one to predict. You can only make a generic guess on the timeline involved in achieving the target, but no logic based conclusions.
Dear Sir, Please refer the last sentence in 22.3 \” the best practice for buying options differs with last column of the table where as it mentioned for trade
Is it same for buying and selling the options.
I.e 1st half of the series and the result is expected in 5 days from the initiation, the best strike to trade is far OTM is it holds good for both buying and selling.
Regards
The table stands good only for buying Call and Put options and not for short-selling(writing) an option contract
Thanks for your clarification. So what are the best possible strikes for writing.
The way you bifurcated one month option contract into 15 day i.e. the effect of time on premium .
Can you tell me the effect of time in premium in case on Bank nifty as the option contract are for one week (as per my knowledge. I am new to all this stuff correct me if I am wrong).
That would be too short-term a trade to classify options. I\’d suggest you stick to ATM for all trade types.
margin money is like a loan or a debt. isn\’t it? so am i liable to pay the extra money that i borrowed as margin money for intraday trade that enhanced my profit??
Sort of yes, but this is a standard feature offered by most brokers and no one really charges for it.
i am actually new to trading and when i received a mail from NSE at the day\’s end of stocks bought and sold and it showed that i actually traded in lakhs when i just had 5000 in my account, that really got me scared.
Yes, that would be the total value of the transaction. Thanks to leverage 🙂
Sirs,
I am Rajan A.T.
After going through this chapter on \” Reintroducing Call & Put option, Kindly clear my following doubts.
a) How is a Call option is different from a Put option for a same strike rate? for example How the ATM of today ( 16-01-2018 ) 10700 CE is different from the 10700 PE ?
b) How ITM shift from left to right after ATM ie the light yellow back ground
If the answer is of long stretch kindly give me a link to this answer.
I have read this module no 5 two times . I could not get the answer for my above question.
Please allow me to give an example of some what same to compare.
Take chart of a Railway Time Table (RTT. in short) . This is a common chart familiar to almost maximum number of people.
Let us compare both charts. The Railway Time Table (RTT. in short) and the Nifty Option Chain (NOC. in short)
1 The central Strike Price column in the Nifty Option Chain (NOC) can be compared to the Train No and train name column of the Railway Time Table (RTT).
2. The left side of the strike price column in NOC is Call option and its details . same way
left side of RTT is UP direction of the trains and details of stations on the route and arrival & departure time of those stations.
3 The right side of the strike price column in NOC is Put option and its details . same way right
side of RTT is DOWN direction of the trains and details of stations on the route and arrival & departure time of those station.
Kindly compare like this and make it very simple to understand.
Considering the effort & time the full team of people have invested to prepare such a beautiful and versatile book, these type of comparison charts will go a long way. SORRY for taking your valuable time.
Regards
Rajan A. T.
1) The basic difference is in terms of the directional opinion – you make money on call when the stock price goes up and you make money on a PUT when the stock price goes down
2) This depends on the option type (calls and Puts). I\’d suggest you read the chapter on Moneyness of option to understand this better.
The RTT example is nice, unfortunately, I\’ve not traveled much, hence not too familiar with the railway chart. But appreciate your inputs. Thanks.
how it is affecte to P&L ;
1) X share trading at 100(spot price). i know share will be up 20 points(i.e.120) within 25 days. i bought CE option with slightly ITM (first half of expiry). but market react early and target achieved within 5 days. how affected to p&L as well as any other point that should be keep in mind ?
2) which Moneyness for call option i have to choose when i only know X share have upward moves from current level ? May be 1st or 2nd half of the series.
3) what is the thought behind buying/selling of next months expiry ? or better to not jump at initial level.
1) In this case, the options premium will go much higher than the value predicted by delta. This is because of ample time value.
2) If you have sufficient time, then opt for slightly OTM option, else opt for ATM option.
3) Liquidity could be an issue with next month options, I\’d suggest you stick to the current month options.
Good luck.
It\’s very good. the contents are so elaborative, I am good to read this. I shall apply it to real trades.
Good luck and happy learning, Rajiv!
Guruji,
Your pedagogy is excellent and reflects what you have gone through to arrive at level of excellence !
————————————————————————————————————————————————
You get compute geeks from option table.
There should be formula with which one calculate the premium (by Black Scholes) for forecast index.
Hope the above is clear.
Thanks and Regards,
Arijit
Ah, I get it. This may not very intuitive since both the premium and the index movement (delta) are co-dependent. So you will end up in some sort of a circular loop when trying to do this. Anyway, let me give it more thought. Thanks.
Dear Sir,
If we know the target is expected on expiry day, it is suggested to buy ITM strike option during the first half of series.
1. which ITM strike option to buy? Slightly ITM or ITM?
2. If we buy ITM option and there is no price movement in the underlying, would the premium erode due to Theta value and lose money? what happens to premium in this case?
1) Slightly ITM or ATM
2) Yes, premium would erode.
Hey! Since volatility increases when an important announcement is coming up, and increase in volatility is directly proportional to increase in premium, so irrespective of the result of the company, it would always make sense to buy a call option around 1-3 days before? If true, then what would be the appropriate strike price for this?
Volatility tends to increase, does not always increase! However, if it does, I would be comfortable buying slightly OTM, assuming there is at least 5- 8 trading sessions before expiry.
Dear sir,
This chapter is highly confusing!
If your target is achieved in 5 days do u square off at that point or continue till expiry? You target at the profit in premium or profit at the end in the strike price?
If the target is achieved, then you got to get out the trade. Why wait till expiry?
What standard checklist, pattern and indicators do you strongly use on a daily basis for intra day or 2-3 days type of trades while trading the \”Nifty 50 Index Option\”?
Whatever I\’ve mentioned in this chapter. I avoid buying options close to expiries and buying when volatility is high.
Hi Karthik,
Great learning from you. I just wanted to know how will you choose strikes in case I want to short options. This is because I have a portfolio and would like to hedge it and collect premiums. Do we still select strikes in the same manner as we do while buying options? Also, is it a good idea to short both call and put options to hedge each other out?
Regards,
Gaurav.
You are a True Teacher!.. Who Knows what the students expect …
We wanted this kind of Summary and reinforcement of complex Options in one single chapter!
Happy learning, Ravi!
Guruji,
Thanks for your prompt reply and the suggestion for backtesting. Will confirm my theory with sample from 01/01/17 should suffice.
Do you know or where can I find Black Scholes formular to predict the premium based on predicted index if I know all the geeks and implied volatility?
Thanks and Regards,
Arijit
I\’d suggest you take more data points, at least for the last 2 years. Check this – https://zerodha.com/tools/black-scholes/
Guruji,
Thanks for the sample size …works in progress…
I require formula not calculator as I know how to calculate the geeks from options chains table but I want to calculate the future premium for a strike price for predicted future index and current geeks…
Thanks and Regards,
Arijit
Ah, expected premium? This has to be again based on how the expected change in greeks, not sure if something of this sort is available online.
Guruji,
I want to write the calculator based on the formula calculating the premium for a strike price for a range of forecast index price, based on calculated geeks from option chain table.
Please help, if possible.
Thanks and Regards,
Arijit
I\’m not sure about this, Arijit. Can you elaborate a bit more? Thanks.
Guruji,
Excellent stuff. If possible, please post table of Position Initiation Target Expectation Best Strike To Trade for banknifty weekly options.
Is it a correct strategy to buying two strike price Call / Put when banknifty did not have trend of more than 200 points and forecasting it would rise / fall ? Please do let me your views. Is there any formulae to predict the premium based on predicted index if I know all the geeks and implied volatility. Thanks and Regards, Arijit
Ah yes, that table has been pending for a while now 🙂
Any strategy requires backtesting, Arijit. Cannot make a blind statement 🙂
Why is 5th module not available for download??
NExt week.
Hello Karthik,
The above charts really get to the core of why successfully trading options remains a challenge to many retail investors as myself. That said, a chart of Theta vs Strike Price will also help in understanding the core concept, IMO. I ended up searching for the chart when I realized that time value of ITM options is less than that of ATM options, which I found quite confusing.
I\’d read on the internet that Deep ITM naked options are a relatively safe bet but the above charts along with Theta-vs-Strike-price is really driving the point home for me.
Thank you once again for this excellent material.
Happy learning, Rahul 🙂
Dear Sir,
Do you have modules on option strategies??
https://zerodha.com/varsity/module/option-strategies/
Dear Sir,
Option chain contains current month, Mid month & Far month. For example My doubt is if current month not available volume, open interest or Bis ask spread is more so I wouldn\’t take any option position. Then I drill it down find a mid month or far month options satisfied with Volume, Bid and ask spread. So if I want to select the option (ITM, ATM & OTM) how to consider or think 1st half of the series or the 2nd half of the series to initiate the trade.
In the present Indian context, you will not find this situation. Liquidity is available in the current month as opposed to mid or far month.
Can you please guide me how to trade in option from Zerodha pi/kite.
Start with this very module, Uday 🙂
How do you arrive at the 8 graphs in section 22.3 of module 5-2. These are used in module 6 also. Are these based on historical data and remain unchanged or one has to plot them for every strategy. Plz ignore if the question is too dumb.
These are used extensively through out the module. They are created busing a software called, R. It essentially captures the general behavior in which the option strikes behave wrt to time to expiry.
Thankyou Karthik ☺
Cheers!
How can I find liquid stock option contracts (with specific strikes) and be sure that I will be able to find a buyer easily if I want to sell my contract before expiry? Also, if a contract for a specific strike has had over 1000 daily volume in past month then does it indicate that in the future months also it is more likely to have good volume? in general how do I know that a particular strike of a stock option is going to attract good volumes?
You just need to scan the market to figure out where the liquidity lies. Usually, it is concentrated in few names such as – Nifty, Bank Nifty, ICICI, Infy, SBI, HDFC, RIL, TCS etc.
No, today\’s volume does not guarantee future volume.
SInce STT on exercised options is quite high and eat up profits made in ITM options, then how can traders square off contracts whose daily volume are also low? for example if you look for SBI CE strike 275 with expiry 27 apr 2017, from 27 mar till 27 april in the following link https://nseindia.com/products/content/derivatives/equities/historical_fo.htm the daily contracts traded for this option of SBI till the day of expiry is quite low. In this case will you suggest that the trader buys only one or two contracts so that he can sell it easily before expiry and he can avoid the trap of any options not getting squared off due to insufficient buyers? Second question is, you can see in the data that the open interest figures are quite high even till the date of expiry. so does this mean that lacs of contracts got exercised on their own on expiry day and the option holders ended up paying the high stt?
Yes, in fact ample liquidity is one of the key criteria for selecting stocks for intraday purpose. Its tough to find liquidity beyond 4-5 big names (ICIC, RIL, Infy TCS etc). Yes, many contracts gets exercised upon expiry. For people who dont know, they end up paying high STT.
Hello karthik sir,
I have a question i am tracking May, 2017 currency option(USDINR) for sometime
today(21 april) underlying in red but ATM and slightly Atm & OTM puts mean close to underlying price also declining not much but little bit why this happining as per my calculation volatility is normal not decreasing , and there is lot more time to expiry then no problem with theta
Then why this happening
I guess this is due to all options contains excess value to protect Seller s and as this option going to be current months the price reaching towards normal or fair range
Am i right sir pls…..correct me if neccsesory….
Maybe due to liquidity issues. Keep track of the traded prices, sometimes when liquidity is low, the option premiums misbehaves 🙂
When I see the open interest and volume data for equity options, most of the times the open interest is extremely high when compared to volume throughout the trading month. So since volume is the number of contracts traded and open interest is the number of positions that are still open, if say for example I see the NIFTY 8000 call of 25 jan 17 expiry, till the expiry date the volume was around 8403 and open interest was 95925.
1) Does this mean that after market close 87522 contracts (95925-8403) were exercised?. This seems to be the same case where most of the options are exercised for other underlyings as well. Note that this is an ITM option.
2) Doesn this indirectly mean that a lot of people are ending up losing money because there is a greater STT that is levied on exercising options? And why are people exercising instead of squaring off?
3) what will happen if I try to square off an ITM option on the day of expiry but I don’t find any buyer for my option?
1) Not exercised, but closed. Remember exercise happens only on expiry day
2) No – hard to judge the profitability based on the movement on OI/volume data
3) If there is no counter party, then you cannot square off. But upon expiry, the exchange will settle it on your behalf, although you will end up paying a huge STT for ITM option. Check this – http://zerodha.com/z-connect/queries/stock-and-fo-queries/stt-options-nse-bse-mcx-sx
While trading options is it important to look just at the volume figures for liquidity purpose or should we look into the Open interest figures as well? If yes for both, then could you tell how much is the ideal level for a contract to be liquid (volume and OI separately)? Also, I see that some call option contracts rise tremendously in value even if the underlying has fallen in value..for example on 24 march, TV18BRDCST CE of 27th apr 17 expiry, and strike of 52.5 rose by 3300% from the previous day close.. this has happened even if the underlying fell by 0.57% from previous close. Is there any way to spot such contracts and cash the gains by selling the contract soon ? 🙂
While both are important, I particularly look at volumes. Always compare today\’s volume with respect to average volumes for a particular timeframe. For example, I\’d look at today\’s volume with respect to last 10 day average.Ditto for OI. Its hard to spot such trades, but with good amount of skill and luck, you certainly can 🙂
Dear Karthik,
When back calculating IV, taking nse option prices, using BS Model and Binomial Model, IV values are differing significantly. Binomial Model, resulting lesser IV. Any explanation? Which Model is correct wrt profitability ?
Regards
I know both binominal and B&S models lead to similar premium values. However, I\’ve never tested for historical IV\’s. So I guess I wont be able to comment to this.
Thnks for reply
Cheers!
Dear Karthik,
Greetings. In Chapter 22, monthly series is divided in to 2 halves and results of the trading is explained with the help of 8+8 bar charts. Is Volatility Cone is the basis for these bar charts ? or any other thing. Request your clarification on this.
Regards
No, these charts are developed using R, basically an algorithm which suggests which is the best strike to trade for a given timeframe.
There’s a table in the end of this module, which highlights the “Best strike to trade” based on target expectation timeline and position initiation timeline. Is it applicable for all 4: Long call, short call, long put, short put.
Yes, it does.
There’s a table in the end of this module, which highlights the “Best strike to trade” based on target expectation timeline and position initiation timeline. HOW DOES THIS HELPS IN STRIKE SELECTION IN SELLING CALL/PUT. Pls suggest
Best strikes to trade – by trade I mean to say both buy and sell.
Call option of Asian paints of strike price 960 is at 1.25₹, if tomorrow Asian paints again fall much so then will this call option turns to be zero value? And if day after tomorrow Asian paints goes up then will my call option continues to rise or my contract will be end as soon as the call option value turned zero?
Yes, thats how a call option functions. However, the option price will not go to zero as it has time value.
Is there a chapter what specifically explains at which strike price an option should be bought at ?
This chapter itself helps you identify the strikes 🙂
Hi Karthik,
How to know beforehand that volatility of a particular option is going to increase ?
Is there any particular mechanism to predict this
or
should we just keep watching the option chain of the underlying to see if its volatility is increasing?
You can forecast volatility by employing volatility forecasting models like GARCH. This is a quant heavy topic and requires you to have some background in stats.
Hi Karthik, I am new here. I know of options spreads/vol trading, but I haven\’t really taken the plunge and done any real trading on a personal account. What\’s the best way to get started?
The best way would be to run the strategy would be to actually deploy it in real markets and start taking small bets 🙂
Hi Karthik
Thanks a lot for the detailed explanation; If I want to judge whether Implied volatility is moving high or low for an individual stock (in order to take a decision whether to short or long an option), how can I get the data of historical Implied Volatility ; I understand we can easily calculate historical volatility, but how to know historical IV movement ? I tried the below link, but it does not capture Implied Volatility.
https://www.nseindia.com/products/content/derivatives/equities/historical_fo.htm
This one is a bit tricky. The dirty way to do this is by comparing today\’s IV with the historical volatility and make an assessment.
Thank you Karthik
Welcome!
Excellent site to gain knowledge .Kudos to Zerodha team.
I\’d like you to validate my observation which is on Day 1 of Sep month series the Nifty spot closed at 8572 ,sep futures at 8628 and sep 8500CE at 8702 (delta would be at 0.85).Was it a good idea to buy futures and short 8500CE ? this way we could pocket premium of 8702-8628=74 points as 8500CE and futures both will converge to end at same level?
When will this strategy fail ?
Happy to know that Kamal!
September 8500 CE cannot be at 8702, I guess you are missing something, was it 87.02?
Sorry Karthik, It\’s 202 and not 8702 ..
Guessed as much 🙂
Thanks for the above clarification, Sir say if I want to opt for any one of the above option for current expiry, can I do that even on last day of expiry i.e. 25-aug. & is 3:30 pm the cut off.
On expiry day the current month contract expires…and therefore you cannot transact in that contract. However, you can buy/sell other contracts.
Hi Karthik,
Pls tell what you mean by we cannot transact on the contract on expiry day. Can we not sell when premium goes up?
On expiry day, the contract ceases to exist. However you can transact till it expires.
Hi Karthik,
please confirm,
1.) Nifty Underlying is 8629.15. If i were to take CE call buy at strike 8500, at a premium of 139.50. So at close of expiry i.e. 25-Aug, The underlying should be above 8639.50 to consider a profit. Say on end of expiry the underlying was 8650, then is it 10.50 * no. of lot, considered the profit?
2.) if i were to write a sell call option for 8800 strike at prem 5.30 and say at expiry the spot is at 8650, then i get to keep the premium of 5.30 or if multiple lots have been bought then it is 5.30*no. of lots. Is that right
Thanks in advance.
1) Nifty should be 8500 + 140 = 8640 for you to breakeven…and you make a profit over and above that. Yes, it would be 10.5*lot size.
2) Yes you will retain the premium as long as Nifty is at or below 8800.
Hi
I am struggling big time on premium profits When selling options. I completely understand above situation where full premium will be capped if the spot Prise stays above strike sold. BUT what I don\’t understand is the wild movement of premium during days where Zerodha position shows losses! (Even if spot is above strike)
E.g. – Sold Banknifty 26000PE at 115 on Friday 3:20pm (Banknifty spot 26500),
– premium on Monday morning ( before Market open) was 104
– Monday market opened 300 points down, and premium was 209… Crazy!! So instead of earning time value I ended up in loss?
Can you not only help what went wrong in this situation? And how can I learn premium movements overall from start of week to expiry + volatility shocks?
Pl help! Guide!
Dilip, at any given point there are multiple forces simultaneously influencing the option premium. While there was a time decay (theta), the fall in price (delta) had a greater impact on the option premium.
One of the better ways to retain premium is by selling out of the money options, holding to expiry, and pocketing the premium.
Taking Theta into consideration, If I sell MIS option and would like to collect premium then would it be better to sell ATM or OTM?
OTM. Also, to capture the effect of Theta, you need to holding the sold option position over multiple days.
Thank You
Welcome!
Could you hint, how Hedging can be done with the help of Options?
Is it good enough to say BUY Put Options of NIFTY for hedging – but how to determine how many contracts and what should the strike price?
Assume you have 2 lots of Future long, the delta equivalent for these two lots would be +2. To hedge this position you will need to buy puts which add up to -2. This would mean you buy 4 ATM puts.
Thanks. Should we square-off the position at any change in the moneyness or just let it expire on the day eventually?
Well, you square off when you are profitable 🙂
Hey Karthik,
Thanks for the wonderful article.
Since you have divided the time in 15 days interval but what about when we want to buy expiry which is two months away. Will the same charts/conclusions work ?
Yeah, 2 months away is still as good as \’start of the series\’ so you could stick to those guidelines.
Hello karthik ji
wonderful article, i have a question that is from todays data, arvind ltd highest OI at 330 today on call side, but as per chart it indicate that price has given a breakout and it can go back further, hows interpret it than
Seems like the market is bullish on the stock!
when volatility increase option premium also increase ..so in case of nifty volatility means implied volatility or India vix,…?
when vix going down and iv of call option increase which means there is a chance of increasing option premium… Right?
and last qusition in option greek calculator which iv we enter the volatility box call option or put option\’s IV
For Nifty you can take Vix as reference for IV. So when IV goes down, then probably its more favorable to buy options provided you also have a directional view.
IV is invariable same for both CE & PE.
what about usd inr , what is the volatility that for bs calcs?
Historical volatility can be used here.
Hi bro,
I think I have started to get a \”feel\” about what options are all about. Feels good knowing these stuff. Thank god I found out about Zerodha & Varsity 🙂
I have few queries about volatility and as I understand its like:
1) I know if there are any events then volatility shoots up.
2) I know if there is nothing special(no events) its going to stay at reference level (i.e. like you said VIX of 18).
3) Question: when exactly does VIX go down? why does volatility go down? I have few guesses like dull market due to holidays etc but I need your expert answer 🙂
Thanks Karthik bro!
Hari,
1) Before any important event, Volatility increases
2) Events are not the only thing that drives volatility…increased trading activity can also drive the volatility.
3) Typically VIX goes down when fear goes down i.e the market should go up.
Sir, You must have explained but I want to know again that how to put target and stop loss on a naked call or put option. We know only spot price movement and its probable range. Shall the target and Sl be define on spot price or option\’s premium?
Thanks
Its best of the SL is based on the spot price.
Loved the subject Re introduction to CALL – PUT options and the decision making process regarding which strikes to buy based on the time frame. I would want a similar perspective on selecting which options to write based on the above guidlines. If you feel it is too much to give the detailing as above then please give us a few guidelines n how to proceed on the same which will help us make the calculations. I am sure it wll be of great help to all members here. Thanks.
Well whatever is not worth buying maybe worth writing 🙂
Btw, did you check this chapter on Normal Distribution? – http://zerodha.com/varsity/chapter/volatility-normal-distribution/
Gives a perspective on option writing.
Loved the subject Re introduction to CALL – PUT options and the decision making process regarding which strikes to buy based on the time frame. I would want a similar perspective on selecting which options to write based on the above guidlines. If you feel it is too much to give the detailing as above then please give us a few guidelines n how to proceed on the same which will help us make the calculations. I am sure it wll be of great help to all members here. Thanks.
sir,
what is naked option ? please explain
When you buy/sell options without any hedge its called as a naked transaction. For example if I buy a cal option – its called a naked long on call option.
However something like a Bull Put Spread – http://zerodha.com/varsity/chapter/bull-put-spread/ is not a naked transaction as the trade has two legs.
Hi Karthik,
Thanks for detailed chapters. I have read your module 4 & 5.
Request you please make it available in pdf format module 5.
It is now available in the PDF format. Please do check.
Hi Karthik,
Thanks for sharing this wonderful tips.
However I have a question on settlement of options on expiry day. For example, assume I purchase Nifty 8000 put@ 15 – total qty 1000 on day before expiry. Nifty crashes on expiry day and ends at 7910. What will happen if I don\’t sell the 8000 puts that I hold? Will it be auto squared off by zerodha? If not, what damages will I have to face as penality- excess chsrges/taxes?
Thanks,
Aravind
In this case you will be in profit of 8000 – 7910 – 15 = 75. Since you have not closed the position yourself, the exchange will do the settlement on your behalf. After deducting the taxes your profit money will be credited to you account. Also, if you are in such as situation its always advisable to close the position yourself instead of letting the exchange do this…to avoid the STT burden. More on this here – http://zerodha.com/z-connect/queries/stock-and-fo-queries/stt-options-nse-bse-mcx-sx
Hi Karthik,
Thnks for lessons. I have read your module 4 & 5.
I am new to trde.
Want to know how can i identify the target and % target(here 4% up).
thnks.
One of the best ways to identify target/SL is by analyzing the S&R regions. This chapter should help – http://zerodha.com/varsity/chapter/support-resistance/
Hi Karthik,
I have a query..
As per today\’s data, Nifty 8400 CE is trading at 31.25 and 8400PE is trading at 353.15..
My view is that Nifty spot will not cross 8400 till Nov expiry..
So, what should i do.. Sell 8400 CE and collect the premiums or Buy 8400 PE and hold till expiry..
I am confused.. Can u explain why and what i should do..
Selling a Put option is scary…I would suggest you sell CE instead. Alternatively you could just follow the strategy here http://zerodha.com/varsity/chapter/volatility-applications/
What about squaring off the trade on the same day during the 1st half of the series? Which Strike should be selected?
2 strikes away from ATM should be good.
Next Chapter please
http://zerodha.com/varsity/chapter/case-studies-wrapping-it-all-up/
Next chapter please……….
It live now.
Again appreciation for your decent work , waiting for Currency and Commodity lessons.
Getting there soon 🙂
Dear karthik,if my question is irrelevant plz avoid,otherwise kindly reply,look below this is a screen shot of nifty today 9.53am,i have a doubt nifty futures October contract opening rate 8400,high rate8723.85,how this trade is possible at opening itself?except that rates 99.9% trade is in betwn 8350-8250 levels,earlier also this kind of odd trades seen in nifty..kindly clear my doubt
Quote As on Oct 26, 2015 09:53:04 IST
CNX Nifty – NIFTY
Open
8,400.00
High
8,723.85
Low
8,302.55
Ah, it must be one of those freak trades. Dont worry much about it.
Hi Zerodha, This is very help full information, thanks for sharing. I wanted to know about approx. what % people (out of total traded people ) actually make money in F&O trading? as i check on web i see very scattered info but more or less retailers most of the times (>70%) lose money badly. As an institution which does business on FO trading you should be having appropriate info.
Thanks in advance.
Ramu – all I can say is that Zerodha clients are few notches better than others 🙂
Dear Sir,
I would earnestly request you to kindly clarify the following as per my understanding from Key takeaways of this chapter that :
(1) Buy options when I expect that the volatality will increase which in otherwords market will go down due to selling pressure . For suppose , if I buy call and put options both at same strike, call will go down and put will increase. And also
(2) Sell options when I expect volatality will decrease which in other words market will go up. If I sell call and put options both when I expect volatality will decrease, both call and put option values will increase after decrease of volatality. I will be very much thankful if you can kindly advise whether my is right or wrong and if my understanding is wrong, please enlighten about my observation. I sincerely hope you will guide me with suitable reply Sir. Awaiting eagerly for your advice in the matter.Thanking you very much. With Best Regards, God Bless you Sir, R.V.N.Sastry
1) Increased volatility does not mean market will go down
2)Likewise decrease in volatility does not really mean that the market will increase
Dear Karthik,
Another Brilliant chapter….Thanks a ton!……Maybe at this point, it may also be worthwhile to revisit Open interest in context of options. i.e how to interpret the current trading range using open interest information? It is widely believed (although maybe not necessarily true) that option writers control the option markets and therefore their action can give some indication of the likely short term market direction. Therefore the ability to interpret OI and its changing dynamics in the context of options may be useful?
In fact the whole theory of \”options pain\” stems from Options + OI concept. Will be discussing this in the next module.
sir,from next month futures margins r dramatocally increased,will it lead to increased option trading (bcoz retail traders cant afford that much marginsin fut so they may shift)i may be one among,clarify
Not sure Narsimha – we need to wait and watch.
Very important info or I will say it is extract of the full module in a very practical way. Thanks a lot for that. Actually about a year back I was trying to understand the same thing by looking at historical data on NSE site and copying them to excel and doing some calculation. But was very tedious and I left in between without any success. It is nice that you gave in a perfect form.
* option shorting has been covered in earlier chapters but can it more explained the way log options are explained?
* What is high or low for volatility based on which we can judge chances of volatility movement. I mean to say if volatility is already high then its chances of going up may not be high even some trigger in near future. Market must have already considered the volatility factor.
* Is it possible that spot prices may go up but the the volatility will come down? Then what to do in options?
I think you had promised to give one case starting from the TA and /or FA to option and showing option trade taking place. Will it come in the next chapter.
Waiting eagerly for next chapter and next module.
Thanks
R P HANS
1) Is there anything specify you are looking at when shorting options? I suppose most of it has been explained.
2) For nifty Vix ard 17-18% is considered normal. You can keep this as reference value.
3) The next chapter has few case studies.
I thought option shorting also may be explained with graphs as is done for options long trade, showing pay off.
All 4 – Call long, Call short, Put long, and Put short has been explained.
Hey Karthik! Awesome man. After research on different brokers, I joined Zerodha a month back. Either I wasn\’t introduced to Varsity or I overlooked it. You guys are rocking. I was searching everywhere on internet about trading info and strategies and accidentally came across Varsity and that ended my search. Nowhere I could find all the information so compiled, thorough and simplified.
Your hard work is very much appreciated. Keep the good work going.
Waiting eagerly for next module.
Viren, thanks so much for the kind words 🙂
Please do stay tuned for more on Varsity!
Awesome. Had a few queries regarding the suitable strikes for various trades, while going through the previous chapters. This chapter cleared almost all of my queries. Thanks. 😀
Glad to know 🙂
Very good information sir.. thanks a lot and I am very curious to know ur trades..
You will get to know in the next chapter 🙂