
20.1 – Volatility Smile
We had briefly looked at inter Greek interactions in the previous chapter and how they manifest themselves on the options premium. This is an area we need to explore in more detail, as it will help us select the right strikes to trade. However before we do that we will touch upon two topics related to volatility called ‘Volatility Smile’ and ‘Volatility Cone’.
Volatility Smile is an interesting concept, something that I consider ‘good to know’ kind of concept. For this reason I will just touch upon this and not really dig deeper into it.
Theoretically speaking, all options of the same underlying, expiring on the same expiry day should display similar ‘Implied Volatilities’ (IV). However in reality this does not happen.
Have a look at this image –
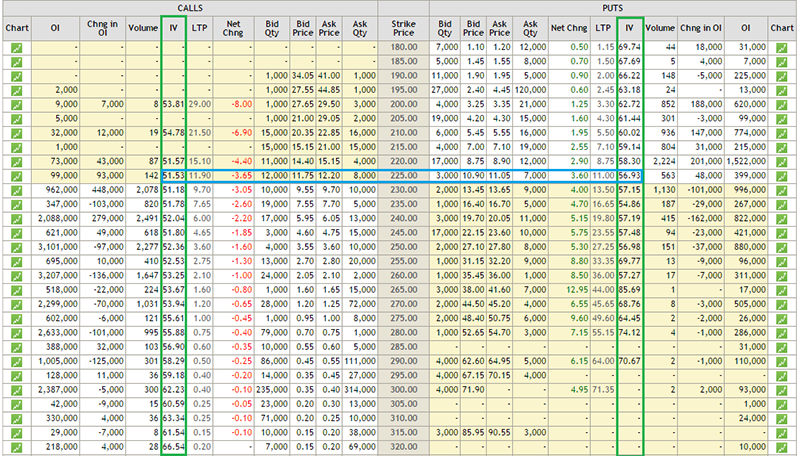
This is the option chain of SBI as of 4th September 2015. SBI is trading around 225, hence the 225 strike becomes ‘At the money’ option, and the same is highlighted with a blue band. The two green bands highlight the implied volatilities of all the other strikes. Notice this – as you go away from the ATM option (for both Calls and Puts) the implied volatilities increase, in fact further you move from ATM, the higher is the IV. You can notice this pattern across all the different stocks/indices. Further you will also observe that the implied volatility of the ATM option is the lowest. If you plot a graph of all the options strikes versus their respective implied volatility you will get to see a graph similar to the one below –
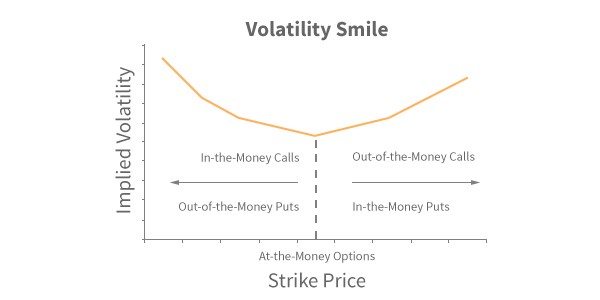
The graph appears like a pleasing smile; hence the name ‘Volatility Smile’ ☺
20.2 – Volatility Cone
(All the graphs in this chapter and in this section on Volatility Cone has been authored by Prakash Lekkala)
So far we have not touched upon an option strategy called ‘Bull Call Spread’, but for the sake of this discussion I will make an assumption that you are familiar with this strategy.
For an options trader, implied volatility of the options greatly affects the profitability. Consider this – you are bullish on stock and want to initiate an option strategy such as a Bull Call Spread. If you initiate the trade when the implied volatility of options is high, then you will have to incur high upfront costs and lower profitability potential. However if you initiate the position when the option implied volatility is low, your trading position will incur lower costs and higher potential profit.
 For instance as of today, Nifty is trading at 7789. Suppose the current implied volatility of option positions is 20%, then a 7800 CE and 8000 CE bull call spread would cost 72 with a potential profit of 128. However if the implied volatility is 35% instead of 20%, the same position would cost 82 with potential profit of 118. Notice with higher volatility a bull call spread not only costs higher but the profitability greatly reduces.
So the point is for option traders , it becomes extremely crucial to assess the level of volatility in order to time the trade accordingly. Another problem an option trader has to deal with is, the selection of the underlying and the strike (particularly true if your strategies are volatility based).
For example – Nifty ATM options currently have an IV of ~25%, whereas SBI ATM options have an IV of ~52%, given this should you choose to trade Nifty options because IV is low or should you go with SBI options?
This is where the Volatility cone comes handy – it addresses these sorts of questions for Option traders. Volatility Cone helps the trader to evaluate the costliness of an option i.e. identify options which are trading costly/cheap. The good news is, you can do it not only across different strikes of a security but also across different securities as well.
Let’s figure out how to use the Volatility Cone.
Below is a Nifty chart for the last 15 months. The vertical lines mark the expiry dates of the derivative contracts, and the boxes prior to the vertical lines mark the price movement of Nifty 10 days prior to expiry.
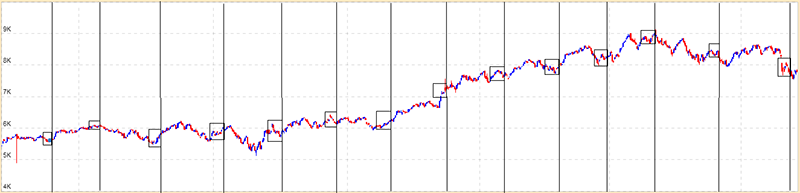
If you calculate the Nifty’s realized volatility in each of the boxes, you will get the following table –
| Expiry Date | Annualized realized volatility |
|---|---|
| Jun-14 | 41% |
| Jul-14 | 38% |
| Aug-14 | 33% |
| Sep-14 | 28% |
| Oct-14 | 28% |
| Nov-14 | 41% |
| Dec-14 | 26% |
| Jan-15 | 22% |
| Feb-15 | 56% |
| Mar-15 | 19% |
| Apr-15 | 13% |
| May-15 | 34% |
| Jun-15 | 17% |
| Jul-15 | 41% |
| Aug-15 | 21% |
From the above table we can observe that Nifty’s realized volatility has ranged from a maximum of 56% (Feb 2015) to a minimum of 13% (April 2015).
We can also calculate mean and variance of the realized volatility, as shown below –
| Particulars | Details |
|---|---|
| Maximum Volatility | 56% |
| +2 Standard Deviation (SD) | 54% |
| +1 Standard Deviation (SD) | 42% |
| Mean/ Average Volatility | 31% |
| -1 Standard Deviation (SD) | 19% |
| -2 Standard Deviation (SD) | 7% |
| Minimum Volatility | 13% |
If we repeat this exercise for 10, 20, 30, 45, 60 & 90 day windows, we would get a table as follows –
| Days to Expiry | 10 | 20 | 30 | 45 | 60 | 90 |
|---|---|---|---|---|---|---|
| Max | 56% | 49% | 41% | 40% | 37% | 35% |
| +2 SD | 54% | 46% | 42% | 41% | 40% | 38% |
| +1 SD | 42% | 38% | 36% | 36% | 35% | 33% |
| Mean/Average | 30% | 29% | 30% | 30% | 30% | 29% |
| -1 SD | 19% | 21% | 23% | 24% | 24% | 24% |
| -2 SD | 7% | 13% | 17% | 19% | 19% | 19% |
| Min | 13% | 16% | 21% | 22% | 21% | 20% |
The graphical representation of the table above would look like a cone as shown below, hence the name ‘Volatility Cone’ –
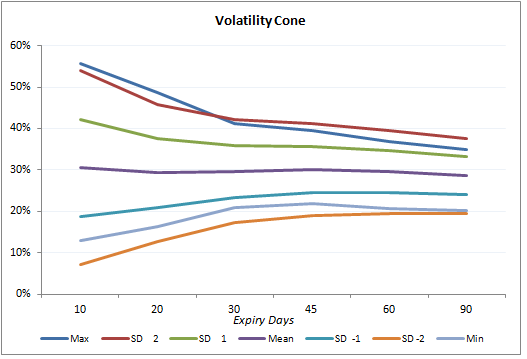
The way to read the graph would be to first identify the ‘Number of days to Expiry’ and then look at all the data points that are plotted right above it. For example if the number of days to expiry is 30, then observe the data points (representing realized volatility) right above it to figure out the ‘Minimum, -2SD, -1 SD, Average implied volatility etc’. Also, do bear in mind; the ‘Volatility Cone’ is a graphical representation on the ‘historical realized volatility’.
Now that we have built the volatility cone, we can plot the current day’s implied volatility on it. The graph below shows the plot of Nifty’s near month (September 2015) and next month (October 2015) implied volatility on the volatility cone.
Each dot represents the implied volatility for an option contract – blue are for call options and black for put options.
For example starting from left, look at the first set of dots – there are 3 blue and black dots. Each dot represents an implied volatility of an option contract – so the first blue dot from bottom could be the implied volatility of 7800 CE, above that it could be the implied volatility of 8000 CE and above that it could be the implied volatility of 8100 PE etc.
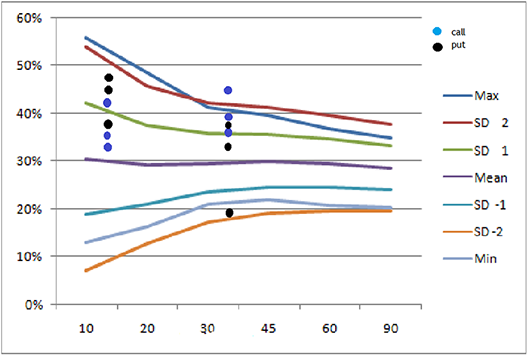
Do note the first set of dots (starting form left) represent near month options (September 2015) and are plotted at 12 on x-axis, i.e. these options will expire 12 days from today. The next set of dots is for middle month (October 2015) plotted at 43, i.e. these options will expire 43 days from today.
Interpretation
Look at the 2nd set of dots from left. We can notice a blue dot above the +2SD line (top most line, colored in maroon) for middle month option. Suppose this dot is for option 8200 CE, expiring 29-Oct-2015, then it means that today 8200 CE is experiencing an implied volatility, which is higher (by +2SD) than the volatility experienced in this stock whenever there are “43 days to expiry” over the last 15 months [remember we have considered data for 15 months]. Therefore this option has a high IV, hence the premiums would be high and one can consider designing a trade to short the ‘volatility’ with an expectation that the volatility will cool off.
Similarly a black dot near -2 SD line on the graph, is for a Put option. It suggests that, this particular put option has very low IV, hence low premium and therefore it could be trading cheap. One can consider designing a trade so as to buy this put option.
A trader can plot volatility cone for stocks and overlap it with the option’s current IV. In a sense, the volatility cone helps us develop an insight about the state of current implied volatility with respect to the past realized volatility.
Those options which are close to + 2SD line are trading costly and options near -2 SD line are considered to be trading cheap. Trader can design trades to take advantage of ‘mispriced’ IV. In general, try to short options which are costlier and go long on options which are trading cheap.
Please note: Use the plot only for options which are liquid.
With this discussion on Volatility Smile and Volatility Cone, hopefully our understanding on Volatility has come to a solid ground.
20.3 – Gamma vs Time
Over the next two sections let us focus our attention to inter greek interactions.
Let us now focus a bit on greek interactions, and to begin with we will look into the behavior of Gamma with respect to time. Here are a few points that will help refresh your memory on Gamma –
- Gamma measures the rate of change of delta
- Gamma is always a positive number for both Calls and Puts
- Large Gamma can translate to large gamma risk (directional risk)
- When you buy options (Calls or Puts) you are long Gamma
- When you short options (Calls or Puts) you are short Gamma
- Avoid shorting options which have a large gamma
The last point says – avoid shorting options which have a large gamma. Fair enough, however imagine this – you are at a stage where you plan to short an option which has a small gamma value. The idea being you short the low gamma option and hold the position till expiry so that you get to keep the entire option premium. The question however is, how do we ensure the gamma is likely to remain low throughout the life of the trade?
The answer to this lies in understanding the behavior of Gamma versus time to expiry/maturity. Have a look at the graph below –
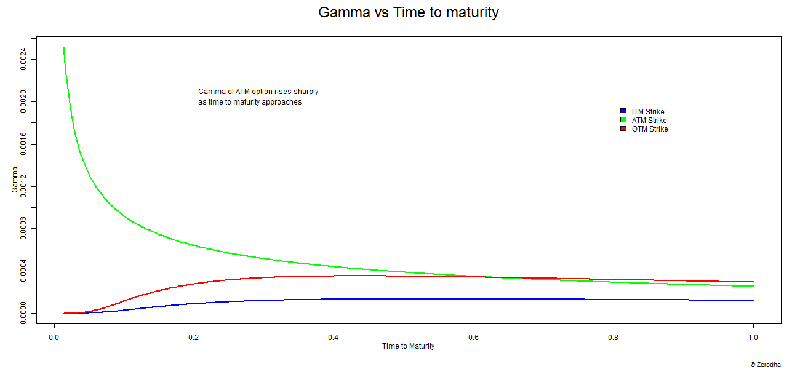
The graph above shows how the gamma of ITM, ATM, and OTM options behave as the ‘time to expiry’ starts to reduce. The Y axis represents gamma and the X axis represents time to expiry. However unlike other graphs, don’t look at the X – axis from left to right, instead look at the X axis from right to left. At extreme right, the value reads 1, which suggests that there is ample time to expiry. The value at the left end reads 0, meaning there is no time to expiry. The time lapse between 1 and 0 can be thought of as any time period – 30 days to expiry, 60 days to expiry, or 365 days to expiry. Irrespective of the time to expiry, the behavior of gamma remains the same.
The graph above drives across these points –
- When there is ample time to expiry, all three options ITM, ATM, OTM have low Gamma values. ITM option’s Gamma tends to be lower compared to ATM or OTM options
- The gamma values for all three strikes (ATM, OTM, ITM) remain fairly constant till they are half way through the expiry
- ITM and OTM options race towards zero gamma as we approach expiry
- The gamma value of ATM options shoot up drastically as we approach expiry
From these points it is quite clear that, you really do not want to be shorting “ATM” options, especially close to expiry as ATM Gamma tends to be very high.
In fact if you realize we are simultaneously talking about 3 variables here – Gamma, Time to expiry, and Option strike. Hence visualizing the change in one variable with respect to change in another makes sense. Have a look at the image below –
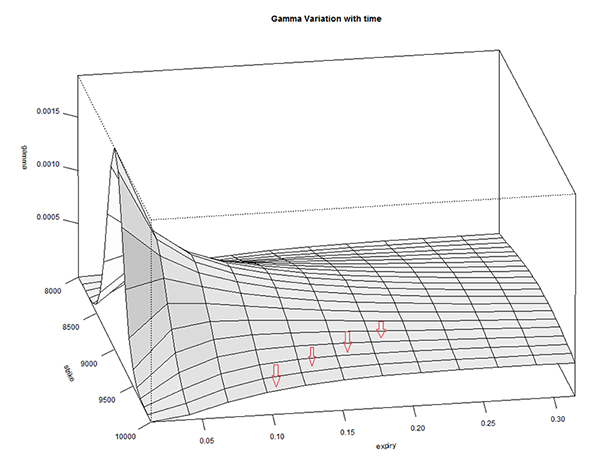
The graph above is called a ‘Surface Plot’, this is quite useful to observe the behavior of 3 or more variables. The X-axis contains ‘Time to Expiry’ and the ‘Y axis’ contains the gamma value. There is another axis which contains ‘Strike’.
There are a few red arrows plotted on the surface plot. These arrows are placed to indicate that each line that the arrow is pointing to, refers to different strikes. The outermost line (on either side) indicates OTM and ITM strikes, and the line at the center corresponds to ATM option. From these lines it is very clear that as we approach expiry, the gamma values of all strikes except ATM tends to move towards zero. The ATM and few strikes around ATM have non zero gamma values. In fact Gamma is highest for the line at the center – which represents ATM option.
We can look at it from the perspective of the strike price –
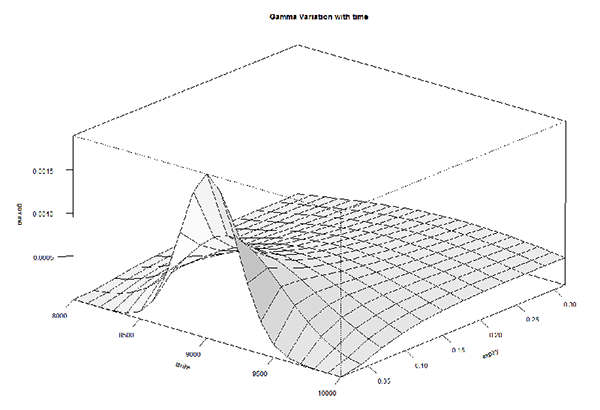
This is the same graph but shown from a different angle, keeping the strike in perspective. As we can see, the gamma of ATM options shoot up while the Gamma of other option strikes don’t.
In fact here is a 3D rendering of Gamma versus Strike versus Time to Expiry. The graph below is a GIF, in case it refuses to render properly, please do click on it to see it in action.
Hopefully the animated version of the surface plot gives you a sense of how gamma, strikes, and time to expiry behave in tandem.
20.4 – Delta versus implied volatility
These are interesting times for options traders, have a look at the image below –
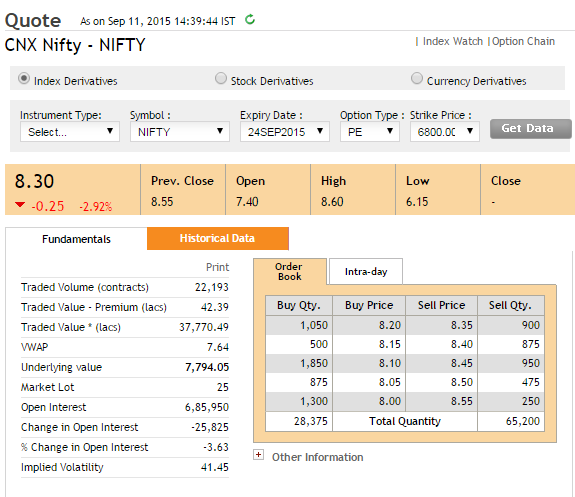
The snapshot was taken on 11th September when Nifty was trading at 7,794. The snapshot is that of 6800 PE which is currently trading at Rs.8.3/-.
Figure this, 6800 is a good 1100 points way from the current Nifty level of 7794. The fact that 6800 PE is trading at 8.3 implies there are a bunch of traders who expect the market to move 1100 points lower within 11 trading sessions (do note there are also 2 trading holidays from now to expiry).
Given the odds of Nifty moving 1100 (14% lower from present level) in 11 trading sessions are low, why is the 6800 PE trading at 8.3? Is there something else driving the options prices higher besides pure expectations? Well, the following graph may just have the answer for you –
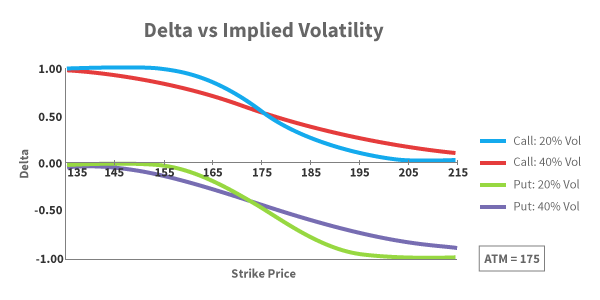
The graph represents the movement of Delta with respect to strike price. Here is what you need to know about the graph above –
- The blue line represents the delta of a call option, when the implied volatility is 20%
- The red line represents the delta of a call option, when the implied volatility is 40%
- The green line represents the delta of a Put option, when the implied volatility is 20%
- The purple line represents the delta of a Put option, when the implied volatility is 40%
- The call option Delta varies from 0 to 1
- The Put option Delta varies from 0 to -1
- Assume the current stock price is 175, hence 175 becomes ATM option
With the above points in mind, let us now understand how these deltas behave –
- Starting from left – observe the blue line (CE delta when IV is 20%), considering 175 is the ATM option, strikes such as 135, 145 etc are all Deep ITM. Clearly Deep ITM options have a delta of 1
- When IV is low (20%), the delta gets flattened at the ends (deep OTM and ITM options). This implies that the rate at which Delta moves (further implying the rate at which the option premium moves) is low. In other words deep ITM options tends to behave exactly like a futures contract (when volatility is low) and OTM option prices will be close to zero.
- You can observe similar behavior for Put option with low volatility (observe the green line)
- Look at the red line (delta of CE when volatility is 40%) – we can notice that the end (ITM/OTM) is not flattened, in fact the line appears to be more reactive to underlying price movement. In other words, the rate at which the option’s premium change with respect to change in underlying is high, when volatility is high. In other words, a large range of options around ATM are sensitive to spot price changes, when volatility is high.
- Similar observation can be made for the Put options when volatility is high (purple line)
- Interestingly when the volatility is low (look at the blue and green line) the delta of OTM options goes to almost zero. However when the volatility is high, the delta of OTM never really goes to zero and it maintains a small non zero value.
Now, going back to the initial thought – why is the 6800 PE, which is 1100 points away trading at Rs.8.3/-?
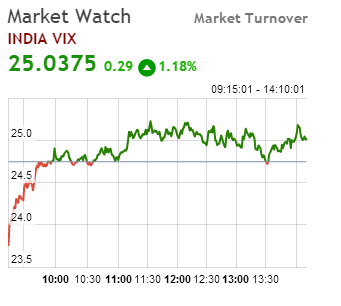
Well that’s because 6800 PE is a deep OTM option, and as the delta graph above suggests, when the volatility is high (see image below), deep OTM options have non zero delta value.
I would suggest you draw your attention to the Delta versus IV graph and in particular look at the Call Option delta when implied volatility is high (maroon line). As we can see the delta does not really collapse to zero (like the blue line – CE delta when IV is low). This should explain why the premium is not really low. Further add to this the fact that there is sufficient time value, the OTM option tends to have a ‘respectable’ premium.
Download the Volatility Cone excel.
Key takeaways from this chapter
- Volatility smile helps you visualize the fact that the OTM options usually have high IVs
- With the help of a ‘Volatility Cone’ you can visualize today’s implied volatility with respect to past realized volatility
- Gamma is high for ATM option especially towards the end of expiry
- Gamma for ITM and OTM options goes to zero when we approach expiry
- Delta has an effect on lower range of options around ATM when IV is low and its influence increases when volatility is high.
- When the volatility is high, the far OTM options do tend to have a non zero delta value
Sir is it advisable to take advantage of iv spikes during corporate action of companies or is it risky to take naked trades during such scenarios. What should be the ideal strategy to hedge or ignore such spikes and not indulge during such events
IV is expected to spike during corporate events. The right way is to factor this in your trading plan. Maybe with hedged positions 🙂
Hi sir,
Thanks for your wonderful explanation. I have one question regarding below explanation:
\”Do note the first set of dots (starting form left) represent near month options (September 2015) and are plotted at 12 on x-axis, i.e. these options will expire 12 days from today. The next set of dots is for middle month (October 2015) plotted at 43, i.e. these options will expire 43 days from today.\”
Looking at volatility cone exercise and logically thinking about historical volatility as well, we should be calculating volatility on trading days and not calendar days and hence should be drawing inferences based on trading days left for expiry (which would be less than 12 and 43 in above case.
Yeah, trading days is better. But if you are calculating, maybe do it for both to compare results?
How can i find closing price( data) of stocks or index for last 15 to 16 months as on NSE website historical data is available for past 1 year only?
You can look at the chart on the trading terminal for this.
Thankyou but it will take time to note down all these vlues
Yes, it will. But thats the learning process, right?
Thanks sir, yes it is part of learning
Good luck, Saurav!
Hello sir
I tried to understand the volatility cone file, but it has most of the cells just numbers without formulas and it is a real pain to understand what is going on.
If possible than please verify and simplify the excel so that it becomes easier to understand.
Thanks 😊
Ah, sure, I\’ll check that Roopam. Meanwhile, you can also check Sensibull for this.
did you check sir?
any update?
Roopam, unfortunately, the person who wrote this and developed the volatility cone on Excel is no longer available. I\’d suggest you please check with Sensibull.
ok thanks
Hello Karthik,
I am unable to download the \”Download the Volatility Cone excel\”.
Please help
Can you try changing the browser? That should help.
Wow, the volatility cone has a huge amount of number crunching!
Yes sir, its not a straightforward math 🙂
Sir can you teach us how to make Volatile cone in R language . How the R language is helpful in profitable trading???
Ah, I myself dont know that 🙂
Just tell me sir in the last part of this chapter . You have tell that the value of delta is not zero when the high volatility is there . So it\’s mean that the premium changes very rapidly I.e it\’s falling. So Why the value of premium is very high at 8.3 for 6800PE?? as compared to low volatility . As we know the value of delta is almost zero as there is low volatility it\’s mean that the premium is not changing i.e the premium is constant if all other things are same . So the premium should be high in that case . But there is a opposite thing why sir….
Becuase the premium is not just a function of one variable. Its a function of multiple things like – volatility, time to expiry, delta etc.
Hello Karthik sir, is module ke last me jo aapne link diya h
\”Download the Volatility Cone excel\”
ye link open nhi ho rha h, thoda isko sahi kr dijiye ya hme koi other link provide kr denge kya
Jisase hm bhi us formate ka use kr ske, please
Let me check, but do try with another browser meantime?
Unfortunately, download of volatility cone is not available anymore. Is is possible to retrieve the file?
Let me check this, Rajat.
Hi karthik Sir,
This may be out of the box. Can we do swing trading in equity through pledging the G secs and Gilt funds?
Yes, you can. Swing trading is all about holding positions for a few days to a few weeks.
Here in the volatility cone we are comparing implied volatility to the historical volatility of the index price but shouldn\’t we be comparing it with the historical volatility calculated from the variance in the option price rather than the index price itself?
Option price data is not continuous, so its very hard to make any sort of inference out of it. Also, spot data is a great approximation.
so how can I get calls and puts plotted on the volatility cone on a real time basis
Hey Shivansh, these are complicated volatility setups, best done by creating a program yourself.
can you recommend some good other option platforms for volatility cone feature
I only know Sensibull. I\’ve not used others, so cant really comment.
Is there any website or a reliable source for the volatility cone data other than sensibull as I talked with they support team, they don\’t have it
Ah, not sure. Maybe check once with other option platforms?
I asked sensibull support team about this volatility cone feature, they don\’t have it. Is there any website or a reliable source for the same
I wasn\’t able to find anything related to volatility cone on Sensibull, if its there on sensibull can you please guide me where to find it.
Ok. Even I\’m not sure. Let me check once with Sebsibull.
is there a way to automate the process of plotting calls and puts on the volatility cone instead of doing all the things manually every time, or is there any tool or a reliable source like a website which provides this data to find such trade opportunities ?
Ah, perhaps Sensibull has something.
I got this, i was thinking incorrectly, understood, thanks for explaining it.
Sure. Good luck!
Hi @Karthik,
I have one doubt regarding one sentence, mentioned in Volatility Cone, Can you please help me understand pls, Sentence is \”It suggests that,
this particular put option has very low IV, hence low premium and therefore it could
be trading cheap. One can consider designing a trade so as to buy this put option\”
If premium is low and its trading cheap then why to buy put option, shouldn\’t be it sell put option?
Thanks in advance.
It depends on your view of volatility. If you think that volatility will increase, then you can buy these options cheap now with an expectation that the premium will increase after you buy them.
Resp. Sir:
On Sensibull platform, can we find volatility cone?
This concept is tricky. Please suggest an easy way. We want to know skew or cone to know about contengo and backwardation, isn\’t it? Please help me out.
I think you can find volatility data on Sensibul, not sure. Please do check once with the Sensibul platform folks?
Hi Karthik,
Thank you for the insightful content. I have a few questions on the volatility cone and would really appreciate your input.
1) In the volatility cone example, for the 8200 CE option expiring on 29-Oct-2015, if we sell the option close to +2SD, how long should we keep the position open? Should we maintain the position until the volatility again falls within +1SD, or until it moves closer to the mean?
2) For the same call option (i.e. sell 8200 CE expiring on 29 Oct), if the volatility remains high and close to +2SD, then the volatility increases as time goes by instead of cooling off (i.e. 12 days volatility > 43 days volatility) . Can this happen? If so, how do you approach such a scenario?
Please let me know.
Thanks and regards,
Yogesh
1) The position duration depends on the way SDs converge. Cant really fix a time target to it.
2) Yes, this is possible as well. In fact, you should be prepared for situations like this one. The only thing you can do is to maintain SL, unless in extreme situations where your confidence is so high on the trade that you want to build the position by adding more lots.
The volatility cone idea assumes that the options\’ IV and nifty historic volatility are quantities that can be compared. Why can be this done given that
1. their calculation methods are different (they arise from different market behaviours)
2. options expire weekly/monthly whereas NIFTY is a continuous index. Each new options contract would have some discontinuity in IV for each strike price – Wouldn\’t this lead to deviation in behaviour from NIFTY\’s true volatility as the discontinuities get added up over each new contract introduction?
Hope the question isn\’t too confusing 🙂
I will post this question the author of the volatility cone – that section is written by someone else and not me 🙂
But yes, I do get your question. Perhapse its best used as a proxy and not as a definitive indicator of volatility?
namaskar sir
sir zerodha has introduced volatility cone indicator.
is it sufficient or we have to calculate manually.
thank you sir.
Need to check on that, but if you do get volatility numbers readily, then you should probably use it to save time 🙂
Hey Karthik,
Many thanks for this highly informative modules. Really helps someone to get started if one is really interested.
I did notice that the excels linked on these modules dont seem to work. Can you please have a look at it.
Thanks Arun. Can you try downloading the excel from another browser?
Hi karthik
I am having doubt wrt to these statemnts,can you please explain the diferrence between these two comments
1.India VIX is denoted as an annualised percentage
2.India VIX depicts the expected market volatility over the next 30 calendar days
so does it mean the nifty index will trade in particaular range for 1month or 1 year from the given india VIX value
For the above mentioned Moumita Goswami comments,which formula stands correct,if i want to calculate price range for one month provided india vix value
Thanks in advance
It is monthly vol, Rama.
Hi,
If we can also find range through Nifty VIX,say Nifty VIX data on a 01.01.2000 is x% and Nifty is trading for 100 on this day. Could you kindly inform if I am correct on the below?
(i) Nifty can swing between 100-x*100 to 100+x*100 during the upcoming year
(ii) Variation for a month is x/√12. Hence, Nifty can swing between 100-x/√12*100 to 100+x/√12*100 during the upcoming month
(iii) Variation for a week is x/√52. Hence, Nifty can swing between 100-x/√52*100 to 100+x/√52*100 during the upcoming week
(iv) Variation for a day is x/√252. Hence, Nifty can swing between 100-x/√252*100 to 100+x/√252*100 on tomorrow.
Yup, that seems correct.
Hi Karthik,
You have taught how to calculate range variation for a particular period through historical data and running through excel for sd, mean and then ultimately finding range for a particular time frame of a particular stock/index.
(i) My question is can we find the range through Nifty VIX data directly for a particular period also without running through the above exercise?
(ii) If both the above works, do you have any personal preference on which method to apply especially for a week/month/intraday? Request your inputs here.
1) Yes, you can get a rough range using ViX
2) Depends on how much time you have. You can use ViX for faster approximation.
Hey Karthik,
First of all thanks to you for providing great educational content for traders community out there.
I want to tell you that all he excel links which you have provided in this options module are not opening. Can you please ask your team to update them on latest software/versions. That would be very helpful for us.
Thanks 🙂
Manan, thanks for the kind words. Can you please try to download from another browser? Usually that works. Let me know and good luck 🙂
Please correct me if wrong sir,
I have learn the importance of considering volatility in the next chapter if volatility increase one should consider buying the option and if volatility decrease one should consider selling option keeping time exipry and strike selection in the mind
1. my question is which volatility meter should be consider, india vix or the option chain IV from NSE
2. and if we consider IV from Option chain in NSE right now @ 19-2-24 @ 9:45 hrs the IV meter for Call option range from 16 to 30 for different strike price and for put option it is range from 20 to 47 for different strike price are this number in percentage form
3. clearly from the above statement put side volatilty is more and call side volatilty is less should we consider buying put and selling call
Thanks in advance
Mukund, answers as below –
1) YOu can consider both to drawn an inference, no harm doing that.
2) Yeah, this is normal, IV will vary for different option types, different option strikes.
3) Yeah, Puts usually have more IV.
Hello sir
is india vix – implied volatility
and if india vix is implied volatility and it is based on nifty option book can india vix be consider for other underlyings since it purely on nifty option book
Thanks in advance
Yes, you can use it as a proxy for volatility in general.
Dear Mr. Karthik,
Thank you very much for your kind response.
I wish you have a wonderful week.
You too, John. Have a great week ahead.
Dear Mr. Karthik,
Thank you very much for your kind and prompt response.
Please kindly see below additional clarifications and informations:
Thank you
1. Based on the Volatility Smile Diagram as shown in the first part of Chapter 20, is it correct to say that OTM has the highest IV, ITM has the second highest IV and ATM has the lowest IV?
2. Based on the Diagram (i.e. Delta vs IV) as shown in Chapter 20, the blue chart (20% Vol) is steeper than the red chart (40% Vol) around the Strike Price. That means around the Strike Price, a Lower IV (i.e. Blue Chart with 20% Vol) has a greater impact on Delta compared to a Higher IV (i.e. Red Chart with 40% Vol). Do you agree?
Thank you
1) Yes, they generally do.
2) Yes
Dear Mr. Karthik,
Thank you very much for the informative and in-depth article.
I would like to seek your kind guidance on the following 2 points:
Thank you
1. In the 1st Key takeaways of Chapter 20 on “Greek Interactions”, it was stated that Volatility Smile helps to visualize the fact that the OTM options usually have high IVs. However, based on the Volatility Smile Diagram as shown in the first part of Chapter 20, both OTM and ITM have high IVs. Why does Key Takeaways only mention OTM and not ITM?
2. In the 5th Key takeaways of Chapter 20 on “Greek Interactions”, it was stated that Delta has an effect on lower range of options around ATM when IV is low and its influence increases when volatility is high. However, based on the Diagram (i.e. Delta vs IV) as shown in Chapter 20, the blue chart (20% Vol) is steeper than the red chart (40% Vol) which means that IV has a bigger influence on the blue chart. When the Vol increases to 40%, the rate of change of Delta of ATM will reduce.
Thank you
1) OTM have the max volatility, John
2) Sorry, I\’m unable to figure your exact query. Possible to share an example?
Btw love the written and video content.
It\’s to the point as well as easy to understand, which is rare.
Thank you :).
Thanks for that, glad you liked the content 🙂
Hello, I don\’t know if it\’s still active or not.
I am currently learning all this stuff and able to understand the concepts and their maths. But it\’s hard to get a feel of the different parts like for options we have 4 variables: Long Call, Long Put, Short Call and Short Put.
It it difficult for me to grasp the feel of every part at once.
What do you suggest I should do?
I think you should spend more time in reading this module, eventually it will get cleared. Also, you dont really need to know the math, as long as you figure which greek to use and when.
SIR CAN U PLEASE PROVIDE V VONE USING LATEST CLOSING PRICES OF YEAR 2023 (NOV 2022TO NOV2023) , SO THAT I CAN COMPARE MY DATA WITH YOURS,
AS WHEN I TRIED PLOTTING V CONE USING DATA PROVIDED BY YOU ALL VALUES AND CHART MATCHES ,
BUT WHEN I TRIED TO DOWNLOAD DATA OF 12 MONTHS(OF NIFTY-2023) AND PLOTTED USING EXACT STEPS IT SOMEHOW DOSENT LOOK LIKE A CONE .
CAN U PLEASE PROVIDE ME EXCEL SHEET OF VOLATILIY CONE USING NIFTYS OR ANY OTHER SUCH AS WIPRO OR TCS ) CLOSING PRICES OF YEAR2023?
IT WILL REALLY HELP ME TO KNOW IF IM USING RIGHT DATA AND STEPS .
AND I REALLY WANT TO THANK YOU AND VARSITY AS ITS REALLY HELPING TO EDUCATE US,
Prasad, please do check this with Sensibull once. I dont have this data 🙂
SIR CAN VALUES OF MAXIMUM AND MINIMUM(SERIES) GREATER THAN ITS +-2SD DEVIATION VALUES ?,
the reason im asking you this i have calculated h.volatility and plotted volatility cone but its not looking like a cone .as 2sd values are bigger than maximim series,
is it necessary that the v.cone should look like vcone even if there is differnce in values .
If potted correctly, then the resulting graph will more or less look like a cone. So do check the values again.
i think i have found my mistake i was calculating h.volatility sqrt(365) but when i have calculated with sqrt(252) the answer is near to same .
i have used data provided by you and calculated historical volatility by going 45 days back prior to expiry 30-Jun-11 i.e 28 april 2011 to 29 jun 2011 .
then calculated LN then SD And using sqrt (252) i got h.volatility 25.98% .
So glad to note that, I\’m happy you were able to figure this 🙂
SIR i have calculated h.volatility from dec 2022 to nov2023 as you suggested above but the cone is looking different, and i tried to find it on sensibull but i couldn\’t.
DAYS 10 20 30 45 60 90
MAX 16.84 15.02 14.92 14.06 14.17 16.35
2SD 16.34 16.23 15.54 15.21 15.07 16.54
1Sd 13.44 13.8 13.57 13.46 13.44 14.41
MEAN 10.55 11.38 11.59 11.71 11.8 12.27
SD-1 7.66 8.96 9.61 9.96 10.16 10.13
SD-2 4.76 6.53 7.64 8.21 8.53 8
MINIM. 6.64 7.83 8.64 9.56 9.75 9.75
i have plotted above info in chart but its looking little different , please guide me if im missing something or the data im providing is wrong , i have downloaded historical data , then by taking n days back from the expiry of each month calculated h.volatility then plotted above table.
Ah, it will be tough to figure this without actually seeing the actual working. But please check if you are taking the right data set, ensure the underlying data is clean for all corporate actions etc.
If i want to prepare the volatility cone taking 12 months from 1 Dec2022 to 30 nov 2023
And i want to calculate volatility of 10/20/30/45/60/90 days (historical volatility ) before expiry of each month
Then for Dec2022 only
For 10 days historical volatility am i supposed to take 10 days closing prices before expiry day of december
Historical realized volatility for DEC month only
Expiry date – 29 Dec 2022 (Thursday)
Then volatility for 10 days) – closing prices from the date 19Dec 2022 to 28 dec 2022
For 20 days – 9 dec 2022 to 28 th dec 2022
For 30 days – 29 nov 2022 to 28 th dec 2022
For 45 days 12 nov 2022 to 28 th dec 2022
For 60 days 28 oct 2022 to 28 th dec 2022
For 90 days 30 sep 2022 to to 28 th dec 2022
Then same for Jan 2023 to 30 nov 2023 ?
And then plot above information in volatility cone?
Now gathering above information for each month can i plot volatility cone now manually on paper?
Yes, but I\’d suggest you check once with Sebsibull team if they readily provide the volatility cone information.
Sir still not getting it
can u please confirm that if we are taking historical data before the expiry 27AUG of AUG2015 ? i mean are you looking for 10,20,30,45,60,90 days back from the date 27 aug 2015,?
if we take expiry date 30 nov 2023 then am i supposed to look 10,20,30,45,60,90 days back from 30 nov 2023 to get historical data for calculating historical volatility ?
Thats right, Prasad. Keeping the expiry date fixed, you take the historical data \’n\’ number of days back for your analysis.
10,20,30,45 days before expiry
can u please tell if i want to see 10/20/30/45/60/90 days historical data of month november2023 (expirey 30 nov 2023)
then should i see 45/60/90 days historical data before the date 30 nov 2023 ?
I think you should check with Sensibull if they can point you to data source.
WHAT IT MEANS10,20,30, 45 ,60,9 DAYS TO EXPIREY?
Lets say we are looking nifty 1 yr historical data i.e past 12 months from 1 dec 2023 TO 1dec 2024 and if so , then 45 days to expiry means we are looking 45 days closing price before expiry of month -DEC2023?
or 90 days data before the expiry, what does that really mean?
Can u please prepare volatility cone by recent data of 2023, and can i get detailed explanation on these because when i have tried to get that data to calculate volatility THREE major problem arriveD
1) iam unable to find historical data from 2014 and 2015 of NIFTY(nse-historical reports-indices -nifty 50 no data showing on the page .
2) im not getting the concept of days to expiry ? i mean expiry of each month or 10/20/30/45/60/90 days historical d data before the expiry of current month ? example today is 09 dec2023 how can we get 10/20/30/45/ 90 days historical data before the expiry of current month.
OR can u give any link where i can study this (10/20/30/45/90 days before expiry) concept and volatility cone concept
3) can we say that 1sd = mean+34.1%and mean-34.1% and 2SD=MEAN+(34.1+13.6%) AND MEAN-(34.1%=+12.6%).
IF MEAN IS 31% THEN HOW U CALCULATED +/-1SD AND +/-2SD?
we repeat this exercise for 10, 20, 30, 45, 60 & 90 day windows, we would get a table as follows –
Im not able to understand this 10,20,30,45,60,day to expiry , dose this mean 10 days data before expiry of each month
?
if we considering one month we can understand that u might have took closing price of 10 days (before expiry)and then calculated volatility same for each months by taking 20, and 30 days closing prices of each months expiry and then calculated volatility but what about 45 ,60,90 day and so on. im confused about how come we take 45 days closing prices before expiry of each month ,or we taking all thi prices and data before the 15th month? i have read the excel sheet already but a beginner im so confused about expiry of options and getting all the necessary data . i know it will be so much to ask as this module helped me a lot to understand basics but but can u explain volatility cone in simple language .
Yes, that is 10 day, 20 day, 30 day before expiry. For longer expires, you can consider next month contracts.
In the \”Volatility Cone\” Excel file, why is the mean (Sheet1, J4) set to 0? Should it not be the average of returns (Sheet1, Column C) ?
Need to check, this sheet is developed by someone else and not me.
I have tried to download the sheet,But unable to download or open it in new page.can you please check the link once
Its working fine for me, Rama. I use Firefox as my browser.
Hi karthik,
Thanks for the valuable knowledge you are sharing to us.It would be much more helpful,If you provide the excel sheet calcualtions for the volatility cone,Thanks in advance
The excel sheets are put up on the page itself. Please do check. Thanks.
Hello sir,
i have calculated historical volatility of two months for 10 days before expiry (june 2014 and feb 2015).Instead of showing 41% and 56% annualized volatility , results show 16.66% and 12.59% annualized volatility respectively in my excel sheet. i followed exact method of calculating volatility mentioned by you.
step 1: download close price of nifty
step 2: perform log returns with LN method
step 3: run stdev method for daily volatility
step 4: sqrt method for annualized volatility.
Could you please help me in understanding how you arrived at 41% and 56% annualized realized volatility of these two months.
Regards.
The steps look correct, usually this will have issues when the data points are corrupted or if you\’ve missed few data points. Maybe you should double check that once.
Dear Karthik,
Thank you for the valuable course, it is extremely informative. Besides, the course is mathematically inclined which makes it even more interesting.
I have a query,
Bank nifty Spot: 43773
Strike: 43700
days to expiry is 5days
TF: 1min
Premium value of 30thNov43700CE
Time= 15:11, O= 248.10; C=281, change in spot on same candle:- O=43773; C= 43798,
Change in premium= 33pts, change in spot= 25pts
Here, change in premium value is greater in points than change in the spot price movement.
Since, delta is the factor by which option value can increase by maximum and delta being less than 1 always, how is possible for the premium value to increase more than the change in spot value?
I want to share the screen shot of the above scenario for your better understanding but do not know if that is possible.
Thanks and regards
Shrey
Shrey, since you are looking at intrday charts, there could be instances where a random market order would have triggered a spike in prices. Usually when such a thing happens, the market corrects itself and such high or low prices (beyond whats fair price), may/will not exist for long.
Sir , how to make volatility cone for weekly options?
I\’d suggest you check Sensibull for this, Dhruv.
Thanks for this chapter. Although a little tricky to understand, it was really insightful. I feel there are many things to take care of when learning about options. Is there some software or tool that I can use that calculates all these values or some of them?
Thanks, Aniket. You can certainly try to use Sensibull. They have all these things available on their site.
Sir I want to know tha actual range of IV, which number i considered low IV and High IV
For this you can check IV percentiles, I guess Sensibull gives this data.
Thank you so much the knowledge , even for making the efforts to reply at 04:21am 🙂
Happy learning, Abhinay 🙂
Hi sir, by IVP i meant Implied Volatality Percentile. I learnt it from Sensibull\’s platform :), https://blog.sensibull.com/2018/11/25/how-high-is-high-the-iv-percentile/#:~:text=It%20is%20a%20percentile%20number,says%20that%20IV%20is%20low.
Please let me know from your experience about IV Percentile( IVP) , is it as good as volatality cone in giving us the same information if IV is high or low?
Ah, yes, dont know how I missed that 🙂
They both essentially help you with the same thing i.e. to help you figure if the current IV is high or not wrt to the past IVs. Go with either, whatever is easier for you implement.
Hi Mr.Rangappa, like to start by saying I\’,ve been addicted to Varsity though i dont trade. Great teaching prowess. Coming to my question, instead of going through the cycle of calculating & plotting the volatality cone, can we just infer the option\’s IV by considering IVP. Would\’nt IVP tell the same story of volatality cone , in a much simpler way?
Thanks for the kind words, I\’m glad you liked Varsity.
Sorry, need more clarity, but when you IPV, what are you referring to?
In the Volatility – SD table where you took volatility extremes of 56% and 34% and calculated SD 1,2 respectively…But there is no explanation of how to arrive SD 1 and 2 with just Percentage, any calculation to do so???
We have explained that in the volatility chapter, Siva. Do check the chapter.
Can you please tell me where to find the historical data from as in 15 months realised volatility & other data required to spot the volatility cone?
Sahil, maybe check with Sesbibull once?
Hi Karthik, thanks for such wonderful articles. They are too good and articulate. I have just one question. I went through the comments but could not find the answer to this.
Referring to the Volatility smile, IV is least around ATM strikes, but referring to Vega vs Strike graph, I can see Vega tends to increase around ATM. I am not sure why this happens. If there a direct relationship between Vega and IV?
Thanks Raj. This is largely due to the time to expiry effect also 🙂 See the bottom part of the graph.
Sir,
You taught us the effect of delta/gamma/theta/vega. However, to ultimately initiate a trade, should we have to measure the parameters using BS calculator and find the resultant of these parameters to recognize probable increase/decrease of the premium and trade accordingly? Or there is trick somewhere else that we will learn in the strategy? Or is it our personal intuition (as per circumstance at that moment) through which we should fix trade? Please help.
Do check the next module where we have discussed the strategies, some of which involves Option greeks.
Sir,
Options is a bit more challenging than others as I find till date. I learnt your Options module upto volatility cone (without Option strategies module) and come to the below conclusion. Request you to kindly correct me wherever needed, as usual:
1. From price movement perspective only: During trading for any strike, we should compute the price movement range of the underlying\’s movement from the historical annual data from the date. Calculate daily returns, Calculate daily volatility and then calculate the volatility for the remaining days to expiry to recognize the probable price movement for the remaining days. Buy strikes below the lower value and short strikes above the upper value.
2. From volatility perspective only: During trading for any strike, we should compute the historical annual realized volatility for 10,15,20,30,45,60,90 days to expiry for the past 15 months. Find the average, +/- 1 SD, +/- 2 SD for each of these 10,15,20,30,45,60,90 and draw the volatility cone for average, +/- 1 SD, +/- 2 SD for each of each of these 10,15,20,30,45,60,90. Now, plot the strikes\’ implied volatility (IV) corresponding to days\’ expiry from now. Strikes wholes IV is above +2 SD should be considered shorting and strikes whose IV is below -2 SD should be considered buying.
N.B: For calculating realized volatility for the 10 days to expiry, we should take only past 10 days data from the expiry date of that month and calculate the annualized realized volatility based on those 10 days. Likewise for 15 days, we should take only 15 days past data from expiry and calculate the annualized realized volatility and so on.
3. From time perspective only: With more days to expiry, the premium decays slower and less days to expiry, the premium decays faster.
4. Time and underlying price movement : With more days to expiry, the price has a higher probability to transition from OTM to ITM/ ITM to OTM. Thus, buyers should buy early and sellers should sell at the end of series (5-7 days before expiry).
5. Time and volatility movement: With more days to expiry, the premium rises/decays faster with respect to volatility and for less days to expiry, it rises/decays slower with respect to volatility. Thus, buyers should buy early and sellers should sell at the end of series (5-7 days before expiry).
6. One should strictly avoid selling ATM option or when corporate/ monitory events are nearby.
7. One should put a stop loss based on volatility and keep a little minimum than lower value.
8. The position delta of the entire traded option strikes signify the risk of the lot equivalent to futures.
9. The delta value of an option strike measures the probability of the strike to expire in ITM.
10. We should ideally buy the common strikes with respect to volatility and underlying. Buy strikes which are both below lower value of underlying calculated range & volatility is below -2 SD of volatility cone & at the early of series.
11. We should ideally sell the common strikes with respect to volatility and underlying. Sell strikes which are both above upper value of underlying calculated range & volatility is upper of +2 SD of volatility cone & at the late of series.
1) Yes, but the strike-specific calculation can be tough I guess.
2) Yes
3) Thats right. The higher the number of day, the lower the time decay
4) Thats absolutely correct!
5) Yup
6) Yes
7) Volatility-based SL is one of the better techniques, but not the only way
8) The total delta gives the over all directional bias of the position, has nothing to do with Futures
9) Yes
10) Not sure about what you mean by this. Can you give an example?
11) Same, need more context 🙂
Bahut badhiya jankari di hai, thanks sir
Sir,
Request you to kindly share the link from where I can get the expiry dates of the options for the past months.
Its the last Thursday of the month, Anirban.
Sir,
1. Regarding drawing volatility cone, please correct if I am going wrong on the below:
Today is 23.05.23 and I would like to calculate the annualized realized volatility for the duration of 10 days before expiry of an option (Nifty) say expiry date-26.01.23 (Thursday).
Steps to compute in excel:
A. Take the daily data of Nifty in col.A (A2-A12)
B. Take the daily returns of Nifty in col.B (B3-B12)
C. Take standard deviation of col. B through STDEV for B3-B12. This gives the daily volatility of Nifty with consideration for the last 10 days from the date of expiry.
D. Calculate that daily volatility to annualized volatility with multiplying by sqry 252. This gives annualized realized volatility for 10 days.
2. Request you to kindly share the link from where I can get the expiry dates of the options for the past months.
Yes, that\’s the procedure to calculate the 10-day realized volatility.
I did use STDEV function earlier thinking that is how the realized volatility is calculated. But that was not the case. The formula for realized volatility include: 1. taking the squares of the returns. 2. adding them. 3. square root this sum.
Unlike the formula for Standard Deviation, the formula for realized volatility does not include the step where we divide the sum of the squares by number of days.
I did read some of the comments. I understood why people are pointing out that what they calculated does not match with what has been mentioned in this module.
YOu mean to say, most people are not scaling the realized volatility to the desired time scale? It could be the case 🙂
Dear Karthik,
Following are the steps that I have used to calculate the Annualized Realized Volatility for a 10 day period for, let\’s say, June14:
1. Take Historical Data of closing prices of Nifty for the 11 days before the monthly expiry.
2. Calculate the return for each day. We can calculate using the formula ln(B3/B2)*100 OR (B3/B2 – 1)*100
3. Calculate the realized volatility for that period. Realized Volatility is calculated by square rooting the sum of squares of all returns.
4. Annualize the Realized Volatility by multiplying the realized volatility with square root of 252.
Similarly we can find realized volatility for a 20 day, 30 day, 45 day, 60 day period.
And similarly we can find all these annualized realized volatilities for July14, August14, September14 ….. August15.
We can then find the Maximum Volatility, +2 SD, +1 SD, Mean, -1 SD, -2 SD, Minimum Volatility for 10 day, 20 day,30 day, 45 day, and 60 day
We can then plot these numbers on a line chart.
I did all this and the graph that is coming out is a cone but not of the type shown here. If we plot line graphs for Maximum Volatility, +2 SD, +1 SD, Mean, -1 SD, -2 SD and Minimum Volatility, they all increase with an increase in the number of days left to expiry but these lines also converge or come closer to each other with an increase in the number of days left to expiry.
10 days 20 day 30 days 45 days 60 days
Max Volatility 110.159952 115.6138691 123.2860398 131.9979049 142.315105
2 SD 86.14406542 101.0022974 110.6865842 126.3009939 140.4144589
1 SD 65.88716037 83.70900182 94.24230689 111.8077765 126.2304415
Mean 45.63025532 66.41570627 77.79802954 97.3145591 112.0464241
-1 SD 25.37335027 49.12241073 61.35375219 82.82134168 97.86240668
-2 SD 5.116445221 31.82911518 44.90947485 68.32812427 83.67838929
Min Volatility 22.89076738 44.61534856 58.3857228 81.61693628 90.70172645
Calculate the realized volatility for that period. Realized Volatility is calculated by square rooting the sum of squares of all returns.
Why not use the STDEV function?
I think there is some miscalculation while calculating the 10 Day Annualized Realized Volatility. The chart says that the Annualized Realized Volatility for August 2015 is 21%. We can observe from the graph that August 2015 was the most volatile month. Even in the previous chapter, you have mentioned that 24th August 2015 experienced the worst intraday fall of -5.92%.
I did some calculation. It is actually coming out to be 110% and not 21%. I, then, did calculation for all the 15 months you have mentioned. Seems like there is a miscalculation for all 15 months.
Can you check it and tell me if I am right or am I missing something?
Ah, I need to double-check this as well. But what are the steps you followed for this calculation?
nevermind i confused gamma with theta
Ah ok.
I am confused by this statement in the gamma vs time section: \”From these points it is quite clear that, you really do not want to be shorting “ATM” options, especially close to expiry as ATM Gamma tends to be very high.\”
if the gamma is high doesn\’t that mean the premium will go down rapidly? if that\’s the case why is writing the option close to expiry not recommended?
The sensitivity of the option will be very high so the chances of option swinging either ways is high. Hence you\’d not want to risk it with ATM option shorts 🙂
Went above my head 😉
Is there anything in particular that you found difficult? I can try helping you that.
Google chrome didn\’t allow to download, but Microsoft edge helped me in downloading the file.
Thanks for the idea.
Sure, good luck!
Hello Karthik
Great efforts are put to make people understand about the options in a simpler way.
I am one among the beneficiated. Thanks a lot
At the end of blog there is a link given to download the excel sheet which is not functioning. From where can I get that excel sheet.
Regards
Varun
Bengaluru
Glad you liked it, Varun. Can you try downloading it from another browser?
Hi Karthik,
great post. I have become more interested in the maths of it compared to how to make the money. 🙂
I think there is a typo in the part delta to implied volatility.
Nifty is at 7794 and the strike price is at 6800 PE, the fall should be 994 points. the corresponding drop is 12.75 %
Could you also mention the reference materials used for making this entire blog. I would like to dig deeper into this.
Regards
Gourab
Gourab, thanks. Let me check into this. For ref material – I\’d suggest you pick up this book by Sheldon Natenberg on OPtion Pricing. Gives you a clear understanding of option pricing and associated topics.
Sir
1.you said \”buying options may still be ok compared to selling options,when iv is low,why is it so,sir?
2.Sir,atm options have higher chance than otm in case of expiring itm,but still atm iv the lowest?why
3.delta has an effect on lower range of options around atm,and it\’s influence increases when iv increases.Sir,when iv increase, influence of every options remain same, isn\’t it?
4.Sir,is vix and iv published by nse for diff strikes the same,or is it diff?
5.Sir you said \’ATR indicator to get a sense of where the volatility is\’,so can identify present IV for a particular stock is high or low,if it so how can I find it through ATR?
6.Sir,realised volatility is calculating future volatility by taking the historical volatility into account,is it so?
7.\”high option iv,low profit potential\”why it is low profit potential, actually it has to be high profit potential,right,coz when iv is high,risk is high so reward has to be in par, isn\’t it so?
8.any app or site which have live volatility cone in which one can input option strikes to know whether they are over or undervalued?
9.sir,any particular reason why iv in the options chain is Annualized 1 SD
10.Sir,You said”to conclude that the present IV for a particular stock is high or low,you need to calculate daily historical volatility and convert it to annual volatility and compare.”
a)by present iv,is the iv given for each option strike is being discussed here,if yes,is that iv annualized?
b)sir,is annualized historical volatility figure published on nse website or anywhere else?
11.Sir,as the volatility of nifty for last 15 months is given as annualized,when SD is calculated of those,will SD be equal to Daily volatility,i Ask this coz prev chap you said Daily volatility=SD,if it is annual or daily,we have to multiply or divide it with sqrt(10,20,etc) day windows for the next table?
12.Sir,you said the data points in the table just above Volatility cone graph is calculated using R-language,sir where can we access it,or, is live market volatility available in any app or site also in which one can input option strikes to know whether they are over or undervalued?
13.sir,\”large range of options around ATM are sensitive to spot price changes, when volatility is high.\”sir,why is it said options around atm, actually when iv is high all options are sensitive to the volatility, aren\’t they?
And also sir,when options around atm is more sensitive towards premium change when iv is low than when iv is high,as the slope of atm options in the graph is more when iv is low,is it true sir?
1) Low IV implies a lower premium, and options are priced cheaper. Hence buying should be ok.
2) Demand-supply imbalances
3) Yes, but as I mentioned, strike-specific demand and supply imbalance matters
4) Vix is only for index
5) Apply the indicator on the option chart, not the best technique, but works
6) Realised vol is same as historical vol. Check my video on this – https://www.youtube.com/watch?v=JM_M1RPkCR8&list=PLX2SHiKfualEyD05J9JsklEq1JFGbG6qJ&index=9
7) Have explained this in chapter
8) Check Sensibull
9) Vol is always annulaised, just like returns
10 a) yeah, you can check strike specific IV
10 b) I think they do
11) Vol is annualized, i.e. 12 month, so it will drop when you bring it down from 15 to 12 months
12) Not sure, please check Sensibull
13) Have explained the chapter itself.
Please Help in selecting correct strike price …
If you also write then how do you select?
Sunny, I\’ve explained this through the chapters. I\’d suggest you check the later chapters.
As you had said that in @delta vs implied volatility (((When IV is low (20%), the delta gets flattened at the ends (deep OTM and ITM
options). This implies that the rate at which Delta moves (further implying the rate
at which the option premium moves) is low. In other words deep ITM options tends
to behave exactly like a futures contract (when volatility is low) and OTM option
prices will be close to zero.)))) ..SIR …BUT the IV is low in ATM OPTIONS as we compare with OTM & ITM.
But then, the delta too matters right?
Hello Karthikji,
Again Sunny here.
Please help in calculation of cone table, as after collecting data of back dates of Jun-14,july-14 and all, final value is varying as shown above.
It will be helpful if you could explain with excel sheet.
Sunny, this was prepared by someone else; unfortunately, I cannot establish contact with the person. Let me try again.
Hi Karthik sir,
How \’Annualized Realized Volatility\’ calculated for JUN-14, JULY-14…. in above table for 15 month.
You scale the volatility by Sqrt of time. So if the daily vol is 1%, the annualized is 1%*sqrt(252), where 252 is the number of trading days in a year.
Sir,then what about Vega of itm options being bigger than atm options?
How is it bigger ?
Theta decay is common for all options. With ITM, the fear of option transitioning from ITM to ATM adds as a factor along with theta decay which works against ITMs (albeit at slower rate).
Hi,
1.Sir,you said \”If you initiate the trade when high implied volatility of options,it incurs high upfront costs and also lower profitability potential,Meanwhile low option implied volatility,lower costs and higher potential profit.\”
But,Sir
Low volatility means low risk,so low risk often corresponds to low profits,that is the natural trading law, isn\’t it so?
2.why do slightly otm options react more towards volatility than deep otm options and also what makes Vega of itm options higher than atm options
1) Low vol also implies lower premiums. So it depends on what you intend to do. For example, buying options may still be ok compared to selling options.
2) The closer to the ATM option, the higher the probability of the option transitioning from OTM to ITM, hence more reactive.
Hi Sir, Did you find it ? I am developing a checklist for intraday trading! Volatility plays a major role in my setup
Ah no, I\’ve not got a response yet.
Thanks a lot for the clarification, Please find out the method and do post it here, It will be really helpful.
Sure. I will.
For 10 day (Volatiltiy Cone):
Exipiry is on 26 June 2014,
1)Which Data set Should We use?
1) 13,16,17,18,19,20,23,24,25,26 (Trading Days prior to Expiry)
2) 16,17,18,19,20,21,22,23,24,25,26 (Days prior to Expiry)
2) What Chart is displayed in the Notes ? (Volatility Cone)
Spot or Futures ? If futures, Can you please mention the name?
3) What Method is used for calculation ?
Method 1:
1) Calculate Daily returns [ (B3/B2)-1 or =LN(B3/B2)]
2) Calculate STDEV for Daily Returns
3) Volatility = STDEV*SQRT(252) [252 or 365]
My Answer = 15.42% [In your method 41%]
Method 2:
1) Calculate Daily returns [ (B3/B2)-1 or =LN(B3/B2) or LOG(B3)-LOG(B2)]
2) Calculate Variance for Daily Returns
3) Find Volatility for 10 days by SQRT(Sum of Variance)
4) Calculate Annualized Variance by multiplying Days
5) Find the Annulized Volatility by SQRT(Annualized Variance)
My Answer = 15.42% [In your method 41%]
What method did you use ? (It would be really helpful for all if you share the method in small steps)
1) You can consider the trading days
2) Spot
3) I need to check this with the author of that section. Let me try and find out.
SIR, I used the STDEV, But I am confused, Like Do I need to take only trading days or all days, The calculation doesn\’t add up for me. Could you please check this excel and comment me where I am wrong?
https://docs.google.com/spreadsheets/d/1jbDPSQS-y00zhum_I49d8MDqhxBTan8FbttxVSgHJKo/edit?usp=sharing
You can consider the trading day, Goutham.
Sir, Can you please explain how did you calculate Annualized realized volatility? I gathered June 2014 data and it no where matches your percent. Please kindly explain sir.
You can use the =STDEV() function on excel for this.
In section 20.4 – Delta versus implied volatility , Volatility means VIX or IV because according to Volatility Smile Implied Volatility are not same different strike price Like ITM , ATM , OTM and in this section we have fixed the volatility at 20% and 40% for all strike price
Referring to the IV of the strike.
Sir,
1.How does the profitability greatly reduces when implied volatility is high 2.Sir,what exactly is realized volatility and also diff between historical realized volatility and historical volatility?
3.are the percentage values given in the table just after the nifty chart(20.2),after multiplying with 252 as they are shown to be annualized realized volatility?
4.Sir,how are the data points given in the table above the volatility cone graph calculated?
5.\”Sir why options of the same underlying, expiring on the same expiry day are said to have similar ‘IV\’s.\”
Why is it said that theoretically,they should have similar\”
6.Sir, any reason why implied volatility of the ATM option is the lowest.
7.Sir,According to you, how well has volatility cone helped you in your trades
1&2) I\’ve done a video on this, please check – https://www.youtube.com/watch?v=2hmF5gqKEUg&list=PLX2SHiKfualFiusiT9G5uE9jU3vetvW2x&index=10
3) Yes, they are annualized
4) This is an output from a program developed in R language
5) Because the factors that affect these options are all the same
6) One explanation is that the ATMs are most liquid and there are no wide spreads owing to demand and supply mismatch
7) I cant attribute the Vol cone as a single reason for a successful trade outcomes, it is one of the factors that help.
am unable to download volatality cone excel
Madhu, can you try downloading in another browser?
unable to download volatility cone excel….
At atm / otm the intrinsic value of option premium is 0 so time value itself is premium, So is there any formula with which we calculate time value if we don\’t know the premium value ?
If the option is OTM, you can attribute the entire premium to time value.
Hello sir,
Is there any relation between vix and option premiums in terms of pricing as when vix is higher ,premiums are higher and vix is lower ,premiums are lower, i wanted to know that how premiums are decided , is there any calculation let\’s say VIX is 18 so premiums for nifty at atm straddle will be XYZ…
Thanks
Yes, there is a lot of connection between Vix and option premiums. Do read this module further to know about it.
In my calculations I am getting negative -1 and -2 SD levels for annualized volatility. Is it possible theoretically? and does it has any practical implications? How do I interpret negative volatility?
Hmm, can you recheck the numbers again?
Just a quick question
I calculated and plotted Volatility cone for Bank Nifty. Currently Bank nifty is at 40800. For the next weekly expiry (29 Sep 2022, expiring in 10 days excluding holidays) I checked option chain and realized that one strike 37800 has IV of 29. As per my volatility cone calculations this IV level of 29 is beyond +2 SD levels that a option contract has in general when there are 10 days left to expiry. So here I should be designing shorting a volatility trade. am I right or something is missing here?
If this is correct then what should I short? a call option or put option? spot is 40800 so 37800 CE is deep ITM and 37800 PE is deep OTM. what to short? CE or PE? (Sensibull shows same IV for same strike of CE and PE)
Also, we are comparing IVs of single strikes (like IV of 37800, IV of let\’ say 40000) with data from volatility cone. Is that correct way to do or I should be checking only ATM IV?
Yes, if you are expecting the volatility to come down, then you should look at shorting options, but that said, I\’d not advice you to short ITM options. Yes, you can compare single strike IVs with the underlying\’s volatility.
Hi sir,
Can u please explain how IV crush and IV spike works and how to use them,
Thanks
I have put everything I know here 🙂
Hi Sir,
One clarification please on the chart of Delta vs Implied Volatility. For the Put section, it looks like you have reversed the delta values. As 175 is ATM, 200 would be OTM for put hence Delta would be closer to Zero and vice versa when Spot is 150, the delta would be close to -1. Please correct me if I am missing anything here. Similarly for Call as well, 135 would have Delta Closer to Zero and 200 will have closer to +1.
Sir
Before plotting the graph of volatility cone, you have shown 15 months nifty chart.
Sir
How you calculated ANNUALLIZED REALIZED VOLATILITY of all the expiry date.
Was that just through calculations or you have just plotted the data from nse website.
Sir, I\’ve studied in previous chapter where you have showed how to calculating the
Annuallized volatility of stocks or if nifty 50
With the help of standard deviation and average percentage change.
Yash, annualized realized volatility is just the historical volatility. I\’ve explained this in the chapter itself.
I want to ask you that can I put stop loss in the BTST Option Trading. In other words, say I bought Nifty Strike Price CE @100 and want to put stop loss @95 and will hold this position as I have belief that the markets will open gap-up. Can I do so. Can I put stop loss for tomorrow but at the same time when I am buying such CE.
YOu can use GTT for this, but only for Index (Nifty + Bank Nifty) options.
can we put stoploss in BTST option trading?
Yes. Place the SL the next day.
Hello Karthik!
In the volatility cone section, when you calculated the table for 10, 20, 30, 45, 60 & 90 day windows, we can see a trend in max volatility. Max volatility seems to be decreasing for larger time frames and I\’m unable to comprehend this. Shouldn\’t the larger time frames capture larger volatility days also? I\’m thinking that more data points for volatility should imply more days with high volatility. Also, if max volatility in 10 days frame is 54%, shouldn\’t that be the max volatility for 90 days frame also?
Please let me know where my understanding is wrong.
Intuitively yes, but let me try and get an explanation for this. Btw, that section on the Volatility cone is authored by someone else, so I need to get his perspective.
Hii sir, I couldn\’t download the volatility cone excel file. If you have it kindly send me. Thanks
Can you try from another browser?
Sir I am unable to understand anything after theta module. Could you please make more comprehensive videos as I\’m sure for most of the people understands better in a video format. If not, could you please suggest some good video sources to understand option greeks?
Do check these videos Nikhil – https://www.youtube.com/watch?v=-mO0YOTcCiQ&list=PLX2SHiKfualFiusiT9G5uE9jU3vetvW2x
Hi, \”Download the Volatility Cone excel\” link not working to download the file.
Very true! Very honest !
Thanks Sir!
Sensibull seems to have everything an options trader seeks,but we have to pay for their pro plans wherein their expert advice is also available. Shall I go ahead? You have taught us a lot and without your nod, I dont want to do anything.
Regards.
AShutosh, people at Sensibull are good friends of mine. So if I yes, it may come across as a biased opinion. Please do look up reviews, ask people, and watch their content on youtube, if you like it then subscribe 🙂
Volatility cone is a very interesting concept – I cant guarantee, but we will try and develop a web based tool for this sometime soon.
Is the tool out now?
I am asking a question out of context. A friend of mine called me to buy CE-BANKNIFTY for 35000 strike. Expiry June 9th. The premium to be paid 350.
The call actually hit the target of 450++
Can you explain the logic?
Pl feel free to not to reply if you dont feel like so.
Hats off to you for your great effort that would really make us pros.
Regards. Ashutosh.
Ashutosh, check this, they may have volatility cone – https://sensibull.com/
Got it. Several readings needed. Thanks! Grateful to you for your patience and hard work.
Cheers! Hope you continue to enjoy learning on Varsity!
Right now,Nifty is at 16655.
ATM STRIKE–16600
DELTA–0.53
Iv–18.6
Theta. -13
Vega. 9
Yama. 0.001
Dear Sir;
When these modules were written,there was no sensibull and no greeks calculator with the option chain showing us the live run of the greeks.
Kindly write a note as to what do we make of the current situation? What is the inter relationship of the greeks?
Regards. Ashutosh.
The option greeks science remains the same as before and in the future too 🙂
Sir – 1st a lot if thanks for your invaluable resources out here. I could have posted these under Calender spreads, but I felt & we are dealing with Greek interactions along time…
1. Say we have 2 Lots each, Short Call & Put positions, Atm, current expiry.
2. Also have 3 Lots each, Long Call & Put, positions +/- 1 Atm, Next expiry.
( The net positions have a Positive Theta & Vega. )
Q1. What best adjustments can be done if the underlying has crossed the Long Call, 2 days still to near expiry.
Q2. What can I Sensibly do with the long positions after the near Expiry, with the Short positions ending with a net loss.
Bi.
Punam, this is a complex set up. The question is adjustment wrt to what? are you trying to adjust for staying delta neutral or trying to do something in order to recover your losses in short position? If its delta neutrality, then its straightforward, but complexity is with different month expiries. If you want to recover losses, then you have to probably look at long futures in current month, because tapping into next month\’s contract leads to buying expensive options.
Resp Sir,
Cant we barter any other indicator for such complicated math in relation to Volatility and greek interactions? You put it up in 2015, and now even the Kite in association with Sensibull gives us ready reckoners!
Hats off to you for your labour and the easy explanations.
Indicators such as Bollinger bands and ATR are based on volatility. You can give that a try once 🙂
Hi Karthik sir,
in volatility cone calculation excel sheet,
1)In sheet 1, x1- where u have calculated daily return then u did (x1-mean)^2
here (x1-mean)^2 – what its meaning and u took mean=0, why?
2)march12 sheet: =SQRT(1/B$5*SUM(OFFSET(Sheet1!$E$2,MATCH(Sheet1!$N4,Sheet1!$A$2:$A$504,1)-1,0,-B$5)))*SQRT(252)
can u plz explain what is the formula doing.
I understood historical calculation in previous chapter and but this volitility cone calculation is tricky, plz explain sir
Pavan, even I\’m not sure as this is done by someone else. Will try and get its explanation.
What is difference between Historical Volatility and Realized volatility?
Both are the same.
Hi , I am getting confused with the excel functions while calculating the volatility cone. =SQRT(1/B$5*SUM(OFFSET(Sheet1!$E$2,MATCH(Sheet1!$N5,Sheet1!$A$2:$A$504,1)-1,0,-B$5)))*SQRT(252)
Could you please explain this to me.
Hey,
Upon downloading the excel file fro the volatility cone I can see that the Cell- F has the implied volatility where its value starts after 250 days but it does not have any calculations in it. Could you please be nod enough to share the calculation of the implied volatility as mentioned in the excel sheet.
Thank you.
Satyam, I\’ve not developed the volatility cone on excel. I\’ll pass your query to the person who developed this. But from what I can guess, maybe it is a yearly average?
Sir,
May I know how the annualized volatility of various months have been calculated?
I have been trying to deduce the logic based on the previous chapters i.e.,
=ln() – for daily returns for 10 days
= stdev() – for daily volatility for 10 days
= stdev()*sqrt(252) for annualized return
May I know where did I go off track?
Instead of 252, use 22 or 30 for monthly volatility.
The concept of not shorting ATM option holds to be true as Gama here high meaning delta will change at a higher rate leading to change in premium at a high rate,However if as a seller I wish to play with premium amount rather than waiting for expiry to receive the entire premium amount and have a bearish view and is am convinced that there will be a huge fall as a seller of a Call option then can I do so ??Of course risk will be high but with a high reward ratio.
Guide for the same
Thanks in advance!!
You answered it yourself, the risk is higher 🙂
Do we have any platform to view the Volatility Cone or do research about Volatility or do we have to do it manually?
And if manually, guide a bit on how to start. Thanks!
I think Sensibull provides this, please check with them once.
couldnt understand the volatility cone calculations tried going through excel sheet but couldnt get the calculation for different days of expiry
1. The 10 days before expiry means, 10 days on the calendar (or) 10 trading sessions?
2. I calculated the LN returns for 10 trading sessions, then I used STDEV function for those returns.. then to make it Annualized volatility I multiplied Standard deviation (which I calculated using the LN returns) to SQRT(252). what\’s the mistake I\’m doing ? I didn\’t get the value shown there.. please help me out Man!
1) 10 trading session
2) You need to convert the 10 trading session volatility to daily, and then convert the daily to yearly. YOu can directly take the 10 trading session data and scale it to yearly.
Good luck.
Hi Karthik,
Can you upload the spreadsheet of Volatility cone and confirm on uploading ?
The current spread sheet uploaded at the end above Key takeaways from this chapter seems to have some issues and even the spreadsheet seems incomplete – Cell D4 and subsequent cells has a formula that is linked to J5 cell and subsequent cells which are empty.
I dont have the spreadsheet for that actually.
1.The Annualized realized volatility calculated for 10 days before expiry are actual values or assumed values ? because while calculating it I Get a value less than the value shown for the same time mentioned here.
2.while calculating annualized volatility 10days before expiry do we need to calculate actual dates or only 10 trading sessions?
3.while calculating the Annualized realized volatility first we calculate the log returns for 10days & use Standard deviation to the returns & then muliply it with sqrt of 252.. right? that what I did but I didn\’t get the values shown there…
1) Its the actual data not assumed
2) For 10 days
3) Thats right. Maybe you are missing out on a small step somewhere. Why don\’t you recheck step by step?
I have some data for option contract
Nifty 18700 CE 31st March Expiry
Date Strike type Delta Vega Theta LTP ATM IV Nifty Close
25-Mar 18700 CE 0.01 0.48 -1 1.5 19.5 17153
28-Mar 18700 CE 0 0.21 -1.2 0.75 21.3 17222
So combined effect on premium will be something like this-
comparing 25th & 28th March data
on 28th March
Nifty gained 69 points so
increase in premium owing to delta = 0.01*69 = 0.69
Nifty ATM IV increased from 19.5 to 21.3 i.e. 9.23% increase in volatility.
increase in premium owing to Vega = 0.48*9.23 = 4.43
Decrease in premium owing to Theta = -1
combined effect of Greeks on premium = (+0.69)+(+4.43)+(-1) = +4.12
Final premium = Initial premium + combined effect of Greeks = 1.5+4.12=5.62
but as we can see in table above premium closed at 0.75 instead of our theoretical value of 5.62.
Please clarify this. Is there anything else that affects option premium or am I missing something here?
Yes, but what you need to remember is that this works on a real-time basis and keeps changing as the markets move.
Where I can get historical realized IV data for plotting vol. cone? with different time windows before expiry
You can calculate the historical volatility on excel. I\’ve shared the steps.
Karthik,
link for Volatility cone excel sheet.
Please.
Thanks, Karthik for such a wonderful course material and your enthusiasm to make us understand!
From the Delta Vs IV can we infare that we should look for opportunities of shorting the option closer to the expiry, with Higher IVs to get better premium earning.
That\’s correct Jay. By doing so, the odds of retaining the premium is higher 🙂
Hello Karthik,
thanks for all knowledge you shared,
Till this chapter all were easy and understood well but this going above head already read 2time,
please share link for volatility cone excel sheet
practical experience might help me in understanding this chapter.
Thanks alot…!!!
Sunny, it takes a bit of reading and trading experience to get a full hang on this topic. But it will happen soon, keep at it 🙂
Sir, I am unable to download the excel sheet of volatility cone.
Akshay, did you try another browser? If not, i\’d suggest you do. Thansk.
Thank you! 😊
I have noted down some key Greek related points here.
1) Delta vs Spot: Delta acceleration, time to expiry
2) Gamma vs spot
3) Theta vs time to expiry
4) Volatility vs option premium
5) Volatility smile and volatility cone
6) Gamma vs time (from angle of ITM, OTM & ATM options)
7) Delta vs implied volatility
please add key point if I missed any!
Looks good, you seem to be lapping up options quite a bit 🙂
Good going!
Sir what are your views on Implied Volatility Percentile and IV Rank?
Can we use that to get view on current market IV?
Yup, you can use that.
how to get data to plot volatility cone and is there any website i can do that ?
YOu can check with any authorized data vendor for this, Ayush.
I do understand tye concepts explained here. But I am not getting one thing- How will I apply it practically?
It takes a bit of practice. Start small, try and see if you can get these theta trades right, these are the easiest to execute.
hi Kartik,
Annualized realized volatility which u calculated based on different times left to expiry here for volatility cone, is it based on the method u taught in the previous chapter ??
Sarvesh, yes, there is only 1 way to calculate volatility.
I am not able to understend (+1,+2,-1,-2) SD though i already read all the previous volatility chapters can you please describe me that calculation.I am not able to open excel.
Harshil, I\’d suggest you watch the Khan Academy video on normal distribution. YOu will get a good understanding of this topic.
\”For instance as of today, Nifty is trading at 7789. Suppose the current implied volatility of option positions is 20%, then a 7800 CE and 8000 CE bull call spread would cost 72 with a potential profit of 128. However if the implied volatility is 35% instead of 20%, the same position would cost 82 with potential profit of 118. Notice with higher volatility a bull call spread not only costs higher but the profitability greatly reduces.\”
this part- Here using bull call spread there will be two strikes- one buy and one sell. so you said having 35% IV instead of 20% will cost us more and hence decreasing our profit potential. Please explain this! How you calculated 20% as single IV for total position when we have separate IVs for both strikes and how would I know that IV will increase of decrease (to wait or to not wait to take position)
From Sensibull:
What I am seeing right now is both strikes (one which has to be bought and one which has to be sold) have different implied volatilities. Here are details:
Bank Nifty Spot: 36430
(Buy leg) BANKNIFTY 3rd MARCH 36400 CE implied volatility=30.8
(Sell leg) BANKNIFTY 3rd MARCH 36900 CE implied volatility=29.8
how do I know the total implied volatility of my position(as you calculated as 20% or 35%)
Yes, each strike has its own IV. Its a common practice to consider the market IV as a whole to figure how the options are moving. Higher the market IV, higher the premium and vice versa.
unable to get this point! How initiating trades at high implied volatility will incur me higher costs and vice verse
\”Consider this – you are bullish on stock and want to initiate an option strategy such as a Bull Call Spread. If you initiate the trade when the implied volatility of options is high, then you will have to incur high upfront costs and lower profitability potential. However if you initiate the position when the option implied volatility is low, your trading position will incur lower costs and higher potential profit.\”
Dhananjay, higher the IV, higher is the option premium, which means the cost of purchasing the option is high. Lower the IV, lower is the cost.
Sir how do I plot IV on volatility cone. Please guide.
The calculation for realized volatility for NSE is for \”price\” or for \”Daily returns\” ?
Can you elaborate that, please?
Respected sir,
Firstly i am very thankful to you for giving such beautiful knowledge.
could you please tell me how u calculate the 1 sd and 2 sd in volatility cone and how one can plot this graph.
VInay, the calculation is not from me so I don\’t have access to the calculations.
Hello Karthik,
I have read all the comment for the same problem which I am facing now. Regarding the how the calculation is done in the excel sheet. I know you have answered it many times in this comment section that somebody else has authored this section. I am stuck on it for last couple of hour. If the author who had prepared it can explained it and that comment can be pinned here. It will help many of us. All the last section were smooth as the explanation was great. Thank you very much for bringing this in depth learning material is simple language for us. Will try for some external link as well on this to understand it.
Vijay, the only problem is getting this person\’s time. I\’ll try my best again.
I takeaway no 6 .
Shouldn\’t it be applicable only for call options rather than for both put and call.
No, its applicable to both Dinesh.
I would suggest you draw your attention to the Delta versus IV graph and in particular look at the Call Option delta when implied volatility is high (maroon line). As we can see the delta does not really collapse to zero (like the blue line – CE delta when IV is low). This should explain why the premium is not really low. Further add to this the fact that there is sufficient time value, the OTM option tends to have a ‘respectable’ premium.
In the above paragraph , maroon line is mentioned but the only lines in graph are blue , red , green and purple. Where is maroon ?
I see the first line colour as maroon 🙂
Now, going back to the initial thought – why is the 6800 PE, which is 1100 points away trading at Rs.8.3/-?
Well that’s because 6800 PE is a deep OTM option, and as the delta graph above suggests, when the volatility is high (see image below), deep OTM options have non zero delta value.
In the above paragraph shouldn\’t it be deep ITM option for put call that is non zero ?
Nope, its deep OTM right?
can you please restart the \”Download the Volatility Cone excel\” link.
Hi Karthik,
Thanks for your contribution in education us!
It is about volatility cone, the option 8200 CE from 2nd set of dots from left (i.e. 43 days to expiry) is experiencing high IV which is higher than max value at time. In case, if I short this option by thinking that the premium would cool off after sometime and holding that option until it reaches to 10 days to expiry, there is a possibility that the option 8200 CE (which I am holding for 33 days) could shoot up higher premium value than the price I bought because 2nd SD of 10 days to expiry line(maroon line) is higher than the price I bought and I could end up in loss right ? is this my understanding correct or educate me if I am wrong ?
Thanks,
Lingam
That\’s right, adverse price movement is a risk.
How to make calculation and plot chart as shown in fig. 20.2 can anyone help with M M.S. Excel samples?
No need to calculate, the system will do that for you Vipul.
//We can also calculate mean and variance of the realized volatility, as shown below –//
Karthik Sir,
Could you explain how you derived the table?
Biju,
Mean = average volatility
Variance = Plus or minus 2 standard deviations of the average volatility
Hi Karthik,
how was the volatility for nifty calculated?
i am currently doing the following but getting diff results for the same time period:
1. calculate the daily returns of nifty on close-to-close basis in % for a period of 10,20,30 etc days before expiry
2. find the std of this data
3. multiplying this by sqrt(252) to get the annualised volatility
4. finding the min,mean-2*sd,mean-sd,mean,mean+sd,mean+2sd etc
when im doing this i seem to have got negative volatility for mean-2*sd which is the first sign that the calculation is wrong somewhere
on comparing this for the time period mentioned in the above table , im getting different values
for ex : june 14 mentioned above is 41% whereas im getting 19.5%
where am i going wrong?
If you are calculating 10/20/30 days, then you will have to convert it to daily vol and then multiply it by 252 to get the annualised volatility, right?
Sir, is there any problem if the boxes overlap each other while calculating 45,60,and 90 days realized volatility, and did you multiply the the realized volatility by the number of trading days in a year or the trading days of last 15 months(in the example), please reply thank you.
Ah Praveen, as I\’ve mentioned in the chapter and comments, this calculation is by someone else, not me 🙂
I am unable to download the Volatility Cone sheet. Can you help me where can I find that ?
Search for the download keyword in the chapter, Vamsi.
Hi,
We can calculate the IV of every strike by using B&S formula but how to calculate the overall IV of a particular underlying . eg TCS has 60% IV ,
Is there any different formula we use?
2. We didn\’t talk about how to calculate historical IV , is historical volatility and historical implied volatility are same ?
3. Do we have any short discussion on IV rank and IV percentile ?
ATM strike IV is applicable. YEs, realised volatility is historical volatility. Dont think we have discussed that bit in Varsity.
Hi
you really do not want to be shorting “ATM” options, especially close to expiry as ATM Gamma tends to be very high. This statement under Gamma Vs time .
Suppose , I short a nifty lot at OTM option a month ago and spot price has gradually increasing which leads to OTM transition to near ATM option as I close to expiry , so should I square off my position before expiry as we know gamma tends to be high close to expiry and it can adversely affect me or should wait till expiry .
Yeah, it is always a risk carrying ITM/ATM shorts. That said, I\’ve seen traders hold through ATM shorts purely based on their directional conviction.
Hi,
It means that today 8200 CE is experiencing an implied volatility, which is higher (by +2SD) than the volatility experienced in this stock.
Didn\’t get The last line of the above paragraph
Yes, you can compare volatilities across the time periods.
Hi,
The good news is, you can do it not only across different strikes of a security but also across different securities as well.
This line has given under volatility cone .
I don\’t understand the meaning of \” across different securities as well \”
Like we use the realized data of any security or index .
If I take realized volatility of nifty index on volatility cone , can i place a implied volatility of TCS , SBI or any other stock on volatility cone .
My Second Question
We plot implied volatility on volatility Cone from Option Chain, I Want to Know which implied volatility Will Make More sense on volatility Cone ,
1. from Option Chain
2. By calculating The implied volatility from B&S formula , or Trail and error method.
As I Got to Know , Option Chain implied volatility is Wrong calculations
I\’d prefer to get the volatility from reverse-engineering the B&S model. Basically, you feed price and get the vol. Check this – https://zerodha.com/z-connect/queries/stock-and-fo-queries/option-greeks/how-to-use-the-option-calculator
Karthik Sir ,
Yesterday , You Told me Take monthly data to calculate volatility of The Contract , That mean I can take last One Month closing Price of The nifty Index and can Make volatility Cone .
1. With The last One Month data can I plot Implied volatility of nifty Option Contract That expire after One week , cause nifty Option Contract expire Every week
\’That mean I can take last One Month closing Price of The nifty Index and can Make volatility Cone \’ —> Yes, but ensure you are taking daily close. By the way, I don\’t know if I mentioned, earlier, but I\’m not the one who did the math for the volatility cone, so I may not be the best person to explain this.
Hi,
Similarly a black dot near -2 SD line on the graph, is for a Put option. It suggests that, this particular put option has very low IV, hence low premium and therefore it could be trading cheap. One can consider designing a trade so as to buy this put option.
I don\’t understand Above stated lines , buying a Put Option Means We Have a bearish view on The Market , and if IV is Low at -2SD then We can expect that IV volatility Will increase over The Time , I think We should either Sell Put or Buy a Call this Time as we Have prediction IV Will increase so Does Premium .
Remember, the option premium is not just a function of price change. It also moves based on time and volatility. So this is a play on volatility.
Hi,
I am confuse with One Thing like if I Want to Know The nifty volatility for The next Seven Days ,
Will I calculate it with historical Methods or realized method. In historical method We Take logrithim , mean and SD but in realized We Take , logrithim , sqrt of variance , mean and SD .
which method give More accurate Information for Daily volatility of NIFTY.
Both are similar, if the data is for a long look back, use log. Else just the regular method is fine.
Hi,
Like in volatility Cone We Take Time frame 10 , 20 , 30 , 45 and so on . If I Take a Bank nifty or nifty Index as They expire on every Thursday of The week . Does The Time frame Will be same 10 , 20 or I can alter These frames like can I take 5 , 10 , 15 and 20 so on
You can alter, but I\’d still suggest you use monthly data and the volatility will be very similar across these contracts.
Hi,
Can You arrange a Call for me from the Expert , who has done all these calculations
Not possible, but I can share your query with him and try to get a response 🙂
Hi,
I opened the excel Sheet of volatile Cone.
1st Sheet is About TCS closing Prices but I don\’t understand 2nd Sheet , the data which has taken about TCS or Nifty.
and I am not able to calculate the Values Under 10 , 20 , 30 and so on..
Example..
for March 12
Start date – 24/02/2011
End date – 23/02/2012
Values Under 10 Days to expire the contract are
24 – feb -11 = 0.286763
31- March-11 = 0.265203
and so on
which formula did you guys use to calculate the above value .
1 . Did You Take the closing Price from 24feb11 to 23feb2012.
2. it is a square root of Standard deviation.
This calculation was actually done by someone else, not me.
1) Yes, its the closing price (not sure about the time frame)
2) Must be Sq rt of variance (need to confirm)
Hi,
Trader can design trades to take advantage of ‘mispriced’ IV. I read this line above under volatility cone.
My question is about when we get the value of implied volatility on option chain , why do we need to calculate again because the data published by NSE on implied volatility can be \’ mispriced\’ than the volatility we calculate..
I\’m not sure if NSE\’s IV is accurate on a real-time basis. Also, NSE\’s measurement of volatility is mainly in terms of estimating margins.
Karthik Sir, I understood x- axis and Y – axis ..
My question about call and put .
How did you place those set of dots.
When there is 12 days left for expire to near month contract .
We have to calculate the mean, variance , SD for 12 days as well .
1. Suppose I am done with those calculations for 12 days but I am wondering there is 7 line in volatile cone and there is 6 dots for 12 day expire .
2. If those set of dots not about calculation of mean , SD and so on .
So, did you place those dots for call and put , when there is 12 days to expire the contract.
3. Suppose, I will be able to make that volatile cone , but how to put blue and black dots on that cone and how to select the strike price like you took 7800 CE and 8000CE and 8200 PE
Got it. I suppose this is for the ATM strike but I need to clarify this myself. Let me check with the author of this section and get back. Thanks.
Hi,
I am bit confused in volatility Cone , on What calculations you graphed the Call and Put dota.
Like , I understood the x-axis line , it means 12 days left to expire the Option but I don\’t understand y – axis , if we check those dots , They are at near to 35%, 40 % and so on , why First set of dots not plotted Below The 35% .
Overall, I mean on what basis those set of dots plotted .
Are they according to Strike Price , if they are like You mentioned 7800 CE, 8000 CE and so on .
but There is no axis of Strike Price ..
I Hope You Got My Point ..
Y-axis denotes the volatility percentage
X-axis denotes the number of days to expiry.
Look at the graph vertically. For example, when there is 20 days to expiry –
Mean volatility is 30%
Max vol is 50%
Min vol is 12% etc.
Why is the Volatility cone excel not downloading?
PLease try opening this in a different browser. Thanks.
Hello Sir,
In Context To: 20.2 – Volatility Cone
\”Those options which are close to + 2SD line are trading costly and options near -2 SD line are considered to be trading cheap. Trader can design trades to take advantage of ‘mispriced’ IV. In general, try to short options which are costlier and go long on options which are trading cheap.\”
1) Suggest what should be the range of strikes to be plotted on Volatility Cone w.r.t ATM.
2) As suggested if OPTIONS IV ≤ / near -SD2 can be bought irrespective CALL / PUT. Does it hold true for CALL: ITM & FAR ITM strikes as premiums are very high.
Today\’s Observation: Volatility Cone: -2 SD approx. 9.5% for 26 AUG 21 Expiry.
Observed 26 AUG 21 Bank Nifty Strike: 35000 CE PREMIUM: 665 IV: 10.50 & Strike: 34900 CE PREMIUM: 737 IV: 7.91. Can we buy it?
3) What if vice-versa scenario occurs; will hold true for PUT Options also.
Kindly appraise on it.
Thanks,
Nisha Patel
Ideally its 10% above or below the ATM, but given the OI restriction, you may want to just do this on an intraday basis. Yes, this holds true for both calls and puts as well.
Hello Karthik
Is there any software available out there for the Calculations and the Graphs shown above that can be easily accessible or we have to it manually all these things?
Samik, you can try Sensibull for this. They have put up few calculations readily available for users.
Hello Sir,
Suggest if update received for plotting current IV over VC and its applications identifying most appropriate OPTION STRATEGY.
Thanks,
Nisha Patel
For instance as of today, Nifty is trading at 7789. Suppose the current implied volatility of option positions is 20%, then a 7800 CE and 8000 CE bull call spread would cost 72 with a potential profit of 128. However if the implied volatility is 35% instead of 20%, the same position would cost 82 with potential profit of 118. Notice with higher volatility a bull call spread not only costs higher but the profitability greatly reduces.
In this paragraph why does profitability reduces in case of more volatile options as it can swing between the higher standard deviations than compared to less volatile options ( lesser standard deviation).
Higher volatility = higher variance, chances of price swinging lower than the buy price is more. Hence the chance of a higher loss.
Hello Sir,
W.r.t. Volatility Cone:
1) Shared Sample Sheet has 364 Days divided into 13 months with days not as per respective month count.
I have worked out SD\’s @ NIFTY BANK – 364 days but not able to divide into month; kindly assist.
Month 10 20 30 45 60 90
0.146394563 0.186571749 0.233000676 0.216304257 0.225249741 0.269620758
0.282373515 0.244725396 0.246061113 0.252137364 0.236603251 0.301414354
0.248711029 0.230889854 0.261139707 0.23935833 0.299251895 0.354887411
0.244853039 0.212780912 0.350701382 0.34828785 0.359122643 0.37185303
0.522567405 0.42339976 0.407225265 0.434185208 0.431877587 0.38925097
0.400704746 0.343149677 0.445793484 0.424973147 0.3820353 0.350074122
0.512676891 0.464950659 0.397699765 0.34860831 0.341301186 0.312136037
0.188731763 0.188838329 0.277074109 0.250250859 0.243294795 0.265854572
0.398735949 0.316378395 0.276119971 0.25951275 0.283728346 0.28378719
0.175167517 0.215134861 0.283247098 0.2805919 0.276425594 0.283554142
0.384864571 0.338116501 0.310851203 0.306142893 0.295288452 0.291473933
0.265203633 0.273409508 0.279044536 0.27146495 0.291367526 0.267099512
0.286763635 0.28548449 0.298774446 0.281038808 0.265257292 0.272691351
2) Further Calculated below & plotted on graph:
Need Guidance to plot current IV on this volatility cone.
Days to Exp 10 20 30 45 60 90
Max 52.26% 46.50% 44.58% 43.42% 43.19% 38.93%
SD 2 55.63% 46.20% 44.65% 43.88% 42.37% 39.50%
SD 1 43.42% 37.42% 37.96% 36.99% 36.31% 35.19%
Mean 31.21% 28.64% 31.28% 30.10% 30.24% 30.87%
SD -1 19.00% 19.87% 24.60% 23.21% 24.17% 26.56%
SD -2 6.80% 11.09% 17.92% 16.32% 18.10% 22.25%
Min 14.64% 18.66% 23.30% 21.63% 22.52% 26.59%
SD 0.122090326 0.087755939 0.066816761 0.068908954 0.060688313 0.043134054
3) Kindly suggest further can we utilize STOCK/INDEX Volatility cone plotted with current IV for identifying and implementing most appropriate OPTION STRATEGY and how?
Kindly assist
Regards,
Nisha Patel
Hey Nisha, the volatility cone section was authored by someone else. I\’ll try to get his opinion by sharing your message with him. Thanks.
Dear Karthick Sir,
Good day. Plz do make video on Volatility cone. (which data to be downloaded , how to calculate . etc). The excel sheet i have downloaded it., but tracing the Formula is little bit confusing.
Request zerodha Team to help in this regard.
This Chapter is over my head..!!! Phewww
Give it time 🙂
Hi, could you please be kind enough to explain the calculation of annualised realised volatility ?
Here are the steps – https://zerodha.com/varsity/chapter/volatility-calculation-historical/
Please suggest a Video to understand this chapter on a better way.
Please do check Sensibull video\’s, hopefully that will help.
This Chapter is little difficult to Understand
The concept is a bit difficult compared to other topics, Girish.
Thank you Karthik
If you can confirm the logic please? I have downloaded NIFTY daily closing price, calculated daily delta using (current closing price/previous closing price), took stdev of daily delta and in the last multiplied it by SQRT(252) to convert into annualized volatility. This I\’ve done for 10-days window before the expiry.
Here are the steps –
1) Download the daily data
2) Calculate the daily returns i.e. (Today\’s closing price/ y\’day\’s closing price)-1
3) Step 2 will give you an return time series array starting from the 2nd data point
4) On 3, run the \’=STDEV()\’ function (if you are doing it on excel)
5) 4 gives you the daily SD, you can scale this to any time frame you wish.
Good luck!
Hi Karthik,
I\’ve check the NIFTY annualized volatility during 2015 using the 10-days time window prior to the expiry, numbers are not matching. For example, 27th Aug was the expiry date, calculated standard deviation for 13-26th Aug, as follows. The standard deviation is 2.15% and if I multiply it by SQRT(252), it comes to 34.08%, however your calculation comes to 21%. Not sure where I am wrong.
13-Aug-15 0.08%
14-Aug-15 1.93%
17-Aug-15 -0.49%
18-Aug-15 -0.13%
19-Aug-15 0.34%
20-Aug-15 -1.45%
21-Aug-15 -0.87%
24-Aug-15 -6.10%
25-Aug-15 0.91%
26-Aug-15 -1.13%
Neeraj, I\’m really not sure how the difference is coming, will be very difficult to check without actually going through step by step and compare. However, the purpose is served if you know how to calculate.
Was Not Able To Understand The Table of realized annualized volatility & it\’s calculation. The standard deviations part
What exactly is the issue, Manish?
Ohh ok.
Thanks 🙂
Good luck!
Hey Karthik,
The query which i raised above, is it completely unfounded? Or is there any semblance to logic there? Or did i fail to communicate properly?
Best
Your understanding of the volatility cone is correct. However volatility is measured on annual basis i.e. 55% annualized volatility over 10 days means the range is 55*sqrt(10/365) = 9% and 30% annualized volatility over 90 days means a range of 38*sqrt(90/365) = 18.9%.
In other words, the max move one is expecting over 10 days is 9% with 99% confidence and the Max move one expects over 90 days is 19% with 99% confidence
So the expected range is less for a 10 day period than 90 day period.
Hi Karthik,
As we know in spot market stock prices changes as per demand and supply (i.e. as demand volume increases price increases and vice versa).
So just wanted to know that does it apply the same for option premium prices ? i.e. if there is huge buying pressure on particular strike option so will that increase option premium price? or option premium price is only depends on the greeks that we discussed above ?
Yes, the demand-supply dynamics also impact the option premium.
Hello Karthik,
Once again, Phenomenal work. Keep it up!
Looking at the Volatility Cone, i am able to understand the construction of it. But the resulting graph is HIGHLY counter-intuitive. The reason is as follows :
X – Axis : Days to Expiry
Y – Axis : Volatility that has been experienced historically for T-\’x\’ timeframe where T is the Date of expiry.
If we restrict ourselves to just the quartile line-graph(i.e the Max, +2sd, +1sd, mean, -1sd, -2sd , Min dont proceed with plotting the dots) and look at the spread between the -2sd and +2sd, we can say that :
\”With 99% confidence i can say that volatility of options which are about to expire in 10 DAYS time will(should) lie within 8%-55%, and with 99% confidence i can say that volatility of options which are about to expire in 90 DAYS time will(should) lie somewhere between 20%-38%\”
Isnt above statement as good as saying : \”I am more confident on what may happen in next 90 DAYS vs what might happen in next 10 DAYS\” <- This is very counter-intuitive. My intuition says, we should be more confident on what could happen in the near term vs what could happen in the longer term as there are a lot of variables which could play out with each other in 90 days time hence making it even more volatile.
Best
Hello Sir,
1) Sensibull talks about the weekend effect shows a distorted value as the option is affected by the drop in IV.
I did not really understand this hence I am confused.
2) Shouldn\’t ATM options have the highest volatility as one is unsure if the option will expire ITM or OTM.
Why is that ATM options have the lowest IV?
1) Weekend effect is mainly to do with the drop in time value (not IV), Sapna.
2) One reason could be that the liquidity of the ATM strike is the highest, hence the bid-ask spreads and price jumps is the least for ATM. Therefore lower volatility.
Hello Sir,
Can you explain the weekend effect and its relation with vega?
The weekend effect is wrt to Theta, not Vega. Basically, with the passage of time, the option premium reduces, thanks to Theta. I\’d suggest you read the chapter on Theta to understand this better.
Hi Karthik! The excel for the volatility cone is not getting downloaded , i guess the link is broken….Also how do we calculate the realised volatility …and the chart prior to the expiry , were they daily or horuly?
Will check on the download link. About realised vol, you can apply the function \’=stdev()\’ function on the daily returns.
Sir please guide on how to do it
Sir the volatility cone is a very interesting concept but it doesn\’t look scaleable if we were to plot it for all the stocks that are under the F&O category. Is there any other way to find out whether current IV is low or high with respect to past realised volatility, so that we can decide whether to deploy strategies that involve buying options or selling them?
Hence the need to program something like this. Very difficult to manually plot this across all stock, Prashant.
Hi Balu and Karthik,
Did you find you what the missing piece is ?
Hi Karthik,
I saw something peculiar happen on 31st May 2021 on PE option pricing – bank nifty
at 10.23 am i short 500 qty 31000 PE at 5.35 see https://prnt.sc/13mmcga at that point in time BN spot was 35332, ATM IV was 30.3. So if we examine the greeks
delta – PE should loose value as BN gains
theta – PE should loose value at 3.20pm same day
vega – PE should loose value if IV is falling
all 3 happened
BN spot was 35547 (it gained 215 points)
ATM IV was – 27.3 (lost 3%)
now i need to know why the PE prices went upto 6.85 https://prnt.sc/13mmi9t
when delta, theta and vega was against it.
This is the first time i am loosing money being at an advantageous position, my client id is pp6881
Hmm, unlikely. Will check this anyway.
unable to understand how does 1sd and 2sd calculated in this chapter
I\’ve explained this in the chapter itself, Nanda.
Hello Karthik,
First of all thanks for providing such wonderful content.
Doubt – Under the Volatility cone section, how did you calculate the annualized realized volatility for 10 days window (table 1).
I have also calculated the same for the same time period using =STDEV(Daily Return Day-1:Daily Return Day-10)*sqrt(252) (as taught in previous chapters) but it is not matching. 41% in table mine is around 13%.
I work at Microsoft and am familiar with coding so it would be very helpful if you could share the R code or excel sheet for volatility cone calculation.
This section was developed by a friend (I\’ve linked his profile) and he works at microsoft too 🙂
Maybe you should check with him 🙂
Can you please illustrate why gamma shoots for atm option and why gamma tends to zero for otm/itm as time to expiry decreases
Hmm I\’ve tried to explain this in the chapter itself.
Can you please explain the last paragraph sir?
Dear Karthik, If you can\’t, Then do something for us, we can get help to understand it.
I\’ll see what best I can do Hitesh.
Dear Karthik, I understood entire volatility cone excel sheet by self learning, just one thing remains that is \”How to plot near and next month implied volatility\” ?
Hitesh, this bit was actually developed using a program, unfortunately, I won\’t be in a position to help you with this.
Dear Karthik, Please make youtube video on Volatility Cone By Zerodha Team
Noted.
Hello sir, I’m not able to understand the 10,20,30, 40 day volatility calculation..can you share some workings of the calculation or some excel sheet
Mandaar, I\’ve explained the conversion in the chapter otself.
the annualised realized volatility for june2014 in the material is 41% but i have calculated it and it comes 15.92% taking daily closing price of nifty in june..how did you calculated?
Not sure, I\’ve done this by running the standard deviation function on the return series.
I understood all previous chapters n concepts till any one here who can explain me volatility cone excel sheet entirely , need your help
hello sir!!
i am unable to open excel file
Dear Sir,
For Implied volatility which one should be considered? India VIX or IV of individual Option?
Thanks,
Priyanka
IV of options is a better fit.
Hi Sir,
I have drawn volatility cone for Nifty50 for Apr 21 . My SD-1 N SD-2 lines are falling below Minimum line.
If my calls/ puts dots falls below “Min” but above “SD-1” N “SD-2” lines can I take that
IV as very low or the dots should be below the lowest line i.e – “SD-2”
2. As VIX data is for next 30 days and say on 20-03-21 it is
19.9875. So how to interpret it . So this data is till 20th Apr( 20th Mar + 30) or it’s till
31st March (End of the month) , like how will this figure effect the market n in what time period .
3. As I m reading volatility I am curious to know as What number is ideally considered as low volatility and High Volatility . Any platform where we can trade on India Vix .
1) You cant take that IV is very low. It just means its on the lower side
2) Look at the current ViX wrt to historical to get a perspective
3) YOu cant trade ViX. Historical comparison gives a perspective.
Great content with fab explanation Karthik.
Stuck in one thing only, can you please explain how did you calculate the annualized realized volatility.
Is it from the same formula of Historical volatility calculation, If yes than, did you multiplied it with sqrt(10) for 10 days and same for the different time also.
If not than how? 😅
Ankit, annualized realised volatility = Daily volatility * Sqrt(time). Time can be any period like 5 days, 10 days, 10 months or a year.
Might be possible.
if you see today\’s Bank Nifty\’s option chain of calls, we can see a skewed IV smile.
OI build-up is more on OTMs strikes, volatility is more in ITM strikes!
does this all together add to a strong down trend?
Thanks
-Ganesh
Hard to say with just OI interpretation. If there is an OI, then remember there are both buyers and sellers trading these puts and these guys have opposing views.
Hi Karthik,
I was talking about the volatility smile in the option chain we discussed in this chapter.
normally IV smile is spread evenly towards ITMs and OTMS.
but some time volatility of one side becomes much more then other side.
how should we interprete this ?
Thanks
Ah got this. Usually, its not, is this because you have more strikes on one side and fewer on the other? Either way, let me get back on this.
Hi Kartik,
In one of the comments you mention, options can\’t be traded based on charts. Does that mean we use charts only to trade in spot and futures. Suppose market is long trending, can\’t I buy call options let\’s say at ATM. If this statement is true there is no point in understanding candle sticks etc if we want to trade in options ?
Regards
Manoj
Yes, I\’m not a big fan of using charts to see options prices. I\’d rather look at the chart of the underlying asset.
Hi Karthik,
I was revising the concepts and came across the term skewed volatility. how can I interpret skewed volatility in the option chain?
and thank you so much for writing all this.
Ah not sure. Can you share the context, please? Thanks.
Sir,
Although it’s tough to understand Greeks, I have been able to. In volatility cone I have understood but I could get as from where do we get annualised volatility stats for 15 months or how to calculate that % data and for 10-20-30-45-60-90 days to expiry which are yet to come , how do we get their Realised Volatility data …
Dhawal, maybe you should check with Sensibull for the data?
Respected Karthik sir,
Thanks a lot. Trying to understand that there is one more dimension to option premiums. Among all the the modules, the one which facinated and grinded me is \”Greek Interactions\”. I donot know how I can repay you for this free knowlede. After going through your write up on option greeks and interactions, happy to share that I have developed a very good understanding of option price behaviour under various market scenarios. Option price movements do not look strange to me anymore. All because of your outstanding teaching sir. Shir Shastrang Namaskaara.
Regards.
Premakumar Kootagal
Thanks for the kind words, feel very humbled to read this. Wishing you all the very best to you and I hope you find all the success in trading!
Respected Karthik sir,
On Friday I started observing the price of BNF 33200 PE and 38000 CE both 18th Feb expiry. Both delta = 0.03, both vega =3, PE IV = 34, CE IV = 24.
I took took the trade at 9.20 hours sold PE at 35 and sold CE at 33 when BNF was trading at 35880.
At 10:15 BNF fell 37 points, IV fell by 1 percent, PE fell 2 points, CE fell 12 points
At 11:15 BNF went up by 275 points, IV fell by another 1 percent, PE no change, CE went up by 28 points
Theta did not play a crucial role as this was the first day of weekly expiry
My doubt is, when BNF fell, PE must have increased more than fall of CE. When BNF went up, CE must have increased more than fall of PE.
But, kindly see sir, both the conditions were not met. Whole day, PE was rock steady at 34 to 35 but CE was behaving as per my understanding of
Greek interaction. Why this kind of behaviour PE sir?. Totally confused. Kindly briefly explain sir.
Warm Regards
Premakumar Kootagal
Prem, based on your explanation, I assume you understand how volatility impacts these option premiums. But beyond the greeks, there is also market demand and supply situation which has an impact on option premiums. I suppose that this is a mix of greeks (vega) and demand-supply situation working on the premiums.
Respected Sir,
I am posting a request for your comment.
But not able to see the same
Thanks and warm regards
Premakumar Kootagal.
Which comment, Prem. Please do let me know.
Why have we taken \’annualized realized volatility\’ in the first volatility cone table when we are looking for the returns in the 10 day box? Shouldn\’t we take the returns in all the 10 day boxes and then calculates the mean and SD of that data?
Ah, not sure about the logic. I need to check this with the author of this section.
Right thank you sir.
But for example for ATM options, They can either expire ITM or OTM. ATM can move either way and uncertainty is very high. Shouldn\’t its volatility be the highest?
Hmm, but the uncertainty eases a bit as you move very close to expiry.
Dear Sir,
I am still confused about this.
Is implied Volatility inversely proportional to Vega?
IV is lowest for ATM options and increases as we move towards ITM/OTM.
While Vega is largest for ATM options and decrease as we move towards ITM/OTM.
Could you clarify my doubt please?
Implied volatility is an attribute of options, while vega is a measure of that attribute. The movement of vega wrt the ATM/OTM /ITM is just the way IV moves, think of it as its characteristics.
Hi Karthik,
Today (21/01/21) Nifty closed ~0.37% lower and the volatility shot up.
https://imgur.com/a/Wjsqi3k
In this image as you can see, I have chosen a strike price of 14600 Calls expiring at different times. One thing I\’m not able to understand is the difference in the premiums variations.
Here\’s my thought process:
I\’ve chosen ATM option, which means Delta is around 0.5 and the Gamma is inversely proportional to the time left of the expiry of the option (max for nearest, low for the furthest). The Vega is directly proportional to the time left for the expiry (max Vega for longest time left)
Since the nifty has closed slightly lower, and the options are ATM, the Delta doesn\’t have much effect and it is shadowed by the increase in Vega, so we see the premiums shooting up.
However, we see the premium of the nearest expiry (therefore relatively low Vega), has shot up much more than the option with furthest expiry(max Vega). Even though the percentage increase is lower, the absolute increase is also lower for the FEB expiry!
Also, I see that the premium of the weekly option expiring FEB 4 has actually lost some points.
Would you please be kind enough to explain me this?
Thanks!
Raghav, along with the Greeks, the demand-supply situation also has an impact on these option premiums. I suspect that\’s at play here.
Karthik,
Looking back, I feel like Gamma is also a measure of volatility, am I right?
Hmm, sort of 🙂
Hello Karthik,
A big thank you for writing such beautiful articles!!!
I have few clarifications though:
\”Notice this – as you go away from the ATM option (for both Calls and Puts) the implied volatilities increase, in fact further you move from ATM, the higher is the IV. You can notice this pattern across all the different stocks/indices. Further you will also observe that the implied volatility of the ATM option is the lowest.\”
– What is the reason for IV being the lowest at the ATM?
– If the IV is not the least for any stock/index, would would that imply? For instance, as on 29-Dec-20, NIFTY spot is 13932 and ATM is 13900 but the IV in the Nifty option chain is least at 14200 CE and at 141500 PE.
Thanks & Regards,
Ritesh
1) This is the B&S behaviour, Ritesh.
2) This can result due to the supply-demand situation of the particular stock/indices.
Sir, please make a video on how to get this volatility cone using latest price data as the one attached in excel file is related to 2011-12. I am unable to get it with latest data as there are some difficult excel formulas which I cant interpret. Also those formulas should be modify as per google sheet as automatic data of stocks can be pulled in google sheets.
Will try and do few videos 🙂
How to calculate annualized realized volatility?
Multiply the daily volatility with Square root of time i.e. 252 to get the annualized volatility.
thank you for clearing the doubt sir . i read the greek parts twice . earlier i used to just ignore the greeks completely but you have explained it so nicely .thank you sir
That makes sense! Happy reading 🙂
i have one more doubt sir . the 90 ,60 ,30 days before expiry line on volatility cone . if we look from right then we know that the volatily was less when you had 50 or 60 days till expiry and as per those lines we decide that to short the call option or buy a put as it was cheap because both of them were near the 2sd lines and it makes sense ,but these lines are actual price calculations based on the last 15 months price movement . so as the time to expiry started to come down ,the volatility shot up and based on the iv the calls that we shorted they are no longer outisde the +/-2sd zone ,now they are actually close to the 1sd line .so the now call that i had shorted is no longer safe because of the increased volatility . so my question is if you always get this cone then no matter which call you short or put you buy , if you decide to hold it till expiry and the no of days to expiry starts coming down . no matter wat you do will always end up in high volatilty region and it becomes risky to hold a short position near expiry because of increased volatilty .
please clarify sir maybe i am reading this all wrong
i have a doubt sir . the nifty price movement which was the basis for the past 15 month calculation of standard deviation , i understood the first part where you took 10 day before expiry for feeding the calculation , but then you moved to 20 30 60 ,90 days to expiry calculation .how is that possible for eg if for the current month expiry is on 29th nov 2020 and i use the10 days before nifty price (19th nov)for calculation , i have this month\’s volatility or sd and i repeat the same for preceding 15 months .but if i use 50 days will i not be taking into account prices of oct 2020 (from 9th oct 2020) and these october prices i have already used for the october month calculation and for the month before that . my question is as long as days to expiry calculation is less than a month period it\’s okay ,because any period more than that aren\’t we using the same values twice for the calculation of nov month and oct and the same thing goes for the last 15 months ,kind of superposition . please clarify sir . this might be a stupid question
Vinay, I\’m not sure if I understood your query completely. From whatever I understood, this won\’t count as double calculations. Its just that you are considering a larger window and the data is integral to that time frame.
Finally sir, i completed the chapter.
Literally sir, i read all the chapters on varsity and this is one of the longest time taking chapter because of volatility cone.
Sir, my question is:-
Can we see volatility cone on sensibull or we need to self prepare the volatility cone?
Figure this, 6800 is a good 1100 points way from the current Nifty level of 7794. The fact that 6800 PE is trading at 5.5 implies there are a bunch of traders who expect the market to move 1100 points lower within 11 trading sessions (do note there are also 2 trading holidays from now to expiry).
Is there any mistake in the above sentence where it states \”6800 PE is trading at 5.5\”? ig it is trading at 8.3 as stated in the example
Ah yes, has to be 8.3.
We don\’t need to draw the volatility coin every time, right? Once we get the idea of what the average option premium of an instrument should be, we can easily get to know which ones are expensive, and vice versa! Also, do you use a volatility cone every time before initiating your trades?
Not really, at one point, this kind of becomes intuitive.
Hello Kartik, above you said try not to short options which have a large gamma value is basically like shorting an in the money option right?
That\’s right, lots on the discussion on that in the comments already 🙂
Hii sir,
=SQRT(1/B$5*SUM(OFFSET(Sheet1!$E$2,MATCH(Sheet1!$N3,Sheet1!$A$2:$A$504,1)-1,0,-B$5)))*SQRT(252)
Sir, The above formula is from excel sheet(Mar 12). And the value we are getting after applying the above formula is 0.146394563.
I am literally unable to understand where it comes. Please tell me sir, i am very confused in it for 2 days.
Thankuuu!
Tushar, you need to trace the excel formula, guess that would be self-explanatory 🙂
Hello Kartik, I am finding it a little difficult to understand the volatility cone once the points are getting plot on the graph. But I got the crux of that part and it is to understand that one shouldn\’t go long with options that are expensive than the average premium; instead one should look for shorting opportunities and vice versa for options that are trading below the average premium.
Thats right, the cone helps you visualize the options which are expensive. Perhaps builds a case to short these options.
The realized volatility is that you calculated for 15 months individually is nothing but the daily volatility of that particular month * square root (30)! right?
Yeah.
Hii sir,
Sir I am unable to understand that \”how did you calculate the values of 10 day, 20, 30 etc in the excel sheet.\”
I understanded everything in excel sheet apart from the above.
Thankuu!😊
Ah, that was output from a program 🙂
Hi,
Overlap means e.g. Overlapping of the volatility for option 8200 CE on to the Volatility Cone as you explained above.
I understood the concept of volatility cone,
Since you said there is no excel file available, Iam not able to figure out How i can find the points that are expensive (i.e above +2SD) or cheap(below -2SD) by plotting the current volatility on the Volatility Cone.
I request you to guide me if there is any other method that I can refer to
Thanks
Onsover
Ah, ok. Have you checked Sensibull for this? I guess they have these graphs.
Hi Karthik,
Thanks for your response
Can please you suggest me an idea to overlap the option’s current IV on the Volatility Cone?
Thankyou
Sorry, can you share more context of overlap?
Dear Karthik,
First of all Let me thank you for providing a detailed information in understanding Options
Are these Blue and Black dots representing the IV on a Particular Date taken from NSE Website
How can we plot the Blue and Black dots on the Volatility Cone as shown in above Image
If possible, can you provide the excel file plotting the Implied Volatilities for 7800CE, 800CE and 8100PE on the Volatility cone for reference.
Thankyou
Thats right. The chart is generated by a program, unfortunately, I didn\’t do that, so cannot be of much help with that.
Sir one of the other greeks which has seemingly less effect on option value is Rho. From by brief reading about it on investopedia i figured that if interest rates rise, call options value increases and hence they have a positive rho, whereas the inverse is true for put options. But i do not understand the why behind the logic. I mean if interest rates rise then borrowing becomes expensive and hence fewer people would be able to afford buying call options(specifically as it has positive Rho), so if fewer set of people are vying for buying call options then how come the premium is higher?
Option premium has an implicit rate at which the funds are borrowed. Cost of borrowing/funding increases, hence the option premium.
Hello,
I was reading the option strategies module. It has mentioned the following in Bull Put strategy-
\”While the Bull Call spread is executed for a debit, the bull put spread is executed for a credit. And you have a moderately bullish outlook looking ahead, then it makes sense to invoke a Bull Put Spread for a net credit as opposed to invoking a Bull Call Spread for a net debit. Personally I do prefer strategies which offer net credit rather than strategies which offer net debit\”
I am not getting this advantage view stated of NET CREDIT over NET DEBIT. The only difference i see is that Bull call strategy is for call options and Bull Put Strategy is for put options with some slight changes in formula.
Hey karthik ,
I gave it a try but there are so many comments from year 2015 to 2020..!!
it would be very helpful if you clear it by yourself.
Hi Karthik,
In the graph of Delta vs Strike of both Call and Put options for different volatility it shows delta will be zero for deep ITM Put options and will be -1 for deep OTM options but in Chapter \”Delta part 2\” you have shown a graph of delta vs Spot price , in which for deep OTM put options delta was shown zero.
My clarity is if X-axis shows strike price from \”ITM- ATM- OTM\”
Then on Y-axis the delta for put options should be , \”-1 , -0.5 , 0\”
and delta for call options should be, \”1 , 0.5 , 0\”
Am I missing some point here?
Someone else had a similar query, I guess we have addressed this in the comments. Can you please refer to the same?
Hi Mr Karthik,
Does option price change intraday due to change in IV, assuming that underlying is not changing? Or IV is fixed during the day .
IV changes, and this impacts the price of the premium.
Hi Karthik ,
Could you please help me to understand below queries ?
1.Why Gamma is high for ATM option especially towards the end of expiry
2.Why Gamma for ITM and OTM options goes to zero when we approach expiry
3.Why Delta has an effect on lower range of options around ATM when IV is low and its influence increases when volatility is high.
4.Why When the volatility is high, the far OTM options do tend to have a non zero delta value
Arun, these are generic greek behaviours, based on the B&S model. Very hard to explain why some of these things behave the way they do 🙂
thank you for clearing that sir
sir what happens on the expiry date example I buyed call option on 15th at OTM and expiry is on 28th and my strike moves to ITM from 50 points on 28th but the premiums are trading at different prices( lesser) than which i bought on 15th im in loss as per premiums.What happens now will i be in loss or profit.
Yes, but upon expiry, what matters is the intrinsic value of the option and not the price at which it is trading.
Hi Karthik
Would it be possible for your team to please upload an excel worksheet showing the volatility cone calculation?
I searched for calculations for this on the internet but the methods are somewhat different.
Please see https://www.m-x.ca/f_publications_en/cone_vol_en.pdf
Best Regards
Abhijeet Durge
Let me check on this. Meanwhile, you may also want to check with Sensibull for this.
How to calculate realized volatility of the previous days for the volatility cone?
Realized volatility = historical volatility.
I want to download IV data for option chain for past 30 days for particular strike. Please suggest how I can download?
How can we construct volatility cone ?
Hmm, regarding the data, you need to check with Sensibull.
hello sir ,
sir IV describe the market expectation/ volatility .
but the deep OTM options have high IV but underlying to reach deep OTM to ATM in some stocks seems daunting.
so why the posses such a high IV ?
IV improves the odds of the stock transitioning from deep OTM to ITM 🙂
hello sir ,
in the volatility cone , a comparision is drawn between IV and historical volatility
IV is for options
historical volatilty is for stocks
then why options costliness is defined by stock historical volatility ?
Historical vol is only considered as a proxy as its easy to compare. What really matters is the implied volatility.
I actually didnt wanted intraday. We can place SL via GTT that works fine as a replacement of BO and CO orders.
But both BO/CO and GTT are wrt to the option price itself, not the spot price. My question is can we trigger the SL in the option contract if spot price falls below \’x\’ price.
Ah no, the cross-referencing of prices to place SL/target etc is not possible.
How to place a Stoploss in options?
Say i bought a naked Call option when Spot price was 1000.
I want to sell this contract if price falls below 990.
Can i place such a stoploss which gets triggered automatically in kite?
If its intraday, you can always use BO/CO orders.
Hi Karthik,
I prepared 4 day till expiry tabular analysis of Bank Nifty taking 1 year of data, and I found my average annualized SD was around 29% of around 49 such weeks. The implied volatility as on date is also around 29%.. so in a way, i think the average is pretty much okay.
It is when I calculate SD of the earlier SD i calculated that I am stuck. the SD of this observation is also around 25%. If I check -2 SD, it will become a negative figure. That would be wrong right?
And lets say correct +1 SD is 10%, and not 25% for simplicity.. +1 SD =35%.. now practically, all the strikes have more or less same IV, barring a few where it is at most 1-3% up down. How do I use this volatility cone approach there?
Thanks
That\’s because the prices had trended down, especially in the early part of this year. There is nothing much you can do about -ve prices/value.
Sir in pn 203 you have said the fact that 6800 PE is trading 5.5 implies … But I could not find out where is 5.5?? Could you please help
It was the trading price at that point I suppose.
Good day Karthik,
As we know having a view on volatility is critical for executing an options trade and you also mention that most professional traders trade on volatility and declare that it is easier to predict the direction of volatility than the direction of markets.
But in the module on options, you have not elaborated how to analyse and get that directional view of volatility. What to look out for? Is there any set of rules for such analysis such as TA is for market direction? or do we have to read any book to understand it better?
Thanks
Shashanka
That\’s right Shashank. Things like volatility cone, volatility smile, Volatility range helps you estimate this. All of these things are explained in the module itself.
I did not get this point :
\”Suppose the current implied volatility of option positions is 20%, then a 7800 CE and 8000 CE bull call spread would cost 72 with a potential profit of 128.\”
How is the cost and potential profit calculated in this ?
These are estimates based on the B&S calculator. I\’d suggest you look at the strategy on Sensibull platform, you\’ll get the estimates.
sir in the above example where we have annualised volatility of 15 month , SD was 11.53.
sir is this SD calculated the same as we discussed in earlier chapters ?
because mine SD is different .
Yes, this is the same way Rajat.
hello sir,
I am new to trading , so possess a little knowledge .
Sir i want to know that all these things and process for calculating results are to be done manually or we can get the resultan figures elesewhere .
You have calculators which does the math for you.
Hello Karthik,
The excel file at the end of this chapter \’Volatility cone\’ seems corrupted and cannot be opened. Can you recheck the link. Thanks in advance!
Checking on this.
Hi Shubham, there seems to be no issue with the file, however, we have re-uploaded it again.
Sir
What will be the S.L & Target for trades taken on basis of Volatility Cone?
Btw thanks for amazing tut, lot of new learnings.
VC is the imput, the SL and Tgt depends on the actual trade strategy that you take.
Trading in stock market without reading Varsity is like jumping out of an airplane without parachute. This applies to each n every chapters of all the modules. You are simply brilliant Mr Kartik 🍷
Thanks for the kind words, Piyush 🙂
Karthik, I am a fan of your content. And almost i have gone through every one of them ! Got 3 certifications as well 🙂
I wanted to ask you in detail about options & future pricing relative to the underlying
I hope the futures mirror the underlying ie. futures go up when spot goes up & vice versa (obviously there will be gap due to discount or premium).
However the options pricing do not mirror the spot movement.
eg: BHARTIARTL spot is at Rs590
& 580 CE is trading at premium Rs40
When comparing the technical charts if the 580 CE shows downside indicators like macd divergence or an evening star but if the SPOT shows an upside like a green marubozu or morning star
Which chart gets the priority. Is the spot chart correct or is the CE chart correct ?
Thanks for the kind words, happy to note that you like the content, and congrats on the certificates 🙂
Yes, your observation is correct. This is because, for futures, the only thing that matters is the direction. However, in options, besides the direction, many other things matter like the speed at which the market is moving, time, volatility etc. Hence options behave differently than futures.
Sir i am finding difficulty in understanding volatility cone . Do you have any reference for that ? Can you please provide excel sheet for cone ?
I\’d suggest you also go through the comments section, lots of queries and replies in the comment section.
Hi.
I have learnt lot of new things through varsity. Your program has been very helpful for beginner like me. I have a small request can you make videos of the modules as its easier to grasp the concept compared to reading.
thank you 🙂
Glad to hear that, Govind. Do check out Learnapp – https://learnapp.com/home , they have great video courses.
I\’d like to ask, based on what I understand, it is hard to differentiate exactly a change in option premium to each Greek as a stand alone since they are all interrelated, right?
Secondly, I keep reminding myself that the Greeks are nothing but the differentiation of the option formula against its different variables. but I keep feeling like they each have their own behavior.
and since delta-and other Greeks- are also impacted by implied volatility, wouldn\’t that mean that Implied volatility is beyond \”peoples expectation of the option\”? and if we were to divide the implied volatility into parameters, there would be parameters of \”expectation\” for option price, the another expectation for each Greek?
Thanks again 🙂
It is hard, especially on a real-time basis because there are several moving parts. Besides, the demand-supply dynamics for the option itself is another variable to consider which is outside the preview of the option pricing formula. So yeah, it is not easy 🙂
Yes, you are right, each greek has its own behaviour.
In fact, implied volatility is forecasted using advanced quantitative models.
Hello Kathik,
I never knew reading and learning about options can be as fun and intruiging as you make it here. So THANK YOU
Happy to note that, hope you continue to enjoy reading Varsity 🙂
Hello Karthik,
As per you realised volatility = historical volatility which can be calculated as you explained in ch: 16 Wipro example.
What about every month expiry realized volatility (also for 10, 20, 30…90 days) you calculated in the 2014-15 nifty example in this chapter.
Karthik please attach the excel sheet working of your nifty 14-15 example given in above chapter because the already attached excel sheet is of TCS 2011 – 12 working which is not at all understandable.
Vijay, once you calculate the daily volatility, you can use the same to convert to any time frame you wish by multiplying with sqrt of time.
Just to be completely sure, if I let the OTM option expire by itself then will there be any extra charges from Zerodha?
Thanks.
No extra charges, Harpreet.
Hi Karthik!
I have sold call option for Exide at OTM for a premium of 0.50, I want to know on 25th June (Expiry day), do I have to buy the same call option to square off or will it automatically get squared off.
Also, if I have to buy the same strike price CE to square off then will I not lose some premium on that. For example, I have short 190 CE for a premium of 0.50 and on expiry of I buy 190 CE option for a premium of say 0.10, will it not reduce my profit (0.50-0.10=0.40) ?
Please help me with these.
Thanks for sharing such insightful knowledge in a simple and easy to understand format. I adore your writing skills.
If the option remains OTM, then you need not have to buy back the option, you can just let it expire. Yes, your profits will be 0.4, if you decide to buy back at 0.4.
Karthik please reauthore this chapter in your style especially related excel sheets. Thanks in advance.
Tell me where you are stuck, will try and sort this out for you 🙂
Thanks Karthik. You did an excellent work in all previous chapters and made them easy to understand. This chapter is very difficult to understand. Please explain on excel sheet how to calculate realized volatility annualized and for 10 days. Also the already attached excel sheet is not at all good and very difficult to understand.
I understand, but this is a complex topic 🙂
Realised Volatility = Historical volatility as calculated on the daily average returns. This calculation gives you the daily vol. Once you do this, multiply with Sqrt of 365 to get annual vol.
first of all thanks for replying the previous question, Like most of the option strategy\’s is based on volatility of the market, so it is very essential to forecast volatility like whether it is going to rise or fall. India VIX shows how much the market is expected to move in a year irrespective of direction. So can we use India VIX to predict the volatility and if not then how do you predict volatility to place your option strategies ? And while trading in zerodha sometimes at the start of the trading session the BO and CO are blocked due to expected to increase in volatility so how zerodha knows whether the volatility is going to rise ? and which model they are using to calculate it, please reply. 🙂
Whenever there is an event which can impact the markets or if the international markets have crashed overnight then it means the volatility is expected to increase, as simple as that 🙂
Sir, Can you explain GARCH (1,1) & GARCH (1,2) model to forecast the volatility?
I\’m not familiar with that myself 🙂
Could you provide the current volatility cone as it\’s very difficult to make it
Thank you for your wonderful efforts
Please do check Sensibull for this. Check this – https://sensibull.com/
#volatility con
Am I right, If, I would say increase in realized volatility as we reduce look back period means increase in skewness, increase in dispersion ?
You cannot generalize this as it really depends on the time series data.
Hello karthik
Hope lockdown goes well and my learning season going on can you guide me the best books to read for the entire thing and precisely can you tell me data feed entry into amybroker or any other best and trusted platform you know..
Thanks
ARUN KU.
Arun, you should talk to any exchanges approved data vendor.
Sir, Please upload excel sheet on volatility cone. I understood every topic till now but volatility cone alone dragging me down.
Will try and do that, it is just that this section is authored by someone else 🙂
Hi Karthik,
I put the nifty data in the excel you have provided and there too, I am getting the negative volatility. What I understand is that the value of SD is comparable with the mean and when it is subtracted from the mean (To calculate mean-1*SD), the negative values are coming.
Is there a way you can recheck these calculations?
Thanks for your help!
Amol
Ok, let me recheck the values here first.
How 20 30 60 99 days cilatility exercised
Below are the volatility data for different no of days to expiry
10 20 30 45 60 90
30-May-19 21.66% 18.76% 16.79% 14.82% 13.63% 12.72%
27-Jun-19 12.30% 12.10% 16.26% 15.20% 13.99% 12.88%
25-Jul-19 9.91% 11.87% 11.89% 12.29% 14.45% 13.31%
29-Aug-19 16.62% 16.75% 14.84% 13.91% 13.36% 14.72%
26-Sep-19 33.84% 25.80% 23.39% 20.52% 19.00% 18.08%
31-Oct-19 9.26% 12.11% 21.37% 19.44% 18.76% 16.82%
28-Nov-19 8.43% 7.80% 8.33% 12.36% 16.80% 16.28%
26-Dec-19 8.81% 8.65% 8.56% 8.36% 9.68% 15.51%
30-Jan-20 10.47% 12.43% 11.31% 10.61% 10.14% 14.35%
27-Feb-20 12.50% 17.05% 15.00% 14.39% 13.20% 11.80%
26-Mar-20 105.60% 80.43% 66.14% 55.26% 48.39% 40.04%
6-May-20 41.58% 47.34% 67.04% 65.44% 57.20% 47.24%
Days to Exp 10 20 30 45 60 90
Max 105.60% 80.43% 67.04% 65.44% 57.20% 47.24%
+2SD 79.73% 64.80% 64.75% 58.70% 51.45% 42.55%
+1SD 51.99% 43.69% 44.08% 40.29% 36.08% 31.01%
Mean 24.25% 22.59% 23.41% 21.88% 20.72% 19.48%
-2SD -31.23% -19.62% -17.93% -14.93% -10.02% -3.59%
-1SD -3.49% 1.49% 2.74% 3.48% 5.35% 7.95%
Min 8.43% 7.80% 8.33% 8.36% 9.68% 11.80%
SD 0.2774 0.2110 0.2067 0.1841 0.1537 0.1153
Hi Karthik,
I plotted the volatility cone with Nifty data from May 2019 to Apr-2020. For -2SD and -1SD, I am getting the volatility as negative values. What exactly these negative values indicate??
Thanks,
Amol
I\’m not sure if you have calculated the volatility right? Not sure how you ended with a -ve vol number.
Under section \”20.4 – Delta versus implied volatility\” you have said \”When IV is low (20%), the delta gets flattened at the ends (deep OTM and ITM options). This implies that the rate at which Delta moves (further implying the rate at which the option premium moves) is low. In other words deep ITM options tends to behave exactly like a futures contract (when volatility is low) and OTM option prices will be close to zero\”
My question: Why in the above context have you said \”OTM option prices will be close to zero\”?
That\’s because the delta is low for such deep OTM options. Low delta means low change of premium, hence the premium tends to be low.
hi sir, the graph you have plotted between the delta vs strike price .sir can you explain to me why this graph is different from the previous one in delta (Part 2)
Its explained in the chapter itself Prem.
Nice explanation karthik….when are u listing ZERODHA on market.
Thanks, Hemant. I\’m really not sure about that 🙂
Hi Karthik,
In the Delta vs IV explanation graph, as the volatility increases, the effect is that it affects more strikes. So does this mean that when IV increases, the delta of deep ITM/ITM reduces from 1 to say 0.8?? Isn\’t this against the normal maxim that as IV increases so does the premium and delta of call options??
Thanks,
Alok.
The behaviour is different for different strikes if you observe. Deep and far OTM behaves similarly. Max change is for the ATM and surrounding strikes.
Hi Karthik,
I am not able to understand how are you able to get realized volatility 12 days from expiry for each month? is this data available somewhere ?
No Sudhir, this was extracted from a program which was built for this purpose.
hi karthik .
i have checked with sensibull .they have ivp .
any other source
Not sure about other sources, Ankit
Hi Karthik,
Thanks. Now its clear..so confusing yet so simple once you get it!😄
Happy learning 🙂
hi karthik.
whare can i see volatility skew or smile live or current of different option strikes.
plz provide link
Hmm, you can check Sensibull for this.
Hi Karthik,
Sorry im still not clear.. when you say “its not like ATM have low IV”.. but isn’t that the volatility smile??
Also, the sensitivity of change in IV to change in premium is nothing but vega right..which is high for ATM.
So what about lower IV then?? What am I missing here??
Also, sorry to bother you again.
Thanks,
Alok.
Alok, what I mean is that the Volatility smile itself can shift upwards (or downwards). With a shift upwards, the ATM IV increases, but still, it will be lower than the OTM and ITM. This is what I meant by, \’it is not like ATM have low IV\’. Apologies if that confused you 🙂
Hi Karthik,
I understood the fact the as the time to expiry decreases, so does the impact of volatility, probably because we start getting more certain of the possible range in which the value can trade.
I also understood clearly that ATM options have high VEGA, because they are sitting at the borderline.
But what i could not understand is why do ATM options have lower IV. I mean IV is what the market participants expect right, so what\’s wrong in expecting that an ATM option will be more volatile??
Would be glad if you could clear my doubts.
Thanks,
Alok.
Alok, it\’s not like ATM have low IV. It is more about the sensitivity of the change in IV to the change in ATM premium.
Hi Karthik,
I have returned to markets after a hiatus of almost an year and what interesting times to trade in markets! Two uestions:
1. In first half of series, considering that theta decay and gamma are low and assuming a case that volatility also does not change much, what really will drive the price change of options esp. ATM and OTM ones?
Particularly, I am interested to know, in what scenario must I consider shorting naked options/spreads in first half of series?
2. If gamma for ATM options is high close to expiry, and we must avoid shorting ATM options, does it make case for buying straddles/strangles on last day for intraday gains? What will be more profitable in this case, straddle or strangle?
Thanks,
Akshay
Welcome back 🙂
1) Delta dictates here unless the market is witnessing extraordinary volatility. Perhaps not the very best time to short options
2) No, actually the other way round, provided volatility favours you (you expect it to decline). Because theta decay is the highest.
sir, volatility cone can\’t be downloaded on number in Mac so it can be done only on Excel
*selection of nifty prices is not working in sheet. Scrips in Nifty can be changed in sheet \”Nifty Scrips\”
https://docs.google.com/spreadsheets/d/1Dj68RVU6rqArqR8MDgP0X-UQg9rboPiqYvQIY_y5QZo/edit?usp=sharing
The Nifty drop down selection is not working in the sheet. Also, may please update the nifty stocks list as per lates.
Note: All the scrip names are as given in Google Finance. I cross checked the google finance data with NSE data. Seems to be accurate regarding prev. day close.
The list keeps changing from time to time. Therefore it is best to use this chapter to understand the concept and not really to look at it as a data source.
Hey guys. Wonderful coverage of the entire topic. Can I hope to see some sort of webinar could be arranged for live market trading techniques and evaluation in options? Albeit the explanation given iun varsity is pretty amazing, it will surely help to see it live.
P.S. And guys I have a volatility cone googlesheet programmed. So if anyone wants it, just reply on this thread. Also, doing this as I would like to know a few fellow traders.
Thank you. Maybe you can just post the link here, may help folks who need it. As far as the webinar, we will try our best to do it.
Hello Karthik Sir ,
I wanted to know if those Black and blue dots are applied by an Seasoned Trader manually by his conviction which comes with Years of Practice . or Its a result gained by input of Data and plotting of Charts , If it is the result then how do we make Excel to show those points on the Chart ? Sorry if i sound very Naive , I\’m very New to this world of trading of stocks , futures & options .
Ah, that was the result of a program. I myself don\’t know how that was done, but a colleague of mine helped with it 🙂
Sir ,
How did you Plotted these 3 blue and black dots ? Also how do you Conclude :
[ so the first blue dot from bottom could be the implied volatility of 7800 CE, above that it could be the implied volatility of 8000 CE and above that it could be the implied volatility of 8100 PE etc. ]
Where Do we get the Current IV (implied volatility ) ?
[ For instance as of today, Nifty is trading at 7789. Suppose the current implied volatility of option positions is 20%, ]
What do you mean by Could be ? why not sure ?
Hi Karthik,
Once again (and as usual), thanks from bottom of my heart for everything you have done here in Varsity.
Couple of questions:
1) In the Key takeaway section, first point mentioned is:
\”Volatility smile helps you visualize the fact that the OTM options usually have high IVs\”.
But as per volatility smile graph, IV is on higher side for both, OTM and ITM options.
Question is – Is there\’s any particular reason because of which you made the above statement in Key takeaways section?
2) On IV, somewhere in this exceptionally useful educational series, you mentioned IV around 15% is average. Above this, means high volatility and below means less volatility. If this is compared to IV in todays time, its not where close. Nowadays, IV is in the range of 80 to 100+%. Question is – does it mean that volatility levels have been increased over the period? If yes, what could be average volatility in your opinion?
Regards,
-Sachin
Sachin, thanks for the kind words 🙂
1) No, just to highlight the fact that vol is high for OTM. Should have included ITM as well
2) Yes, volatility today is way higher. I\’ve not calculated the same in recent times, but my gut says it could avg 30-40%.
Thank you Kartik.
Actually with standard deviation also I am not getting the exact result. It varies very much than the mentioned values in the excel sheet.
Anyway if you are saying that this method is correct then I can assume that \”annualized_realized_volatility=standard_deviation*sqrt(365)\” will work every time. I will show you in the future what I had created in python with the help of pandas and NumPy related to volatility cone and maybe some backtesting also. 🙂
Thanks
Anurag
I have zero clue about Python, so I may not really be of much help 🙂
Hi Kartik,
Yes there is a small doubt about the annualized realized volatility which you have shown in Volatility Cone. I am calculating it like this:
avg_return=log(today_price/yest_price)
standard_deviation=stdev(avg_return)
annualized_realized_volatility=standard_deviation*sqrt(252)
Though this I did in python and it was in sync perfectly with your previous example. However, it\’s not the same in volatility cone as I was checking for the 2014-15 nifty data.
Can you please provide a mathematical representation of the function used in the excel sheet which is very new to me.
Thanks
avg_return=log(today_price/yest_price) — this is the formula to calculate the daily return. It won\’t give you the average return. To get the average, you will have to calculate the daily return and then use the average function on the daily return.
The other two formulas are right. You can also try annualized_realized_volatility=standard_deviation*sqrt(365) once to see if the numbers are matching, although I\’d prefer 252 number of days.
Hi Kartik,
This is a great chapter and I enjoyed it very much. Though there is a little confusion. I checked the excel sheet for the volatility cone for tcs and its very confusing. Also when I am checking manually I am not getting anything. Can you please give a mathematical representation as you had given in an earlier chapter. This will be very beneficial for us.
Like e.g : he has used $Sheet1.$E$2. It means it is fixed. Which is not correct. Please guide me for this.
Anurag
Is there any particular area in which you are stuck, Anurag?
Thanks a lot for the prompt response !
Welcome!
Hello,
I understand that the volatility cone and the excel sheet associated with it was authored by someone else but much cannot be ciphered from the excel sheet.
But can you provide us some good link or source from where we can understand how to calculate the annualized realized volatility.
Also can you let us know that what particular \’time frame\’ should be used for calculation of historical volatility or realized volatility.
Also can you suggest the best book to begin with option trading?
Annualised realised volatility is nothing but the historical volatility. You can calculate the same by a simple STDEV function on excel. In fact, this is done in earlier chapters.
Time frame for historical vol depends on your strategy. You can even use 6 months data for short term trades.
Book – Sheldon Natenberg’s book on option volatility and pricing is really good.
If we carry this example forward then by considering view on delta you mean buying slightly OTM option?
Hmm, it could be an ATM as well. Really depends on the mkt situation.
hi Karthik
I have been reading your work and I am so thankful to you for explaining tricky concepts with the easy to understand charts. I have one question in regards to this particular chapter. under Volatility cone interpretation section you have said that \”Similarly a black dot near -2 SD line on the graph, is for a Put option. It suggests that, this particular put option has very low IV, hence low premium and therefore it could be trading cheap. One can consider designing a trade so as to buy this put option.\”
what I was wonderings that if the volatility is low then is it likely that the price of underlying would remain stable and therefore the premium which one would have paid could be of no use. (if the strike price is OTM).
Low vol implies a good opportunity to buy (purely from vol perspective). You will have to consider your view on delta and them take a call on this.
Hi karthik,
Firstly thanks to you and varsity team for providing such knowledge which is open source.I have 2-3 yrs experience in market.
Now a days there are many people coming up with different strategies and conducting workshops.What would you suggest beginners from your experience ?
How should a trader look into when there are n different strategies coming up?
Can you guide me on this?
Venu, in my opinion, the basics should be really strong when you are starting. I\’d suggest you spend more time reading through Varsity before considering any paid workshops.
In the line \”The fact that 6800 PE is trading at 5.5 implies there are a bunch of traders who expect the market to move 1100 points lower within 11 trading sessions \”
What exactly you mean by 5.5?
I\’m guessing 6800 PE is far OTM option in this context. Ideally, it should be close to zero. But because there it has a non zero value, it means that there are traders willing to buy sell the option, which further implies that a bunch of traders expect the market to move to 6800 levels.
Hi Karthik,
First of all thanks a lot for superb explanations done on options geeks… Its really fantastic !!
Would request to kindly let me know where this excel sheet calculation for volatility cone is??
Thanks, Rajesh. The excel sheet was developed by someone else. Will try and source it. Alternatively, you call also check this on Sensibull – https://sensibull.com/
Karthik sir ,
I want to learn dipper about Greeks can you please suggest me books regarding this
Raj, we have covered greeks to great extent on Varsity. Suggest you go through it along with all the information in the comments section.
True… But the graphs for Greeks & IV Percentile helps a lot . So if there is any software or Website who can give such info that would be helpful . Also can you please tell me how the relation between Historical Volatility & Implied Volatility ( GREATER THAN/LESS THAN i mean )can help in gauging the direction of Both the Underlying & the Premium of different strikes of that Underlying ??
hmm, I need to think about it and spend some time, Sumitro. To do any sort of analysis, you\’d need to store the historical IV, which I think is a tricky ask.
Hello Sir,
Great insights and knowledge in these articles. But i have a query … Is there any way to track IV Percentile(Number Only) and IV & Option Greeks in the form of Line Graphs ??? Also please explain up to how many days IV Percentile of an Option considers it\’s historical IV …. Your reply will be of great help .
Thanks a Ton,
Sumitro.
Hmm, I\’m not sure Sumitro. Maybe Sensibull can help with these graphs. But from what I can imagine, this should be doable. I\’d suggest you look at a minimum of 30 days for this.
I am asking for corrected sheet sir?
Vidit, you should also check Sensibull for this. They generate these graphs on the go – https://sensibull.com/
When can i get updated excel?
Not sure if this can be updated, Vidit. It will be hard to do it on a regular basis.
yes,the sheet provided is not correct,kindly see to it again.The google drive i tagged you is not editable,so i am unable to do that calculation for other stocks. Also can you suggest some reading to understand volatility cone etc more?
Unfortunately, I\’m not sure about study material on this topic. I\’ll check the excel again.
Also,rather than calculating 1SD or 2SD on excel,we can apply Bollinger band on chart to know the lower and upper range?
Yes, that is a good hack for the same 🙂
actually in that sheet that has been provided by you,columns are not defined?
It is right?
This link i find in comments sections,the same issue was being discussed,is this sheet correct according to you?
https://docs.google.com/spreadsheets/d/1g5I1kEA9Y-dbpQbasjhsd9VqTMStV-AWr9q0-LrwzI0/edit#gid=1252843991
This seems like the right one.
Like you have plotted data points in form of DOTS on volatilty cone,how we can do this?
If I\’m not wrong, this was generated by programing.
Sir, unable to re=edit volatility cone sheet as the names of the columns are not known,if i had to put NIfty calculations,what should i put into that.?
I think that sheet is locked. Let me check.
Where do we get volatility cone/smile charts? Does sensibull or interactive brokers etc provides visual presentation of these,if not where do we find this? Some says that never use IV provided on option chain rather calculate it,wat you say about this?
Vidit, I think Sensibull should have this. I\’d suggest you write to them at [email protected].
Hi @Karthik Rangappa Sir, This is regarding the excel sheet which is available to download. As per your excel sheet, Sheet1 both Column C & Column D are identical. In Column D I see referring to Column J. But since Column J is empty From J5, is it that by mistake you have forgot to have a formula On Column J ?? I am unable to preceed from this point. Need help ! Hoping for the best. Thank you in advance
This was developed by someone else, Amod. Let me pass this query and try and get a response for you.
HI SIR,
how to find annualized realized volatility of “last 10 days or 20 or 30 days before expiry period?
PLZ SHARE YOUR EXCEL SHEET FOR THE BELOW TABLE
If you calculate the Nifty’s realized volatility in each of the boxes, you will get the following table –
Expiry Date Annualized realized volatility
Jun-14 41%
Jul-14 38%
Aug-14 33%
Sep-14 28%
Oct-14 28%
Nov-14 41%
Dec-14 26%
Jan-15 22%
Feb-15 56%
Mar-15 19%
Apr-15 13%
May-15 34%
Jun-15 17%
Jul-15 41%
Aug-15 21%
This was calculated in R software. I think this is now readily available with Sensibull. Maybe you should check – https://sensibull.com/
Hi Sir,
How to calculate the realized volatility for any time period?
Hi sir,
How and from where to get the historical data volatility of the expired option contracts for realized volatility calculation?
I\’d suggest you speak to Sensibull for this – https://sensibull.com/ , you can write to them on – [email protected]
The historical volatility is nothing but the realized volatility.
Hi,
You have mentioned — \”Delta has an effect on lower range of options when IV is low and its influence increases when volatility is high.\”–
Then why in 24th Aug 2015 example – There is no delta effect on Call options above the 8600 strike and why did the premiuma rose when Volatality rised and Underlying fell. If delta effect exists during high volatality then the premium have to fall. Isn\’t it ?
I\’m unable to find the 24th Aug 2015 example, isit in this chapter?
Sir, It is in Vega chapter last but 1 page. Sorry for not mentioning clearly
Ok, let me check. Thanks.
Totally Screwed content. Unwillingly presented content. No clue where it is leading and what you are trying to explain in last topic Delta vs IV.
https://www.moneycontrol.com/news/business/markets/-1609265.html
I read the above link and that is how the explanation should be.
Keerthan, you are comparing two different topics here. If you are not comfortable with greeks, maybe you should start from the basics.
Dear Karthikji
1]In sensibull which sections of menu I reach out for implied volatility ?? I\’d never used it & whether should I get paid apps for eg like sensibull lite or pro…
2] And can I compare implied volatility of particular strikes of nifty or banknifty to its annual volatility so that whether it\’s high or low ?? Is it ok to do this as rough idea?
Kindly guide here pls if I\’m correct
Ur gratefullness 🙂
1) You will have to check with Sensibull for this, maybe write to them @ [email protected]
2) Hmm, you can I guess. This will give you a quick comparison.
Thank you so much Karthikji 🙂 Will questions again if any doubt as I\’m as much learning about volatility as possible that includes even step towards forecasting also. But I agree as u taught in fundamental analysis that one must be user. So trying to keep things simple as much as possible whatever I\’d in my closet:)
Thank u again. Hv a great weekend 🙂
Happy to note that, Harsh! Good luck and happy trading 🙂
Good evening Karthikji
Volatility smile I heard had been an old fashioned concept as hardly it\’s relevant these days. Volatility skew is quite useful these days. As you\’d yourself stressed many times that one of the most important in our strategy for options trading must always revolve around VOLATILITY with THETA being another important parameter.
My question is that
1)is concept like implied volatility skew rank important things in options trading
2) There\’s newer concept came in options world like implied volatility percentile & implied volatility rank. Is this better than Implied volatility cone u explained above
3)I\’m struggling to get this two most important data for skew rank & IVP etc. Where can I get the same ??
Ur guidance & wisdom needed for above query please
Ur gratefully 🙂
1) Yes, the volatility skew matters especially since it helps in visualizing the IV
2) The underlying is all the same, fancier names 🙂
3) Check https://sensibull.com/
Good luck!
Thank you so much Karthikji. But sry to trouble u again with following questions in new paragraph…
Hv a great evening
Hi Kartik
Thank you very much for all your efforts..
My question is all we discussed about Monthy Expiry. How Volatility cone calculations should be made for weekly expiry ….
2) In weekly expiry, what will be relevance of 20, 40, 60 day volatility?(Days before expiry)
Its the same for weekly expiries, Gajanan.
Hi Karthik,
1) In the earlier chapter, while discussing \”Volatility vs Premium\” , we discussed that when volatility increases , premiums tend to increase.
2) In this chapter, when you plotted a graph for \”Delta vs Implied Volatility\”, we took 175 as ATM, and if you look around 160 CE strike, at the red and blue line, we could find that red line delta is less compared to blue line\’s delta.
So, as we know, for the same strike, if the delta is more, the premium is more, the premium should be more for blue line(when volatility is less) (Note: I am specifying for around 160 CE strike and not for ITM strikes).
Clearly both the above points contradicts one another.
So, my question here is, when all these factors impact the premium at a time, taking a particular strike and when it comes to \”Volatility impact on the premium\” vs \”Delta impact on premium when volatility differs\” , which one impacts more and how does this impact differ?
Thanks
Srikrishna
So, as we know, for the same strike, if the delta is more, the premium is more —- > when the volatility is higher (red line), the 160CE could be trading much higher (premium) when compared to the when the volatility is lower. Remember, delta is the rate of change of premium, but the premium itself is a function of other greeks including the delta.
Karthik,
I understood now more clearly after reading this response and re-looking at all the chapters at once . Thankyou:)
Thanks
Srikrishna
Welcome, Srikrisha! Happy reading 🙂
IV and volatility we calculated in previous chapter is different? If yes, how?
Mayank, can you kindly suggest how they are different?
Hi Karthik,
Is it possible to connect with you to understand how to draw volatility cone. I downloaded the excel, but did not understand much looking at excel.
Thanks
Abdul
Ah, the cone was actually developed by someone else. But do let me know which part you are stuck with, will try my best to help. Thanks.
Sir, I thought I need to just replace the values in Sheet 1 and rest will auto calculate. Need help in creating cone for some other stock so that I understand from base.
Technically yes, thats all you need to do. Let me check this again. Thanks. Meanwhile, please do check Sensibull – https://sensibull.com/
This Chart Please…
Particulars Details
Maximum Volatility *56%
+2 Standard Deviation (SD) 54%
+1 Standard Deviation (SD) 42%
Mean/ Average Volatility 31%
-1 Standard Deviation (SD) 19%
-2 Standard Deviation (SD) 7%
Minimum Volatility 13%
I didn\’t get it how did you get to 42% as 1SD and 54% as 2SD
By the way sorry, for not being able to understand it.
Thanks.
Ah, I get your point. I will check this and get back, Ram.
OK.
Dear Ram its like this….
Please refer Excel linked by Kartik all parameters explaied
OK
Maximum Volatility *56%
+2 Standard Deviation (SD) 54% >>>> Actually this is range = 31%+11%*2)
+1 Standard Deviation (SD) 42% >>>>>>> 11.56%+31%
Mean/ Average Volatility 31%
-1 Standard Deviation (SD) 19% >>>>>>>>>>>>>>>>>>>>> 31-11.56
-2 Standard Deviation (SD) 7% >>>>>>>>>>>>>>>> 31-1156*2
Minimum Volatility 13%
I didn’t get it how did you get to 42% as 1SD and 54% as 2SD
Hope its clear Now
I spent 2 days to find this out.
Now my question to Kartik is that how 10, 25 etc windows has to be selected?
Thanks
GAJANAN
\”I didn’t get it how did you get to 42% as 1SD and 54% as 2SD\”
this is copid from Mr Ram post ..please dont consider this line
Thanks
>Similarly a black dot near -2 SD line on the graph, is for a Put option. It suggests that, this particular put option has very low IV, hence low premium and therefore it could be trading cheap. One can consider designing a trade so as to buy this put option.
When IV is low, then premiums are low and hence logically we could buy PUT, however when volatility is low it also means
that market might be bullish and bulls might get control right , then how could we justify our PUT buying and rule out bullish doubts?
IV and volatility are used interchangeably here, Bharath. The idea here is to convey that when IVs crack, the options become cheaper and hence builds a case to buy. However, the other factors should also justify the trade. You need to look at factors such as Delta, theta, and of course momentum.
>as you go away from the ATM option (for both Calls and Puts) the implied volatilities increase, in fact further you move from ATM, the higher is the IV.
However,
IV of strike 230(slightly OTM) is 51.18
IV of strike 225(ATM) is 51.53
Could you pls clarify?
Well, this is a generic statement. Markets, as you know is all about mispricing 🙂
1. is it sensible to buy options with 20 days to expiry and the IV is trading just below mean ( by seeing volatality cone of that particular stock or index) ?
2. Also sometimes Deep ITM call option IV is low(for a particular strike price) , is it sensible to buy deep itm option if IV is really low? for example, i am thinking to buy banknifty NOV series call option(29 NOV expiry) today. CMP is 25771 and IV of ATM(25700) is 14% & premium is 445 , whereas 25200CE is ITM option and trading at 745 & IV is just 10.20% (which is near SD-1 level), so is it good to buy 25200 instead of buying OTM option i.e. 26000CE , premium is 284 & IV is 13.51%(which is mean level as per volatality cone)?
3. Can we short weekly banknifty expiry series call options ( which is SD1 above) also based on the volatality calculation sheet which you shown us i.e. SD1 and SD2 levels.?
1) Yes, but you need to have a view on the IV here. Makes sense to buy only if you expect the IV to increase over the next 20 days
2) Same answer as above. If the answer is yes, then you certainly can buy the option with an expectation that the low IV will support your long position
3) Yes, you can. Make sure you calculate weekly SDs.
What shall be the starting date in the volatality cone i.e. first entry date in the excel sheet. What is the ideal date for calculating the volatality cone for next month. Example: i want to calculate the volatality cone for NOV-2018 month, what shall be my starting date (i.e. first entry) .. i can simply take last two years data on any day( may be 1st or 3rd or 6th NOV ..etc) in NOV-2018 and just paste the data in excel sheet or else there is any particular starting date? Please give me clartiy on it.
I\’d suggest you take at least 6 months data.
1. For using the volatility cone Excel sheet, I have to paste the date & closing price (for last two years) of any F&O stock and also change the dates (i.e. monthly expiry dates). Remaining all calculations will be done by the excel sheet itself?
2. If Currently October-2018 series is ending , then i can take IV for for next 30days from October sheet and compare with NOV series NSE data IV.. Right?
1) Yes, please give that a try
2) Yup, you can.
Where can I get the implied volatility values that are mentioned in the excel column F of the volatility cone sheet?
Siddhant, you can check https://sensibull.com/.
Sir you have mentioned many a times about liquidity,
but how to find whether an option is liquid or not?
what is the max diff between bid-ask spread for liquid contracts?
Mani, if the option premium is around 10 or 12 and the difference is say around 1 or 1.5, then clearly this is a large spread. Likewise, if the option 100 and the difference is around 1 or 1.5, then its still not so great but alright. End of the day, you will have to quickly measure this spread as a % of the premium. Higher the %, lower the liquidity and otherwise.
K sir
Dear karthik
At volatility cone chapter, the nifty data of 15 month is hypothetical or actual? Downloaded the 15 these moth of data, they are not maching.
Actual data, Khurshid.
Sir,
I DOWNLOADED THE VOLATILITY CONE EXCEL SHEET BUT COULD NOT UNDERSTAND HOW THE EXCEL SHEET IS DESIGNED AND HOW THE DATA HAS BEEN PUT INTO. WOULD YOU PLEASE EXPLAIN IT STEP BY STEP ABOUT IT. (LIKE YOU DID FOR EXCEL SHEET FOR HISTORICAL VOLATILITY CALCULATION)
PLEASE!
THANK YOU SIR.
Saugatha, the excel sheet is prepared by someone else, will try and see if I can get an explanation. Thanks.
Yeah can you explain whhat data are supposed to be put in that.
Sure, will reach out and check. Thanks.
How do we calculate realized volatility?
Historically volatility is the realized volatility.
Dear Karthik
How to get 10 days annualized realised volatility before expiry date from the downloaded nse closing price data?
You can convert the daily volatility to 10-day volatility by multiplying daily volatility with Square Root of 10. For example, if the daily vol is 1.2%, then 10 day vol is = 1.2%*Sqrt(10) = 3.79%.
I understood this \” how to convert annualized volatility to required time period or one day volatility to required time period\” but my question is how to find annualized realized volatility of \”last 10 days or 20 or 30 days before expiry period? Please explain
Extracting the volatility before a certain number of days is quite tricky, needs a lot of computation. Not really easy, Khurshid.
Sir I have a doubt regarding volatility cone calculations,
10 days before expiry means, for 29-jun-2018 expiry I have to take data from 22-may-2018 to 31-may-2018 to calculate annual volatility, likewise for 20 days 12-may-2018 to 31-may-2018 data am I correct sir?
It just means 10 days before the expiry date…so you will have to go back 10 days before 29th June.
thanks sir, that is what I am asking, little confusion, was sleepy while typing☺️
Good luck 🙂
Dear Karthik
Is there any hindi version of varsity?
Nothing yet, Khurshid.
Please share the link of volatility cone excell sheet.
Its available in the chapter itsefl, please scroll down.
How to calculate realized volatility?
Please explain.
Historical Volatility is nothing but the realized volatility.
But how to find the data before 10 days of expairy realized volatility of last 1 year?
Khurshid, you can run a historical volatility calculation on excel. \”=Stdev()\” on the return series will give you this value.
how to calculate Annualized realized volatility for past nifty data?
Calculate the daily return and multiply this with the square root of time, have explained this in the chapter.
Hi Karthik,
In the 3 dots example i.e. blue and black dots you have taken this current data from NSE\’s option chain Implied Volatility given in IV column of index or stock?
In our own calculations also we have to consider NSE\’s option chain Implied volatility (i.e IV column) for analysis?
Yes, you can your own calculation for IVs, but this is not easy.
Hi Karthik,
I didn\’t got exactly what you are trying to explain. Can you please clarify.
Thanks.
Can you please help me understand which part you are stuck with?
Hi Karthik,
From where i can get the data for 3 dots plotting?
Ah, that is just superficially plotted.
Once again hello sir,
I am not able to plot volatility cone of other stocks using the excel sheet provided by you. Value error is coming on all sheets other than the first. I am not able to understand a few things regarding the same:
1.) Column J (x1) is empty while the values in column D (xi-x1) are based on column J only.
2.) Column F (implied volatility) is empty till row 200 and than some values are pre-filled from row 201 onwards. Do we have to fill those values manually, if yes than how can we get those ?
3) 2 years data has been taken to calculate different volatility cones. If i want to plot a cone for April 2018, do i need to put data from April 2016 to April 2018 or just one year data will be sufficient ?
4) To find out if the current IV is high or low for a strike price, do i need to plot volatility cones for all past months like its done in excel sheet or just current month (April 2018) cone will be enough ?
I am having lots of doubts in this and i know you can\’t personally explain me everything but i would be grateful if you could spare some time to help me out a bit. Thanks.
Rishab, the volatility cone was plotted by someone else. I will try passing this query to the right person and get you a response.
Ok Sir, Thanks!
Good luck, Rishab.
1) While I do understand the concept of selling an option before a major event and pocketing the difference in premium later on, but wouldn\’t the risk be very huge? Like I remember an example in an earlier module where one of your associates made big money when the election results were announced for 2009 on May 18th. My concern is what if someone had sold a CE option then? Wouldn\’t the rise of the market be so huge that it would overpower the drop in volatility? I know that was probably an extreme case but the risk of market rising by 200-300 after an event and overpowering the volatility drop can never be ruled out, can it? How to overcome this?
2) If the implied volatility of ATM options are less compared to ITM/OTM options, then if one is looking to short an option strike before a major event, would it make more sense to short an OTM or ITM option? But I also read somewhere that one should never short ITM options?
Thanks in advance!
1) Yes, I do agree. Hence you need to evaluate the possible outcome of each event and its impact on option prices. Also, remember, you are writing both CE and PE and not just CE or PE.
2) Ideally, it\’s best if you short ATM for event-based trades. But its absolutely important to ensure the premiums are very high enough to consider writing these options.
1) Writing both CE and PE as a hedging technique or to collect premium from both of them?
2) Considering Karnataka elections are on 12th May, would it make sense-
a) to buy a CE option on 1st or 2nd May, thought process being that premium would rise due to volatility.
b) conversely, selling option around 10th May and collecting premium when results are announced?
Yes, both make sense. Although I think, the options have already incorporated the higher volatility bit.
Hello Sir,
Sorry for troubling you with many questions.
In the graph, Delta vs IV, I am confused about few things.
When the delta increases, premium increases; when the volatility increases, the premium increases. But for the ITM options, when the volatility increases, delta seems to decrease (at the ends). So, for the increase in volatility, if delta decreases, does the premium tend to increase or decrease.
Thanks in advance Sir
Aishwarya
Not sure if I understood the question correctly, but Yes, the if the IV increases so would the premium. Remember, the end of the Delta line (representing OTM and ITM) tends to stand elevated levels – this also implies the option premiums are more reactive under higher IVs.
Where can I get data for realized volatility?
You can calculate that – historical volatility is realized vol.
Could you please explain what exactly do you mean is 680PE is trading at 5.5? In delta vs IV example.
It means the strike of 680, Put option is trading at a premium of Rs.5.5.
Hello sir,
as you explained volatility cone to measure costliness of an option by using chart above having colorfull lines of sd1,sd2 etc. it was very easy to understand that which option is costly and which is cheap for buyers perspective.BUT if am doing same exercise at my pc at home i am facing problems:-
1. How to make same chart
2. how to plot dots on that chart
yeah i can understand i can use excel for that exercise. but i wanna use same type of graphical interpretation of things that makes things easy to understand
Thank you sir.
Warm regards
Ankit
I guess you can download the excel sheet and run through the steps, Ankit.
https://drive.google.com/file/d/1xIxPL8GEPujTRU69pIUcO7r_9snYH3om/view?usp=sharing
can a Volatility Cone look like this?
Yes, that kind of looks like a Vol Cone.
Why we can\’t see implide volatility of bank nifty in options chains.
Further what does (-) sign refer to in IV in nse option chain.
Ah, I\’m not sure why. Maybe you should check with NSE for this. Its not a -ve sign, it just means the IV is not available 🙂
Okay. Can you advice any other tool for IV as without it is not possible to use black and schols calculator.
Have you checked this? – https://zerodha.com/z-connect/queries/stock-and-fo-queries/option-greeks/how-to-use-the-option-calculator
Hi Karthik,
Once again thanks for sharing all these. I have done the Volatility Cone calculations myself, and as many others mentioned in earlier comments, I think there is some problem in the Volatility Cone excel sheet shared by you (as well as in the example used). I have done all the calculation in a Google spreadsheet with real-time data grabbed from Google finance (https://goo.gl/wUsgBd). Anybody can use this to get Volatility Cone for current date without requiring to do any change (also for any previous date by changing start date).
Anyway, as per my calculation, the mean line in Volatility Cone for the period used by you guys (Jan 11 – Feb 12) lies around 22-24. This matches with India VIX data for that period. However, in the shared excel sheet, this lies around 30 which is around the maximum India VIX level in that period. You do not need to go through either of these calculations to verify what I\’m saying, but do you think the way I\’m thinking is correct, i.e. mean volatility in Volatility Cone should be around the same level as India VIX average for the same period?
Moving on to my second question, in my calculation as well as in your examples, the MIN line in volatility cone is always greater than -2SD line (this is not the case with MAX and +2SD). Does this indicate anything? I was thinking may be this is a proof of what you mentioned in several chapters – \”fear spreads faster than greed\”. So, Nifty volatility always shoots up more from the average, than it goes down.
Nachiketa, I\’m forwarding this query to my person who developed the Volatility Cone. I\’ll probably ask him to reply here directly.
Thanks Karthik. That\’ll be great.
Cheers!
Vix average need not be same as avg volatility of volatility cone, but it should be close enough.
Calculation for vix is different from volatility cone. Volatility cone uses spot data, ViX uses IV of near month and next month options, so they need not match.
The mathematical reason for why highest value vix is higher than 2 sd, but lowest value is not below -2 sd is that the Volatility cone assumes a normal distribution for nifty, which is only an approximation. Think of it, volatility can never be zero or negative, whereas it has no upper limit. This is not the case with the normal distribution, it will swing on both sides with equal chance. That’s the reason for this pattern.
Thanks Karthik for the reply below (can\’t reply to that for some reason).
Also wanted to mention that last week was the first time I tried Option trading after going through all these material. It has been a exciting practical hands-on with Gujarat election going on. I could relate as well as predict and check all the volatility caveats you have mentioned in these articles. For example, Thursday (the day before exit poll was out), premiums of almost all 3-4 strikes on either side of ATM for both PE and CE increased although Nifty was down by some 0.4~0.5%. The reason being Volatility increased to almost 17% (highest in last 11 months). And although Nifty went up, premiums of some deep OTM CE dropped next day with exit poll bringing down the volatility to normal levels.
Absolutely, this is one of the most common setups to trade. Hope you made a profit 🙂
Good luck and stay profitable!
you have explained the concept of implied volatility very nicely in easy way. Thanks you for your hard labour. Please tell name of 10 multibagger stocks for 2017.
Happy learning, Shyam!
Hi Karthik,
I have following questions.
1. If I want to use volatility cone to find trading opportunities, do I have to calculate this cone for each underlying in which I\’m interested or these values are readily available? I know IndiaVIX is volatility index of all the stocks but I feel it won\’t depict correct conditions of any particular stock.
2. I know you told there is no particular checklist while trading options, but I was hoping if you can give some steps to do before starting a trade. I read all the chapters and have understood all the concepts but when it comes to trade I still feel I might miss something since there are many factors to look at.
So not a strong checklist like you mentioned in TA but just a few steps for newbies.
Something like this I have in mind for naked trades-
Step1 – find your view on underlying ofc
Step2 – choose a expiry based on liquidity and trading time
Step3 – pick put/call strikes based on time to expiry and check premiums
Step4 – check volatility, buy when volatility is low, short when volatility is high
Thanks.
One more question
3. What are bid/ask price and quantity?
I don\’t think you\’ve mentioned them anywhere in this module.
Check section 9.6 – https://zerodha.com/varsity/chapter/the-trading-terminal/
1) You will have to develop the Cone for each underlying. True that on ViX
2) There is a high possibility that each time you trade options, the circumstance is different. Hence difficult to generalize a checklist. Go ahead and take a trade, a low risk one…your learning curve will accelerate once you have a trade live in the market.
In the Volatility Cone sheet, from where will I get the data of Implied Volatility, and what was the purpose of column D in sheet 1(=C4-J5) when there is no values in J column?
Thank You.
Ah, this section is authored by someone else, Abhilash. Let me check with him.
Thanks a lot!! Eagerly waiting for that.
Cheers!
Hi Karthik……Your articles are really striking the point with ease understand. You know how much force need to applied for each stone(topic) to make a right shape(knowledge).
Thanks for the kind words, Srinivas 🙂
hi ,
I am very new in trading …thanks for so easy to comprehend lectures. But from where can I get delta,gamma and theta values.
You can get it from the Options calculator here – https://zerodha.com/tools/black-scholes/
U got HV from june 2014 to august 2015.
Where can I get this data from?
NSE India provides historical data, please check this – https://www.nseindia.com/products/content/equities/equities/eq_security.htm
I did not get the monthwise historic data anywhere on NSE website, secondly u said \”If we repeat this exercise for 10, 20, 30, 45, 60 & 90 day windows, we would get a table as follows\” where to get such precise data?
Ah, these are derived data Vignesh.
Hi Karthik, can you please provide the excel sheet of volatility cone, please. Thanks
I suppose its available at the end of the chapter, you can download it.
Amazing tutorial. At a time when people hold back information and tricks of the trade for selfish reasons, there is an interesting and knowledgeable teacher like Karthik who loves to share. Learnt a lot. Thanks. Off I go to the next module!
Hey..thanks for the kind words Anish. At Zerodha we believe in good karma 🙂
This is really good info. Is there any broker in India who gives this IV rank info inside the trading platform? Also if i just have to calculate the IV rank using the formula \”100*(Current IV – 52 week Low IV)/(52 week High IV – 52 week low IV), how do i do that. I guess it will be very difficult to calculate the daily voltaility for last 364 days and then figure the high and low values..
If you know coding, then I guess it is fairly easy to do it. I dont think there is any broker giving you this info.
i am trying my level best to understand this formula =SQRT(1/B$5*SUM(OFFSET(Sheet1!$E$2,MATCH(Sheet1!$N5,Sheet1!$A$2:$A$504,1)-1,0,-B$5)))*SQRT(252), so as to obtain the value for x days for given month. but cant able to achieve so far. i tried the formula you explained in chapter 16. but not getting this value as shown in excel sheet. If you can shown how to obtain relative volatility , it will really helpful. please explain here or mail me. i will really appreciate
This particular section is not written by me, so I will have to check this with the guy who created this.
Hi karthik,
I have two queries
Kindly guide.
1) most of the time i have seen that the direction of nifty is highly dependent on the global markets and some major indian news. In that case how relevant is the nifty chart by itself ?
2) can you provide the opening time of major global markets( which affects indian markets ) w.r.t. IST ?
Thanks in advance.
1) It is still very necessary. Not all the time is Nifty dependent on global mkts.
2) Please track the Hang Seng and FTSE, and DOW futures which trades all the time.
Hi Karthik
Based on your Volatility Excel, I have put in 15 months data for Nifty to get the volatility cone for the last 12 months. From the volatility cone, a 30 days-to-expiry option with + 2 SD variance would be at an IV of 18.37%. Now from the Nifty Option chain, as on today (28th Mar), the 27-Apr 10000 PE has an IV of 20.47%. The option also has a good liquidity at the moment, going by the Volume and OI figures. Is it feasible to go short on this 10000 PE which is presently trading at 835 ?
The difference in volatility is not much to build a case for short (with high conviction), but yeah, the thought process and approach is spot on. Good luck.
Thanks for the feedback. Another Question.. For plotting the volatility cone, the days to expiry (x axis) used was 10-20-30-45-60-90. Is this fixed or can it be changed/expanded to, say 10-15-20-25-30-35-45-60-75-90?
Can be changed to suite your requirement.
Hi Karthik
A layman\’s question.. how to understand how much liquid is a call or a put of a particular strike?
A scrip is considered liquid if you can easily buy or sell the contract when you place a market order. Do note, the price at which you get the contract should be around the same price as the last traded price in the market.
Hi Karthik,
I am thankful that you created such a content as it helps new users like me and others, please continue the good work. I looked for a tool and found Options Oracle tool is capable of creating a volatility cone. I am yet to check the accuracy of it but others here could also check and feedback if they feel it is plotting the call and puts IV properly.
http://www.pasitechnologies.com/2015/11/optionsoracle-nse-plugin-v-185.html
Thanks for sharing the link Gokul, will look through this.
Hi Dear Karthik,
Do we have to draw Volatility cone for each and every strike price.
I suppose, one cone will not give clarity on IV, for all the strike prices of the same underlying.
Could you please help me on this.
Regards
True, you plot it and connect the points to get the volatility cone.
Hi Karthik,
Thanks a ton for your constant support.
Well, I have deciphered the values for the current Nifty series.
The values look quite good to me, but I am not an expert in charts and can not plot this table hence.
I request you to plot the below values for yourself and see if the Cone is coming.
If it is a success kindly do let me know the process also.
Thanks again.
Days 10 20 30 45 60 90
Max 5.19% 6.26% 6.87% 9.22% 9.80% 10.83%
2 sd 4.66% 5.88% 6.79% 8.94% 10.19% 11.96%
1 sd 3.76% 4.86% 5.75% 7.57% 8.71% 10.49%
mean 2.86% 3.84% 4.71% 6.20% 7.24% 9.02%
1sd 1.96% 2.81% 3.67% 4.83% 5.76% 7.54%
2 sd 1.05% 1.79% 2.63% 3.47% 4.29% 6.07%
min 1.72% 2.55% 3.20% 4.66% 5.20% 7.08%
Promit – I\’m not sure if I can do that. However, glancing at these numbers, I do get a sense that they could be right.
Thanks Karthik for the reply..
Anyone if they can just plot the graph from the data.
I can also send you the data via mail if you want.
Regrads,
Promit Banerjee.
Hopefully, someone in the community here can help you. I\’m sure it will be a great learning experience for them as well.
Hi Mr. PROMIT BANERJEE
Exact cone, as shown above is not coming. But, something similar to cone is coming with the data given by you.
Regards
Hi Promit I tried to plot the graph and it does not looks like cone
I am not able to attach the file here
Thanks Kartik for your reply.
In the Volatility Cone excel, frank I could not decipher anything from the sheet.
But I went for a much much longer process.
With the expiration dates for the last 15 months(Is it necessary to take 15 months .??), I calculated the Annualized Volatility 10,20,30,45,60,90 days from the expiry separately for each 15 months.
Very long and tedious, but kind of the concept is same. ( Correct.. ??)
After that with that data one can construct the Cone.
But please it would be of much help if one can give the details of the Calculations in the Zerodha VC excel.
One user gave it, but still it is not making any sense to me.
Thanks and Regards.
Promit Banerjee
Yes, that is the process and I understand it is a tedious work. We will soon try and find a solution for this 🙂
Hi Team Zerodaha,
I want a way so that I can get the expiry dates of an option contract for the last 12 months.?
Is there anythibng on NSE site.
Cant find a proper format.
Check this – https://www.nseindia.com/products/content/derivatives/equities/historical_fo.htm
Hi Karthik
Why implied volatality of ATM is low compared to ITM & OTM.
True, this is exactly what the \’Volatility Smile\’ suggests. Volatility should be the same across all strikes, but this is only in theory. The variation in IV\’s can mathematically attributed to something called \’Jump diffusion\’.
Hi Karthik
Is there any significance of volatality smile in option premium.
No direct connection between the two.
yes cublic spline calculation i understood only problem is the historical orderbook of bid and ask. Do you know any alternative ? Thanx for replay
Why dont you touch base with data vendors? They may just have a solution for you.
helllo karthik sir its really a superb information you have providing with easy to understand language. I am also doing my research on options and facing certain difficulties regarding it, how can we plot date vs implied volatility chart (irrespective of strike) ?? How this after some study i found that india vix does this for nifty but i am looking same for individual FnO stocks. Tried backsolving from black scholes but it gives IV for particular strike. India vix formula is bit complex plus it needs bid and ask rates to backtest it, historical bid ask rates are not available please let me know regarding this thanx a ton!!
This is not an easy task for the exact reason you\’ve mentioned. ViX computation is highly complex and data intensive. Without the historical order book and knowledge on cubic spline it is difficult to do this.
Hi Karthik
I could crack finally. Took some time but am through. Has given good insight.
Thanks
Eshwar
Cheers! Why don\’t you explain what you\’ve understood on a word doc, maybe I\’ll include it in the main article…will benefit many 🙂
SURE WILL DO IN A SHORT TIME
Cheers!
Hi Eshwar,
Can you pls post the correct sheet
Hello, i have tried tinkering with the volatility cone model in excel but seems there is an error. I see that you have cracked it , so can you please post the same for my and others benefit? Also, i would be requiring the same for Bank nifty , so it would require fresh data inputs
This bit is developed by someone else. We have the excel uploaded which you should be able to download, hopefully that should help.
While thanks for the excel sheet for volatiatlity cone but am not able to match the calculations as in sheet. I tried for 10 days for the month of dec but am not able to match the stdev atleast although followed the process as described in earleir chapters. It would be nice if the person who has done calculations takes the pain to explain atleast for a month. This would be a great learning to all of us.
Thanks for good work
As I\’ve mentioned earlier, this bit is authored by someone else. I\’ll try and get an explanation soon. Thanks.
Hi Karthik
Where is the excel sheet for the V cone calculations??
sorry it is there overlooked
Cheers!
can you please give details of calculation of volatility cone that is described in above figure ,like how do you calculate for 10 days,20,days 120 ays .All details are for calculation of standard deviation or volatility but no calculation is shown for volatility cone so kindly provide details and formula .or is there any website where we can see different-2 days historical volatility so can draw the cone and applied IV ?
You can download the excel which is put up at the end of the chapter.
HI Karthik,
Thanks a lot for teaching these concepts.
My query is:
1) From delta v/s IV, can we infer that in case of high IV, gamma of OTM & ITM would not approach 0.
2) In excel sheet, in bin width why did you divide the range by 50 ?
Not sure about your 1st query. Divided the bin width by 50 to contain all the data within 50 bins. You can choose to have any number of bins you want.
Hi Karthik,
Could you explain about the below points those are getting confused and taken from Volatility Cone excel file?
1. xi-x1
2. (xi-x1)^2
3. =SQRT(1/B$5*SUM(OFFSET(Sheet1!$E$2,MATCH(Sheet1!$N5,Sheet1!$A$2:$A$504,1)-1,0,-B$5)))*SQRT(252)
Thanks & Regards,
Naidu.
These are excel formulas used for the Volatility cone calculation. This section is authored by someone else, will try and get you an answer for this soon.
I got the explanation from an excel expert(excel forum), about excel formulas used for Vitality cone calculation , please find the information below.
For example, is it the use of MATCH and OFFSET? Is it the multplication of SQRT(252)?
The formula calculates the annualized standard deviation of daily (natural) log returns, which are the values in column Sheet1!E. It is a measure of volatility.
The MATCH expression returns the row index (relative to row 2) of the closest date in column Sheet1!A before or equal to the date in Sheet1!N3.
The notation $N3 means that we use N3, N4, N5 etc as we move down each column of formulas.
In contrast, the notation $A$2:$A$504 means that we always use A2:A504 in each formula.
The OFFSET expression returns the cell range of values (log returns) from column Sheet1!E corresponding to the last B5 (number of) dates ending with the relative row index returned by MATCH.
The notation B$5 means that we use B5, C5, D5 etc as we move across each row of formulas.
In contrast, the notation $E$2 means that we always use E2 in each formula.
The expression SUM(…)/B$5 calculates the (population or exact) variance of the daily log returns referenced by OFFSET.
The expression SQRT(SUM(…)/B$5) calculates the standard deviation of the daily log returns.
The daily standard deviation is annualized by multiplying by SQRT(252) according to the \”square root of time\” rule, assuming 252 trade days per year (on average).
—–
The (population or exact) variance of a set of data is Sigma((x[i]-xhat)^2) / n, where x[i] is each of n data points, and xhat is the mean of the data. (The operation ^2 is the square of the calculation. Sigma is the sum of the calculations.)
Ostensibly, the values (x[i]-xhat)^2 are calculated in column Sheet1!E, based on the calculation of x[i]-xhat in column Sheet1!D.
However, the calculation in column Sheet1!D seems to be incorrect.
At a minimum, the reference to J4 in Sheet1!D3 should probably be written $J$4, so that J4 is referenced in each formula down the column.
Also, Sheet1!J4 should probably contain the formula =AVERAGE(C3:C510). [Errata]
I\’m going to share this with the guy who created the Volatility Cone and wait for his feedback 🙂
Hi Karthik,
Any update on why the volatility cone excel provided is having a reference to \”J4\” in sheet1 formulae.
Also i understand, it is important to understand if volatility might increase or decrease to decide on weather to go long or short on option. And we may use Volatility cone to determine if the volatility might increase or decrease. Request to confirm my understanding.
In addition, is there any other way apart from volatility cone to determine if volatility might increase or decrease.
Thanks again for the write up. Very useful.
That\’s absolutely correct. Volatility cone helps you develop this perspective. There are other volatility models like GARCH and ARCH volatility models. These can get quite complicated.
Thank You Karthik.
Googled about realized volatility and found http://www.realvol.com/VolFormula.htm which explains why mean ( \”J4\” ) is zero as follows. Request to review and confirm.
————————–Extract from website ———————————————-
Mean Set to Zero
The RealVol Daily Formula starts with the traditional formula for standard deviation and modifies it in a few key ways. First, we set the mean to zero in order to provide “movement regardless of direction” instead of “movement about a mean or trend.” Doing so makes hedging easier for options traders and corresponds to the formula used for variance swaps and volatility swaps in the over-the-counter market.
————————–Extract from website ends ———————————————-
Will do try and do that when possible. Thanks.
Friend could you match the calculations for volatility cone for atleast the 10 days for one month.
Eshwar
Hi Karthik,
Could you please explain about this =SQRT(1/B$5*SUM(OFFSET(Sheet1!$E$2,MATCH(Sheet1!$N5,Sheet1!$A$2:$A$504,1)-1,0,-B$5)))*SQRT(252) ….. Calculation?
I tried to understand but getting confused.
Thanks & Regard\’s,
Naidu.
=SQRT(1/B$5*SUM(OFFSET(Sheet1!$E$2,MATCH(Sheet1!$N5,Sheet1!$A$2:$A$504,1)-1,0,-B$5)))*SQRT(252)
C
Hello Karthik,
Could you please provide any web based tool or exel for Volatility Cone calculation as you had mentioned earlier. Thanks in advance.
I\’ve not found anything reliable that I think is worth recommending. Will keep you posted when I find something interesting.
Could you add option geeks on Kite real time charts?
We would probably do this sometime in the near future.
Hi Karthik,
Consider the article below http://www.theoptionsguide.com/delta.aspx. They said
\”As volatility rises, the time value of the option goes up and this causes the delta of out-of-the-money options to increase and the delta of in-the-money options to decrease.\”
From the graph in the article, the delta of ITM comes down (from 1 to 0.95) with increase in volatility.
Doesnt delta and volatility linearly related ? From the graph, ITM options delta is not linearly related to volatility. pls clarify
No, there is no linearity when it comes to options.
@above, when the volatility is high the Deep ITM calls/puts doesnt hit 1/-1 ??
Nope, for reasons explained earlier.
@above, I mean with increase in volatility, the delta of put should also increase. The put options has best delta of -1.
With increase in Volatility, the rate at which the delta changes increases.
Hi Karthik, kindly answer the following questions.
1) If the volatility increases, (i) delta increases (or) (ii) rate of change of delta ?
2) Isnt the rate of change of delta = gamma ?? Then, if the volatility increases gamma increases ?
3) The above graph (delta vs implied volatility) shows that, for a deep ITM call/put options with the increase in volatility, the delta plotted is 0.9/-0.9 (approx) i.e not 1/-1. How can delta at high volatilty (40%) be less than delta at low volatilty (20%) ??
4) vega talks about change in premium w.r.t change in volatility. Does vega (volatilty) effects delta as well a part from premium. Please clarify, vega vs delta;
1) Rate of change of Delta
2) Yes,but do note that the gamma peaks at ATM…which also explains why Delta is upper and lower bound
3) Think about it non mathematical terms – when Volatility increases the chance of stock moving haywire is greater…hence deep ITM options also get reactive…this is exactly why delta is not strictly 1 when volatility increases
4) Yes
Hi Karthik,
In the above graph (delta vs implied volatility) why is that ITM of put option has delta > -1 when volatility is 40% (blue line) ?? When the volatility is more, premium increases for put option acc to http://zerodha.com/z-connect/wp-content/uploads/2014/08/put-vs-vega_v1.jpg . Then why is it that here, the delta is > -1. According to above graph (put vs vega) the delta with volatility should be better than without volatility. Correct me if I am wrong. Eagerly waiting for your response.
The put delta is capped to -1, and cannot be greater than -1…and -1 is the maximum delta a put option can gain….which is what happens when the put option is deep ITM. When Volatility increases the rate at which delta changes increases…which is what the graph is trying to convey.
kartik
I think Delta can not be less than -1 by value in PUT …(It can greather than -1 .. e.g. -0.95. -0.55 ..etc.
Yes, Delta cannot go below -1.
When can the Volatility cone sheet be uploaded? Appreciate your input.
Hopefully over the next few hours.
Kindly put a link of volatility cone excel sheet for downloading. Thanks
Its there already I guess.
Hi Karthik,
Can you pls post that sheet for volatility cone?
Also, one question. May not be related to above though .. Who actually trades during pre-market hours between 9-9.15 am on nSE?
Will upload it positively this week!
Anyone can place orders in the pre market session.
Whenever I try to buy shares in that window system debars me. Are those orders over night orders which get settled in that window?
Not sure what you mean? Which window are you referring to?
Window means that 9 am to 915 am window.
Eagerly waiting for Volatility cone excel sheet………….
Sure, I will try and upload it by this week.
Sir, can you provide an excel sheet showing the volatility cone calculation and plotting.
Sure, will do.
How could you find the historical volatility of individual NSE stocks for each month like nifty? i was searching it in the nse only i could find the historical data of stocks but not the volatility at different time periods. we could calculate it like you showed in previous chapters.
Yes, you will have to calculate the historical volatility numbers…its not available online. I\’ve explained this in Chapter 16 I guess.
Yes you have explained it perfectly in the last chapter. very easy to follow. thank you.
Welcome!
Where can I find the excel for cone and SD
Hi Karthik,
Could you kindly address the queries in the attached picture?
Looks like some confusion, thanks for pointing this. Will correct the same.
Too tedious and very exhaustive. Good for those who want to do PHD in options. In order to trade in options, one has to have understanding option geeks(Basic), OI, Max Pain. Lastly, few good option strategies.As its time for quaterly results, strangle and straddle option strategies turns out to be profitable. If one has to trade options on Intra Day basis, select liquid stocks and strike price whose detla is between 0.5 to 1 which is ITM.
Hmm, learning options is certainly time consuming. Wont happen in a hurry, but it certainly is worth the efforts!
Thanks a lot karthik.
Welcome!
Thank You.
I\’ll try some combinations and take your vies on them.
Sure, please do!
@karthik : could you please explain \” Volatility Cone\” in excel Step by step ?
Vaibhav – This week for sure I will get the excel up and running. This has been long overdue.
@KARTHIK : waiting for excel sheet.
Yes Anurag, I\’m trying my best 🙂
Addendum to DELTA calculation:
I would like to be very transparent about my calculation as I have gained knowledge only from your portal.
At NIFTY 7346 , 7300PE DELTA : 0.4 Gamma: 0.002, GAMMA measures the rate of change of DELTA.So for an approx 100 point move, 100 x 0.002 = 0.2 Since I did not want to calculate the change for every 50 points , I took the average of 0.2 (ie 0.1) and applied it to the range and subtracted 0.1 from 0. 4 and arrived at the new DELTA of 0.3. I know It may sound crazy but hat is the way I did it.Somehow the results co- incided with the calculation pretty accurately. Boss You have to tell me wether this is correct or a mere coincidence. Based on your reply I would be able to take more rational decisions going forward
Avinash – not sure if you can take averages here. Can I suggest something? Please try this calculation over and over again for few options…you will get a sense of this.
Typically this is how it works, and I\’m sure you already know this –
Delta – x
Gamma – g
Premium – p
This means for every 1 point change, premium changes by x units.
Also after every point change you need to reset the delta value based on gamma. Measning for every 1 point change, old Delta would change from x to (x-g).
Addendum to previous post:
AT around closing ie NIFTY 7436 I checked the DELTA of 7300PE in the portal calculator it showed 0.28xx , only thing I didn\’t to take a picture of the same.
Dear Karthik,
Thanks for the quick reply.
The reason why I calculated the combined DELTA as 0.6 is like this.
NIFTY at 7346 ,DELTA of 7300PE is 0.4, as NIFTY moves to 7400 DELTA becomes 0.3, further up 36 points it would be less than 0.3 , so instead of calculating DELTA for every 50 points change in NIFTY I took an average of 0.3 per lot X 2 lots = 0.6. So 90 points X 0.6 = 54 points drop in PE combined premium. The profit worked out to be diff of DELTA ie 0.4 X 90 =36 points, 1-2 points here and there.
But this thing about VOLATILITY having a greater impact on long duration options I was not aware of.
I do not know whether I am correct, but the results at EOD worked out that way. Kindly advise.
FOR Yesterday what would be a better HEDGE trade for FEB series I would like an example.
Volatility does make a big difference. What you did is a classic hedge i.e buy Fut and Sell options. Suggest you try out call ratio back spread or bear call ladder? These are all hedged option strategies.
First of all it would be a great sin if I don\’t thank you for what you are doing. Thanks sir for teaching every minute topic with great details leaving no point to wonder or ponder.
my doubt: If i bought deep OTM CE long nifty index at very low price, let say Rs2, if some big event happens (though rare) and premium goes to Rs20. Then sir will there be buyers to purchase my contract? [i feel those who had shorted earlier will be in great loss and would be looking to square off and hence will buy my contract]. I must sell the contract to avoid high STT. sir, what would be the liquidity situation in such case. Are there times when such situation land long call person in trouble or is it ok with nifty no matter what the situation is??
Thanks for the kind words, Harsh!
Nifty, in particular, has abundant liquidity, so transacting in this contract should not be a problem.
Dear Karthik,
What is your view on my JAN NIFTY Futures Hedged trade, what would be a better hedged trade in this scenario.
Posted a reply.
Dear Karthik,
I started reading the options theory 10 days back and read all the modules twice during this period.
Today I decided to execute a virtual trade in F&O. Options calculator is available on my online trading portal.
I was slightly bullish today morning as world markets were suggesting, I decided to buy 1 lot of NIFTY Futures JAN28 @7346/-. Since the market has been highly volatile I decided to hedge the trade at the same time by buying 2 lots of options 7300PE@48/- at 9:51 am.( The DLETA at that level was 0.4, combined DELTA 0.8)
In the event of NIFTY going up,from your teachings I could calculate that for every point gained in NIFTY (ie for every 1 Delta earned I would lose approx 0.6 delta ie the combined delta of 2 lots of 7300PE, after taking into account the reduction in delta as the Nifty moves up 80-90 points .
The trade worked exactly that way and by EOD NIFTY futures were at 7466. ie 90 points up and the 7300PE was trading @22/- ie 26/- down and as calculated for a 90 point profit in NIFTY I lost 0.6 DELTA X 90 on the put options ie 54(in actual 52 points) point loss combined. Net profit for the trade was 90-52= 38 points it remained that at EOD.(Profit 0.4 DELTA X 90 =36 points almost correct calculations)
I was feeling FANTASTIC and thought I can now be confident about this kind of trade and trade it regularly, UNTIL tonite when I sat to review my trade I was Shaken.
What Surprised me was when I tried to apply the similar trade on FEBRUAY contract the results were bad and it was disturbing. The strikes were exactly similar ie 7300PE but I lost , for the same 90 point upmove in NIFTY I lost a total of 80 points by EOD on the combined PUT position, compared to the 52 point loss in JAN trade. The NET profit turned out to be only 10 points (90-80).
The IV were almost similar at EOD 7300 JAN was 22.4 , FEB 20.29.
Can you please explain what went wrong , why did the results vary for FEB and what would be a better trade for FEB if executed today.
My question is too long , your answer will be appreciated and will help me improve the next trade.
Sorry Typing mistake, BY EOD NIFTY futures were 7436 not 7466 as mentioned earlier.
Avinash – I\’m a bit confused about your calculation, 2 Put options each with 0.4 Delta adds up to a total delta of 0.8. So for every 1 point up move your position losses 0.8 Deltas…so for 90 points up move you are likely to lose 72 points from the total premium i.e 98. So by EOD the premium value is likely to be ard 26…i.e 98 – 73 . How did 0.6 delta feature here?
Anyway, before you understand why this does not work well for Feb, you need to understand why this worked for Jan.
It worked because we are close to Expiry, theta is peaking (remember theta acceleration), and as we approach expiry Volatility has a lesser impact on positions ass compared to the effect on premiums at the start of the series.
Since Feb is too far and there is ample time to expiry, Volatility has a far greater impact. So besides Delta, the Vega is also playing a drag on premiums.
Also, the next chapter in Options module includes a simple arbitrage example, you may want to check that for Feb!
Sorry to say, but either there is some typo in Volatility cone or my full concept is wrong, i.e. In AUG 2015 Nifty dipped from 8466 — 7809 — 7945 in last 10 days before expiry, but volatility in your figure is very less. Please upload excel sheet.
Anurag – Volatility cone bit has been authored by someone else. Will try and get the excel soon.
Also wanted to ask, it is ok to choose options(Security as well as strike) by checking IV column (if selection to be made by checking IVs)from nseindia.com option chain?
Yes it does. Simple rule – buy options when the IV is low and you expect it to go high. Or Sell options when IVs are high and you expect it to go down.
Karthik, Can you please give me the link of your excel sheet?
All excel sheets are uploaded except for the Volatility Cone. Will do that soon.
Option Greek value table
A gentle reminder please for Volatility cone excel sheet. Thank you.
hi karthik i have one doubt , how did u calculate sd ,mean , for different days to expire to plot, and how did u get annualised return of each month, thanks in advance
Its explained in the excel Nithin…can you please check once?
I understood how to calculate daily returns and annualized returns and SD and Mean, but thing i didnt get is how to calculate mean , SD for different windows (10 day, 20,30, etc like u caluclated and tabulated the values) ..thanks
Nithin, will be putting up the excel shortly!
Hi Karthik
1) For drawing Volatility Cone how can I get the data of Annualized Realized Volatility specific to x no. of days till expiry for different months?
2) In the last Delta vs IV graph how did you come to the curve with IV of 20% and 40%? (Since IV for different Strike will be different always)
Thanks
I\’m supposed to be putting up the excel sheet (I know its over delayed)…will put it up shortly and it should sort out many of your queries regarding the calculations.
Hey Karthik, waiting for the excel sheet. 😛
It will happen only by next Month Vivek. The guy who authored that section is getting married this week 🙂
Hi Karthik, Can you please explain your historical volatility calculation in little more detail for 10/20/…day periods. I have tried doing this calculation with the data from NSE website, but my calculation are not matching with the numbers given by you in volatility cone. Thanks.
Historical Volatility calculation is explained here – http://zerodha.com/varsity/chapter/volatility-calculation-historical/
I have already followed your calculation and the corresponding excel sheet used by you. What I am reporting here is,
for example, the calculation for volatility cone, for 10 days windows, annualized realized volatility seems to be incorrect, eg. you reported 26% for Dec. 2014 in the table, but the correct number is 18%. Could you please provide excel sheet that you used for your realized and annualized volatility calculation for 10 day window size. Thanks for your good work.
Vijay – I will put up the excel sheet soon. Sorry for the inconvenience.
\” ITM options behave same as underlying \” —— don\’t they tend to loose value faster than the underlying ?
what about DEEP ITM options ?
Deep ITM has a delta of 1, which means to say that for every 1 point movement in the underlying the option also move by 1 point. Hence same as the underlying.
Sir, in the interpretation you mentioned that \”option 8200 CE, expiring 29-Oct-2015, then it means that today 8200 CE is experiencing an implied volatility, which is higher (by +2SD) than the volatility experienced in this stock whenever there are “43 days to expiry” over the last 15 months [remember we have considered data for 15 months]. Therefore this option has a high IV, hence the premiums would be high and one can consider designing a trade to short the ‘volatility’ with an expectation that the volatility will cool off.\” but on checking the historical data of 8200CE for past one month in NSE website (http://www.nseindia.com/live_market/dynaContent/live_watch/get_quote/GetQuoteFO.jsp?underlying=NIFTY&instrument=OPTIDX&expiry=29OCT2015&type=CE&strike=8200.00#) the premium price never came down. Could you please explain the reason?
The premium has comes down.
On 24 sept option premium opened at 49 at achieved a intraday high of 61 and on 9 oct it was trading at 153 (current month high) so, if i had shorted the option on 24 sept i would have been in loss
Yes.
waiting for ur excel sheet v good work u hv done to trade options
t & R
Sure, will post it soon.
Dear Karthik, Can you pl. elaborate the calculation done for Mean, 1SD , 2 SD for 15 Months Nifty Volatility & for 10, 20, 30 .. Days calculation.
Its very confusing, thoough i read previous chapters many times? Can you pl. simplify.
Ashwin – will put up the excel sheet soon, that should clear the confusion.
Waiting for your sheet sir, Please posit it ASAP. It will help lot of us… As of now i am using options oracle but the IV value differ a bit as compared with IV shown in option chain shown in NSEindia website.
Will upload as soon as possible. Thanks.
I have seen a few charts and searched on net regarding profit and loss. All say one Standard thing \” ON THE DAY OF EXPIRY \”. In the previous chapters I found the BULL CALL mentioned by you . I looked for that on internet.
My question is:
1. Will the profit and loss be equal OR be the same if I decide to square off before expiry?
2. Can we make any Excel sheet for calculating Profit loss before the date of Expiry?
1) The P&L for on the day of the expiry will be different from the P&L before the expiry
2) This would be difficult as there are multiple factors that weigh on the P&L.
what is put-call parity? what does it significance
Put Call Parity talks the relationship between the Call and Put option premiums and the arbitrate opportunity arising out of it. Will talk about it shortly in subsequent chapters.
what is option equilibrium and what is difference from delta neutral, please explain
Not sure about option equilibrium price. Can you please elaborate a bit?
For delta neutral check this chapter – http://zerodha.com/varsity/chapter/delta-part-3/, section 11.1, Case 4.
The option chain of SBI shows different implied volatility for different strike prices. In last chapter you taught that volatility is same as standard divination. What is the reason for different IV. Is it that IV depend on other parameters as well ?
This is exactly the reason why we have Volatility smile! One reason for this is that the option prices also factors in \’demand supply\’ situation in market which is not really captured by other greeks.
First of all, thank you to the entire team of Zerodha for initiating Varsity. I have been through the entire module of options and waiting for the rest of it. I have a request can you please throw some light on put-call ratio and how to apply it in trading.
Thanks Yogita. PCR will be covered in the next module which is on Options Trading Strategies.
the gamma of ATM option shoots up near expiry. the gamma is also the highest for an ATM option otherwise too. the delta of an ATM is influential when the volatility is low and even more sensitive when it\’s high. in fact, when it\’s high the delta of strikes around the ATM is influenced too. i guess, it means buy an ATM option closer to expiry and watch it shoot up ( i.e if your directional call is right). does all this mean trading in ATM is a safer bet? thanks.
Yes – trading ATM, especially near the expiry always makes sense. OTM options can be most dangerous around expiry.
The materials provided is very concise and very useful. Thanks a lot.
When can we see Zerodha pi having features like thinkorswim platform , where trading options are much more simpler
Hopefully very soon 🙂
Today initially NIFTY traveled Northward and turned South and around 1 PM collapsed about 140 points within a hour. Can we calculate/predict it from IV, Gamma. Theta, Delta, smile and cone etc.
No sir..predicting the direction is quite a tough task. You can attempt to do so with some candlestick pattern….but the Greeks will not help (as far as I know).
hi karthik, following is the calculation of Infosys CE1160 september 2015. : life of option – 2 days (calculated today)
interest rate @ 7 %
security price @ 1128
strike @ 1160
volatility @35.95
option price @2.413 ( as per calculator)
delta@ 0.1548
gamma @0.0079
theta @ -1.7231
vega @ 0.2002
with this information, if underlying moves by x, we know the movement of premium thanks to delta and gamma. what else can we infer? apart from the fact that the option will lose value due to theta and the impact of volatility on the premium due to vega. do comment. thanks.
Well, it is just about that 🙂 Most of the times you end up using Delta, Gamma, and IV data…the rest of the numbers helps you quantify. For example if all else stays the same I know the premium will drop by 1.7231 points t\’row (thanks to Theta).
hi karthik, how do we plot the volatility cone? what platform do we use for the same? secondly, how is the annualized realized volatility and hence its mean and variance calculated? thanks.
You can plot the Volatility cone on excel, although the logic could be a bit tricky. For the calculations, I will try and put up an excel sometime soon.
Although Karthik has already answered this, but may I still suggest that if you are familiar with MATLAB; plotting of volatility cone using MATLAB is lot easier.
Oh yes, MATLAB is good…in fact even \’R\’ is good.
Well thanks karthik/sunil. is there a way to learn how to plot the cone on MATLAB or R….i am not aware of either of them. secondly when you calculate option greeks, the inputs that are dynamic are spot price and IV. both of them change constantly. when you keep changing them on the calculator, you can see the delta and vega go up with an increase in IV. the gamma remains constant. this was for an OTM call option of bank nifty… i need to know, if we have to constantly calculate the same as the price and IV change or just decide the underlying will move by X and calculate the premium( based on delta and gamma)? i mean summing all and taking the correct strike is proving difficult. thanks.
Not sure about learning MATLAB, R etc. Maybe you should try Coursera, they may have a course there for free.
Yes, the greeks are dynamic. On a normal day when the volatility is not much I dont really calculate the greeks constantly…once a day before initiating my trade usually works for me.
Sir, I am doing option trading, till date i had not write any option, just doing buy & square off both call & put option. You are explaining the things quiet easily. But i want to know from where we can plot this graph & find the right time to enter as you know for trading the option is fast process. Thanks in advance.
Deval – unfortunately Options cant be traded based on charts. As you can see there are many dimensions for Options trading which goes beyond simple charting. For successful options trading you need to develop a deeper understanding of Greeks and associated theory…which is the focus of this entire module.
this was really educative and very informative. but where can we find volatility cone live for nifty options? Also need some help to select proper strike. where can i find high volumes, with delta and implied volatility values in table form but live during market hours? thanx for ur help
Suresh – you need to comprehend all the Greeks to identify the best possible strikes. However towards the end of this module, I will share few pointers on this. For all other variables you can use a standard B&S options calculator, which is the focus of the next chapter (chapter 21).
Volatility cone is a very interesting concept – I cant guarantee, but we will try and develop a web based tool for this sometime soon.
This one is tough to understand….Need to read 2/3 times.
This is indeed a tricky concept Sir, but not tough :).
Please do let me know which part you are finding difficult…I will be happy to take you through it.
Gamma Variation with Time Graph.
On this graph, due to the introduction of Surface Line, I m not able to plot the actual line of OTM, ITM and ATM exactly,
And as I am stuck on this I am not able to read those followed graphs. Could you please help me with it.
This can be a quite challenging, Ravindra. How are you generating this graph? You need a 3D surface plot for this. I took my friend\’s help in rendering this in Matlab.
So Sir can we assume that as of the above stated graph of \”Gamma vs Time to Maturity\” can we mash-up that with \”Gamma Variation with time\” to help myself read the graph ignoring those mentioned Red Arrows ?
Will that be a good attempt to start reading 3D graphs ?
Hmm, sort of. If I\’m not wrong, I think the Gamma vs Maturity represents that of an OTM.
Dear Mr. Karthik Rangappa,
Can you please explain as to how you arrive at 1 SD and 2 SD under volatility cone?
Thanking you,
P.K.Ramakrishnan
Sir, its explained in the chapter.
Dear Sir,
Thank yor for your valuable contribution. Can we have topic on how to read option chain?
Check this, Abhay – https://zerodha.com/varsity/chapter/moneyness-of-an-option-contract/
Sorry Karthik,
But I too can not understand how you arrived at 1SD and 2SD under volatility cone.
Thanks.
Where exactly is the problem, Ram?
Karthik how did you plot the points there ??
These were developed on R software, Sapan.