18.1 – Mutual Fund metrics
By now, I suppose we understand different types of mutual fund categories and what goes under the hood of each of these funds. While we have not covered the entire gamut of funds, I think we have covered the most important funds across both equity and debt.
Probably I must have discussed the Balanced fund as well, not sure why (and how) I missed that. But I also believe we have laid down a foundation for structured thinking about funds and their mandates. So I’d request you to please look upon few balanced fund factsheets, read it along with the SEBI’s classification and you will understand how the balanced fund works. Otherwise, you can always drop your queries here, and I’ll be more than happy to answer them for you.
Anyway, I think we are now one step closer to understand how one can build a mutual fund portfolio for different financial goals. Before we get into the building MF portfolios, we must spend time to understand few mutual fund metrics that help us understand mutual funds better and the ways to differentiate good funds from the not so good funds.
The metrics that I’m talking about are all mentioned in the Mutual fund factsheet, and few others are mentioned in the 3rd party website such as Morningstar and Value research. We need to pick and choose the right set of metrics to learn and ignore the pointless ones.
Over the next few chapters, we will understand the following metrics that are usually published by the AMCs for the different schemes that they run –
- Returns – Absolute, CAGR, XIRR
- Rolling Returns
- Expense Ratio
- Benchmarking
- Exit load
- Portfolio turnover ratio
- Standard Deviation
- Beta
- Sharpe Ratio
- Capture ratios
Of course, along the way, if I feel I’ve missed an important metrics, then I’ll just add that to the list and discuss the same.
So as you can see, we have a lot to cover, so let’s get started.
18.2 – Measuring MF investment performance
Mutual fund investors often get confused with the way returns are measured across investments. Most investors apply the standard return measurement technique across all types of investment. Doing so leads to wrong return calculation and therefore, wrong analysis. Return measurement is one of the key aspects while analyzing a mutual fund. We should start our discussion with the basic concept of return measurement.

For the sake of this discussion, I’ll assume that you are familiar with the systematic investment plan or the SIP. I guess the AMCs and the regulators have managed to do a phenomenal job at conveying the concept of SIP to every taxpayer in the country (well, all most all).
Hence, I will not spend time to discuss what a SIP is and its massive advantage for an investor. If you are not familiar with what a SIP is, I will request you to spend a little time on the internet; there are tons of great articles with SIP calculators to help you understand what a SIP is and how to set up one.
However, for the sake of the completeness of this discussion, let me highlight two popular investments techniques –
Lumpsum investments – In a lumpsum investment, an investor decides to invest a random amount (based on cash available) at one time. Example – I get a yearly bonus of Rs.1,00,000/-, of which I decide to invest Rs.75,000/- in a mutual fund.
Systematic Investment Plan (SIP) – SIP investments requires you to invest a fixed amount of money on a fixed monthly date in a designated fund. The investment can be weekly, fortnightly, monthly, quarterly, or even once in 6 months. For example, my very first SIP was set to invest Rs.2,500/- on 5th of every month in Sundaram Midcap fund. There is no end date to this and can go on for as long as possible.
The way one measures the return for these two investments is very different. Most investors take the starting and ending value of their investment and figure out what the return is. While this is one way to measure returns, this is not the only way. While measuring return, you need to factor time into consideration.
For example, if I tell you that I made an 80% return on a certain investment, what would your first reaction be? I guess you’d say its amazing.
Now, what if said that I made 80% over 15 years? Does it look attractive? I don’t think so, right? Time adds a very important dimension while we measure the return. Hence it is always important to consider time.
Given the two types of investment, let us separate these investments into different time buckets –
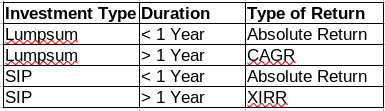
The table above helps us understand the different types of investment and the respective type of return we should calculate. For example, we should calculate the absolute return for a lumpsum investment which is less than one year. Likewise, we should look at the XIRR return for a SIP which is older than a year.
Although for you as a mutual fund investor, you don’t really have to learn how to calculate the absolute return, CAGR or XIRR because there are tons of free return calculators available online. However, I think it will just make you a prudent investor if you take a little time to figure out how this can be done.
Let’s start with the absolute return.
Remember Absolute Return matters only if the investment is less than a year. It could be a lump sum or a SIP, but as long as the investment is less than a year, use absolute return.
The calculation is straight forward. Here is an example –
On Jan 1st 2020, I invest Rs.25,000 in a Mutual Fund. On July 7th, the value of this fund is Rs.30,000/-. What is the return generated?
You should recognise that this is a lump sum invested and is under a year.
The absolute return can be calculated as –
[Ending Value/Beginning Value] – 1
= 30,000/25,000 – 1
= 20%
Let’s take another case. An investor invests Rs.5,000/- every month in a Mutual Fund. After six months, the value of the investment is Rs.35,000/-. What is the return experience here?
We know that this is a case of SIP investments.
Monthly investment – Rs.5,000/-
Number of months – 6 (less than one year)
Total investment value = 5000 * 6 = Rs.30,000/-
Current value of investment = Rs.35,000/-
We need to apply the absolute value calculation here –
=35,000/30,000 -1
=17%
For SIPs less than one year, we can indeed calculate XIRR, but from my experience, the most investor will not comprehend this number well as it is non-intuitive.
Let us revisit the SIP for less than one year a little later to understand why this may not be the best choice. For now, all you need to know is that if an investment (lumpsum or SIP) is less than a year, then you have to use absolute returns.
Next up is the CAGR.
CAGR or the Compound Annual Growth Rate measures the ‘rate at which the investment is growing’. Let us take a quick example and deep dive into this –
I invest Rs.25,000/- on 1st of July 2017 in a certain Mutual Fund. Three years later, the investment has grown to Rs.40,000/-. What is the return on this investment?
I’ve kept the question in bold to draw your attention to the question itself. We will revisit that in a bit.
You should identify that this is a lumpsum investment. Since the period is more than one year, we need to use the CAGR to calculate the return. The formula to calculate the CAGR is straight forward –
[Ending Value / Starting Value ]^(1/n) – 1
Where n is time in years. Let us apply this formula –
= [40,000/25,000]^(1/3)-1
= 16.96%
The investment made in this fund has grown at a rate of 16.96% on year on year basis. Recognise that this is the growth rate of the investment.
The most common confusion for the investor is this –
I invest 25,000, which has grown to 40,000, which means a profit of 15,000. The return should is about 60%, i.e. 15K profit on 25K investment.
Of course, there is nothing wrong with this calculation. After all, this is the absolute return we are calculating here.
The question, however, is that did you get this 60% in the first, 2nd, or 3rd year? Was it that you got the entire return in the 1st year and since then the investment has stayed flat? Or was the return generated in the 3rd year with the first two years netting zero return?
Of course, one can get into the depths of this and figure the details. But otherwise, we simply ignore the specifics and take the average growth on year on year basis. Higher the average the better investment this is.
To put this in perspective, think about a road journey. Let us say you are travelling from Delhi to Jaipur by car.
If I ask you at what speed you drove your car, will you tell me that your drove at 80 kmph from Delhi to Gurugram, 110 kmph from Gurugram to Panchgaon, about 90 kmph between Panchgaon to Neemrana so on and so forth or will you just tell me that you drove an average speed of 100 kmph?
You won’t give me the split; you will give me average speed.
Likewise, when we look at a multi-year investment period, the years in between are like the town on a journey. Based on the market conditions (just like the traffic) investment generates different returns (like driving at a different speed) during these years. Some years may be positive, and few may be negative.
As a long term investor, we ignore these yearly variations in returns and take an average return of the investment, which is what CAGR does. It is the growth rate of investment.
Now, go back to the initial question, which was intentionally kept in bold. Do you think that is the right question?
No, the real question to ask should have been – ‘ I invest Rs.25,000/- on 1st of July 2017 in a certain Mutual Fund. Three years later, the investment has grown to Rs.40,000/-. What is the growth rate of this investment?
I hope you get the subtle but a very important distinction between the two different questions.
Ok, let’s go back to the Delhi and Jaipur example. I know that the average speed is 100 kmph. At this rate, how much time will you take to reach Ajmer, which is another 150 km away from Jaipur?
Quite easy – I know the average speed, so you are likely to take about 1 hour 30 mins to reach Ajmer.
On a similar note, I know the investment grew at 16.96%. What is the likely value of my investment if I let this investment run for another say one year?
Quite easy –
Current value at the end 3rd year = Rs.40,000
Growth Rate – 16.96%
Tenure – 1 yearExpected value = 40,000*(1+16.96%) — > I’m basically incrementing 40,000 by 16.96%
= Rs.46,784.28/-
Let us twist this a bit, what is the likely investment value if I let this investment run for three more years?
The formula is
Current value *( 1+ growth rate)^(time in year)
= 40000*(1+16.96%)^(3)
= Rs.64,000/-
This is also called the future value of the investment given a certain growth rate.
I hope you now appreciate why we need to consider the CAGR and not absolute return if the investment is more than one year.
One last thing you need to note – Higher the average speed, faster you will reach your destination. High speed also comes with high risk. Likewise, higher the CAGR, higher is the rate at which your investment is growing. The risk too is high in such investments as there could be fears of a crash in the underlying asset prices.
Anyway, I hope you are now clear about the distinction between absolute return and CAGR and when to use which one.
We will now shift focus on XIRR, which is applicable when we do SIP over multiple years.
XIRR stands for Extended Internal Rate of Return. XIRR comes in handy when you make regular investments in a mutual fund over an extended period. Hence for SIPs, you need to use XIRR to measure the growth rate.
Assume you invest Rs.5,000/- on 10th of every month in a mutual fund. You started the investment process in December 2018; you continued to do so till June 2020. The SIP table looks like this –

So across 19 months, Rs.95,000/- has been invested. The investment amount is within the bracket to indicate that it is a cash outflow from your bank account.
Now, as on today, i.e. 10th July 2020, the value of this investment is Rs.1,10,000/-. Question is what the growth rate is? Of course, you can calculate the absolute return here. Still, hopefully, by now, you should recognize that this is a multi-year investment and absolute return does not serve any purpose.
The traditional CAGR also does not help because there are multiples investments across multiple periods. However, we still use CAGR, but with slight modifications. One can say that XIRR is a modified version of CAGR which accommodates for staggered investments.
The XIRR formula is quite intimidating. I’d suggest you do a Google image search with ‘XIRR Formula’ as the keyword and you’ll know what I’m referring too. But luckily we need not have to apply that formula.
MS Excel has an XIRR function that you can use. The function itself is quite straightforward to use –
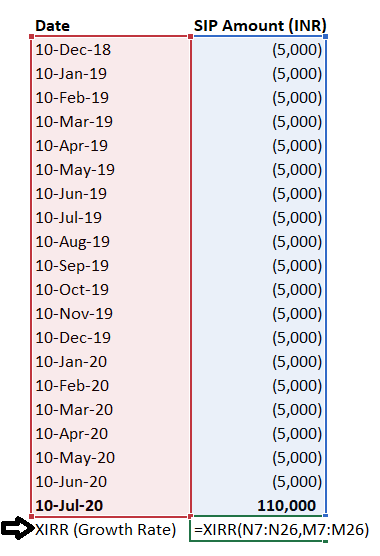
If you notice, I’ve included the current value of the investment, I have highlighted this in bold (above the arrow mark). The number is not in brackets to indicate the fact that I can get this as positive cash flow into my bank account if I decide to exit the investment today.
The excel function to calculate XIRR requires two inputs –
- The series of cash outflows and the current value of the investment
2. The respective dates of cash flow and the date of the current value
Once you feed these inputs, excel does what it is supposed to do and throws out the XIRR or the growth rate number for you –
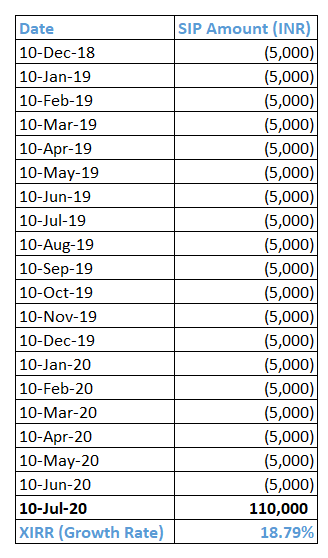
As you can see, the growth rate or the XIRR is 18.79%.
Now, if you scroll up, you will see that I mentioned that you could use XIRR for returns for less than one year, but it’s non-intuitive, therefore its better to stick to absolute return.
Let me demonstrate why so. Have a look at this –
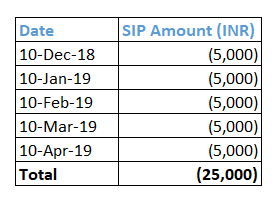
This is a SIP of Rs.5,000/- for five months. The total investment is Rs.25,000/-. Assume the current value on 10th May 2019 is Rs.30,000/-. If I compute the XIRR for this –
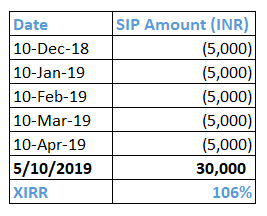
XIRR tells me that the investment has returned 106%. Do you think this is intuitive? I don’t think so, because a regular MF investor sees a gain of 5,000 over a 25,000 investment. It will be very hard to convince him that the growth rate of his investment is 106%.
Hence, for this reason, most platforms show the absolute return for SIPs less than a year, rather than XIRR. In this case, the absolute return is 20%, which is intuitive for the vast majority.
18.3 – XIRR and CAGR are the same
I would like to discuss one last thing about XIRR and CAGR. I mentioned that XIRR is a modified version of CAGR. Both XIRR and CAGR serve the same purpose, i.e. to measure the rate of return over a multi-year period.
It’s just that XIRR comes in handy when we have a SIP kind of investment situation. Now, if you think about it, then XIRR and CAGR should yield the same result for a lumpsum investment made over one year.
Let’s take an example –
Investment date – 3rd Jan 2018
Investment amount – Rs.1,00,000/-
Today’s date – 3rd Jan 2020
Current value of investment – Rs.1,25,000/-
The CAGR works out to –
[1,25,000/1,00,000]^(1/2)-1
= 11.8%
If you run the XIRR function on the same set of numbers –

You get the same answer. I hope you get the logic behind XIRR and CAGR.
I’d want you to do an exercise as a follow-up activity. Please visit an AMC website, or visit coin.zerodha.com, pick a fund and observe how the returns are mentioned. You should now be in a position to understand what is being reported and what the returns mean.
Do share your experience by commenting below.
Up next is the rolling returns of a Mutual Fund. Stay tuned.
Key takeaways from this chapter
- For lumpsum investments less than one year, use absolute return
- For SIP investments less than one year, use absolute return
- For lumpsum investments over a year use CAGR
- For SIP investments over a year, use XIRR
- CAGR is the growth rate of an investment
- XIRR is a modified form of CAGR
- CAGR and XIRR are same for lumpsum investments over 1 year
XIRR is only for overall portfolio on COIN.
Individual fund shows CAGR for all.
Hmm, I hope both metrics are good for your portfolio 🙂
Hi Sir, I came back from your Mutual Funds Series video to learn about XIRR calculation. This was very interesting and really impressed as to how you have articulated this. Will definitely read all you chapters here.
Thanks for letting is know, Goutham! Happy learning 🙂
You forgot to multiply by 100 in absolute return
Checking, thanks.
Hi Karthik,
Can you please explain the breakup of the present value of money that you explained in your second module?
Really need to understand that concept in depth.
I\’ve explained this in detail in the Fundamental chapter, please do check that.
Hi Team,
XIRR we won\’t be able to figure out what\’s the compounded profit, any case we get to know how our profits in the mutual funds gets reinvested in coin zerodha Application? Example how often and how much is reinvested ?
This looks like black box for me
For these specs, you will have to ask the AMC itself. What we get is the end of day NAV.
Mutual fund returns are typically expressed in terms of CAGR, which works well for lump sum investments. However, I\’m interested in understanding the returns for SIP investments. Could you suggest the best way to calculate or evaluate SIP returns?
For SIPs, you can use XIRR returns, a modified version of CAGR.
Dear Sir,
Thank you for your detailed explanation. However, I respectfully disagree with your approach. Evaluating returns on an annual basis provides a standardized way to compare different investments, regardless of the time period. This is crucial for making informed decisions, especially to avoid prematurely disposing of mutual funds due to perceived low short-term absolute returns.
An annualized rate gives a clearer picture of the investment\’s performance and potential, ensuring better alignment with long-term financial goals. Additionally, in conjunction with absolute and XIRR, I will closely monitor medium-term rate variations to make informed decisions on whether to stay invested or dispose of the mutual funds.
Best regards
Bala
Yes, I do agree with what you are saying. For a multi year investment, returns has to be measured in terms of growth i.e. CAGR or XIRR.
Dear Sir, I think I did not express my question correctly. I will post it again differently.
\”The table above helps us understand the different types of investment and the respective type of return we should calculate. For example, we should calculate the absolute return for a lumpsum investment which is less than one year. Likewise, we should look at the XIRR return for a SIP which is older than a year.\”
The above text is copied from your notes on this page. You are advising us to calculate absolute return (not XIRR) for an investment (lumpsum or SIP) less than one year. I just wanted to know the reason behind it. Can you please explain it?
Thanks
Bala
These are essentially two different types of return measurement. Lets say you travel from Point A to Point B. If I ask you what was your speed, then there are several ways in which you can answer –
1) You can breakdown the speed for every kilometer you traveled. For example you travelled at 60Kmph from 1st to 2nd KM, 70Kmph from 2nd to 3rd, 50kmph between 3rd to 4th etc – this is like the absolute return.
2) You can give me an average speed – this is like the XIRR
Now when it comes to multi year investments, I\’m not really interested in knowing what is the return each year, I\’d rather know what is the avg growth rate over these years. This way, I only deal with 1 return and base my investment decision.
But when we are looking at a period less than 1, there is no question of \’multi year avg growth rate\’, as the period under consideration is less than 1. Hence, I\’d ok to take the absolute return.
Hope this helps.
Normally the interest rates or return are annualised. As per your table, if the investment is less than one year, the retun calcualted is based on absolute return and not annualised. Only retunrs above are annualised through XIRR. I am not clear on this logic. Hope it is clear now.
Thanks
Bala
Absolute return is not annualized, Bala. Thats why its called \’absolute\’, to indicate that its all encompassing.
Dear Sir,
I am not clear why we should use absolute return for investments under 1 year. Why not XIRR? If I invest 100,000 for 6 months and the margin is 20,000 then the margin is ideally 40%, isnt it? Why are you considering it as 20%? Please clarify.
Thanks
Please note, the notes are very good. I like it.
What sort of margin are you talking about for 6 months here?
But after 20yrs of investments how will we get that money, means what are the documents or certifications for the investment??
Mutual funds will be in your demat, you can liquidate them anytime. No documents required.
Thanks, this is helpful.
I have a question though, purely theoretical in nature. Why is it called \’extended\’ internal rate of return? What does \’extended\’ refer to? Thanks.
I\’m not sure, but if I were to guess, perhaps to indicate the fact that XIRR measures returns that are extended over time – you can pause, increase, decreases, withdraw, and reinvest at your own pace 🙂
I finally found a method wherein we can calculate the stocks returns form a portfolio aggregate level which takes both returns and stock weightage into account. I calculated the stock weightage and multiplied it with the returns the stock gave till the year end or when I sold it. And I added up all the (weightage * returns) values to arrive at my portfolio level returns. Took me hours to gather all the old data from first. I also included other charges as well. Is this a good approach while calculating our investment returns at a portfolio level, especially direct stocks if they are broken in between? Thanks.
Yes, it is. We have discussed it here – https://zerodha.com/varsity/module/risk-management/
For Return tracking in relation to direct stocks, we often have to sell in between. Sometimes purchase made at one year had to be sold in another year. In that case, wont CAGR give a wrong reading? I\’m going through a similar situation. In that case is XIRR my only method to use from a whole portfolio perspective?
yeah, if investments are broken then CAGR wont help much. XIRR is a better measure.
Hi Karthik,
Thank you for providing this invaluable source of knowledge. I really appreciate it in today\’s times. I am starting late here but I will surely go through all of this.
When I log into Coin or Zerodha app, it displays my P&L with percentage. I guess the amount with percentage are calculated as absolute returns on the whole portfolio level? Like 3L & 13%, these figures are absolute returns? Thanks.
Thats right, Vinay. These are absolute numbers. By the way, we also have a video playlist on Mutual Funds. Check this – https://www.youtube.com/watch?v=6sq2o1atWLY&list=PLX2SHiKfualGsjgd7fKFC-JXRF6vO73hk
Not the same stock sir. What I meant was if analysing annual returns year after year on a portfolio level with purchases at random intervals would be the goal, would CAGR be ideal.
Yeah, in that case CAGR.
1. Thanks sir, but just wondering if you maintain it on a running basis, wont you be having a never ending sheet after doing SIPs for so many years? The entries would be cumbersome. How do you manage this? Do you split your sheets in between?
2. I purchase stocks at random intervals, like 4, 6 or even 8 times a month. In that case would CAGR be the best solution as per your suggestion for yearly returns calculation. (There was a 4% difference last year between CAGR and XIRR and a non intuitive difference this year as you have explained after the recent rally.)
1) One way is to define a proper start and end date. THis could be on a multi year basis.
2) If its the same stock, but multiple investments, then XIRR is better suited.
Sir, I\’m maintaining an Excel sheet for XIRR for more than 1 year to track returns. But what to do when year ends? Because continuing the sheet throughout the years will give a long list and also want to track yearly returns. Given the fact that I buy stocks at random intervals XIRR is my only option. So can I take the final output(current value of holdings) of year 1 and enter that whole sum as the opening debit of the 2nd year for the 2nd year\’s calculation and so on and so forth for the upcoming years? Thanks
Why dont you maintain it on a running basis? Anyway, XIRR\’s key input is date and the excel function takes care of the dates and gives you the output.
When I use the XIRR formula as shown in your example above, I receive a negative answer! Could that be true? I\’ve used the example of a ULIP I had for a dozen years, which I closed.
If I use a simple way of calculating, it\’s a dismal 2% per annum 😭 how I\’ve been taken for a ride all these years!
A negative value is unlikely, but a dismal value is possible 🙂
Kindly recheck the formula implementation once again.
Kartik you are really creating an impact in investment world.
Happy learning, Jugal 🙂
Hi can u explain the XIRR return of 106% plz
Have used the excel function for this. Please see the steps that I\’ve explained.
sir really thankful for the content,
Sir is it that XIRR takes into consideration compounding effect when calculating for multiple periods and the absolute return divide by no of returns will not take it……Am i right?
Yes, XIRR does consider the compounding effect.
How do we check from the Coin portal, the annual returns the mutual fund has actually provided. Also I\’m new to this so want to check if this return is automatically reinvested to compound or do we need to enable it somewhere in the coin portal?
You can check the portal for returns. I\’d suggest you call the support desk, and they will help you with this.
as you stated in our above conversation, how can I get a combined return of the investments if I take absolute return for calculation.
and if I use XIRR then will the return value for the XIRR and absolute be same (ignoring some minor differences)
Yes, the returns should be largely the same.
Eg: If I Invested 1,00,000 in a mutual fund on 1st July, 2022 and 1,00,000 on 7th sep, 2022 and as on 7th Dec, 2022 I redeem it and get 2,05,000.
So, my question is how do we calculate the return for the above investment will XIRR method help, as the investments and the redemption are being done in the same year and if not XIRR how can return be calculate for the above return.
In this case, you can calculate the absolute returns to get a quick perspective. No need to use XIRR (although XIRR is the right technique).
Hi Karthik,
I am confused with respect to the rate that I should take to project the future value of my investment. For example – I have a lumpsum investment in Axis Bluechip Fund (Regular) and my investment horizon is 5 years. As suggested in this module, I am looking at 5 years return of this scheme – 5 year annualized trailing return is 15.64% (21/4/2017-22/4/2022) and average 5 year rolling return is 14.49%. Now if I want to estimate the value of the investment 5 years from now, could you please share which return rate out of these two would be better?
Thank you!
I\’d suggest you consider the rolling return and not the annual return.
Hi Karthik,
I want to estimate the returns for a lumpsum investment over a period of 10 years. I see that the websites publish several returns such as absolute (1, 3, 5 years etc.), trailing, annualized, rolling. Could you please share use case for these different types of returns?
Aman, I\’ve tried to explain the same here in this chapter 🙂
Yeah, Right!
Hello, Karthik!
Firstly, thanks a lot on providing this knowledge with all these structured modules, really loving it.
Very much clear with the concepts, but I didn\’t get the last example that you have taken to show similarities in CAGR and XIRR.
A Rs. 25,000 return on lumpsum investment of Rs. 1,00,000 for 2 years would give us an absolute return of 25% and an average return considering it is for two years would be 25/2 i.e., 12.5%, Wondering how did the formula showed us a 11.8%. Any thoughts where I am going wrong?🤔
Looking forward to hear your thoughts.
Jai, you cannot use the average formal for returns. If 12.5% was true, then by that measure by end of year 1, your 1L turns into Rs.1,12,500 and 12.5% on this results to Rs.1,26,562/- which clearly is not true.
I was really interested in the calculator provided by coin but am unable to find it on the website. Can anyone help me with this.
Which calculator, Sanchit?
Hi Sir , I have a doubt regarding the charges for BUY orders placed for mutual funds. Does Zerodha Coin charge any % fee when placing a buy order for purchasing the units of a Mutual Fund?. ( Just asking it because for example : instead of Monthly SIP , if weekly SIP is opted, the charges on every order would effect my returns in long term. )
Nope, there are no fees from Zerodha plus these are direct funds.
Your articles are so intelligently crafted. Hats off to your work. I was wondering how do we calculate the future value for a SIP using XIRR?
Thanks Krishna.
Future value = Amount invested *( 1+interest rate)^(time). Time is in months.
How would i calculate returns if i\’ve used both lumpsums as well as SIPs for my mutual funds?
You can still use XIRR for this, Anuj.
Very lucid explanations, really loving this module so far. Thanks for making it!
Spotted a small typo in the table that shows which return measure for which duration. The title says \’durtion\’, I think it should be \’duration.
Thanks, Rahul. Will fix that 🙂
Hi Karthik. I would like to thank you for writing in such a beautiful and simple manner. The concepts have become very clear after reading Varsity. A big thank you.
I\’m glad you liked the content, happy learning 🙂
Hi Karthik,
First of all, thank you for all these modules that you have been writing! Not only are they very informative, but the illustrative examples make it interesting and very easy to understand. Zerodha Varsity is easily one of the best sources for information on finance out there on the Internet.
I had a question regarding \’chit funds\’. How do I calculate XIRR or CAGR on something like that? Or is it solved using present value or future value?
I joined one in 2020 for an 8 lakh chit fund for 25 months. Now each month I am paying a different amount, but not really the whole amount of 32,000. Would it make sense to just look at the absolute returns at the end of 25 months ? I would essentially be getting less than 8 lakhs, but I would invested little less than what I would be getting.
In general, what your thoughts on this more informal savings scheme? There are many people who argue that it\’s much better to invest in an equity Mutual fund SIP instead of a chit fund. But, I don\’t usually see mutual funds performing so well in a horizon of just 2 years.
Looking to hear your thoughts.
Thanks, Jazeela. I\’ve never looked at chits, so I really don\’t know. But if I were to guess, you can probably apply XIRR to this and figure out the returns.
hi karthik
can we stop sip payments after one month? If yes, what is the procedure for doing so?
thanks in advance
Yes, you can. Coin allows you to edit the SIP attributes.
Hi
Thanks for the reply Karthik, just a small suggestion.it would be much appreciated if we get a notification of any kind for all your replies.once you are in the flow of going through these chapters, its really tough to track back our quire\’s.
Thanks a lot for such informative and captivating content.
Vishy, the only problem is that after each comment you will start getting notified, number of queries is quite a few and it will soon turn annoying for you 🙂
Hi,
What if I invest through SIP route on a particular fund for 5 years and stop the SIP without redemption and let my unit stay in the fund for next 5 years, in this scenario how should I calculate my returns?
You can do that, the same XIRR formula would be applicable.
Can you please explain the difference between IRR and XIRR?
They are very similar. XIRR is a variation of IRR wherein the returns are measured over a period where the investments are made in a staggered manner.
Sure sir, thank you for the idea.
Good luck, Yashwanth. Happy learning!
Hi sir, please help me with this doubt. I had started an index fund(ICICI Pru) keeping in mind to invest for > 25 years. Now unfortunately if ICICI goes down or something bad happens to ICICI in the midway(let\’s say after 10 years) ,will my fund be in danger or can I claim that by any means?
This is called institutional risk. Unless there is a fraud, nothing really can go wrong. However, one way to ensure you are safeguarded (especially when you have 25 yrs time frame) is to split investments between two fund houses (but you can invest in the same fund). For example, maybe index fund in ICICI Pru and index fund in UTI.
Great Stuff sir!! Really helps a lot. I would like to request you for a chapter on different kinds of Global/Overseas funds and FoFs if you could. And a chapter on how to maintain mutual fund portfolio , when to switch funds, how frequently to restructure the portfolio etc.
Thanks again for your efforts sir.
I just started work on the next chapter i.e MF portfolio. Hopefully, I\’ll complete this by end of this week.
How much yearly cagr return should I expect( I expect 10%).
What do you think?
That\’s a fair enough expectation.
I have 3 lakh in my fd. I am about to be 18(after 6 months). I want to invest it for a long time(40-50 years). Where should I invest it Index fund/Etf(Niftybees)/Reits? But I prefer an Index fund. Which Index fund is best?[ I prefer the Hdfc index fund Sensex plan]. Or I should invest somewhere else. I want to know your opinion. By the way, you are doing great for us. Thank you ❤
Hopefully, you\’ll give your best.😊
Congrats! That\’s a decent amount to have at 18 🙂
Any index fund is good enough, go for the one which has the lowest expense ratio.
\”I hope you now appreciate why we need to consider the CAGR and not absolute return if the investment is less than one year. \”
Should it not be more than one year?
Oh yes, it should. Excuse the typo, please 🙂
Sir
Please tell me my answer on (short box or conversion)
In weekly CURRENCY options
How I can applied show me with example
I try to do it but I have not sufficient money in present time and also no idea about this to how I can apply.
Please not say NO this STRATGEY is not applicable in weekly currency
Karthik,
I\’m looking forward to explanation of other ratios mentioned at the start of this chapter. How to corelate these ratios to select a fund among chosen category.
Initially I thought I\’m not able to locate the right page.
Mukesh
I\’m eager to put the next chapter as well. Hopefully soon 🙂
I already had some knowledge of M/f Industry.
If one can manage portfolio actively, then one should not opt for Mutual fund.
I want to ask about Overseas M/f. The first and foremost, is currency fluctuation absorbed by these fund? Means, are we investing in Dollars/Yen etc. and then these currency is invested in Shares or Mutual fund? Second one, is the tax treatment is same as equity fund?
I have a portfolio, but still I invest in MF. So it really depends on the overall strategy you are following. Overseas, there is still an element of FX risk. Funds wont take in this cost. As far as the tax is concerned, yes, its similar to EQ investing, but do check with the CA once.
Right, Karthik. I just want to get clarity on both.
Good luck, Rohan!
So could we use IRR instead of XIRR, but I read that in IRR we didn\’t require corresponding dates of each of the cash flow?
Please clear this doubt.
You need the corresponding dates. Btw, you anyway have to calculate this on Excel, you may as well do XIRR right?
First of all, Karthik you make complex topics very easy to understand.
I have 1 doubt that what is the difference b/w IRR (internal rate of return) and XIRR?
Where do we use IRR?
Both IRR and XIRR are similar, Rohan.
I want excel sheet for calculation of requirement of SIP for particular goal.
We dont have that yet.
Please make a chapter withthe details about Real Estate Improvement Trust and how to invest on it with tax implication
NOted. Will probably include a chapter.
hello Sir, great stuff!
will this method work for smallcases?
How about direct stocks buying – how to find if i my investment is on track.
It would be great if Zerodha provides us the tools to tie in investment & its growth tracked against goals (for goals capitalmind is helpful)
These are standard techniques, works across all assets. Thanks for the pointer, we are continuously working on improving the reporting aspect.
Hello Mr. Karthik,
Thanks for your effort to make every article so interesting and yet explained in a simple, easy to understand manner.
I have a query on mutual funds – the MFs buy equities and hence they must be receiving the dividends paid by the companies. What happens to such dividend received? Are thy added to the AUM? Do the fund house publish the information such as how much dividend received in a year and how it is utilized? If yes, where can I find such information?
Yes, it gets added back to the fund and reflects in the NAV proportionate to what you hold.
Hi Karthik,
I am following Varsity lessons from the last few months. I want to thank you and the team of Zerodha for the financial education that you guys are preaching in the country.
I have a doubt in this chapter –
In the case of SIPs for more than 1 year, can I choose to invest different amount than my SIP amount in some of the months. For that matter can I choose to not make some SIPs and continue investments after some months. If I follow this, will the XIRR technique help me in getting return ?
TIA
Yes, you still need XIRR. XIRR is applicable when you have staggered investment across time. The amount itself can vary, that is not a problem.
Sir, Contents of all the chapters are very good. Request you to upload PDF version of this module and last module (Innerworth – Mind over markets\”)
PDF will be ready after the module is completed. Inner worth PDF will not be created.
Hi Mr.Karthik,
Just had a question on the Macaulays durations of a Mutual fund. In this scenario alot of reports suggest dropping interest rates, I did a small analysis and checked all funds that have a suitable Macaulays duration which would benefit from the same. As on 25/07/2020 I found the Kotak Gilt MF to be having the highest MD and made up of mainly govt secs and also having YTM comparable to other debt MFs and with a decently low expense ratio. Just wanted to verify if I was able to find the most ideal fund to benefit from falling int rates.
Also do the MD account for the expense ration of the fund in them
for e.g. is MD is 7yrs and if int rates fall by a % the NAV of the fund would move up by 7% but does this 7% include or exclude the expenses of the MF?
Thanks.
Gilts are mainly GSEC and they all have high durations anyway. The increase happens at a fund level, of course, the expense would be deducted and the NAV will be declared.
Hi KARTHIK,
I want to know what are the criteria for choosing a proper mutual fund from Mutual Fund Universe for wealth creation in long term? For instance if I choose a mutual fund based on the current position and after sometime the ratings fall for that fund what should i do, remained invested or shift to another fund.
This is the larger topic that I\’d like to discuss going forward. Request you to kindly wait for the next few chapters for this 🙂
Hi Karthik…
I am 20 years in hand for my retirement. Until now i have not invested yet. I want to build my retirement corpus fund through the MF.
1. Can you tell me which MF type is best suitable for me.
2. How much is the min amount need to be invested.
Pramod, I will soon write articles to address this. As you can imagine, this is a massive topic 🙂
Fantastic! I really applaud your work as it has made me a more informed and insightful investor. I am wondering if we invest in a fund through monthly SIP over a long time horizon then would it be prudent to also factor in inflation as for the initial SIPs this would be a long term capital gain scenario but not for the latest SIPs. I am hoping that this will give the correct notion of the returns and what we are actually pocketing.Can XIRR be applied as well? if yes then how?
Hmm, you can\’t really offset XIRR with inflation, all baked into a single number. YOu will have to factor this is in separately for different purposes that you may need.
The Varsity App has only 7 modules. And Mutual Funds seems to be 11th module.
What are the remaining modules no. 8,9,10 are on and when will it be included in the Varsity App ?
We are doing this one by one. Please do bear with us.
Sir
I was eagerly waiting for Zerodha\’s next modules on Mutual Funds. Nice efforts and very good work sir.
I have one query. We often hear about multibagger stocks giving returns like 8800% (like what happened in Ruchi Soya stock) but we never hear about multibagger mutual funds. Why this is so?
Regards
Single stock is fancy, but MFs dont move that way. Its a portfolio of stocks.
Could you also include a section on how to build a portfolio?
Yes, this discussion is leading to that.
Hi Karthik Sir,
Thanks for the amazing content on varsity. Wanted to ask if XIRR calculation will be applicable on PPF yearly investment option or not.
Regards
Deepak Shikhare
Yes, XIRR is applicable to any investment which has a staggered investment across multiple years.
Hi Karthik, would you please guide me, that I am from CSE background with 2 yrs of IT experience and I want to make my career as Finance advisor.
So would you please guide me that which courses should I opt for to become a financial advisor as I am already studying NISM investment advisor level 1 and mutual funds foundation.
Is it possible for me to make-shift in career?
Appreciate your response on this.
Rohan, a Certified Financial Planner course and certification will help you in this regard. Do consider the same.
Karthik Sir, What a selfless person you are, as you can sell this content easily by making a book on it but you had not done that and selflessly providing all knowledge in such a simplified manner.
May, god bless you sir!
Thanks, Harshit. Kind words like this are more valuable than sale proceed of a book 🙂
Thank you so much Sir!😊😊 to provide us this level of knowledge for free…. Waiting for the next chapter🙃🙃
Thanks! Next chapter will be up in a few days.
Thanks for the swift reply. Waiting for the next chapters eagerly. 🙂
Hopefully by next weekend 🙂
HI Karthik,
I am planning to start SIP of 2-3k each in \”UTI Nifty Index Fund\” and \”Axis Small Cap Fund\”. My investment horizon is 10 years.
I did a little research and following are my observations:
1) Compared UTI Nifty fund and HDFC Nifty fund and both had an expense ration of 0.1%. Decided to go ahead with UTI Nifty fund as you have mentioned it a couple of times. No other reason as both the funds are almost same.
2) Compared Axis and SBI small cap funds. SBI fund has expense ratio of 0.89% as compared to Axis Small cap fund which has expense ratio of 0.3%. Both the funds look good and returns are also almost comparable but going with Axis as it has the expense ratio advantage.
Kindly let me know if my thought of going ahead with these 2 funds makes sense.
Trying to avoid large cap funds and going ahead with index fund as you explained very neatly in the index fund chapter.
Thanks,
Bibek
1) Yes, the key with Index fund is a low expense ratio and low tracking error. I guess UTI scores well
2) Sure. Do check the factsheet once to see their investment philosophy
Good luck!
Thank you sir for guidance.
There was a news about mutual fund plan in index by zerodha and published by CEO in recent news.
Can you please share more details about it?
Regards,
Yuvraj
That will take sometime 🙂
eagerly waiting for your next chapter!!
By next weekend, hopefully 🙂