3.1 – Getting you familiar with Jargons
Like I had mentioned in the previous chapter, there are two techniques based on which you can pair trade. The first technique that we will discuss starting now, is usually referred to as the correlation based technique. I consider this as a fairly standard approach as many traders get their pair trading handholding of sorts using this approach.

We need to learn few jargons before we get started on the actual technique, so let’s get to that straight. The jargons we will talk about in this chapter are related to tracking pairs. At this stage, I just want you to know what is what. We will connect the dots as we proceed.
Spreads – The spread, is perhaps the most versatile jargon used in the trading world. For example, if you are scalping the market then the word spread refers to the Rupee differential between the bid price and the ask price. Now, if you are doing an arbitrage trade, then the word spread refers to the difference between the prices of the same asset across two different markets. In the pair trading world (actually, just correlation-based technique), the word spread refers to the difference between the closing prices of two stocks.
The spread is calculated as –
Spread = Closing value of stock 1 – closing value of stock 2
Take a look at this –
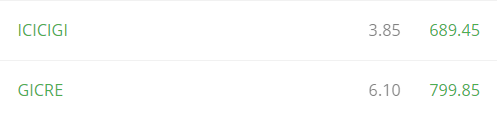
If I assume GICRE as a stock 1 and ICICIGI as stock 2, then the spread is calculated as –
Spread = 6.1 – 3.85
= 2.25
Please note, both 6.1 and 3.85 represents a change in stock price with respect to the previous close. Also, both the numbers are positive here. Now, for a moment assume, the closing price of ICICIGI was negative 3.85, in this case, the spread would turn out to be –
6.1-(-3.85)
= 9.95
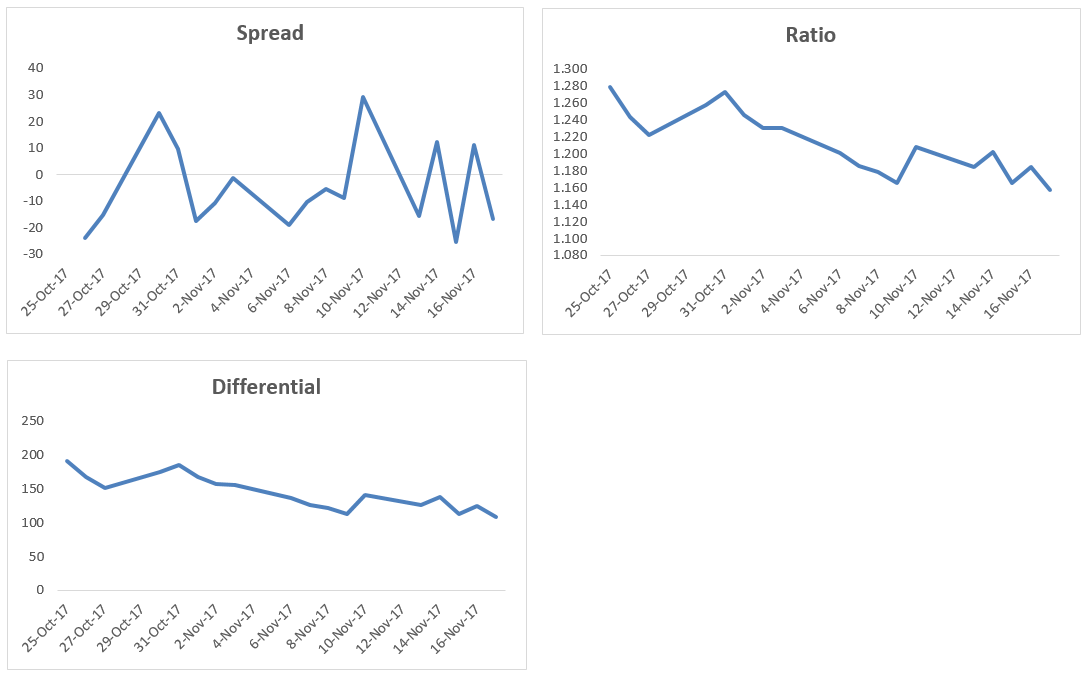
I’ve calculated the spread for the last couple of trading days, this should give you an idea of how the spread ‘runs’. Also, since I’ve calculated the spread on a daily basis, traders refer to this as the ‘historical spread’.
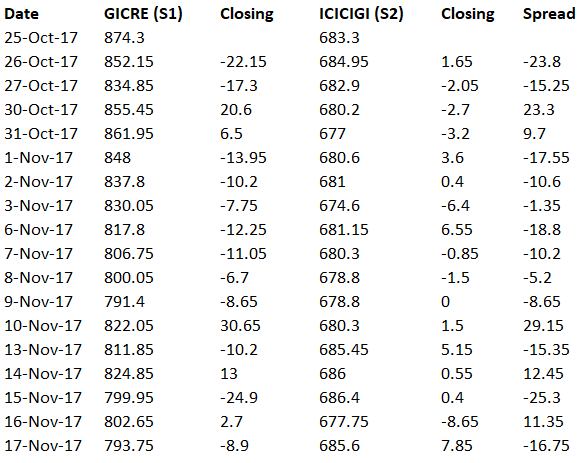
As you can see, the spread varies on a daily basis. Also, here is an interesting (general) observation –
- The spread expands if the closing value of S1 is positive and S2 is negative
- The spread contracts if the closing value of S1 is positive and S2 is also positive
Of course, there are other possible combinations which lead to the expansion of contraction of the spreads. More on this later.
Differential – Unlike spreads, the differential measures the difference in the stock prices. The differential measures the absolute difference in the closing stock prices of two stock. The formula is as below –
Differential = Closing Price of Stock 1 – Closing Price of Stock 2
So if a stock 1 has closed at Rs.175 and stock 2 has closed at 232, the differential is –
175 – 232
= – 57
As you may have guessed, you can run this as a time series and calculate this on a daily basis, I’ve done this for GICRE and ICICIGI –
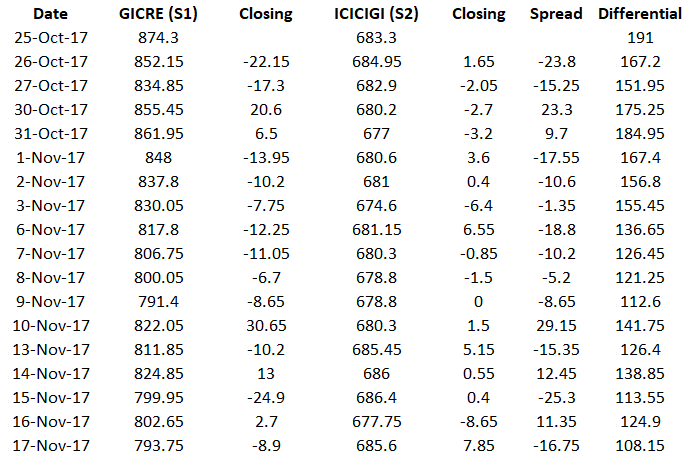
Here is something you need to know about differentials – if you are using spreads to track pairs, then you can use it on an intraday basis. But unlike spreads, the ‘differentials’ is not a great technique to track pairs on an intraday basis, its best used at an end of day basis.
Of course, more on these things later. For now, let’s just focus on busting some jargons.
Ratio – I find the ratio bit quite interesting. The ratio is essentially dividing the stock price of stock 1 over the price of stock 2. Or it can be the other way round as well.
Ratio = Stock Price of stock 1 / stock price of stock 2
I’ve calculated the ratio of the same two stocks, here is how it looks –
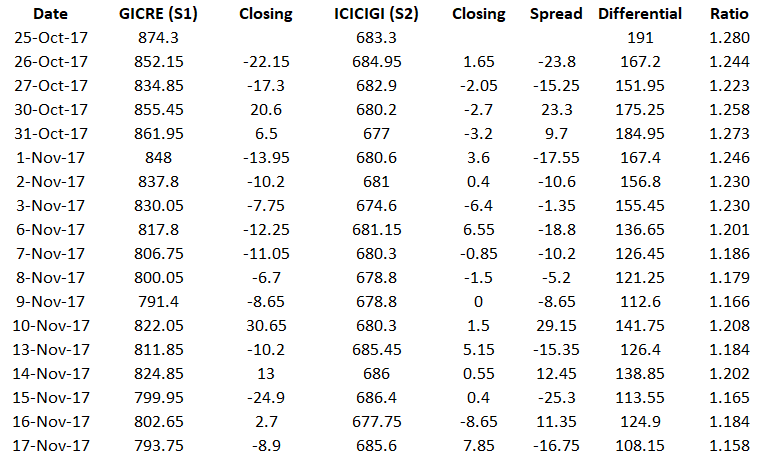
The Ratio as you can see is a bit more consistent (or at least appears) when calculated as a time series. I’ve represented all the three variables on graph –
So what are these things that we just looked at – spread, differential, and ratios and how are they related to pair trading?
Well, as you can imagine, these are the different variable which helps us measure or quantify the relationship between two stocks, which we consider as pairs. The graph tells us how the two stocks move with respect to each other. For instance, if we consider the spread, we know it expands if the closing value of S1 is positive and S2 is negative and the spread contracts if the closing value of S1 is positive and S2 is also positive.
Likewise in the ratio – the ratio between two stocks decrease if the stock prices of both the stock decline and the ratio increases if the stock prices of both the stocks increases. Of course, there are other variations possible – for example, the ratio can increase if stock 1 declines heavily and stock 2 stays flat or the other way round. Alternatively, stock 2 can increase a lot more compared to stock 1 or the other way round J
Confusing isn’t it?
Hence, for this reason, we need to look at the chart of the variable we are following, the variable could be spread, differential, or the ratio. We need to track the movement of the variable and figure out if the spread is expanding or contracting. This leads us to the next two jargons.
Divergence – If the ratio or the spread between the two stocks is expected to move apart or alternatively, you expect the graph to move up, then this translates to something called a divergence. When you expect your variable to diverge, you can make money (or at least attempt to make) by setting up a divergence trade.
Convergence – If the ratio or the spread between the two stocks is expected to move closer or alternatively, you expect the graph to move down, then this translates to something called as a convergence. When you expect your variable to converge, you can make money (or at least attempt to make) by setting up a convergence trade.
Now here is the big question – what makes you believe the variable can either converge or diverge? When do you decide to set up a trade? What are the triggers? How do you set up a trade? What if the trade does not work out? What is the stop-loss for such trades?
Well, even before we answer these questions, how do we qualify two stocks as a pair? Just because two stocks belong to the same sector, does that mean they qualify as a pair? For instance, does ICICI Bank and HDFC Bank qualify as a pair because they both belong to private sector banking?
To qualify two stocks as a pair we need to rely upon the good old statistical measure, called the ‘Correlation’. I guess, we have discussed correlation multiple times on varsity. Here is a quick explanation –
Correlation between two variables gives us a sense of how two variables move with respect to each other. Correlation is measured as a number which varies between -1 to +1. For example, if the correlation between two stocks is +0.75, then it tells us two things –
- The plus preceding the number tells us that they both are positively correlated i.e when they move in the same direction
- The actual number gives us a sense of the strength of this movement. In a loose sense, the closer it is to +1 (or -1) the higher is the tendency for the two variable to move in tandem.
- A correlation of 0 suggests that the two variables are not related to each other.
From the above, we know a correlation of +0.75 suggests that the two variables move not only in the same direction but also tend to move together closely. Note, the correlation does not suggest the extent of the move, all it suggests is that the move in the same direction is likely to happen. For example, if Stock A moves 3%, and the correlation between stock A and stock B is +0.75, then it does not mean that Stock B will also move by 3%, all that the correlation suggests is that Stock B will move up positively, just like Stock A.
But, there is another twist here – suppose stock A and Stock B are correlated at 0.75, and the daily average return on Stock A and Stock B is 0.9% a 1.2%, then it can be said that on any given day, if Stock A moves above its daily average return of 0.9%, then stock B is also likely to move higher than its daily average return of 1.2%.
Likewise, a correlation of -0.75 indicates that the two variables move in opposite direction (-ve sign) but they both tend to move in opposite direction. Suppose stock A moves up by +2.5%, then by virtue of correlation we know that Stock B is likely to come down, but by what degree will it come down will not be known.
While we are at it, one more point on correlation. This bit is only for those interested in the math part of correlation. The correlation data makes sense only if the data series is ‘stationary around the mean’. What does this mean? – Well, it simply means that the data set should be sticking close the average values.
Keep this line ‘stationary around the mean’ in the back of your mind, don’t forget it. This will come back to again, when we discuss the 2nd technique to pair trade, much later in this module.
We will proceed with correlation as a measure to understand how tightly two stocks are coupled. In the next chapter, we will figure out how to calculate two different varieties of correlations.
For now, I want you to be clear on Spread, Differentials, Ratios, Divergence Trading, Convergence Trading, and Correlations!
Download the Excel sheet used in this chapter here.
Key takeaways from this chapter
- Spread measures the difference between the closing values of two stocks
- Differentials measures the difference between the closing prices of two stock
- Ratio between the two stocks essentially requires you to divide stock 1 over stock 2
- Divergence is when you expect the two stocks to move apart
- Convergence is when you expect the two stocks closer to each other
- Correlation is like a glue which tells how tightly two stocks move together.
I am going through this book- Pairs Trading by Ganapathy Vidyamurthy.
As per approach he has outlined, idea boils down to find the distance measure between two stocks in questions. Distance measure is basically how aligned factor exposure profiles (vectors of factor exposure) of two stocks are with each other. Once we have factor exposure profile and factor covariance matrix then we can calculate correlation between two stocks.
Now the question is- How do I get factor exposure profiles and factor covariance matrix. I only have stock prices to start with. Is it through PCA? or is there any other (only if better) approach?
Also am I going in right direction? Or is there any other easy (and better) way to do this?
As far as I know, its via building a return matrix and PCA. Not sure if there are any better approaches to this.
Hi karthik,
This chapter is mostly about the pair trading, is there a module on arbitrage trading of same stock in different markets, if there isnt it would be more happy and knowledgable,if possible can prepare one?
I think the last chapter details calender spreads, which is another form of arbitrage.
Sir,
When are we getting videos for this & remaining modules?
We will put up for personal finance soon, Sharad. Not for other modules.
Just a small doubt, I feel ICICI is bullish and hence I trade and make profit, what difference it is gonna make If i split the amount and trade both HDFC and ICICI
The type of trade and its risk and reward profile are very different. Trading just ICICI is a directional trade, but trading both ICICI and HDFC (long and short) is a sector-neutral strategy.
Thank you!
Feeling bit confusing about correlation. Here\’s what I understood- \”Correlation is just a number which tells us the degree of moving one stock w.r.t another one and in which direction. We can\’t just calculate the extent of movement stocks will give using correlation\”
Is this correct?
Yes, it gives us a sense of co-movement of two stock.
Likewise in the ratio – the ratio between two stocks decrease if the stock prices of both the stock decline and the ratio increases if the stock prices of both the stocks increases. Of course, there are other variations possible – for example, the ratio can increase if stock 1 declines heavily and stock 2 stays flat or the other way round. Alternatively, stock 2 can increase a lot more compared to stock 1 or the other way round J
Unable to get it. If both prices moves up or down, ratio will be same (approximately). Also we are using S1/S2 so if S1 declines sharply and S2 stays flat then ratio will decrease. Please correct me if I am missing any angle here.
The idea is to set up the trade when the two stocks have diverged from the expected behavior and course correct. If they both are expected to move in same direction, then there is no trade 🙂
Sir, Profit/Loss has settled MTM based, its right?
Thats right.
Sir what is closing value
The price at which the stock closes for the day.
the ratio between two stocks decrease if the stock prices of both the stock decline and the ratio increases if the stock prices of both the stocks increases.
this statement appears to be wrong. The ratio has nothing to do with price of the stocks falling or increasing. As I understand, It is simply the ratio of current prices of the two stocks. for example, If both the prices of the stocks are halved or doubled, the ratio remains the same – nothing to do with increase or decrease of the price of stocks compared to the previous prices.
Ah, perhapse. Let me check this.
Wow! What a gold mine for Stat Arb, amazing job! The thing about Pair Trading not being market neutral, could they not be it in some scenarios?
Yes, that\’s possible when the lot size are not standardized.
Can you assist which stock has to be chosen as stock 1 and stock 2 respectively?
Isi it mandate to choose the buying stock as stock 1 and the selling stock as stock 2?
Please assist
Have explained this (in 2nd method), however, for the first one, it does not really matter.
Sir, thanks for the book that you suggested. Please suggest if zerodha provides adjusted close price historical data and if not then suggest some authorized vendors.
Not really. I\’d suggest you speak to an authorized data vendor for this.
Sir,
Two questions.
How to get tick data EOD and hourly for backtesting the pair trading strategy? Is it possible to get the data from kite?
Can you please suggest some books or other materials related to pair trading?
Zerodha varsity is really good for someone who is into trading. I am thankful to Zerodha team for providing such material to all.
For this, you will have to speak to an authorized data vendor. Here is a good book on pair trading – https://www.amazon.in/Pairs-Trading-Quantitative-Methods-Analysis-ebook/dp/B0030II24U
please, sir information Hindi me provide Kijiye.
Very soon.
hi,
i just wanted to know whether the historical stock price data available on nse website are adjusted for splits, bonuses etc…if not then where can i find adjusted data???
Hi..I read all the chapters.. excellent concept .and very well explained.. thanks for this
I have a query ..can we use the same density curve concept for single stock for swing trading..I mean if the stock goes far away from mean ..there wll be mean reversion..
Plz reply
Hmm, perhaps you can. I\’ve never really tested it though.
Hi Karthik
I forget mention it is in the Kite.
I am not able to plot line chart with the compare option for the same stock in the different exchanges which has price diffrence.For e.g. Raymonds stock which has the 634 in NSE and 631 in BSE.
Hi Karthik !
Hv Gone Thru Your Modules.
Very Well Presented And Understandable.
I Was Not Able To Find Instructions How To Put The Data Of Two Shares Together On Excel After Downloading From Nse Individually To Proess Them To Find Spread Differential Price Ratio Mean Etc. Also An Full Example Of How To Choose Pairs And When Ready To Trade.
Can You Please Put Up One Taking HDFC BANK / HDFC As Pair If They Are Suitable And Why ? Any Live Excel Possible To Track The Parameters Live For Intraday.
Are You Taking Correlation And Cointegration Possibilities Together ?
Appreciating The Way You Present The Course And Answer All Difficulties In Details.
Best Rgds,
A.Latif
Latif, you just have to copy-paste the data from two different excel sheets to one and start working on it. The rest of the procedure is explained in the chapter itself.
Hi Karthik
Iam not able to compare same stock at different exchanges.
For Eg Tatasteel in NSE and Tatasteel BSE.
If it is not possible, why.
I want to take Arbitrage opportunity in the intraday, pair of
stocks in the two exchanges.
Not able to compare as in? What is the issue you are facing?
Hi, data as on 03-04-19 for goldm silverm gave me 0.952 as density output. However, when i inserted today\’s close (assumed) and got a new density output, the data for 03-04-19 changed from 0.952 to 0.947.
Is that fine? I don\’t think so. Guess something is wrong
I now think there is nothing wrong. The mean had to be changed and so did SD and so the density curve too will change.
Sure 🙂
No, that is absolutely fine. Two possibilities – ether gold or silver or both made a decent move y\’day. Or the oldest data point (which gets replaced by y\’day\’s new data point) was a large value. Please do check for this.
Sir,
In the data you mentioned in the attached excel, the correll come at -0.21. Is it correct?
Kindly guide if i am wrong.
Regards
I guess it is correct, Deepak.
hii Karthik
sahil here as discussed the strategy of pair trading.so I wanted to ask how can someone pair trade nifty and sgx nifty as sometimes both they act differently and then again then start moving in the same direction so there is an arbitrage opportunity so wanted to ask how can one place orders in Singapore exchange ?
Unfortunately, you cannot Sahil as SGX is not available to trade in India.
Sir when module 10 will be available in pdf…. Eagerly waiting for it?
There are more chapters coming up, Ravi.
Sir, how can I obtain the data regarding open and close prices of various companies.
BTW , As always your teaching is Divine. ?
The divinity is in you taking the efforts to educate yourself and thereby overcoming ignorance 🙂
You can download the same from here – https://www.nseindia.com/products/content/equities/equities/eq_security.htm
Thank you ?
Thank you for the good read content
Happy learning 🙂
Hi Karthik
Based on the data given in excel, I\’ve calculated the Coorelation for HPCL and BPCL. Correlations arrived by correl() excel function are 0.82909, 0.198854 & 0.184658 for Close, % Return and Absolute Change respectively.
1) Why is there such significant difference in values themselves?
2) What can be inferred on the relationship between HPCL and BPCL based on figures above.
Kindly correct me if my calculation is wrong.
Thanks
Which % return are you measuring, Manish? Also, the correlation seems to be good @ 0.82.
Thanks for your response Karthik.
Im referring to correlation arrived from data points % return (% return for today = today close/yesterday close – 1) taken for all the dates given in the excel of HPCL and BPCL. Please refer sample data below
Date HPCL HPCL BPCL BPCL
Close %Return Close %Return
5 Dec 16 432.05 604.2
6 Dec 16 438.3 1.45% 612.95 1.45%
7 Dec 16 447.85 2.18% 632.15 3.13%
8 Dec 16 453.25 1.21% 638.05 0.93%
9 Dec 16 454.3 0.23% 634.65 -0.53%
12 Dec 16 433.55 -4.57% 611.85 -3.59%
I\’ve arrived at the correlation value on data points of %return on HPCL and BPCL prices as 0.198854.
I\’m confused on how can the correlation be so less.
Thanks
Got it. The correlation should be applied to % return, which I think is quite low. Correlation on price should not be considered.
Hi Karthik,
One query for the below statement :
\” if you are using spreads to track pairs, then you can use it on an intraday basis\”
How to use spreads on intraday basis and what are the setups for the intraday trade based on spreads ? Whats is the success ratio for such spreads setup ?
Thanks in advance.
I\’m not a big fan of spreads to track pair, I find the ratio a better deal. Anyway, the spread is just Stock 1 – Stock 2. Use the LTP to track this.
Hi Karthik,
Great work as usual.
I have a doubt – at what point does your portal charge the brokerage, stt, etc. Why i ask this is – i had 1.71 lacs on Feb 20,2017 in my account. Till today from that day, I have made a net profit of around 2.78 Lacs on that amount. This means my total account value (if charges are not deducted) should be 4.49 Lacs but it is only 4.22 Lacs now.
1) I assume the difference is due to the charges (brokerage, stt, etc). Please confirm if that is the case.
2) Are they deducted whenever we square off positions? Or?
Regards
PK
Brokerages and taxes are charged at the end of trading for all your trades for the day. You will also receive a contract note in your email with the details.
You can also these details in Q- Backoffice under Reports>> P&L
I cannot confirm what all deductions have been made in your account, you can confirm them yourself following the above method
Sir,
While doing the calculations taking two stocks..what is the basis of keeping a particular stock as Stock 1 and the other as stock 2 and not vice versa ?
Is there any criteria or rule which defines between the pair that this particular stocks will be placed as stock 1 and 2 ?
Very valid, will be addressing this point in Chapter 5.
Very nice,
Eagerly waiting more on pair trading.
New chapter next week.
Sir, Im having a real problem drawing the graphs, can you please tell me the whole procedure?
I have downloaded the sheet, the graph is already drawn but If Im trying to remake it I cant!
Which version of excel are you using? YOu need to select the data and click on the insert graph option and select line chart as the graph type.
Zerodha Varsity alone has given me more knowledge than all the other combined studies I have done related to trading. Thank you.
Happy to hear that, Issac 🙂
Happy learning.
Same opinion as that of Issac 🙂
Glad to hear that again, Ravi 🙂
Hi sir. Can you please tell me how to get started with NSIM certification? Thanks in advance.
Register for the certification and start reading! You can read the content here as well for additional knowledge 🙂
It says in the certification portal that first one is current derivatives. Is that right? Am I registering for the right exam? Also, I\’ve already read varsity multiple times sir. Printed out all the modules and gave it to few of my friends as well.. Thanks for the treasure..
Good luck, Sashidhar and thanks for letting your friends know about Varsity 🙂
Stay profitable!
how to download this
This module is work in progress. Download option will be available once the module is complete.
Sir I recently discovered something called option adjustment. Do you think you\’ll be writing about that or you think it\’s not necessary? If you can point me toward a book regarding the same. Thanks in advance.
Option adjustment? Can you share the context, please? Thanks.
If the positions we have taken, goes against our target, we take an additional position either to break even or top contradict our earlier view, since we were wrong in our prediction in first place.
No, we have to cut the loss. Will discuss this in detail as we proceed.
Sir I will take it at face value if you say taking an additional position to break even in case our positions go wrong is a bad idea. But can you shed some light into why it\’s bad thing? After all, breaking even is better than booking a loss right? Thank you.
What if you do not breakeven as expected? Under such a scenario, you will be making a further loss, only with a greater quantity.
\”By stationery around the mean, it simply means that the data set should be sticking close the average values\”
Sir, can you kindly elaborate a bit on this.
what does the \”average values\” mean here?
I suppose the average itself!
More on this in the coming few chapters, Umer 🙂
Okay sir 🙂
Cheers!
Will this correlation work better if we have the average daily return values of both the stocks within 1 standard deviation, because I thought that closer to mean must be that the data distribution say for n number of days the data points should be well within 1 Std deviation. So the pairs selected will they have to satisfy this condition individually for a better accuracy?
Sir what is the significance of the reference to Jordan Belfort and pairs trading in your tweet?
Hahah, nothing really. The illustration used in this chapter is Leonardo DiCaprio, so thought we;d say something relevant 🙂
Sir I\’m very excited to see this module live. When you say pairs tracking can be used on intraday basis what does it mean? And while we are on the subject, can you suggest one good book on intraday trading techniques? Thanks a ton.
It means tracking the variable\’s movement on an intraday basis. The variable can be a spread or a ratio, or anything else that we will learn in the future chapters 🙂
Sir what about the book recommendation?
Regarding?
I had asked for one book on Intraday trading techniques sir. Can you recommend one? Thanks in advance.
Have you checked out \’Trading for a living\’, by Alexander Elder?
Since zerodha is not allowing all stocks for intraday(eventhough they are eligible for intraday),Can we use cnc order type with full margin and square it off on the same day?Will it consider as intraday or stt charges are more???
Yes, you can use CNC order type and take long(buy) intraday positions and square it off the same day except for Trade to Trade segment stocks. However, you cannot take short positions due to liquidity risk(Read about auction penalties on short delivery here).
Brokerage, STT and other charges will be charged on intraday basis only
THANK you faisal sir.I hope zerodha will provide intraday mis order type facility to all stocks.I am loosing opportunities due to this issue.Feeling very sad to say that Iam changing from zerodha…:(
Please give me the list of all t2t stocks sir.I want full list.
Hello sir
As i got it:
Convergence= i) spread approaches zero (from both the sides ie -ve and +ve) ii) ratio tains to one. iii) graph of spread moves towards y(vertical axis)=0 from y= -ve ie upward and from y= +ve to y=0 ie downward.
Am i correct?
Thank you
Yes, Kumar. More on this in the next chapter 🙂
I\’m eagerly waiting as usual.
Thank you sir!
Thanks! Please stay tuned, Kumar.
Things are getting interesting. Thank you!!!
Any approximation on the number of chapters you are planning for this module?
69
I plan to introduce two different technique to pair trade. I\’m guessing each technique will have around 6-8 chapters.