12.1 – Trading the equation
At this stage, we have discussed pretty much all the background information we need to know about Pair trading. We now have to patch things together and understand how all these concepts make sense while taking up a pair trade.
Let’s start with the basic equation again. I understand we have gone through this equation earlier in this module, but I want you to relook at this equation from a trader’s perspective. I want you to think about ways in which you can trade this equation. I want you to see opportunities here. This is where everything starts to culminate.
y = M*x + c

What is this equation essentially trying to tell you? Well, frankly, it depends on how your perspective of this equation. You can look at it from two different perspectives –
- As a statistician
- As a trader
Since we are dealing with two stocks here, the statistician would look at this as an equation where the stock price of a dependent stock ‘y’ is being explained with respect to an independent stock price ‘x’. This process of ‘price explanation’ generates two other variables i.e the slope (or beta) ‘M’ and the intercept ‘c’.
So in an ideal world, the stock price of y should be exactly equal to the Beta times X plus the intercept.
But we know that this is not true, there is always a variation in this equation which leads to the difference between the actual stock price of Y and the predicted stock price of Y. This difference is also termed as the ‘residual’ or the error term.
In fact, we can extend the above equation to include the residuals and with that, the equation would look like this –
y = M*x + c + ε
Where, ε represents the error or the residual of the equation. Of course, by now we are even familiar with the stationarity of the residuals which adds more sanctity to the above equation.
Fair enough, now for the interesting bit – how would a trader look at this equation? Let me repost the equation again –
y = M*x + c + ε
Let us break this equation into smaller pieces –
y = M*x , this essentially means, the price of the dependent stock ‘y’ is equal to the independent stock price ‘x’, multiplied by the slope M. Well, the slope is essentially the beta and it tells us how many stocks of x would equal the price of y.
For example, here is the linear regression output of HDFC Bank (y) vs ICICI Bank (x) –
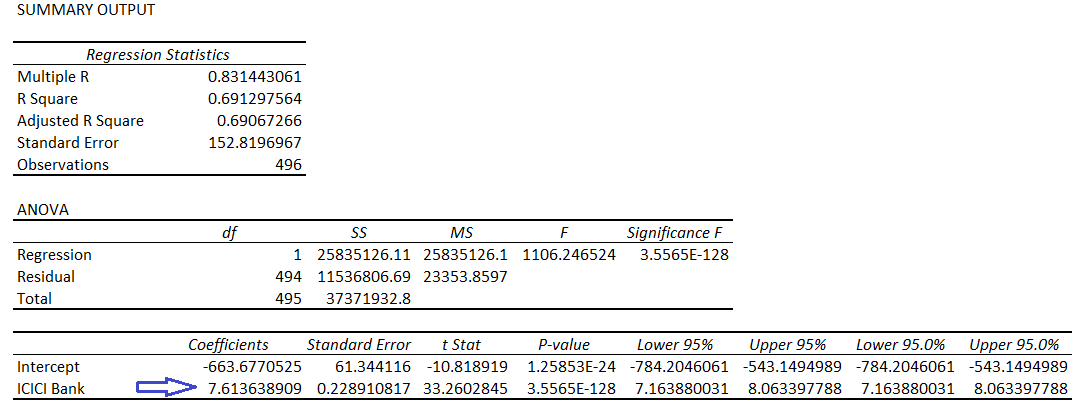
And here is the snapshot of the prices of ICICI and HDFC –
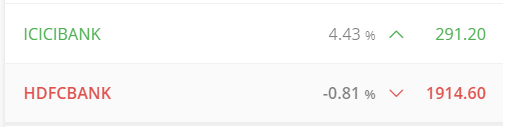
Now, this means, the price of HDFC Bank is roughly equal to the price of ICICI times the Beta. So, 1914 = 291 *7.61.
Don’t jump in to do the math, I know that does not add up ☺
But for a moment, assume if this equation were to be true, then, in other words, this essentially means 7.61 shares of ICICI equals 1 share of HDFC. This is an important conclusion.
This also means, if I were to go long on one share of HDFC and short on 7.61 shares of ICIC, then I’m essentially long and short at the same time, hence I’ve hedged away a large amount of directional risk. Don’t forget the basic premise here, we are considering these two stocks because they are co-integrated in the first place.
So here is the equation again –
y = M*x + c + ε
If this equation were to be true, then by going long and short on y and x, we are hedging away the directional risk associated with this pair.
This leaves us with the 2nd part of the equation i.e c + ε
As you know, C is the intercept. Now, at this point, I want you to recollect the ‘Error Ratio’ which we discussed in chapter 10.
Error Ratio = Standard Error of Intercept / Standard Error.
As you may recollect, we discussed the lower the error ratio, the better it is. Mathematically, this also implies that we are looking at pairs which have a low intercept.
Again this is a very crucial point for you to note, we are selecting the pairs, such that the standard error of the intercept is low.
Remember, in this equation y = M*x + c + ε we are trying to establish a trade (or hedge) every element. We are hedging y with Mx. We are trying to minimize c or the intercept because we are not trading or hedging it. Therefore, the lower it is, the better for us.
This leaves us with just the residual or the ε.
Remember, the residual is a time series. We have even validated the stationarity of this series. Now, because the residual is a stationary time series, the properties of normal distribution can be quite beautifully applied. This means, I only need to track the residuals and trigger a trade when it hits the upper or lower standard deviation!
Generally speaking, a trade is initiated when –
- Long on the pair (buy y, sell x) when the residuals hit -2 standard deviation (-2SD)
- Short on the pair (sell y, buy x) when the residuals hit +2 standard deviation (+2SD)
Like in the first method, the idea here is to initiate a trade at the 2nd standard deviation and hold the trade till the residual reverts to mean. The SL can be kept at 3SD for both the trades. More on this in the next chapter.
I know this is a short chapter, but I will conclude it here, as I don’t want to clutter your mind with other information.
It is important for you to understand this equation from a trader’s perspective and figure out what exactly you are trading. Remember, we are only trading the residuals here. We are hedging away the stock price of y with x. The intercept is kept low, and the residual is traded.
Why is the residual tradable? Because its stationary and therefore, its behavior is kind of predictable. In the next chapter, I’ll try and take up a live trade and deal with the practical aspects of pair trading.
Key takeaways from this chapter
- The pair trading equation is actually the main equation which we trade
- Every element of the equation is looked into
- We hedge the stock price of y with the stock price of x. The beta of x tells us the number stocks required to hedge 1 stock of y
- By looking into the error ratio, we are ensuring the intercept is kept low. Please remember we are not hedging the intercept, hence this needs to be kept low
- The residual is what we trade as it is stationary and follows the normal distribution quite well
- A long trade is initiated when residuals hit -2SD. Likewise, a short trade is initiated when the residuals hit +2SD
- Long on a pair requires us to go long on Y and short on X
- Short on a pair requires us to go short on Y and long on X
- When we initiate a pair trade, we expect the residual to hit the mean, so we hold until then
- The SL can be kept at 3SD for both long and short trades
Zerodha Varsity has truly been life-changing, and we have come a long way. This began in 2021 when I first encountered Pair Trading. I have written a research paper on pair trading in the Indian Stock Markets and have been actively using this strategy since 2022, consistently generating returns. Wanted to thank you for your Varsity series. It has been very helpful for all the modules that I have gone through. The most concise and clear way to understand anything related to finance. I tend to recommend this to everyone I come across. I wanted to take a moment to show you the website about pair trading that I\’ve created. Will try my best to educate people about pair trading further. Thanking you once again for everything.
https://www.pairtrader.in/
Doing my best now to improve this whenever possible.
Thanks so much for the kind words. I\’m glad you found the module interesting 🙂
Hello sir, tried this for HDFC and ICICI bank today with past 1 year data.. stuck at couple of places..
1.should we do the ADF test for the residual series obtained during the regression between two stocks or should it be done for the closing price data of two stocks.
2. pls correct me if im wrong. order of pair trading regression of similar stocks against one another and find which has lowest ratio to determine which is X and Y. then the ADF test has to be done for the residual series obtained during the regression and check if they are stationary. then when the residual series hits +2SD or -2SD, we can initiate the trade accordingly. this is the sequence of order.
3. also please comment on the rival option trading platform\’s pair trading feature. are they in line with your concept of pair trading
1) Its on the residual series
2) Yes. You can do X vs Y and then interchange as well to see which one is better
3) Sorry, not sure about this. Can you give more context?
can you please tell me how did you do the adf test
Please do check with the comments section, there are quite a few people who have responded with possible solutions.
Hi Karthik! I coded up the pairs trading idea covered in the Varsity module, and came across something weird: For the same pair of stocks and date range, cointegration test is insignificant (p=0.2) but the ADF test of residuals is significant (p<0.05). Is the stationarity of residuals a "necessary but not sufficient" type of condition? Should we then check only for cointegration directly?
Hi Sir, Extremely grateful to you for sharing these exhaustive details.
I read about this on Dec-22 and since then developed a complete Python script that looks almost the same as one of your snaps in the one chapter where X, Y, error ratio, Standard Intercept, ADF test everything is getting captured perfectly. I did take almost 3-4 on average trades since Dec and the trades were successful. Since Feb I am running into heavy losses, trying to refine the strategy, and hence came back on this page.
I have many queries and am not sure where to start, but it mainly revolves around the Target and stop-loss, and validity of a pair.
In one recent query, I found IDFCFIRSTBANK( as X) and FEDERAL BANK(as Y), ADF was below 0.05 and norm dist was around 0.000000123, it revolved around this value for 4-5 sessions(but surely it has at least 5-6 zeroes after the decimal, indicating that the value will reverse to its mean by more than 99.7% probability. Based on this I took a long option entry in FED bank 127.5 CE May Expiry, and since the time I bought it went against my view, and neither IDFC has shown down momentum. after 5-6 trading sessions now when I ran my script again, the above pair was filtered out because the ADF value was more than 0.05. what to do with this case?
I have many other cases where after a week or so, the pair gets filtered out because of ADF value and I took the entry when it was around -3SD or +3SD thinking that it has a 99.7% probability to turn back to mean but it just gets non-feasible pair within a week, how to handle such cases?
If you have read my complete text and help me to solve these so that I can refine it better. Thanks in advance
Hemang, these things do happen, and no model is foolproof. But why did you use this model to trade options? Options have many other dimensions to them that we have not discussed. The idea of trading futures is because of the simplicity of the trade.
1. Sir so by going long and short at the same time and hedging away the directional risk does it not eat the profits at the same time
2. A hypothesis… we are long on Stock A and short on Stock B … So instead of the entire mean reversion thing can the the stocks deviate even further than their mean… and we end up booking losses on both stock a and stock b
1) No, these are two different stocks. Directional risk is eliminated when you do something like this on the same stock
2) Yes, this is possible as well. Hence as a precaution we initiate the trade when it hits 2.5SD. But then its just a percaution, no guarantee 🙂
I am a Z-varsity student ,it is very helpful for me, Thanks you so much…
Happy learning 🙂
Hi, two things that I seek ur guidance upon….
1. how can we put a negative intercept ….be coz ideally in stock market prices should not go beyond 0….
2. Do u believe that relationship between stocks ought to be linear? Shouldn’t we use best fit regression
1) Try changing X & Y?
2) Not necessary.
Sir,
In the above icici n HDFC example , as to make it beta neutral we take the slope from regression report . Here HDFC IS 1914 , ICICI Is 291 and the slope in regression report is
7.613 .
Instead if we divide HDFC / ICICI OR 1914/291 it gives us slope as 6.57
So can we do this way as well to make it beta neutral ,if slope in regression report is on higher side .
Thanks Karthik.
Hi Karthik,
I have been doing some paper trading based on the pair trading algorithm mentioned here.
I notice that even when we do a beta hedging we are not cash neutral.
Can you please tell on what should take the priority beta hedging/cash neutrality or both ?
Is it even possible to satisfy both the conditions ?
Kindly reply.
Thanks
Beta neutrality is what you need for.
Yes sir . Thank you sir
Good luck!
Yes sir
sir, I have done a lot of pair trading some of given very nice profits a few trades are a loss . I observed when I am taken the position
example
on day1
ADF 0.03
z score 2.78 my position was no loss and no profit
after day 6
z score was changing 2.56 my position should be in profit? but I no profit or no loss
what is reason sir in z score value changing?
did I miss anything, sir? pls
Are you sure about this, Jaya?
I thought through this – Once you take the trade, you should freeze the regression equation until the trade is closed. If you do that your P&L will be linked to z score. If you continue to recalculate regression every day, then this is possible. Another possibility is, you have made approximation while taking positions, so this can happen –
E.g. if the regression suggests for every one lot of stock Y you should take 3.5 lots of stock X, you could only take either 3 or 4 lots in reality. This can also lead to a mismatch in p/l with a z score.
Sir, there are some linear regression functions mentioned under studies tab in kite charts. How are they used? Thanks
I guess these are regression indicators. I myself need to figure out how they work and behave 🙂
Delta hedging ???
What is the question about delta hedging?
how did you chose those pairs through error ratio?
My question is – conditions to check whether the residuals are stationary or not is through check the mean, standard deviation are within tight range or not and then we check on that there is no autocorelation. But why do we need to check all of it when we can get the probability of whether stationary or not through P score.
Also in the sheet where there are lot of probable pairs where there is information regarding P score, Standard error, sigma etc. can that be made using data from bhavcopy from NSE website.It would be really great if you could tell how relevant is Bhavcopy in this aspect.
Thank you
If you are referring to P-value of the AFD test, then yes you can directly look at P-value.
Yes, you can, provided you are using clean data adjusted for corporate actions.
Hi Karthik, my doubt is i have seen intercept in negetive … in case X-Y pair if intercept comes -15 and for Y-X pair intercept comes 10 in this case which one should we prefer… -15 bcz it\’s low as value in negative or we need to remove negative and then compare their low intercept pair ?
Please consider the absolute value of the intercept.
Hello Sir, this is in reference to your below statement from the Chapter – As you may recollect, we discussed the lower the error ratio, the better it is. Mathematically, this also implies that we are looking at pairs which have a low intercept. How can we conclude that low standard error of the intercept implies low intercept ? The intercept by itself can be large but have a ow standard deviation/ standard error right?
Can\’t deny this, you are right. However, I\’ve not observed this on pairs data. Suggest you explore this on various pairs and share your observation. Thanks.
What if the coefficient is negative?
Like you said when the coefficient of X=7(say) so if we buy 1 share of Stock Y we need to sell & shares of stock X to remove directional risk.
What will we infer if it is negative -2(say) … Should we think of if we buy 1 share of stock Y then we buy 2 shares of stock B to remove directional risk?
Please help!!!
Have you come across a situation where the coefficient turned out -ve?
hii sir I was as we are taking absolute values of the stock prices and then running regression due u think first normalizing x and y time series wich taking pct change and then running regression would be better and if yes pls tell why. and do u think running a linear regression on normalized time series can also give lower constant
Hmm, I\’m not sure about that Sahil. I\’ve never tried that. But intuition says it may not be the right approach 🙂
Thanks for reply. I have been trading inraday based on candles and volume for one month. It did work but overall made very small profit as RRR is 1:0.5/0.75 as mentioned by you in technical analysis module but in long term profit would not be made consistently. So I want to take suggestion from yourself which strategy should I trade for risk aversion in long term profit say 3-4% profit per month. Pl pl suggest me. I would be very thankful if the reply would be got properly.
Rohit, choose any strategy wherein you have the potential to make Rs.1.5/- for every Rupee of risk you take. I cannot really pinpoint anyone 1 strategy because of the risk temperament. Yours could be very different from mine.
1. I have read all modules very carefully and I am much confused which strategy I should trade. Since I have been trading for the last 12 years but none of the strategies are successful. I have read module-10 2-3 times and I got understood but I have not got one parameter i.e. ADF test.
2. You told earlier that you would put up list of stocks of ADF on daily basis but till date I have not found any list.
3. Kumar Mayank posted in this chapter on dated 11th May 2018 about EViews for run ADF test. I have downloaded EViews student light version and according to Kumar Mayank dated on 16th May 2018 for how to use them. I have tried but failed to do so.
So if you are writing the different modules and helping the persons to trade by themselves but how can they do when they don\’t have provision of ADF test then what is the benefit of writing done by you. Please I am sorry if I have written some nonsense matters. Waiting of reply would be appreciated
1) Well, then maybe you should try and explore more on this topic. I\’d suggest you look for more material on this topic on the internet
2) Yes, that didn\’t sound like a viable option however. Hence I did not pursue it. I did mention this across in an earlier comment
3) I think someone posted an excel plugin to do the ADF test, Rohit. You should check that.
hi sir, my name is Sahil I am building a trading model but I am able to execute all the things in my code by i am confused how to calculate position so lets say I wanted to take trade in hdfc based on Bollinger band and soon as zscore hits upper or lower band i take positions size is based on the money I am ready to lose and divided by my stop loss and my stop loss is 1 standard deviation lets std is 20 and money I am ready to lose is 2000 so my positions size will be 2000/20 = 100 shares of hdfc
so I want to have similar position sizing in pair trading so what I am doing is say for instance I select independent stock as = HDFC and dependent stock as = AXISBANK and I calculated the spread and then take the 1 std of spread then I divide that with risk per trade then I get some number lets say the number to be 100 .so for independent stock I multiply 100 by beta and for dependent stock I take 100 shares position right not I am staiong sich stock to short and wich to go long that depend on the zscore of the spread. I wanted to be able to limit my loss to risk per that I decide in my algo .so will I be able to do that with the calculation which I just stated.
Sounds a little complex, Sahil. When you pair trade, the position size comes pre-defined, in the sense that the lot size for dependent and independent is fixed. If you realize, the beta is already factored in when you do this. So your position size is essentially a multiple of the lot size.
hii sir really blew my mind the way u explained these quantitative strategies.in such a practical manner which is hard to find elsewhere. and u greatly explained how a trader can use linear regression or say cointegration. I understand if residuals are mean reverting we trade residuals. but can u advice where can one find more content they way u have explained this .i want to learn more about mean reversion strategies and different ways to analyze.
I\’m glad you liked the content, Sahil. I don\’t know about other places, I looked for it as well, could not find one. If you do, please do share with the community here. Thanks.
is there a PDF of this like other modules ?
Soon, Ashwin.
Dear Karthik,
Z score =(y-(x*beta)-intercept)/sigma,
Z will keep varying on daily basis, so do I need to carry out regression daily with latest 200 days data and wait for Z to touch +1 or -1? or once 200 days regression is done then I shall fix \’beta, intercept & sigma\’ and only input latest x & y values to check Z-score?
Yes, Arun..its better you run the regression analysis daily. In case of a drastic price movement, which is quite possible, the data may change.
I have some questions on pair trading:
1. For ADF test only one column of residuals is required. Please confirm.( Do I need to take differences of consecutive residuals?)
2. You have taken value of coefficient for x variable as the beta. This is taken as the slope(m) in y=mx+c. This is also taken as the hedge ratio.
I have got a value of 0.38 as the coefficient for x variable, which does not seem to be correct. The pair in question was YBharatforge-xMothersonsumi.
3. In the Position tracker, you are calculating Z score =(y-(x*beta)-intercept)/sigma. Under signal, you are calculating , z score =residual/standard error from summary output.
For every updation of prices, I have to run the linear regression. Please confirm.
4. The way I am doing it is to prepare the date and do linear regression on the pairs. Then I use an add in to do ADF test.
5. For price updation, everyday, I run linear regression with the added price data and find the z score as residual/standard error as before. Is this correct. I find that sometimes there is a change of 1.0(or-1.0) in the value of z score in a single day. Could there be something wrong.
Best regards
P V Rajkumar
1) Yes, the ADF test is to check for stationarity of the residual series, hence the input is only the residuals
2) The Beta, in this case, is used in a completely different context, best not to consider the hedge ratio here. What makes you think 0.38 is not correct for the given pair? The numbers always reveal the right picture.
3) The idea here is to isolate the residual (y-(x*beta)y-intercept) and then calculate the Z-score by dividing the residual by sigma, hence – Z score =(y-(x*beta)-intercept)/sigma. So both are the same. Btw, no need to run the regression daily once the trade is initiated
4) Yup, seems correct to me
5) This could happen for 2 reasons – 1) There is a drastic change in recent price 2) The oldest data point going out could be an outlier, hence the change.
sir i have calculate correlation between HDFCBANK and ICICIBANK with past 3 years data its been to far from each others like close correlation is around .80 Daily percentage correlation is about 0.23 and Abs closing correlation is near 0.30. Is it happen or if is it than can we use this type of stocks for pair trading??? Or correlation have to be close with each other like in your example between AXISBANK and ICICIBANK..?
i am little confused between this situation and solve my problem with this
Thanx in advance
Ricky, I would suggest you learn the 2nd method to pair trade. We have discussed this from chapters starting from 8 to 13.
Thank You Sir 🙂
This is amazing content. No where on the internet would you find such amazing content on Pair Trading. Kudos to the entire team!
Thanks, Madhavi. Hope you are enjoying the content here.
@kumar Mayakji
thanks, i will catchup after reading old chapters of the module..
@kartikji
is zerodha planning to add cointegration value calculator like other calculators!! we have to just choose the two stock and select the time period (like 1yr, 6months etc) and aaila magic….the cointegration displays!!!!
Akash, I\’m trying to put up the data of the pair on a daily basis. The idea is to make it available as a download. Will keep you guys posted.
Sir is it right time to initiate a pair trade in kotak bank and yes bank now, according to the theory??
Asking just for learning purpose.
I dont think so, Aagam 🙂
Sir,
You are doing a great job by teaching all of us and fantastic, Nowadays, you are teaching on subjects where PhD can be done and topics are so complicated where average people like me lost interest on following such topics. I remember very well that I will be checking for new contents very frequently and learn from your teaching but as of now I am not visiting the varsity due to advanced topics. Hence, I request you sir to take very common subjects and take us along with your teaching journey
Sivasankar
Sivan, I agree these are slightly complex topics, but it is totally worth learning them. Is there any particular topic you\’d like to learn about which is missing in Varsity? Please do let me know and I\’ll be happy to build some material around it. Thanks.
1) Mutual funds
2) Not getting trapped in market and loosing money
3) Why common people losses money in trades with live example
Sorry, Sivan I don\’t seem to get your query.
Also,
1) Common man mistakes in Trading
Hi Karthik ji, first of all would like to thank you for the wonderful insights as how professional trading is done. Was just curious to know, if you take an example of Kotak Bank and RBL bank from the pair data list when we calculate the regression for last 1 year (Kotak as Y and RBL as X) , i am not able to calculate mean of residuals as its throwing error (out put is something like -2.28E00..) Standard deviation is 71 also not able to apply normal distribution for this. Not sure where i am going wrong 🙁 could you please guide? it would be very helpful.
Thanks again.
Thirumal, if you have regressed right then maybe the mean is really low. Also, can you please explain what you mean by unable to apply normal distribution?
Hello sir thanks for the response.. normal distribution I meant skewness or the density curve (in excel =norm.dist(residual,mean,stdev, true). Also, sir infested to know post sharing the pair data did we have any trading opportunities Based on this method? If so in which pair and when.
I know my questions could irritate you, apologies for that. But trying to understand the concept.
Many Thanks
Thirumal, yes, there has been an opportunity in one of the pairs. We are tracking it live and discuss this trade at length in the next chapter. This will give you a hands-on approach to pair trading.
Super Cool! Thanks a ton. By when can we expect the next chapter sir 🙂
Very soon, hopefully this week 🙂
I could not find download pdf option in module-10, it would have helped. Thank you.
This module is work in progress. Will upload the PDF once the module is completed.
All modules are very good organize for the one who does not have any knowledge about stock market will receive by reading all above modules.
all i wanna know is there are more chapter comes in this module or it is done. also i request you to add one more module on Quant trading if you can.
all though i like the way you guys explain things with example so i think you can explain easily Quant topic as you have done.
again you have done very good work here..
Thanx
Ricky, thanks for the kind words. This module is still work in progress. Will add few more chapters here.
sir do you know how to run ADF test in EVIEWS
No, Ricky. I\’ve not used Eviews.
i have run ADF test on residuals which i had revives after regression for tatamotordvr(Y) and ashokleylends(X) P value is 0.1506. i have also download your ADF p value data sheet i have cross cheak my value with your data. but it\’s not even close i have 200 days of data imported in my excel file….
also want to know that how to calculate beta between two stocks..
Thnx ®ards
Beta is the slope between two stocks, have explained the same here – https://zerodha.com/varsity/chapter/hedging-futures/
thank you so much for your reaply sir,
and do i calculate ADFtest the right way sir…??
Yes Ricky, you will have to use one of the methods discussed in the comments section, Ricky. I\’m trying to have another way made available on Varsity soon.
@kumar mayank
Yes..i still confused about heavy terminology of stats.
U mean i have to run ADF test on bn/n ratio column(series)?
Thanks for taking pain of my questions☺️
@Kumar Mayank
i did this in Eviews..
http://prntscr.com/jj3h30 for banknifty/nifty ratio series and
http://prntscr.com/jj3kpi for dvr/motor ratio series
i did not include todays (17-may-18) data…the p-value is more than 0.05 at present
in amibroker for same period co-integration is
http://prntscr.com/jj3m8g banknifty&nifty data from 23-5-17 to 16-5-17
http://prntscr.com/jj3ndj dvr/motor from same data set.
there is a diff. now question is which one is reliable? value from python server or from Eviews?
and if we check cointegration directly from Eviews..there is totally diff values..
http://prntscr.com/jj3pag
http://prntscr.com/jj3oqs
for eview which is correct?
thanks bro.
Sorry i didn\’t see the screenshot. I have no idea what Amibroker is showing in terms of cointegration. It is expressing cointegration as a number which i guess should not be probability. It will be better if you ask this to Karthik sir. One thing i want to add is that i have run ADF test on ratio and they are not stationary.
Thanks
We run ADF to check the stationarity of time series data and it(data) could be ratio or residual. You need to load data into an excel sheet and then import this sheet to EViews. Now run ADF test and you have the results.
Hope i have answered you, Akash.
Thanks
@mayank kumar
I had download Eviews 10 student lite and registered it for 1 year.
How to check cointegration for banknifty and nifty…can u please tell in few step?
I am a good learner i will catch-up quickly..just need some initial help.
Thanks.
Hello Akash
Step1: Import your excel file into EViews
Step2 : Go to file and select Unit root test option from drop menu.
Step3: Select ADF test and run it.
That\’s all.
Thanks.
Thanks
Will try and get back to you.
ADF select only one series..though i typed in two series name.
i select banknifty and nifty series from imported file.
but test displayed only banknifty results.
how can i select two series…
thanks.
Hey Akash
I guess you didn\’t get what Karthik sir had written. We have to check the stationarity of residual time series data. The residual you obtain after regression analysis is to import to EViews. And if the probability of the data being a stationary time series is high then only it is of our use.
Thanks
Dear Akash, Please guide me through the process of downloading Eviews package and do tell me how much does it cost. thanks
@kumar mayank and Kartikji
P-value/probability/cointegration
All are same things? You use Eviews to check probability* value right?
The same thing i check in amibroker with help of python server.
I just want to check whether all r same thing with different name or not…
If same thing then its ok, otherwise i have to make some improvement with my existing system, thanks in advance.
Ya and also want to know that Eviews is free? If not how much is fees.
I\’m not too familiar with either amibroker or Eviews. But yes, they are all essentially same.
Hello Akash
Two securities are co-integrated when the residuals which we get after regression analysis are stationary. The stationarity of the residuals is checked by many tests one of them is Augmented Dicky-Fuller test. The o/p of ADF test is in terms of probability. The threshold value (p-value) is 0.05 or 5%. The lower the probability value the more securities will be co-integrated.
Here is the link for EViews software: http://www.eviews.com/home.html
Thanks.
Hey Mayank, thanks for sharing the link. I\’ll take a look at it as well 🙂
Welcome, sir!
I conducted ADF test on residuals of regression analysis b/w 2 stocks for case 1) stock 1 as \’X\’ and S2 as \’Y\’ case2) S1 as \’Y\’ and S2 as \’X\’. Residual of case one was non-stationary (p=0.1386) while that of case 2 was stationary (p=0.0088).
Here is the link for snapshot of the result:
http://prntscr.com/jevuqj
http://prntscr.com/jevv2u
We need your comments, sir. If this analysis is valid then we should first test for stationarity of the series before comparing error ratio, shouldn\’t we?
Thanks
Varsity student
You need to select the pair based on the error ratio, Kumar. Do this first and then run the stationarity test.
Thank you!
@Kumar Mayank
which software that was? for counting probability (p-value).
i use amibroker with python to check cointegration…
can u test mail me, i want to know something more about coint…my mail is anmpatel at gmail dot com.
thanks.
Hello Akash
I use EViews to check the stationarity of a time series. Sorry, but i didn\’t get you, Akash.Can you let me know what you\’re asking for?
hii
Mr. Kumar
i am new at treading and have sum basic knowledge of ADF test. so can u help me out how to run ADF test in EVIEWS application please help me out of this..
Thanks in advance
It is easy to run ADF test in R package, through \”urca\” library. Watch this vedio
https://m.youtube.com/watch?v=mkHtP0nONJY.
I took the values of residual of HDFCBANK-HDFC and in next column z-score or what you say density curve. These two stocks are highly co-integrated with p value(SIC) .0146 and 0.0054 (AIC). For shorting when Z-score>=0.975 and for long z score =<0.025.
It showed total of 4 trading opportunities during last one year and all were successful. One thing i noticed the profit gets maximised when z-score approaches 0.5 from both the sides. One more thing i noticed if one stock made gains other ended in loss.
The average net profit was 80 points. Still i haven't figure out about the stop loss. We are eagerly waiting for the next chapter.
Thanks
Varsity student
Yes, this is always true – your profits will roll only from one of the contracts, not both. However, I\’ve seen instances where both the contracts make money.
True..i checked for IBULHSGFIN-HDFC. Both the contracts made money 🙂
I like this trading. We are grateful to you.
Thanks
Varsity student
Good luck, stay profitable 🙂
Brother can you please share the excel file with the above mentioned data integrated on it .
Will do that shortly, Tarun. Thanks.
Before reading varsity zerodha I was confuse about share market.But after reading this 10 chapters , I got lot of knowledge about stock market.I am very thankful to Nithin Kamat sir,who written varsity in so easy language.
Nithin will be happy to note this, Mahendra 🙂
Keep learning.
When i started reading the contents of Varsity in 2k16 i thought it was Nithin writing all these. But in few days i got to know it was you Karthik Rangappa 🙂 I guess many people get confused initially.
Thanks
It does not really matter, Mayank. Everything we do is as company, as a team. So credit belongs to all 🙂
You are too humble, sir. I am impressed.
Thanks
Keep learning, Mayank!
Good luck.
Hello sir
It was quite a short chapter but very crucial i guess. Well i have a question. We can trade residual because it being a stationary time series but can we treat this data as normal distribution? I have plotted the graph of residual and it was forming skewed ND.
Thanks
Varsity student
Yes, this is a crucial chapter, hence kept it short and to the point.
As long as its stationary and has a p-value of less than 0.1 don\’t bother about plotting the graphs. Just consider it stationary and look for trades.