
10.1 – Who is X and who is Y?
I hope the previous chapter gave you a basic understanding of linear regression and how one can conduct the linear regression operation on two sets of data, on MS Excel. Remember, we are talking about two variables here – X and Y.
X is defined as the independent variable and Y is the dependent variable. If you’ve spent time thinking about this, then I’m certain you’d have guessed X and Y will eventually be two different stocks.
In fact, let us just go ahead and run a linear regression on two stocks – maybe HDFC Bank and ICICI Bank and see what results we get.
I’m setting ICICI Bank as X and HDFC Bank as Y. A quick note on data before we proceed –
- Make sure your data is clean – adjusted for splits, bonuses, and any other corporate actions
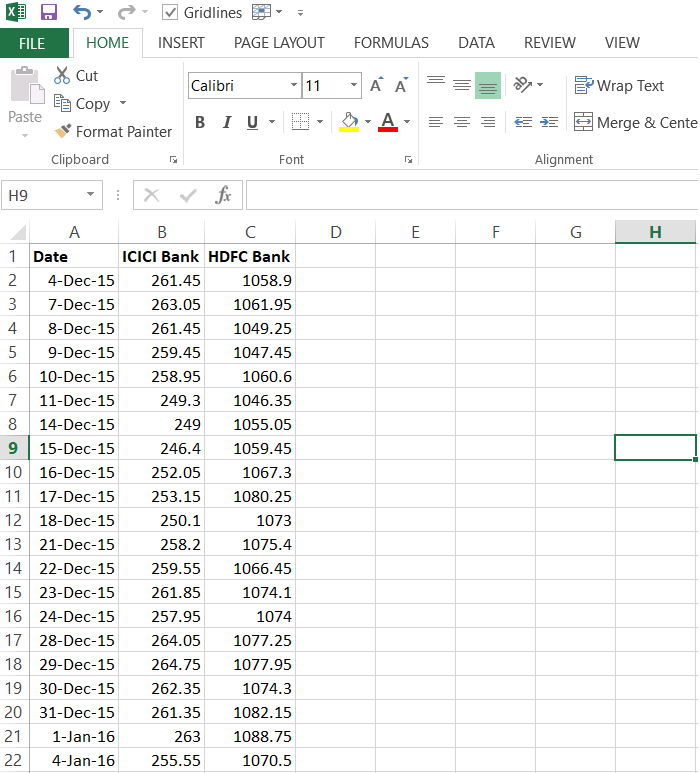
- Make sure the data matches the exact dates – for instance, the data I have for both the stocks here runs from 4th of Dec 2015 to 4th Dec 2017.
Here is how the data looks –
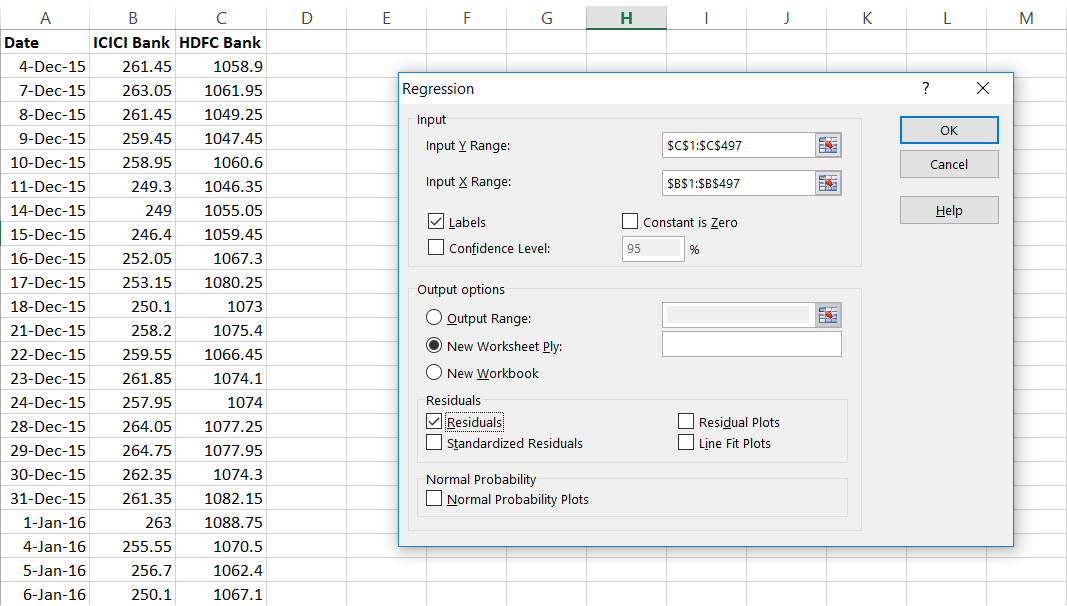
I’ll run the linear regression on these two stocks (I’ve explained how to do this in the previous chapter), also do note, I’m running this on the stock prices and not really on stock returns –
The result of the linear regression is as follows –
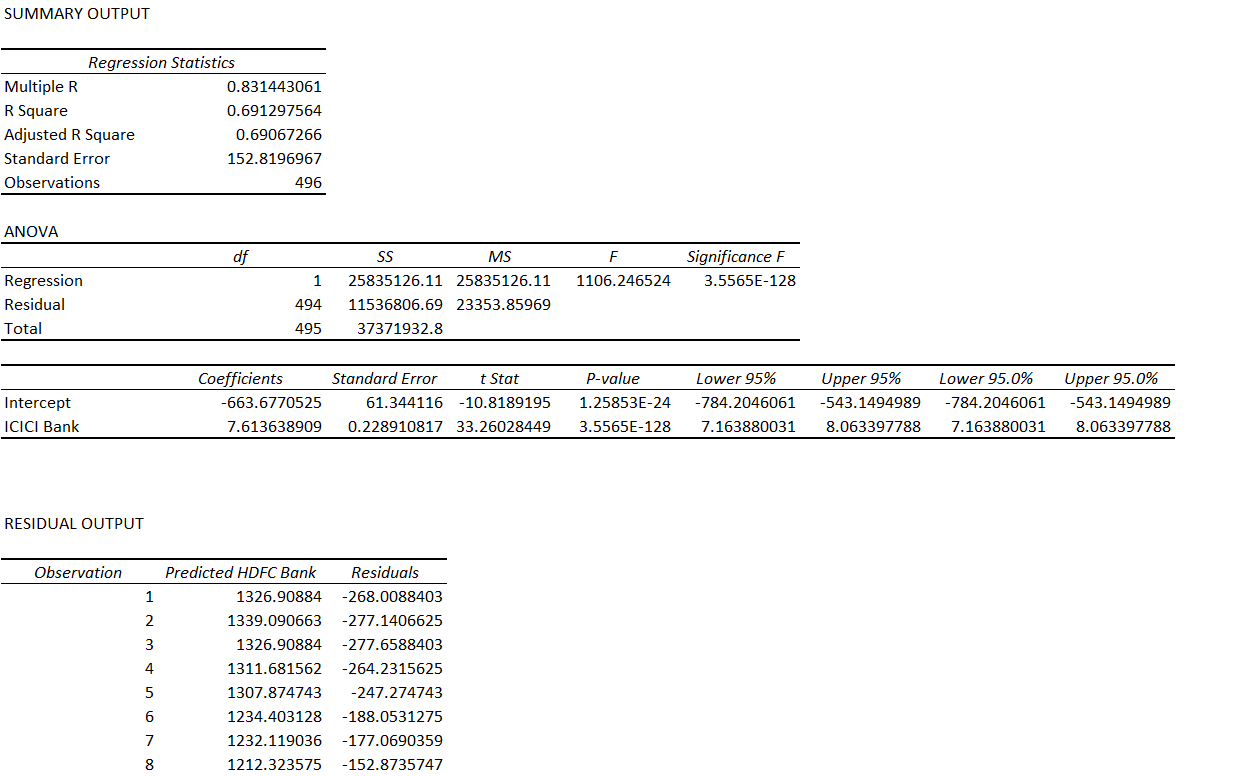
Since ICICI is independent and HDFC is dependent, the equation is –
HDFC = Price of ICICI * 7.613 – 663.677
I’m assuming, you are familiar with the above equation. For those who are not familiar, I’d suggest you to read the previous two chapters. However here is the quick summary – the equation is trying to predict the price of HDFC using the price of ICICI.
Or in other words, we are trying to ‘express’ the price of HDFC in terms of ICICI.
Now, let us reverse this – I will set ICICI as dependent and HDFC as the independent.
Here is how the results look –
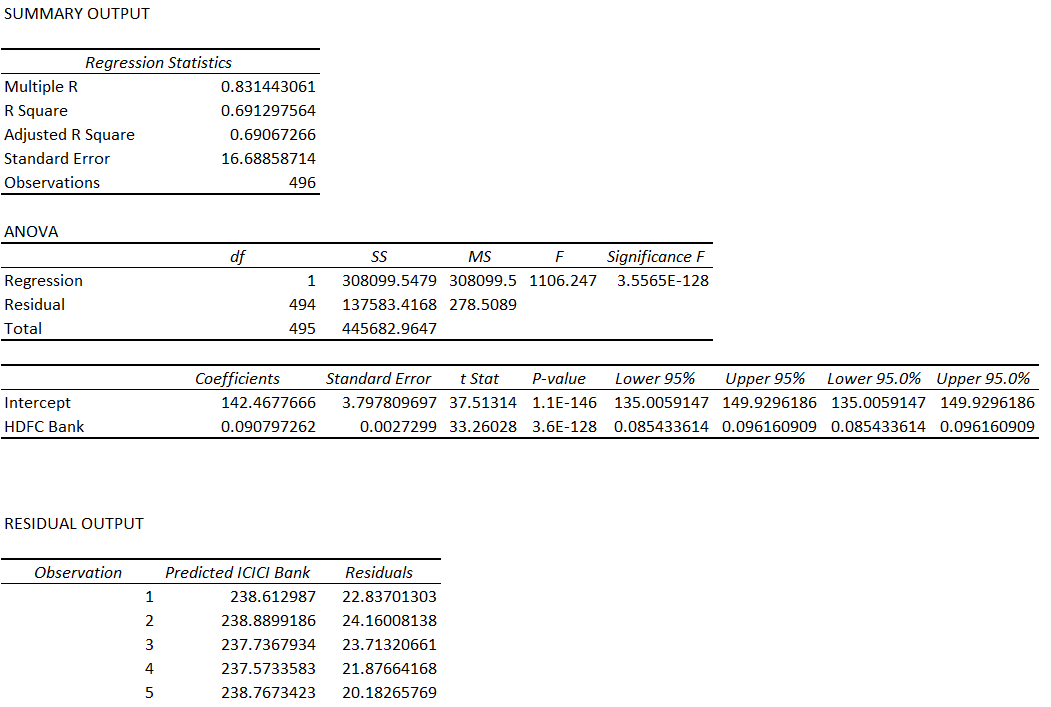
The equation is –
ICICI = HDFC * 0.09 + 142.4677
So for the given two stocks, you can regress two ways by reordering which stock is dependent and which one is the independent variable.
However, the question is – how do you decide which one should be marked dependent and which one as independent. Or in other words, which order makes the most sense.
The answer to this depends on three things –
-
- Standard Error
- Standard Error of intercept
- The ratio of the above two variables.
Remember, the linear equation above, essentially express the variation of price of ICICI in terms of HDFC (refer to the equation above). This expression or explanation of the price variation of one stock by keeping the price of the other stock as a reference can never be 100%. If it was 100%, then there is no play here at all.
Having said so, the equation should be strong enough to explain the variation in price of the dependent variable as much as possible, keeping the independent variable in perspective. The stronger this is, the better it is.
This leads us to the next obvious question – how do we figure out how strong the linear regression equation is? This is where the ratio –
Standard Error of Intercept / Standard Error comes into play. To understand this ratio, we need to understand both the numerator and the denominator before talking about the ratio itself.
10.2 – Back to residuals
Here is the linear regression equation of ICICI as independent and HDFC as the dependent –
HDFC = Price of ICICI * 7.613 – 663.677
This essentially means, if I know the price of ICICI, I should be able to predict the price of HDFC. However, in reality, there is a difference between the predicted price of HDFC and the actual price. This difference is called the ‘Residuals’.
Here is the snapshot of the residuals when we try and explain the price of HDFC keeping ICICI as the independent variable –
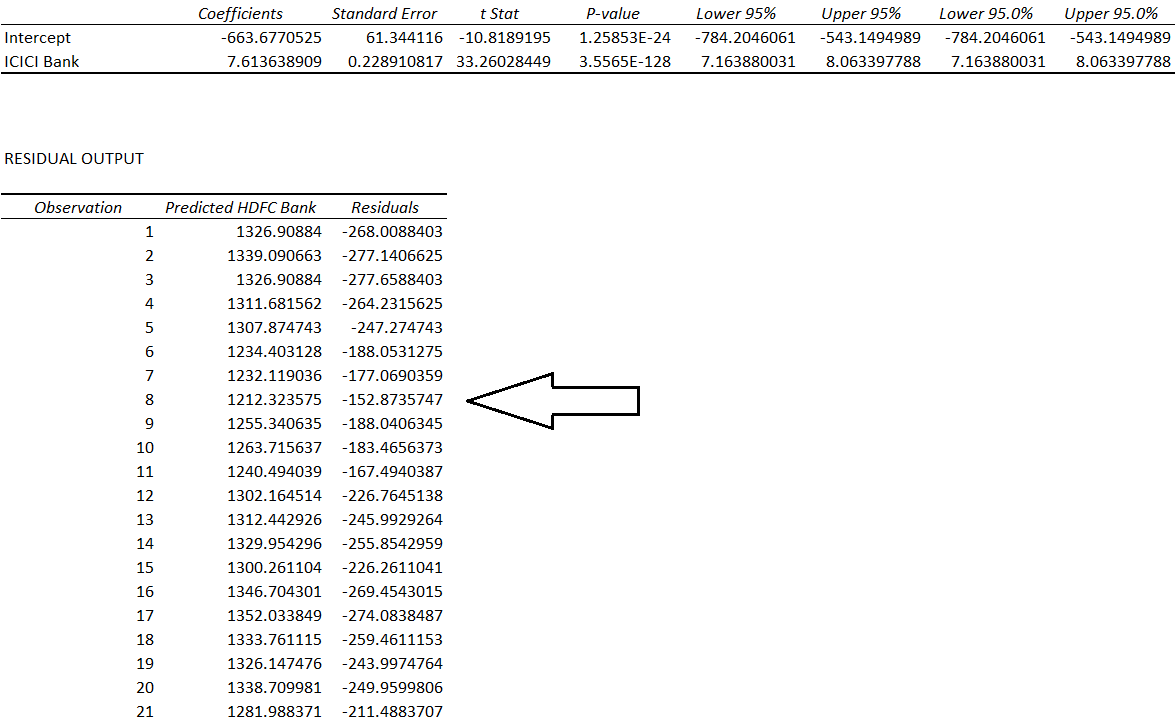
When I talk about the regression equation and the residuals, usually, I get one common question – what is the use of regression if there is a residual each and every time? Or in other words, how can we rely on an equation, which fails to predict accurately, even once.
This is a fair question. If you look at the residuals above, they vary from a low of -288 to a high of 548, so using this equation to make any sort of prediction one price is futile.
But then, this was never about predicting the price of the dependent stock, given the price of an independent stock. It was always about the residuals!
Let me give you a heads-up here – the residuals display a certain behaviour. If we can understand this behaviour and figure a pattern within it, then we can rework backwards to construct a trade. This trade obviously involves buying and selling the two stocks simultaneously, hence this qualifies as a pair trade.
Over the next few chapter, we will dwell deeper into this. However, for now, let’s talk about the ‘Standard Error’, the denominator in the Standard Error of Intercept / Standard Error equation.
The standard error is one of the variables which gets reported when you run a linear regression operation. Here is the snapshot showing the same –
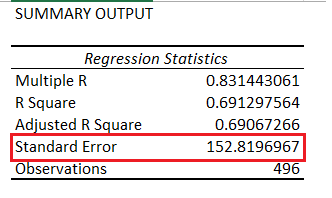
The standard error is defined as the standard deviation of the residuals. Remember, the residuals itself is a time series array. So if you were to calculate the standard deviation of the residuals, then you get the standard error.
In fact, let me manually calculate the standard error of the residuals, I’m doing this for X = ICICI and y = HDFC
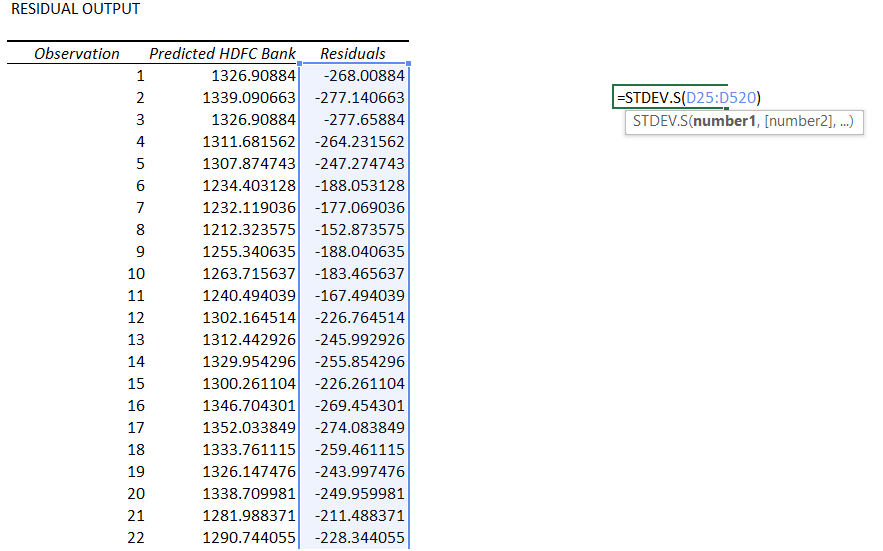
And excel tells me the standard deviation is 152.665. The standard error as reported in the summary output is 152.819. The minor difference can be ignored.
The ‘Standard Error of the Intercept’, is a little tricky. It does get reported in the regression report, and here is the standard error of the intercept with x = ICICI and y = HDFC
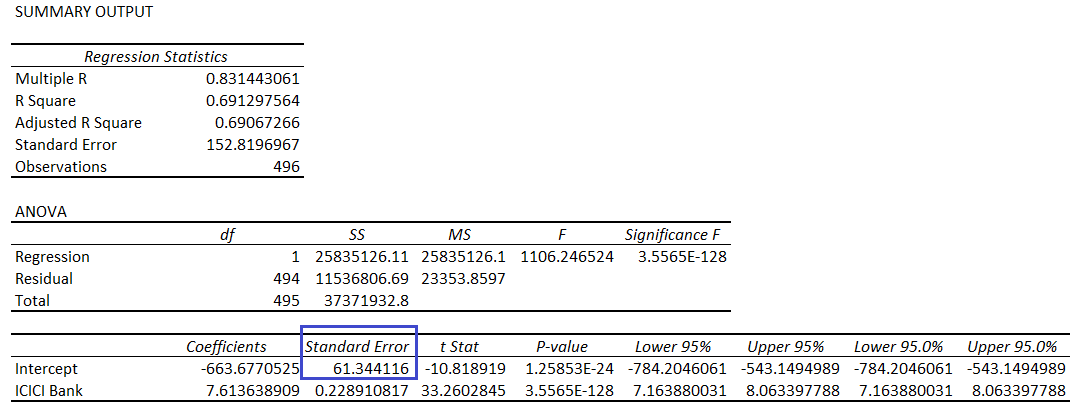
Recall, the regression equation –
y=M*x+ C
Where,
M = Slope
C = Intercept
If you realize, here both M and C are estimates. And how are they estimated? They are estimated based on the historical data provided to the regression algorithm. The data can obviously contain noise components and few outliers. This implies that there is a scope for the estimates can go wrong.
The Standard Error of the Intercept is the measure of the variance of estimated intercept. It helps up understand by what degree the intercept itself can vary. So in a sense, this is somewhat similar to the ‘Standard Error’ itself. To summarize –
- Standard Error of Intercept – The variance of the intercept
- Standard Error – The variance of the residuals.
Now that we have defined both these variables, let’s bring back the ‘Error Ratio’. Please note, the term ‘Error Ratio’ is not a standard term, I’ve come up with it for ease of understanding.
Anyway, the error ratio, as we know –
Error Ratio = Standard Error of Intercept / Standard Error
I’m calculated the same for –
- ICICI as X and HDFC as y = 0.401
- HDFC as X and ICICI as y = 0.227
The decision to designate X and Y to stocks depends on the value of the error ratio. The lower the better. Since HDFC as X and ICICI as y offers the lowest error ratio, we will designate HDFC as the independent variable (X) and ICICI as the dependent variable (Y).
I’d love to explain the reason as to why we are using the error ratio as the key input for designating X and Y, but I guess I will hold back. I’ll revisit this again when I take up pair trade example.
For now, remember to calculate the error ratio and estimate which stock should be dependent and which one will be the independent.
You can download the excel sheet used in this chapter here.
Key takeaways from the this chapter
- X is the independent stock and Y is the dependent stock
- The decision to figure out which stock is X and which one should be Y depends on ‘Error Ratio’
- Both the slope and the intercept from the linear regression equation are estimates
- Error Ratio = Standard Error of the Intercept / Standard Error
- Standard error is the standard deviation of the residuals
- Standard error of intercept gives you a sense of the variance of the intercept
- Regress Stock 1 with Stock 2 and also Stock 2 with Stock 1, whichever offers the lowest error ratio defines which stock is dependent and which one is independent
- Residuals display certain properties, studying which can help identify pair trading pattern
Hi Karthik,
Really appreciate the work. I literally had the doubt of how to choose the dependent and independent variable for the beta calculation between the two stocks. You have answered how to proceed. Thanks. But I would like to understand more about the error ratio. If possible can you share the resource which you have used to understand this concept?
Krishna, you can check this book for more details – https://www.amazon.in/Pairs-Trading-Quantitative-Methods-Analysis-ebook/dp/B0030II24U
Sir, thanks for great explanation. I\’m trying to calculate error ratio programmatically but couldn\’t find formula for standard error of intercept. Could you please share the formula to calculate standard error of intercept ? It will be great help for me.
I usually use excel\’s regression function. Dont use the actual statistical formula 🙂
I\’d suggest you look it up.
Hi Karthik,
For example,
I used bank of baroda as x stock and other stocks like (sbin, canbk, cholofin) as y stocks , in these combination I am getting same constant error ratio (0.35) values for bob vs sbin(y-stock), bob vs canbk(y-stock), bob vs cholofin(y-stock) combinations. This is what i meant in previous question. My question is why bob as xstock is giving same error ratio with other y stocks ? and its meaning ?
Thanks,
Hari
Ah, got it. I\’m not sure. Its possible that the numbers are different, but looks 0.35 when you round it off to 2 decimals 🙂
Hi Karthick,
Some stocks are having constant error ratio (less than 0.1) with all other stocks , in these cases what is it conveying ?
Thanks,
lingam
Constant error?
Sir, how can make sure your that data is clean – adjusted for splits, bonuses, and any other corporate actions.
Like if some events had occurred, then how to incorporate this?
Its best if you get your data from a clean source, maybe from an NSE-approved data vendor.
Dear Karthik, can you explain how to adjust for splits, bonuses, and any other corporate actions with an example
There is something called an adjustment factor, which gets a little complicated. Instead you can check with an NSE authorized data vendor and buy data that is cleaned up for all these corporate actions.
Great article. Just wanted to know if R^2 is not a good way to understand if two stocks move together rather than checking if errors are stationary?
Sir we should take Closing Prices Right? Sir dividing Standard error if Intercept/Standard error not getting value which is posted by you,where I\’m going wrong
Yes, closing prices.
Hello Sir
Thank you for the amazing lessons, I really appreciate them. one concern I had was when we calculate slope and intercept how much of the past data should we consider for eg 1 year- 2 year etc? and as stock moves everyday new data is generated which will lead to a slightly different slope and intercept, how do you suggest we tackle that problem?
Thank you in advance
This is a tricky part, Harshil. I\’d suggest you take at least 1 complete cycle i.e. peak to trough to peak.
496 observations , data set is of only 23 observations
Can you provide excel sheet here?
It is available, right?
Can intercept and slope have multiple answers?
Nope, has 1 value.
Thank you Sir😊
Good luck!
Sir can you paste the link of nse where we get the historic data of closing price of stocks
Google it, Chandu 🙂
https://www.nseindia.com/get-quotes/equity?symbol=BAJFINANCE
Thank you sir for this wonderful lessons ☺️,reading your lessons one by one like watching webseries that\’s how you\’ve published the content clearly
Sir My question is
Where do we get the data of stocks for 2 years
And
Make sure your data is clean – adjusted for splits, bonuses, and any other corporate actions
Make sure the data matches the exact dates – for instance, the data I have for both the stocks here runs from 4th of Dec 2015 to 4th Dec 2017.
Sir if ICICI Bank announces bonus the stock price will be reduced what to do in that situation
And how can one adjust split and bonus sir,give some perspective on this
Thanks for the kind words, Chandu!
1) Look at NSE website or talk to an authorized data vendor
2) An authorized data vendor will ensure he gives you the clean data, so you don\’t have to worry about it.
Sir, Is there any way to manually calculate standard error of intercept???
No, its best to use a tool like Excel.
Hello Karthik
If there ware any split bonous etc happen how to adjust the data .
Thanks
AK
You will have to apply the split ratio to adjust the data, will see if there is any note on this.
Thanks ! 🙂
Welcome!
Hello Karthik,
Thanks for putting up such knowledge rich content in such simple words.
Although I am confused about calculating the standard error of the Intercept. I am trying to calculate this in python but i don\’t understand how it is actually calculated. I am pretty sure the linear regression gives one value for intercept (C). How can you calculate the std or variance of a single number. The same question is also asked by Prafulla and i fully agree with him. Can you please elaborate on the formula used to calculate standard error of the Intercept.
Thanks
Check this link – https://people.duke.edu/~rnau/mathreg.htm#standarderrors , under \’Formulas for standard errors and confidence limits for means and forecasts\’.
Hello Karthik,
First of all Thank You for putting such complex knowledge in such simple words.
I was a bit confused on one of the point . which is as below
\”Make sure your data is clean – adjusted for splits, bonuses, and any other corporate actions\”
How do we correct the data which we receive from NSE website? does the data from NSE already consider this points ?
?
Thanks in advance.
Pravin.
Pravin, maybe you should source the data from an exchange approved data vendor. They charge a little but ensure you get clean data.
Mr. Karthik,
I have gone with this pair trade and booked Rs. 81,000 profit (66% of target). In bought X i have exited earlier by booking 1,20,000 loss and in the sold Y retained the position for 4 more days. Overall this was profitable. If I would have retained the X together total profit would be 54,000 which is 34% of target.
Thanks for your knowledge sharing. Earlier I had huge losses. With such method I can cover my losses without any worry.
Thanks Again
Happy trading! A word of caution though – no strategy or system is foolproof 🙂
Mr. Karthik
Your guidance is highly simple to understand. One question about the Error Ratio.
When Error ratio are very close to each other e.g.
STOCK1 as X and STOCK2 as y = 0.3676
STOCK2 as X and STOCK1 as y = 0.3665
Then selecting X and Y is risky.
Moreover, pair test for correlation gives 97% correlated and stationary test ADF p value comes 0.0033 along with the 21% is the intercept (m) of Y value.
Then selecting X and Y is risky.
Is there any other test is possible to clearly identify X and y ?
I cant think of alternative technique to select X and Y. I\’d suggest you go with this on a case to case basis. But strickly going by data, it should not really matter.
sir how to calculate half life mean reversion ? in how many days , it will revert to mean. added this module sir requesting
Hmm, that would be really difficult to estimate.
Firslty, i would like to thanks u (KARTHIK & VARSITY TEAM) for providing this much deep informatiom for free n in a very easy language…
I\’m reading this all the modulus from past 1-2 months & will complete all of it…
I\’m having a question here
How to CALCULTE the adjusted share price when company announces for splits, bonuses, and for buybacks
so that it will not affect the PAIR TRADING
N ASLO KARTHKS UR FAV 5 BOOKS ON TRADINGS &INVESTING
Thanks for the kind words, Nayan.
From my experience, it is best to avoid stocks which are undergoing corporate actions as it usually leads to miscalculation. However, if you are keen, then the process is to take the ratio as prescribed by the company (example 1:2 split/bonus) and calculate the new number of stocks.
Far too many books, but the one on top of my mind is – When the genius failed 🙂
Hi Karthik,
The basic assumption behind all this process is that both the stocks are in linear relationship with each other and not quadratic or any other kind. why is it so?
That is correct. The idea is to figure out the parameters which define this linear relationship.
Dear Karthick
You calculate the std dev of residuals(standard error) using the excel function STDEV.S. I want to do the same calculation for the standard intercept error. Which time series do I use?
Thank you.
I don\’t think you\’d get a time series for the Std intercept error.
How is the calculation of the standard intercept error done?
Thank you.
This is a single error output and not a time series unless I\’m missing something here.
The Standard Error of the Intercept is the measure of the variance of estimated intercept. The variance is calculated for a series of observations. My question is what is the series whose variance is being calculated to calculate the Standard Error of the Intercept?
Also, note that regression gives one number for the intercept. What does it mean to have a variance for a single number?
The excel algorithm has to, presumably, had used a series.
Sir,How do you calculate the standard error of intercept… is it stdev((Y-intercept)/coefficient or slope)…if i am wrong can you please elaborate its calculation?
* sorry I meant the above equation as stdev((Y-(slope or coefficient)*X)
Yup, all these and more.
I\’ve elaborated this in the chapter itself, Kaushal. This comes from the linear regression. Can you take a look again, please? Thanks.
Dear Karthik,
\”Make sure your data is clean – adjusted for splits, bonuses, and any other corporate actions.\”
which website to refer for this, as different websites are showing different data for same stock? like on investing.com,moneycontrol and nseindia.
Please guide.
Swapnil, yes, generally they have a clean data source.
Sir, whats the meaning of this : Make sure your data is clean – adjusted for splits, bonuses, and any other corporate actions ?
Suppose the stock is trading in the range of 100 – 120 for over the last 1 year…now today there is 1:2 split, then the stock price drops by half. You can go back in history and correct the last 1 year data to reflect this effect of the split. So the range becomes 50-60 instead of 100 – 120. This is essentially cleaning up the data.
Hello sir
Whenever two time series data are rgresseed we get bunch of o/p. But whether the generated o/p are useful depends on the stationarity of the residual data.
Then what is the essence of \’co-integration\’? Is there any parameter(as in correlation) that defines the strength or weakness of co-integration b/w two securities?
Thank you
Varsity student
The whole test of stationarity is, in essence, checking for cointegration. Have explained this in detail here – https://zerodha.com/varsity/chapter/the-adf-test/
Hi Karthik,
Why is lower error ratio better? A lower error ratio would imply higher standard error for residuals.
many thanks for your brilliant articles!
Kishan, great questions. You will understand this better over the next 2 chapters, but let me try and give you a quick answer. The ratio is basically –
Std Error on intercept / Std Error of Residuals.
If the linear regression equation is to be relied upon, then the standard error of the intercept has to be low. Also, if the trade has to have a decent target and SL range, then the standard error of the residuals should be large (but also adhere to the principles of stationarity, which is explained in the next chapter). This also implies the ratio itself should be low.
Hopefully, the next few chapters will give you all the clarity.
This does give some clarity. But I think it will get clearer in next 2 chapters.
Thanks again!
I hope it does. The next chapter is out, do check it out – https://zerodha.com/varsity/chapter/the-adf-test/
Excellent! Thanks.
Cheers!
Hello Karthik,
As usual lucidly explained and waiting eagerly for the next chapter. I have one question, though. Could this system be applied to commodity pair as well as currency pair? Do let me know your opinion on it.
Mainak, I\’m guilty of delaying the next chapter. The concepts of the next chapter is kind hard, I\’m trying my best to find ways to keep it simple 🙂
Please bear with me for another few days. Thanks.
Hello Karthik,
No worries. But I guess, you missed my question here :-).
Let me repeat it – Could this system be applied to commodity pair as well as currency pair?
Thanks…
Oh, yes. You certainly can and my gut says it could work better on them as opposed to Equities 🙂
Thanks for the clarification !!!
Sir is it possible to look for stocks that are correlated inversely? If yes how to look for those kind of stocks?
The correlation itself will tell if they are inversely correlated. A negative number of correlation suggests that they are inversely correlated.
Yes sir I see what you are saying. But I\’m asking about the initial selection of stocks to check for correlation. If the stocks are to be positively correlated, we look for stocks in same industry that have similar businesses. I\’m asking, what factors would cause negative correlation between two stocks?
That would be a tough call, Sandeep. Isolating factors which cause -ve correlations can be tough, especially in markets!
Thanks a lot Karthik.
Knowledge is path to freedom if understood properly and applied.
One suggestion that is it possible to enter a pair trade and put a target for the setup rather than monitoring time to time and exiting manually each of the script.
Eagerly waiting for your next chapter.
Thanks a billion.
Deepu
Deepu, as you will soon realize, when you enter the pair trade, all you need to do is track the residuals and not really the individual scrips. I\’m working on the next chapter, should be ready in a couple of days.
sirji,
lao next chapter jaldise…
kitni pariksha loge dhiraj ki?
🙂
Thanks Karthik.
I am eagerly waiting for the next chapter. This whole journey of gaining knowledge is a suspense thriller.
Never before I enjoyed gaining so much knowledge and the eagerness to reach the finishing line is at its peak.
Regards
Deepu
Happy to note that, Deepu. It gives us the same amount of joy and happiness to share knowledge (to the extent of what we know), with you all! Good luck.
Hi Karthik
Eagerly waiting for your next chapter.
Regards
Deepu
Have been a little tied up, Deepu. Will try and put this up this week. By the way, the next chapter will be quite intense 🙂
Karthick, the latest move by SEBI on the clampdown on retail traders trading in F&O limiting them to ITR limit is a dampner to what we are learning here. Could you give your perspective, if this move by SEBI will limit retail traders turnover in F&O ?
I personally think this is not practical, lots of loopholes in the proposed scheme, which has been highlighted to SEBI. I guess we need to wait and watch to see what SEBI will eventually do.
hope your words come true. Thank you
Good luck 🙂
Dear team,
we read yours all chapters is it very good information to us.
but 1 suggestion for zerodha team.
Kindly provide its all information in hindi also. bcoz some people are not too much qualified.
& thats why this all information you are provide also with beautiful examples but people cant understand due to language problem.
nice information good keep it up & updating new information for share market.
Deepali, we tried putting this content in Hindi, but unfortunately, we could not find quality translators. We will give this another shot.
Nice to read all your modules
V lucid and easy to understand
illustrations . Great
I have a small query if two stocks are strongly corelated what is the statistical measure to find the magnitude of price movement .
Thanks in advance
To some extent, beta gives you that magnitude.
Nice work Sir!
Awaiting next update!
Thanks, Pavan. Will update the chapter next week.
Really appreciate your effort to simplfy the who learning experience.
Great work.
I just want to know your take on Market profile, Order flow and other approaches to the market.
It would be really nice if you can put in your view sir.
Thanks, Naveen.
Market profile is an interesting concept. I have not put up any material on this yet but will do so sometime shortly.
Thank you, Sir.
Learnt a lot through your work on Zerodha.
Keep up the good work and I\’ll wait for the chapter to come up.
Thanks, Naveen. The next chapter will be up sometime next week.
Great chapter!!!
Sir always waiting for the next chapter as each chapter always boost my interest level!!
Thank u sir very much!!
Will try my best to post the next chapter soon 🙂
Sir, what if we use returns on two stocks rather than price to form pair trading strategies.
You can, but that will lead to a very short-term approach to pair trade. This is best done with the price. Will try and give an explanation to this in the next chapter.
Sir,
Can we keep the simple method based on correlation and cointegration only? This chapters going to much deeper now.
First i find 80% or more corelated stocks pair for last 63days (one quarter) .then check cointegration, in which pair cointegration less then 0.5 for last one year..i simple create the trade and its working fine. My favorite pairs are banknifty/nifty, acc/ambuja and tatamotors/tatamtrdvr…
I.cant understand why u taking us in too deep…
Akash
With all due respect to your views, please don\’t mind but my view is that to have all the tools in place for any trading strategies.
Trust me knowledge is power and the deeper we are into learning and upskilling we will be in positive side of making money.
These all different statistics tools which will make the trades better or least we can avoid bad trades.
Simplicity is good but when we are dealing with Biggies than we need to be as smart as possible on the knowledge front.
Once again thanks Karthik for sharing the knowledge. Your sharing attitude is priceless and so many countless people must be thankful to you for sharing the pearls of trading.
Thanks once again.
Agree with you, Deepu 🙂
Keep going Karthick, without allowing anyone to influence what you have set to do.
Thanks, Rohit! Will do 🙂
Akash, trust me, the method we are discussing here is a unique way to pair trade. You will not find this explanation anywhere else. Learn it, and once you have all the information you can decide to adopt or ignore or even improvise the technique.
Sir I think I\’ve read this mean reverting strategy in a website called Quantopian but I could never understand it before now. Thank you. My question is, do you think its possible to create new mean reverting strategies if one has a firm understanding of statistical methods. You think a retail investor can do that?
Yes, you certainly can. These are not latency critical strategies, meaning, the speed of information does not matter. What matters is the statistical/ quantitative technique. As long as you have a firm understanding of this – there are always opportunities in the market.
Kite 3 platform has the function to find correlation coefficient ratio between two stocks. For eg. correlation between Banknifty & Yesbank in Excel function Correl() returns a value of .38, Kite 3 shows the ratio as .83. Why the difference?
Its calculated for last 1 year
Yes, but you can calculate this for 2 years, 1 year, and 6 months.
Rohit, can you tell me which study you are referring to in Kite3?
In Kite 3, in \”Chart\”, under \”Studies\” menu, i selected \”Correlation Coefficient\” to find for stocks between banknifty and yesbank. In Kite 3, its showing all the same as .83 for 3 months, 6 months, 1 year. Strange. In excel, correl() functions, its .38 for 1 year and -.02 for 6 months. How the answers are coming different?
Let me check this, Rohit.
Excellent write up Karthik!!!
The appetite to learn the complete thing on pair trade is at its peak. Please let us know when can we expect your next chapter. Eagerly waiting.
Thank a million once again.
Regards
Deepu
Thanks for the kind comment, Deepu. I\’ll try and put up the next chapter soon.