6.1 – A quick recap
I think a quick recap is justified at this stage, this is to ensure we are all on the same page. I’d strongly recommend you read through the recap, to ensure we are on track. I’ll keep this as a pointwise recap to ensure we don’t digress.
- Two companies are comparable if they have similar business background
- Business background includes factors which influence the day to day running of the business
- If two companies have similar business backgrounds, then it is reasonably safe to assume that their share prices move somewhat similarly on a day to day basis
- If the daily stock price of two comparable companies move together (and therefore their daily returns), then they do tend to have a tight correlation
- There are times when a local event can change the course of the movement in the stock price of one of the two companies, creating a pair trading opportunity
- The relationship between the stock prices of the two companies can be estimated by any of the three variables – spread, differential, or ratio
- The variables are expected to be normally distributed, hence we calculate the standard deviation of these variables, along with the basic descriptive statistics such as the mean, median, and mode.
- As a ready reckoner, we also have the standard deviation (SD) table, extending up to the 3rd SD, either sides
- Lastly, do remember we are in the process of discussing two variants of pair trading, starting with Paul Whistler’s technique of Pair Trading. After this, I will discuss a slightly more complicated version of Pair Trading
So this brings us to where we are at this stage. In this chapter, we will go ahead and discuss the density curve and the eventual trigger to pair trade.
6.2 – Selecting the variable
We have come to a stage where we need to stick to one of the variables amongst Spread, Differential, and Ratio. Why just and why not all, you may ask?
Well, this is to ensure that we are sticking to a regime and not really getting confused with conflicting signals. The reason I’ve introduced all three variables is to showcase that there are three different possibilities. It is up to you as a trader to choose the variable that you are most comfortable with. For example, I personally prefer the ratio over the differential or spread. This is because the ratio kind of captures the market valuation of the stocks since it considers the latest stock price. Besides the ratio also gives us a quick sense of how much of Stock 1 should be bought or sold with respect to stock 2.
For example, if the price of Stock 1 is 190 and Stock 2 is 80, then the ratio of stock 1 over 2 is –
190/80
= 2.375
This implies for every 1 share of Stock 1, 2.375 shares of Stock 2 has to be transacted. We will get to the finer details later, but for now, hope you get the drift.
You are of course, free to choose any of the variable – spread, differential, or ratio. However, for the sake of this discussion, I will go ahead with the ratio.
6.3 – The trade trigger
As the name suggests, the pair consists of two stock. Until now, we have not defined how to buy or sell a pair, we will do that later in this chapter. For now, assume that you can buy or sell a pair just like the way you can buy or sell a single stock.
As you may have guessed, the decision to buy or sell a pair is dependent on the variable that you track and the variable itself could be the spread, differential, or ratio. For the purpose of this discussion, we are going ahead with the Ratio.
Think about it this way – the stock prices change every day, therefore the ratio of the pair itself changes every day. On most of the days, the daily change in the ratio falls within the expected range. However, there could be days when the daily change goes beyond the expected range. These are the days when a pair trading opportunity arises.
Have a look at the chart below –
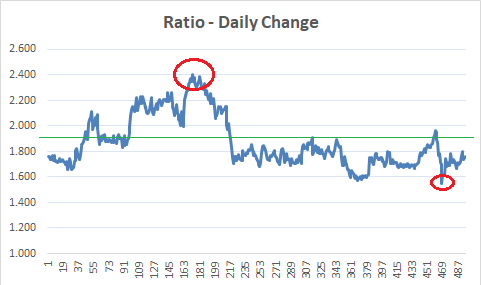
Casual eyeballing reveals two obvious information –
- The ratio chart hovers around 1.8 and 2 – probably the ratio’s mean is around this price. I’ve highlighted this with a green line. I’d suggest you check the mean value of the ratio we calculated in the earlier chapters.
- On most of the days, the ratio hovers above or below the mean value
I want you to pause here and think about this. This is the tipping point in Pair trading, if you can understand everything we have discussed up to now, then the rest is a cakewalk.
The ratio itself is a variable which is derived by dividing stock 1 over stock 2. The ratio changes every day since the stock prices change every day. If you plot the chart of the daily change in the ratio you will notice that the ratio has an average (mean) value and the ratio trades above and below the mean value. Irrespective of where the ratio is today (i.e either above or below the mean) – there is a great chance that ratio will come back to mean over the next few days. Notice, I use the word ‘great chance’, here. This means, that we should be able to quantify the probability of the ratio reverting to mean.
In fact, this phenomenon is referred to as ‘Mean reversion’ or reversion to mean.
I’ve circled (in red) two points in the chart where the ratio has deviated away from the mean. The first circle from the left indicates a point where the ratio has deviated higher than the mean value. The 2nd circle from the left indicates a point where the ratio has deviated below the mean value. In both these cases, eventually, the ratio reverted to mean.
Now, if you look at it in another way – we now seem to have an opinion on the direction in which the ratio is likely will move. For example, the first circle where the ratio has moved above the average indicates that the ratio is likely to retrace back to mean. Or in other words, you can short the ratio at the high point and buy it back around the mean. Likewise, the second circle points to an opportunity where one can buy the ratio, with an expectation that the ratio will move back to the average value.
Think about the ratio as a stock or futures. Since the directional movement of the ratio is predictable, we can as well place bets on the directional movement of the ratio itself.
I hope you are getting the point here.
The ratio’s value with respect to the mean acts as a key trigger to initiate the trade. If the ratio is –
- Above the mean, the expectation is that the ratio will revert to mean, hence short the ratio
- Below the mean, the expectation is that the ratio will scale back to the mean and hence go long on the ratio
Alright – so far so good. Here are few questions though –
- The ratio is always above or below the mean value – does this imply there is always a trading opportunity?
- There are multiple points where the ratio seemed to have bottomed out or peaked, how do we know the exact point at which the trade has to be initiated?
The answers to these questions lie in something called as the ‘Density Curve’. Let’s figure that out.
6.3 – The Density Curve
Have a look at the chart below –
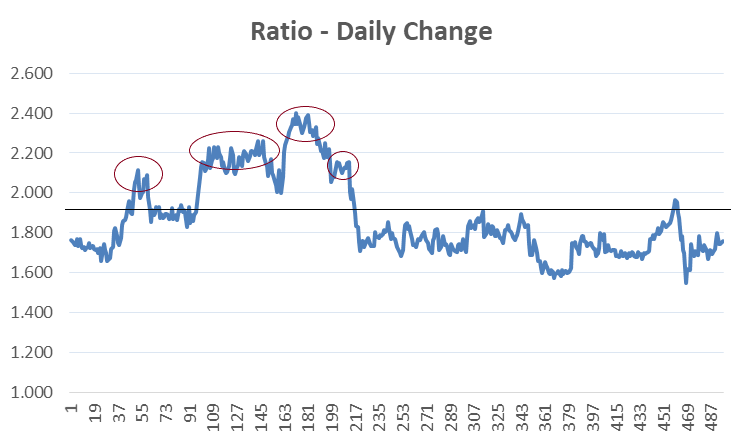
I’ve highlighted 4 points on the chart, at all these points, the ratio has traded above the mean. Assume, you were looking at this chart around the time the first circle is marked. Now, just because the ratio has shot up above the mean, would you take the trade? In fact, the same question can be asked every time the ratio has traded above (or below) the mean.
I’m sure you’d agree that this would be a great idea. We need to observe the ratio closely and initiate a trade only when the chance of mean reversion is very high. Or in other words, we need to initiate a trade only when we are reasonably certain that the ratio will slide down to the mean value, as quickly as possible.

To put the point across – this is pretty much like a tiger waiting in the ambush to hunt down a prey. Just because the prey is in the open, the tiger will not jump and ruin its chances of a kill. It will attack only when it is convinced that the effort will lead to a kill.
So how do we stay in the ambush and wait for our chance for the kill?
Well, we seek refuge in the good old Normal distribution and its properties. I’m hoping you are aware of normal distribution and its properties by now. Here is a quick recap, I’d suggest you read the complete theory, I’ve discussed this across various chapters in Varsity –
- Within the 1st standard deviation (SD) one can observe 68% of the data
- Within the 2nd standard deviation one can observe 95% of the data
- Within the 3rd standard deviation one can observe 99.7% of the data
So here is what this means with respect to the ratio –
- The ratio, irrespective of where it stands with reference to the mean, has a standard deviation value. For example – it could be just a few points away from the mean and this could translate to say, 0.5 standard deviations from mean
- If the ratio deviates to the 2nd standard deviation, then according to the normal distribution properties, there is only 5% chance of it going higher or in a very loose sense, it poses a 95% chance of reverting to mean.
- Likewise, if the ratio deviates to the 3rd standard deviation, then it only has a 0.3% chance of drifting higher or in a very loose sense, it poses a 99.7% chance of reverting to mean
So at every SD, we can estimate the likelihood of the ratio reverting to mean. This means we can filter out opportunities and initiate a trade only at points where the likelihood of success is high.
This further leads to an interesting take – the key trigger to initiate a trade is not just based on where the ratio is, but also depended on its standard deviation. Given this, it makes sense to directly track the daily standard deviation of the ratio as opposed to the ratio itself.
This can be achieved by tracking the ‘Density Curve’ of the ratio. The density curve is a non-negative value which lies anywhere between 0 and 1. I’d suggest you watch this video on Khan Academy to learn more about Density Curve.
Calculating the density curve on excel is quite straightforward. Here is how you can do this, have a look at the image below –
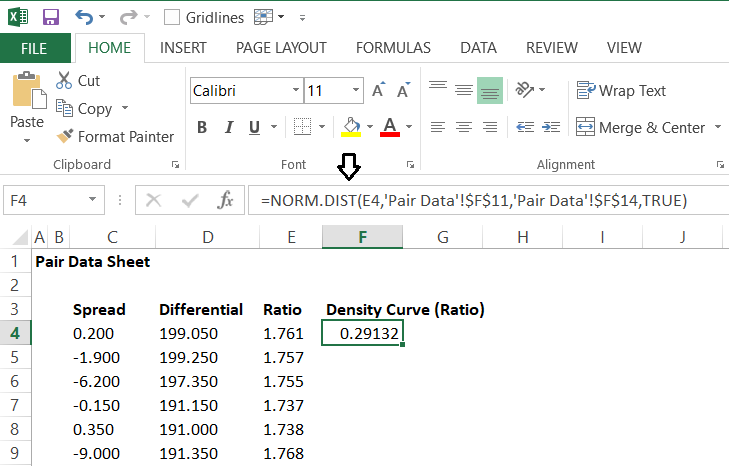
You can use the inbuilt excel function called Norm.dist for this. The function requires 4 inputs –
- X – this is the daily ratio value
- Mean – this is the mean or average value of the ratio
- Standard Deviation – this is the standard deviation of the ratio
- Cumulative – You have to select true or false, select the default value as true.
I’ve calculated the density curve value for all variables, here is how the table looks –
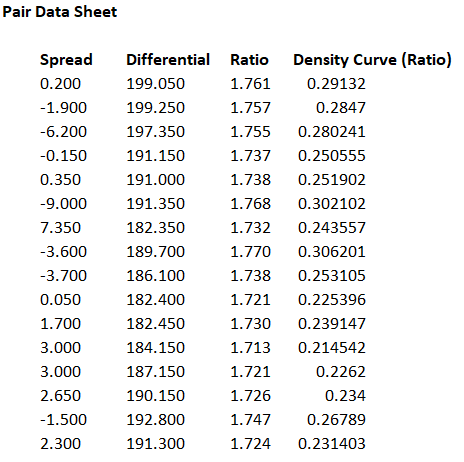
I guess we could break this chapter at this point. In the next chapter, we will look into details on how we can use the density curve to trigger long and short pair trade.
Download the excel sheet used in this chapter.
Key takeaways from this chapter
- Ratio as a variable is more versatile as it captures the valuation elements of the stock
- The ratio tends to trade above or below its mean value
- The idea is the ratio, when it deviates away from the mean, will also tend to revert to mean
- At every point at which the ratio deviates, we can measure the probability of its reversion to mean
- The above point can be measured by normal distribution
- The density curve is a non-negative value which varies between 0 and 1. This can be easily calculated on MS Excel by using an in build function.
Hi Karthik
I have doubt on the density curve which is arrived at using the ratios of the stock prices. If i compare HDFC (Numerator) and Axis Bank (Denominator), the density curve comes to around 0.95, however when i compare Axis bank (Numerator) and HDFC (Denominator) the density curve comes to around 0.017. Is this correct or is there an error in the stock prices?
Thats ok, but in the next method, we have discussed which combination of stocks to use in numerator and denominator.
Logic we used while taking trade using density curve (SD consideration), can we use the same logic for implied volatility to asses probability of IV to go more up(Beyond 2/3SD) or more down(-2/-3 SD) in options trading?
Hmm, no, I\’m not sure about that.
Hello Karthik,
Thank you for all the efforts you have put into making it simple and easy to understand.
I have a few questions about the usability of this setup.
1)This strategy is a time-consuming process as requires time to calculate and implement. Do you use them in real-time with the help of a preset of formulas in excel or is it more of a next-day trade setup?
2) Can this setup be implemented on all trading vehicles – MIS, F&O?
Thanks again for your time.
Anuraag
1) I\’m not allowed to trade now, but when I was trading, yes, I was using it real-time
2) F&O yes, works with overnight positions and not much with intraday.
Just finding a bit hard to run the stationarity test in excel without the plugin (are you still updating the excel somewhere?). Since with the adf test we are checking if the returns on stocks are correlated, can we use correlation function instead and use regression for trading signals?
Its not just correlation, it\’s also about cointegrated series. Btw, I think someone here had posted a free excel plug in for this.
Hey Karthik,
So i found a bunch of pairs in various sectors and used the first method (Mark Whistler\’s) to check for viability. I used ratios for all pairs and had data running for the last 5 years. However, when i did a quick analysis of the ratio distribution, none of them came out to be normally distributed. I guess will be futile to apply this method to trading these pairs and probably why you stopped using this.
Thoughts?
Hmm, I just found the other method better 🙂
I am using the avg ratio for 200 days ,ok thanks for replying.
Good luck.
hi sir, please clear the following doubts:
1) avg ratio that we need to put in normdist() function should be avg of ratios of one year or it can be less also, and same question for std also?
2) avg ratio will be fixed for that year or will it change with days ? (same question for std)
Thanks in advance
1) It can be for 6 months as well
2) This is on a rolling basis no? Changes with new data coming in, old one getting flushed out.
How do you come up with the DENSITY CURVE VALUE-0.92
Hi Sir,
Based on ur suggestion pair trading is fruitful.
Could you please highlight 2 more statistical trading setup names only.
I explored a lot, but not able to find any other setup of trading which is the proper rule and number based. Please mention the names only.
Thanks in advance.
Volatility arbitrage is one of the popular techniques, Riya. Besides this, calender spreads (CS) is good, but opportunities are hard to come by in CS.
Can you tell me why you use escel function \’pair data\’!$f$11?you told to use average or mean and stdev at thaat place.
Thats is not a function, Edward. I guess I\’m referencing this to another cell.
pl generate pdf link for this last no 10 module
thanks
Hemal, this module is not yet complete. PDFs will take time.
Hey Karthik hi,
Gone through the density curve ratio setup on my excel with database of 100 days which gets updated daily with closing price of the pairs.
My question here is , the density curve ratio on 24/5/18 with closing (upto 23/5/18) shows 0.99270 for a given pair and now today(25/5/18) with 24/5/18 closing loaded it shows 0.99276 ratio for same 23/5/18.
How does this theory of short pair 0.995 and Long at 0.005 be valid if the density curve changes everyday of a particular date when trade initiated?
Mohit, was there a drastic move in one of the stocks? Was it Tata Motors?
No not tatamotors, I have paired AUROPHARMA n Wockpharma. With 100 days of data feed daily.
There was no drastic movement in it.
N yes this change occurs in every pairs I kept on watch.
After daily updation of new 100 days data the last reading of density curve Changes which i noticed yesterday for the same dates.
Thnx for your Prompt reply as it’s urgent to rectify the error.
Mohit, I personally prefer rolling 200 days of data, I get smoother results with it.
Pls go through the link for the spreadsheet I made roughly to put up the theory I understood.
Kindly let me know any mistakes or misconception i carry in understanding the logic.
https://docs.google.com/spreadsheets/d/1zUUTKwoTT3NfyEsHVEv1EMWJ13li3BF-pUWNlc_0Mmk
Thanks,
Awaiting your feedback for above query.
Mohit, a bit swamped with work. I will go through it as and when I can. Thanks.
Hi karthik,
Eagerly waiting for the next chapter.
Also wanted to know your opinion on Quantinsti EPAT programme if you want to learn algo trading.
Is it worth the money?
New chapter will be up this week. Quantinsti is a nice institute. Go for it.
Sir,
My question is regarding the data required to do various calculations.In your reply somewhere you said getting data from the vendors would be the best option.I just wanted to know that the EOD data on the NSE site available is it not cleaned of splits and bonus ?? cant we use the data available on nse site ?
Yes, you can use the data on NSE. I think its cleaned for splits and bonus. Request you to kindly clarify with NSE itself. Thanks.
Sir is mean reverting and statistical arbitrage the same thing? If not what are some of other mean reverting and statistical arbitrage strategies other than pairs trading? Please help me clarify the same. I\’m confused about this.
Hmm, not really. Stat arb employs mean reversion as a technique. I\’d suggest you read the next chapter (will post it next week), it will clear a lot of your concerns.
Where is the next chapter after desity curve mentioned by you?
Will put this up by next week, apologies for the dealy.
Sir can you tell me one or two things about being successful in market that books and other courses won\’t tell you? From your personal experience?
Not just one or two, but a lot more is here, Pradeep – https://tradingqna.com/t/interview-with-jack-d-schwager/31511
Sir do you think its possible to become a successful trader though self learning, or do you think its essential to learn directly from a successful trader? Your thoughts would be greatly helpful. Thanks in advance.
It has to be a mix of both, Pradeep. You need someone to look up to, who is capable of leading you in the right direction.
Sir what would be your average CAGR for the last 10 years from trading alone (not investing)?
That would be hard to say because I\’ve never quantified my trading. Although I must say, I\’ve had a far greater success in investing.
Sir,
What is the difference between trading and investing. Is not trading is part of investing. Kindly clarify.
san
I\’d suggest you read this, Sankar – https://zerodha.com/varsity/chapter/mindset-investor/
I cannot see download button in this Chapter 10 module.
And also I need to know about algorithm trading in detail. Where should I go or refer?
This module is still work in progress, PDF will be done once the module is complete.
These guys are quite good for algo trading – https://www.quantinsti.com/
Eagerly waiting for all your upcoming chapters:)
Next week, hopefully.
Hi,
I just binge-read (derived from the word binge watch) all the 9 modules (options strategy is left.. was finding it a bit tough) and finished it inside 2 weeks…. probably my personal best 😛 and it was a very good read :D. Very helpful for a beginner. I think if this book was the syllabus for commerce students, which it should be, then 75% attendance wouldn\’t be a problem at all :D. Mumbai University 0 -1 Zerodha.
Starting my second binge reading session today with extra focus on both the options modules. Hope my brain understands it this time :P. Keep em new modules coming
Also i have some shares in my demat account with another broker so what is the procedure of transferring them to zerodha demat account ?
We only wish we could binge write 🙂
We have so much more stored up!
Haha, its okay, take your time… quality over quantity 😛 till then i shall begin with paper trading 😀 blew my trading account once… this is my second attempt. Onwards and upwards. I have some doubts in options trading also.. i will post it in the comment section pls do reply
P.S I also liked your references to moneyball one of my fav movies. You should watch \’rounders\’ maybe you will like that.
I\’ve watched Rounders couple of times, big fan of both Matt Damon and Edward Norton 🙂
Happy trading!
Kite or kite 3 platform are nice and we can get good basics of stocks and trade here. But when it comes to performance on the highly volatile day everything goes for toss while making the trade. Saved views get disappeared and you have to re-apply those in between of your trades which becomes highly risky for traders. It seems your cloud data upload/unload for views has major issues. This happens every now and then. On these voluminous days, buy sell window also behaves weirdly and cant enter price, fields gets locked and only tabbing to the fields gets this resolved.. No solutions to views for last 4 months on help desk..
Platform works good other times than peak times which normally none of traders bother to use..
Hi Karthik,
Good morning, I had no other options to reach out to you other than here…
I have raised #312873 and two other tickets but still the issue has not been resolved yet from past 2 weeks.
In my GUI the BNF options are showing wrong AvgPrice and showing huge Loss in P&L.
I have tried in kite.zerodha.com, kite3.zerodha.com in different browsers, different Laptops, uninstalled and installed KITE in mobile But still the issue persists. Support is telling next day it will be solved everytime i call them.. Please help me out to get the issue resolved.
Thanks,
TG
The issue has not been resolved yet. No response from Zerodha team
hi
You are a great Narrator of the story like any other expert Serial Writer. You end the chapter with guessing…… I had read the chapter in one breath. Nice and interesting reading… By the way it is very nice and touching Topic and I really appreciate the way you explain.
Keep it up…..
Thanks for the kind words, Srinivas!
I\’m glad you liked the contents here. Happy learning 🙂
hi
please upload the pdf for this module
PDFs will be up once the module is completed.
Sir..
Can you please write about quantitative analysis as well..
Particularly using MS-Excel.
Planning to write a module on Financial Modelling using MS-Excel.
Thanks sir..
That will be indeed great help…
Cheers!
I have downloaded DLF 5 years data and placed in price column in excel which you have provided but nothing seems to changed means nothing displays.Please help to sort out this issue.
Like I said, kindly check if the cells are properly linked.
hello sirji,
good enlighten about density curve…i heard about it first time…though doing pair trading since last one and half year when ratio reach to +/- 2 SD…let\’s see what will come next!!
thanks bro…keep it up.
Glad you liked it 🙂 Will try and put up the next chapter as soon as possible.
Excellent write-up!!!
Million thanks for writing this complex subject in the lucid manner.
Eagerly waiting for your chapter:)
Thanks once again.
Please read next chapters:)
Got it 🙂
Will try and put this up soon 🙂
programming skills in which software would help in trading?
I\’ve heard Python is a great language for traders.
Sir that was a very dense chapter, but your explanation made all the difference. Thank you. I have a question. Going by what I understand, I\’d guess the system wouldn\’t generate more than 2 or 3 trades per month, assuming we have tracked 3-4 pairs. The opportunity wouldn\’t be frequent since other traders would be looking for it too. Am I right in saying that?
Yes, the pair trading opportunities do not come by often. Also, it really depends on how the kind of technique you are adopting to pair trade. More on this later.
Sir, can you suggest any indicator which also works as good as TRIN and PCR in zerodha. Thank You
Each indicator has its own set of pros and cons, hence very difficult to isolate one indicator and call it the best.