11.1 – Co-Integration of two-time series
I guess this chapter will get a little complex. We would be skimming the surface of some higher order statistical theory. I will try my best and stick to practical stuff and avoid all the fluff. I’ll try and explain these things from a trading point of view, but I’m afraid, some amount of theory will be necessary for you to know.
Given the path ahead I think it is necessary to re-rack our learnings so far and put some order to it. Hence let me just summarize our journey so far –
- Starting from Chapter 1 to 7, we discussed a very basic version of a pair trade. We discussed this simply to lay out a strong foundation for the higher order pair trading technique, which is generally known as the relative value trade
- The relative value trade requires the use of linear regression
- In linear regression, we regress an independent variable, X against a dependent variable Y.
- When we regress – some of the outputs that are of interest are the intercept, slope, residuals, standard error, and the standard error of the intercept
- The decision to classify a stock as dependent and independent really depends on the error ratio.
- We calculate the error ratio by interchanging both X and Y. The one which offers the lowest error ratio will define which stock is X and which on as Y.
I hope you have read and understood everything that we have discussed up to this point. If not, I’d suggest you read the chapters again, get clarity, and then proceed.
Recollect, in the previous chapter, we discussed the residuals. In fact, I also mentioned that the bulk of the focus going forward will be on the residuals. It is time we study the residuals in more detail and try and establish the kind of behavior the residuals exhibit. In our attempt to do this, we will be introduced to two new jargons – Cointegration and Stationarity.

Generally speaking, if two time series are ‘co integrated’ (stock X and stock Y in our case), then it means, that the two stocks move together and if at all there is a deviation from this movement, it is either temporary or can be attributed to a stray event, and one can expect the two time series to revert to its regular orbit i.e. converge and move together again. Which is exactly what we want while pair trading. This means to say, the pair that we choose to pair trade on, should be cointegrated.
So the question is – how do we evaluate if the two stocks are cointegrated?
Well, to check if the two stock is cointegrated, we first need to run a linear regression on the two stocks, then take up the residuals obtained from the linear regression algorithm, and check if the residual is ‘stationary’.
If the residuals are stationary, then it implies that the two stocks are cointegrated, if the two stocks are cointegrated, then the two stocks move together, and therefore the ‘pair’ is ripe for tracking pair trading opportunity.
Here is an interesting way to look at this – one can take any two-time series and apply regression, the regression algorithm will always throw out an output. How would one know if the output is reliable? This is where stationarity comes into play. The regression equation is valid if and only if residuals are stationary. If the residuals are not stationary, regression relation shouldn’t be used.
Speculating and setting up trades on a co-integrated time series is a lot more meaningful and is independent of market direction.
So, essentially, this boils down to figuring out if the residuals are stationary or not.
At this point, I can straight away show you how to check if the residuals are stationary or not, there is a simple test called the ‘ADF test’ to do this – frankly, this is all you need to know. However, I think you are better off if you spend few minutes to understand what ‘Stationarity’ really means (without actually deep diving into the quants).
So, read the following section only if you are curious to know more, else go to the section which talks about ADF test.
11.2 Stationary and non-stationary series
A time series is considered ‘Stationary’ if it follows three 3 simple statistical conditions. If the time series partially satisfies these conditions, like 2 out of 3 or 1 out of 3, then the stationarity is considered weak. If none of the three conditions are satisfied, then the time series is ‘non-stationary’.
The three simple statistical conditions are –
- The mean of the series should be same or within a tight range
- The standard deviation of the series should be within a range
- There should be no autocorrelation within the series – this means any particular value in the time series – say value ‘n’, should not be dependent on any other value before ‘n’. Will talk more about this at a later stage.
While pair trading, we only look for pairs which exhibit complete stationarity. Non-stationary series or weak stationary series will not work for us.
I guess it is best to take up an example (like a sample time series) and figure out what the above three conditions really mean and hopefully, that will help you understand ‘stationarity’ better.
For the sake of this example, I have two-time series data, with 9000 data points in each. I’ve named them Series A and Series B, and on this time series data, I will evaluate the above three stationarity conditions.
Condition 1 – The mean of the series should be same or within a tight range
To evaluate this, I will split each of the time series data into 3 parts and calculate the respective mean for each part. The mean for all three different parts should be around the same value. If this is true, then I can conclude that the mean will more or less be the same even when new data points flow in the future.
So let us go ahead and do this. To begin with, I’m splitting the Series A data into three parts and calculating its respective means, here is how it looks –
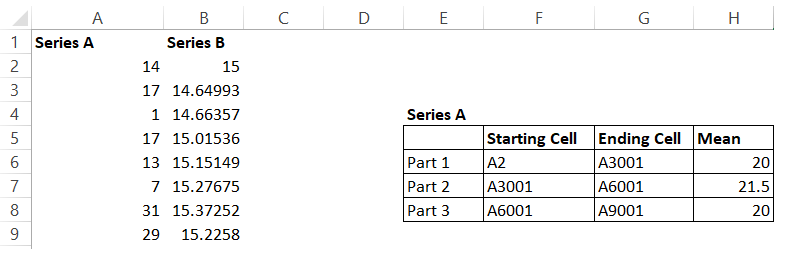
Like I mentioned, I have 9000 data points in Series A and Series B. I have split Series A data points into 3 parts and as you can see, I’ve even highlighted the starting and ending cells for these parts.
The mean for all the three parts are similar, clearly satisfying the first condition.
I’ve done the same thing for Series B, here is how the mean looks –
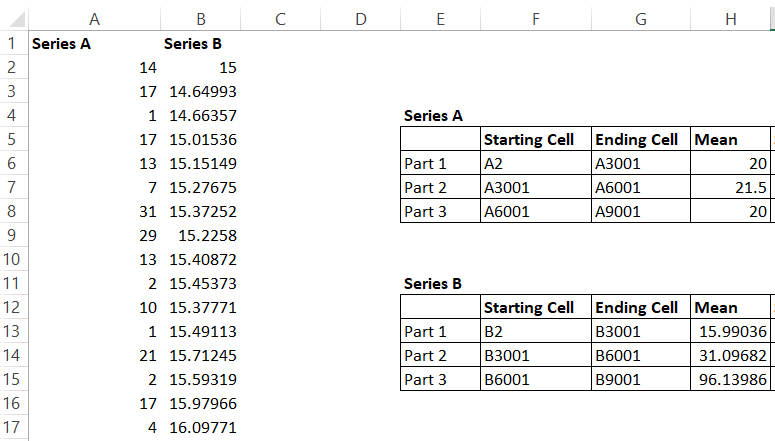
Now as you can see, the mean for Series B swings quite wildly and thereby not satisfying the first condition for stationarity.
Condition 2 -The standard deviation should be within a range.
I’m following the same approach here – I will go ahead and calculate the standard deviation for all the three parts for both the series and observe the values.
Here is the result obtained for Series A –
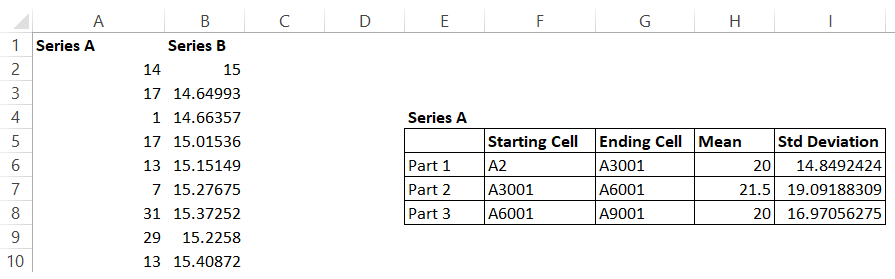
The standard deviation oscillates between 14-19%, which is quite ‘tight’ and therefore qualifies the 2nd stationarity condition.
Here is how the standard deviation works out for Series B –
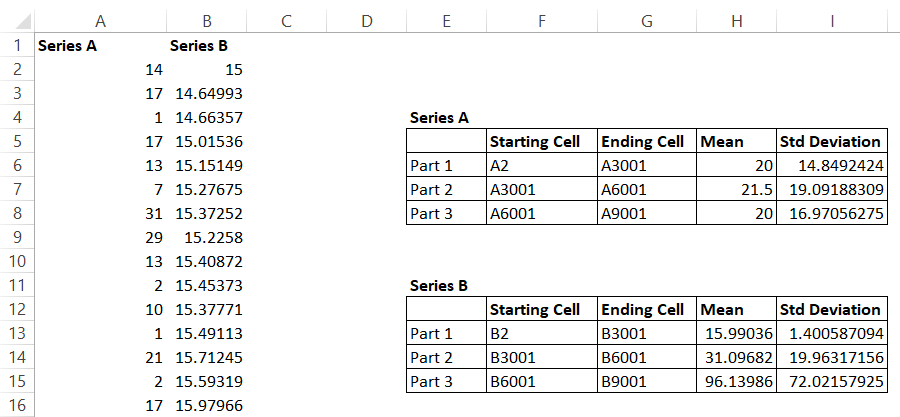
Notice the difference? The range of standard deviation for Series B is quite random. Series B is clearly not a stationary series. However, Series A looks stationary at this point. However, we still need to evaluate the last condition i.e the autocorrelation bit, let us go ahead and do that.
Condition 3 – There should be no autocorrelation within the series
In layman words, autocorrelation is a phenomenon where any value in the time series is not really dependent on any other value before it.
For example, have a look at the snapshot below –
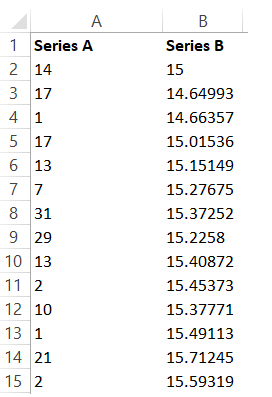
The 9th value in Series A is 29, and if there is no autocorrelation in this series, the value 29 is not really dependent on any values before it i.e the values from cell 2 to cell 8.
But the question is how do we establish this?
Well, there is a technique for this.
Assume there are 10 data points, I take the data from Cell 1 to Cell 9, call this series X, now take the data from Cell 2 to Cell 10, call this Series Y. Now, calculate the correlation between Series X and Y. This is called 1-lag correlation. The correlation should be near to 0.
I can do this for 2 lag as well – i.e between Cell 1 to Cell 8, and then between Cell 3 to Cell 10, again, the correlation should be close to 0. If this is true, then it is safe to assume assumed that the series is not autocorrelated, and hence the 3rd condition for stationarity is proved.
I’ve calculated 2 lag correlation for Series A, and here is how it looks –
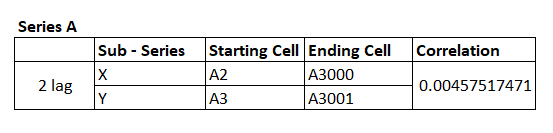
Remember, I’m subdividing Series A into two parts and creating two subseries i.e series X and series Y. The correlation is calculated on these two subseries. Clearly, the correlation is close to zero and with this, we can safely conclude that Time Series A is stationary.
Let’s do this for Series B as well.
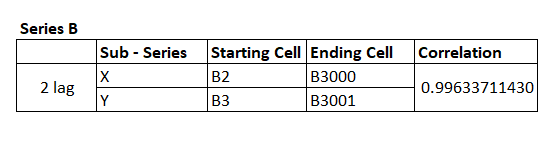
I’ve taken a similar approach, and the correlation as you can see is quite close to 1.
So, as you can see all the conditions for stationarity is met for Series A – which means the time series is stationary. While Series B is not.
I know that I’ve taken a rather unconventional approach to explaining stationarity and co-integration. After all, no statistical explanation is complete without those scary looking formulas. But this is a deliberate approach and I thought this would be the best possible way to discuss these topics, as eventually, our goal is to learn how to pair trade efficiently and not really deep dive into statistics.
Anyway, you could be thinking if it is really required for you to do all of the above to figure out if the time series (residuals) are indeed stationary. Well, like I said before, this is not required.
We only need to look at the results of something called as the ‘The ADF Test’, to establish if the time series is stationary or not.
11.3 – The ADF test
The augmented Dickey-Fuller or the ADF test is perhaps one of the best techniques to test for the stationarity of a time series. Remember, in our case, the time series in consideration is the residuals series.
Basically, the ADF test does everything that we discussed above, including a multiple lag process to check the autocorrelation within the series. Here is something you need to know – the output of the ADF test is not a definitive ‘Yes – this is a stationary series’ or ‘No – this is not a stationary series’. Rather, the output of the ADF test is a probability. It tells us the probability of the series, not being stationary.
For example, if the output of the ADF test a time series is 0.25, then this means the series has a 25% chance of not being stationary or in other words, there is a 75% chance of the series being stationary. This probability number is also called ‘The P value’.
To consider a time series stationary, the P value should be as low as 0.05 (5%) or lower. This essentially means the probability of the time series is stationary is as high as 95% (or higher).
Alright, so how do you run an ADF test?
Frankly, this is a highly complex process and unfortunately, I could not find a single source online which will help you run an ADF test for free. I do have an excel sheet (which has a paid plugin) to run an ADF test, but unfortunately, I cannot share it here. If I could, I would have.
If you are a programmer, I’ve been told that there are Python plugins easily available to run an ADF test, so you could try that.
But if you are a non-programmer like me, then you will be stuck at this stage. So here is what I will do, once in a weak or 15 days, I will try and upload a ‘Pair Data’ sheet, which will contain the following information of the best possible combination of pairs, this includes –
- You will know which stock is X and which stock is Y
- You will know the intercept and Beta of this combination
- You will also know the p-value of the combination
The look back period for generating this is 200 trading days. I’ve restricted this just to banking stocks, but hopefully, I can include more sectors going forward. To help you understand this better, here is the snapshot of the latest Pair Datasheet for banking stocks –
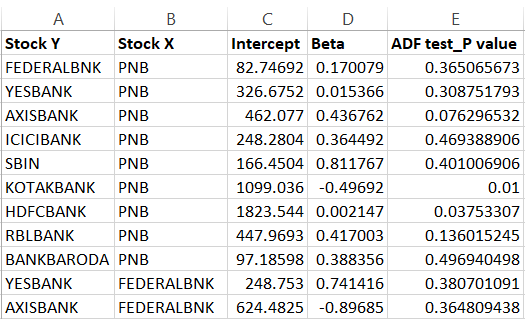
The first line suggests that Federal Bank as Y and PNB as X is a viable pair. This also means, that the regression of Federal as Y and PNB as X and Federal as X and PNB as Y was conducted and the error ratio for both the combination was calculated, and it was found that Federal as Y and PNB as X had the least error ratio.
Once the order has been figured out (as in which one is Y and which one is X), the intercept and Beta for the combination has also been calculated. Finally, the ADF was conducted and the P value was calculated. If you see, the P value for Federal Bank as Y and PNB as X is 0.365.
In other words, this is not a combination you should be dealing with as the probability of the residuals being stationary is only 63.5%.
In fact, if you look at the snapshot above, you will find only 2 pairs which have the desired p-value i.e Kotak and PNB with a P value of 0.01 and HDFC and PNB with a P value of 0.037.
The p values don’t usually change overnight. Hence, for this reason, I check for p-value once in 15 or 20 days and try and update them here.
I think we have learned quite a bit in this chapter. A lot of information discussed here could be new for most of the readers. For this reason, I will summarize all the things you should know about Pair trading at this point –
- The basic premise of pair trading
- Basic overview of linear regression and how to perform one
- In linear regression, we regress an independent variable, X against a dependent variable Y.
- When we regress – some of the outputs that are of interest are the intercept, slope, residuals, standard error, and the standard error of the intercept
- The decision to classify a stock as dependent and independent really depends on the error ratio.
- We calculate the error ratio by interchanging both X and Y. The one which offers the lowest error ratio will define which stock is X and which on as Y
- The residuals obtained from the regression should be stationary. If they are stationary, then we can conclude that the two stocks are co-integrated
- If the stocks are cointegrated, then they move together
- Stationarity of a series can be evaluated by running an ADF test.
If you are not clear on any of the points above, then I’d suggest you give this another shot and start reading from Chapter 7.
In the next chapter, we will try and take up an example of a pair trade and understand its dynamics.
You can download the Pair Data sheet, updated on 11th April 2018.
Lastly, this module (and this chapter, in particular) could not have been possible without the inputs from my good friend and an old partner, Prakash Lekkala. So I guess, we all need to thank him 🙂
Key takeaways from this chapter –
- If two stocks move together, then they are also cointegrated
- You can pair trade on stocks which are cointegrated
- If the residuals obtained from linear regression is stationary, then it implies the two stocks are co-integrated
- A time series is considered stationary if the series has a constant mean, constant standard deviation, and no autocorrelation
- The check for stationarity can be done by an ADF test
- The p-value of the ADF test should be 0.05% or lower for the series to be considered stationary.
Sir here beta should be calculated as =slope(known Y\’s=fedral, known X\’s=pnb) is this right?
Yes, have explained in the chapter.
thankyou sir for all the teachings ,couple of doubts
1. sir from where to get the clean stock data clear from earnings etc etc
2. do you sir still trade pair trading, basically i want to know for how long does a stratergy remain tradeable?
1) Please check Tijori Finance or Screener
2) No, none of the Zerodha Employees are allowed to trade 🙂
thankyou for the reply but
1) both are not providing price historical data
Not sure about this Sachin.
Hi Karthik,
I am working on this pairs trading system. Fully automated. Taking references from Ganapathy Vidyamurthy\’s book and some other papers. I hear feedback from some people that Pairs Trading or Statistical Arbitrage in general is not relevant today. Also, as a retail trader we don\’t get that edge in stat arb strategies because of big funds executing opportunities well before we even know them. What is your take on this?
I have a different view on that. In Pari trading, there is a bit of subjectivity involved. For instance, I can see or sense a relationship between ICICI and Biocon (giving a random example), which may otherwise seem non intuitive to others. I can validate this statistically as well, and if there is indeed a relationship, then could be a potential arbitrage opportunity.
What I mean is that the other forms of arbitrage, example – calendar spreads may be tough for retailers as the contours of such a trade is clearly defined by the trade parameters, and eventually it all boils down to who crunches the numbers pertaining to this trade fast. Speed matters, and retail has no edge here.
But in trades where subjectivity is involved, speed does not matter, the contours of the trade does.
hi sunil sir can you help me with the software
‘x’, ‘y’, p-value
‘DPWIRES’, ‘INDIAMART’,0.0000000000000000000005027272549413935
can anyone conform is this correct of just falls calculation. Also how many data point is sufficient to calculate p-value
\’x\’, \’y\’, p-value
\’DPWIRES\’, \’INDIAMART\’,5.027272549413935e-22
can anyone conform is the correct of just falls calculation. Also how many data point is sufficient to calculate p-value
Hello Kartik,
I wanted to express my appreciation for the valuable insights gained from the Linear Algebra topic. It has ignited my interest in statistical models, prompting me to inquire about the possibility of incorporating a financial engineering module into your future plans. I believe that introducing a quant module in Varsity would be highly beneficial.
Best regards,
Abhishek
Thanks for the kind words, Abhishek. We have thought about the quant model, but it gets a little tough for most of the audiance, but let me check anyway.
You are welcome Sir. I myself have taken so much from your content and personal experience. It\’s not everyday that one comes across content with quality that you have delivered so far. So really thank You and keep inspiring people. Also please test this strategy if you can.
Thanks, Sathish, I\’m happy to read that. Happy learning 🙂
Sir. I finally gave up on my search with excel plug in to do the ADF test and started learning R Studio just to work on this part. I would like to share something on what I did as a non programmer. Although I got a result, I couldn\’t verify whether the method was right. If you could test the below steps, I guess it would be useful.
Installing the Software:
– Google \’RStudio Desktop\’. Probably the first link is the right one. You will be directed to the download page which has 2 files – R and Rstudio. You need both the files for this to work and so go ahead and download. These are free.
– Install R followed by Rstudio. Now open the Rstudio application.
– Similar to how excel contains add ons to analyse certain things, even Rstudio has plenty of packages. We are interested in this package called \’tseries\’ which according my understanding is not inbuilt. So lets go ahead and install it. Installing this package seems easy.
– On the console page type install.packages(\”tseries\”) then press enter. And thats it. The system will automaticaly install this package. there is one more package called Urca which I guess is inbuilt, but found it more complicated to use.
Prepping the Excel file:
– After I got the residual values of the right pair with a low error ratio, I copied the residual data on a separate sheet(or even on a new file). I made sure that the sheet is clean. It only contains the label name(that is the stock name) followed by the residual data below it, which is around 200 data. Save this file.
Finding the p value using ADF Test:
– Open RStudio. On the right top box, there is a section called \’import datasheet\’. If you click it, it will give an option called \’From excel\”. Click it.
– Click \’Browse\’ on top and add the excel file we saved before. If you have saved on a particular sheet on the excel sheet, you can select that sheet in the \’import options\’ below and then press import. Your file is now imported into the software.
Typing the CODE:
These are some simple steps I did.
Assume our excel file name is \’Stationary test\’ and label name in the sheet for the data is \’HDFC Bank\’.
On the console section(left bottom window) type this,
> attach(Stationary test) Press Enter
> require(tseries) Press Enter
> adf.test(HDFC Bank) Press Enter
Thats it! You would get the lag order number as well as the p value.
Sir I felt that many of them who would read this module will get stuck up in the ADF chapter. So if that bridge is filled with information, anyone would utilize the information you had given irrespective of their knowledge on programming. So could you kindly test this procedure and let me know whether this method will yield the result.
Thanks
Thanks, Sathish. I hope this will help many reading this module. Really helpful and I\’m greatful for you doing this.
this is not working , after i type install.packages(”tseries”) its giving error if you can please mention any other method to calculate ADF if you have found one thankyou
Ah, not sure if I can help with this 🙂
But instead of futures in pair trading, can I initiate with something like a bull put spread and bear call spread of the 2 stocks of interest near ATM simultaneously?
Maybe you can, I\’ve not experimented with this though 🙂
Finally wanted to complete this module and found myself stuck at this stage due to ADF test. Unfortunately I do not know to code.
1. I don\’t mind doing the manual work. May I know which plug in you were referring to in the excel sheet?
2. In pair trading, it seems that there are no hedges. Doesn\’t it make this strategy a highly risky trade during unfortunate times?
Thanks
1) Sathish, this was a plugin was a paid plugin which no longer exists I guess
2) Yes, the hedge is not in the traditional sense, but its more statistical based. You can try hedge individual positions, but I\’ve not checked how the overall position behaves with these hedges.
Sir,
Amidst your busy schedule, it could be quite natural that you miss updating Pair Data sheet every fortnight. In that case, could you please suggest the most easiest way out to run the ADF test? I am not a very good programmer. Even abut the excel plug-in, could you kindly let know the name of the same or how we could subscribe, pricing details etc. if that is only commensurate with the guidelines/policy?
I\’m not sure, Anirban. I\’ve looked for it myself but haven\’t found any plugins. If you do, then pls share for the rest of the community as well 🙂
Sir,
What is the beta value that you tabulated? Is it the same good slope?
Yes, slope gives the beta.
Bonjour,
Congratulations ! Very enlighting explanations for stat dummies.
Since 2018 specialised trading stat
sites and blogs have flourished.
This following one offers a free bunch of stat measures including
correlation, factor regression analysis OLS and ADF test for
cointegration : https://www.portfoliovisualizer.com/asset-cointegration
Thank u again for yr cristal clear explanations.
On this matter profit is done after \”divergence\” on the start of \”convergence\”.
Unfortunately, there is very scarce litterature on the profit to be made on \”divergence\” (which, in theory, is the continuation of convergence after the mean crossing). I am looking for an indicator/algorithm to trade
on \”divergence\” as well.
Thank u again for yr cristal clear explanations.
By the way, don\’t u have in the bottom of your hood
any stat tools suggestions to improve
rotationnal systems such as TAA or AAA assets allocations.
These are trend systems, they are very complementary
to mean reversion pair trading.
Thanks, no unfortunately, there is stats tool available with us 🙂
well i used chat gpt to generate code to find out the p value and it worked pretty well
Sure 🙂
plz use E VIEWS for ADF test it\’s better
Hope that helps other.
I have to questions here
1)
On 21 Oct I checked and got one pair to trade with following parameters
x: YESBANK
y: AXISBANK
p value: 0.04906
std err: 2.9137
Today on 25th Oct same pair is no more valid pair! their residuals are simply non-stationary!
current p value is 0.1888 and std err has shot up to 3.05
2)
I have also noted that some pairs when I enter were showing std err of 2.75 and now today their std err has shot up to 3.96!
~4 SD away!!!
How do I deal in such cases? cause this data is I am getting EOD. There is no any other way to know what\’s happening and to put SL at 3 n exit
1) This is strange; the pairs dont decouple overnight, unless there is a heavy movement in either one of both stocks.
2) This is also unlikely unless there is heavy movement.
Umm.. sir looks this got a bit complicated here …
As a not programmer how do we actually calculate the Values of Intercept, Beta, ADF test
And are the banking stock randomly chosen???
Chetan, without programing, it will be difficult to implement this at large. You still can for few stocks, but cant cover the entire universe with it.
Thank you! Will check and post here
Sure. Take care!
So can I do this?
For index options, weekly expiries
I will note down Nifty\’s past returns in the period of 5 days- From Friday to Thursday (excluding weekends). So that I will know on which weekly expiry series how much nifty moved. So basically what I will get is say nifty moved +2.86% for 3 March weekly expiry also -0.66% for 24 Feb weekly expiry so on and so forth.
I will do this for past 3 months. Then I will have Nifty\’s returns for 5 days before expiry and I will check stationarity of these returns. If returns turns out to be stationary then it means I can apply statistical concepts on it.
If the returns are stationary the I will decide 1,2,3 SD levels and respectively downside levels. If 2 SD level is say 4.5% then I can say there is only 5% chance that nifty will go beyond 4.5% in current expiry. and I will keep updating the same for each expiry so that I will have more data points.
Will this work or not in real markets is another question (That will be confirmed only through backtesting and deployment). I want to know is it correct way to think like this? I mean what I am doing, does that makes sense?
It all makes sense, only after you backtest. Until then your guess is as good as mine 🙂
I know how hard it can be for you to take a look on this article due to your busy schedule but I request you to please have a look at it whenever you are a bit free.
I just want to know can I use same procedure to calculate ADF results using python? Is that enough or do I have to add anything else? ADF test is at end of the article
Here\’s link for the same: https://machinelearningmastery.com/time-series-data-stationary-python/
I\’ll try and take a look. But I guess there were a few who dropped few links in the comments regarding the same.
Hello! Thank you for your good article. I could roughly understand the pair trading logic, but I got question.
You mentioned about normal distribution in previous chapter. My understanding is that ADF test is for testify two stocks are stationary or not. In short, it is not testing two stocks are normal distribution or not.
My question is, should we testify and pick up the pair of stocks from normal distribution category?
Thats right, ADF is a stationarity test. But the two stocks will be stationary if they are normally distributed.
Hi karthik ,
Is there any way to calculate the ADF Test in Excel??
If not, then how to calculate the ADF test .. Is der any way to calculate??
You can, I think someone had posted a solution/plugin that you can use for free. Its in the comment section, can you please check?
Hi,
if there are two series, then there must be two adftest values. But you are showing only one adftest value. why is it so?
We are running the ADF on residuals right?
So basically what I have been doing is – running the add test to find cointegration between two stocks and after that using Density Curve with real time data to find trades. The density curve value is changing to a great extent when I am changing the time period. So for t=100 and for t=200 I am getting density curve values as varied as 0.05 and 0.23 respectively. In one I am close to initiating a trade whereas the other one doesn\’t give any signal. Hence I wanted to know what is the ideal time period that needs to be considered for pair trading calculation? I have read quite a few blogs online.. some have considered 2 years data while others have considered only 1 year. There is no uniformity or logical explanation for selecting the given time period. Can you please try and recall and throw some light on this ?
Hi.. have learnt a lot from Varsity.. thank you for the amazing write-up.. I have been trying out Pairs Trading recently and have learned to perform the adf-test on R even though I am not a programmer.. I have one query – how did you decide on the lookback period of 200 days? Why not 100 days or 1 year or 2 years?
I dont exactly recall why, Nishita. This also implies that 200 or 252, should not really matter.
Thank you so much for everything Karthik Sir!! you always inspire student like us.
Happy learning 🙂
It took me almost 6 months to learn programming and calculate many such statistical tests like ADF, least squared or any regression models.
can\’t thank you enough Karthik sir for inspiring students like us.
I will always be grateful to you and the varsity!!
ex: few lines of code and ADF test done on Nifty 100 stocks.
adf_result = pd.DataFrame()
for symbol in nifty100:
adf_data = yf.download(symbol,start1,end1)
adf = adfuller(adf_data[\’Close\’],maxlag=1)
result = pd.DataFrame({\’Stock\’:symbol,\’ADF\’:adf[0],\’PVALUE\’:adf[1]},index=[0])
adf_result = adf_result.append(result,ignore_index=True)
critical_value = (adf_result[\’ADF\’]< -2.862)
stationary_stock = adf_result.loc[critical_value,'Stock']
['YESBANK.NS', 'RELIANCE.NS']
Less than 10 seconds and ADF test on 100 stocks are done.
Amazing, Anil! I wish I could something like this myself. You are inspiring me 🙂
Kartik sir, first I have to thank you for making this extraordinary presentation.
I have doubt sir, you said that 2 lag will be between Cell 1 to Cell 8, and then between Cell 3 to Cell 10, again, the correlation should be close to 0. But you calculate 2 lag for series A from A2 to A3000 and A3 to 3001 how sir ? and you said that you divide the series A into two parts then the 2 lag will be from cell A2 to A4499 and A5 to A4501. Is it right sir ? Or please explain auto correlation concept once again sir. Waiting for your reply sir!
Thank you
Hi Karthik,
Please refer some good book(s) on trading systems that can cover multivariate regression and further enhance the knowledge.
If feasible then please extend your suggestion towards the books that an investor or trader must read.
Unfortunately, I\’m not sure about books which cover this topic, Rahul.
Hi Karthik,
Thank you for the amazing content in this module. Learning statistics has never felt so useful 🙂 I wanted to check, the last time you had updated the P values was in April 2018- Do you still upload them periodically somewhere? as you had mentioned you would but it has been almost 3 years hence asking.
Not really, Bhavya. It was not possible for me to do that on a daily basis, hence stopped 🙂
Thanks Karthik
Hi Karthik,
Thanks for sharing the write up. I have some query about adf test. I know there is a plug in available in python to run the test. Just to know whether do we run the test on both the residuals of stock individually for checking its cointegratuon or only for just the single equation residual we have selected for trading as per lower error ratio. Please suggest.
Just the single equation residual is good enough, Chetan.
Dear Kartik Sir,
First of all I would like to Thank you for being an amazing teacher. I had been learning about trading/investing skills through your module since sep\’2020. Starting from basic module to the current one Trading system. I really appreciate your way of explanation. Also, would like to show my gratitude towards the team of the Zerodha and specially the ones who had been supporting you to present such modules in front of all of us, as the way they are. I don\’t have any mentor but at this point I could gladly say that at least I have my silent mentor (Karthik Rangappa). I could go on and on and may be zerodha team gets bored reading it. Baaki Sir, some questions related to Trading system I have would like to ask in any other comment. This message is just just for the mentor and Zerodha team.
Thanks so much for letting us know, Rahul. Messages like these make us happy and keep us motivated to keep going 🙂
Hi Sir,
You explained autocorrelation with Lag1 n Lag2. But in the example for 2 lag :
In X series it’s mentioned A2 – A3000
In Y series it’s mentioned A3 – A3001, but since it’s 2 lag so shouldn’t it be :
A4 – A3002 .
Is this a typo error or there is any logic .
2) Min Data for stationarity check is 496 in PT.
3) Supposing the combination which has less Error ration is not stationary n the combination which has high Error ration is showing stationary . So can we take this PT
Or we won’t.
Many thanks for being such a terrific teacher, Karthick! Are there any online resources which provide ADF for pair trading in India? Any plans to introduce this feature in Zerodha or its associated platforms?
Thanks, Amit!
I\’m not sure, but I think some of the readers have put up few free resources for ADF test. Guess you can use that.
How will I proceed with pair trading without adf p value data? its there an alternative to find it and if not how to find i cant find any solution . please help.
Not that I know about 🙂
Hi Karthik,
Do we check if both the series are stationary i.e., P value for both is ~0.95 (or) one of the series being stationary satisfies the the condition for co-integration?
Thanks
YOu need to look at both, as explained in the chapter.
Sir as you said in previous comment we can do adf test by using three steps
In the chapter you took X and Y as example
In reality there will be Stock A and Stock B
Should both validate these condition
1. Mean
Sd
Auto correlation
Can we function this test in excel? Or Is there any paid plugin
Thank you 😊
I guess there are plugins, many folks have shared links in comments, not sure which chapter though 🙂
Sir, i am saying,
You have taught in this chapter that \”A time series is considered stationary if it follows 3 statistical conditions:-
1. Mean should be same or within the range
2. Standard daviation should me within the range
3. No autocorrelation
So, i don\’t know how to do ADF test. Can i follow these rules or conditions to indentify, if the residuals are stationary or not???
Thank you!!😇
Yes, you can Tushar 🙂
First of all, a very very thanks for all.
Sir, I wanna ask,
\”Can i find two time series data stationary or not by using that 3 simple statistical conditions that you have told in this chap while talking about stationary and non-stationary series?\”
Thanks!
Sorry, I didn\’t fully understand your query, can you please elaborate with an example? Thanks.
Sir will u send pair data of current date
Hi sir,
If Correlation (In whistler\’s method/PTM1) also describes how two time series move together or degree of their cointegration/stationarity., Then why we again used different method to find stationarity?
I mean, correlation also tells us about stationarity. Isnt it, sir?
Plz clarify .
Tango, Correlation assumes a stationary time series. For stationary series, it tells if they are moving together. Cointegration doesn\’t assume that, it can tell if 2 series are moving together even if they are not stationary.
Sure sir, will do. Thanks for your response.
Good luck!
Dear @Karthik Rangappa sir,
Thanks for your great service in making this easy for us. Just one doubt, I have a pair whose correlation is 0.45 only but the cointegration is 0.02 only. Please let me know if I can use this pair?
Ah, I\’m not sure if this useable. Can you check how many signals were generated over the last few months and how many worked? A basic back test will help you determine this.
Sir, can you please help with the look-back period for rolling ADF test? Also can you please help with how to set the stop-loss because while bactesting some losses show a large percentage which increases the drawdown of the system.
Look back period is usually about 1 year. SL is best set when you calibrate it. Meaning, for a few pairs, 2 SD is good, for some it could be 1.5 SD. So make sure you calibrate it as per the pair.
Have cross-checked with 2-3 stocks.
check with HDFC and RBL.
Intercept, sigma, correlation & Residual all remains the same only p-value changes. when I change date format from old to new and then new to old.
thank you.
Sure, but I\’m not sure why 🙂
I will follow the same, sir.
Is there any particular reason or logic ? just for understanding.
having been disturbing you a lot, even on Sunday.
shameful of me.
When doing ADF test, always pass oldest data point 1st and newest last. But what you\’ve pointed out should not happen, need to study if it can happen, feels like it shouldn\’t but not sure though.
Hi,
Need to understand this sir, for example, if I conduct ADF test using stock data in newest to oldest format , in terms of date.
p-value is 0.215 and if I change the stock data to oldest to newest format then p-value is 0.02.
Example : stock data, date from 04-09-2020 to 04-09-2019 then p-value is 0.215 and from 04-09-2019 to 04-09-2020 then p- value is 0.02.
what format should I consider newest first?
Thank you.
Anil, I\’d suggest you look at Oldest to Newest.
Really Sorry…
Forgot to Wish you …..
Happy Teacher\’s Day … Karthik Sir!!!
Thank You for all the learnings!!
Hahah, no issues. Thanks anyway, Anil 🙂
Thank you so much for your kind word sir.
Learning a lot and making a lot through Varsity.
Happy learning!
Great, will wait for your reply.
I think its a good one Anil, especially if you are not comfortable with programming. Thanks for sharing.
Dear Karthik,
https://help.xlstat.com/s/article/unit-root-dickey-fuller-and-stationarity-tests-on-time-series?language=en
Find the attached link for ADF and other Plugin .
It does provide a free 14 days trial with more than 240 such tools.
They also provide tutorial and examples for better understanding.
It saves time with little cost.
Karthik sir, is this useful?
Yeah, looks like this does this job. Let me take another opinion and get back on this.
This is HDFC and ICICI example with all outputs which we needed for Pair Trade.
https://drive.google.com/file/d/1CLuqnzx6vDG9-5ool38J4HnKWwloAV7R/view?usp=sharing
Hello,
Please Find attached Link, here we can calculate ADF and many other stats equation in no time.
Also, Excel plugin is available.
https://drive.google.com/file/d/1B2NkLo6PaaJhJzcH7GQKGZqmTIcu2TSc/view?usp=sharing
Ah, I think you need to make the link public 🙂
I will try to do that
Thanks, and good luck, Anil!
That\’s the idea sir, but before that, if you can review it.
The process is long but simple, you can definitely add this as in chapter for the benefit of all.
Unable to post the screenshot here.
can I post you on Whatsapp or email?
9892622226
Thank you for sharing great learning with us
Can you try uploading on G drive?
Dear Karthik,
After 3 days of research, I have found excel plug-ins not only for ADF but also for Linear regression and many other tools for Data analysis.
This comes with a standard tutorial, which will help us all how to use these plug-ins.
Have crossed with HDFC&ICICI data sheet provided by you.
The only problem is difficult to cut-copy and paste here or explain.
Let me know if we can connect on-call or screen sharing.
This can be a good help for all. Have gone through all the comments and link which others have posted. Trust me this looks simple.
Thank You,
Possible to share the excel plugin details for the benefit of others?
Hello karthik
1) as u mentioned p value which is output of adf test,there is a p value mentioned in regression statistics .is this same p value or is it different.
2)the manual algorithm mentioned to chk whether the time series considered is stationary or not has to be carried out on residuals in regression statistics.if yes to find mean same series has to subdivided in 3 series and mean and std deviation to be calculated .and to calculate autocorrelation the same residual series to be subdivided in two series .i m bit confused in this part.would you kindly clear whether my interpretation is correct.
1) P value in regression tells how good the regression is, p value in ADF test tells if the residual is stationary
2) YEs, thats correct.
Hey there, Karthik!
Excellent work!!! But a small doubt. Can you please tell me what is beta?
Chay, do check this chapter, we have discussed Beta – https://zerodha.com/varsity/chapter/hedging-futures/
Thank you to Karthik Rangappa & Prakash Lekkala for such a great module and in fact thank you so much for all the modules in Varsity. A small doubt:
Is there a specific reason for dividing the residual time series in three parts to calculate mean & Standard deviation for finding stationarity, I think it would give better results if the divisions are increased to 5 or 6, or is it just an optimal number depending on the number of entries.
Where
Yes.. How to get it sir
In final sheet of pair trading , there is calculation of ADF test , Beta value and sigma,,,?? how to calcuate the beta value???
You get beta when you run the regression itself right?
how to calculate beta in final pair trade sheet?? i have seen in the regression sheet also ?? but i could not find the beta value??
What do you mean by final beta?
Karthik,
Have u used thsi technique?? wat was the result???
I have traded this for couple of years, hence this module 🙂
Results were decent, but I broke my own SL rules and face a capital erosion. It is all good as long as you have your plan in place and stick to it.
Hey karthik,
Thanks so much for the wonderful technique.
i have stucked with ADF test value??? Please help
Veena, I think some of the readers have posted solutions for this. Request you to kindly look through this.
Hey Karthik. You\’ve done a great work. Being an economics udergrad, i didn\’t know much about the applications of the statistics terms i come across everyday. I always thought they\’re just mere formulas. Honestly, i liked how you used all the statistics jargons we study about. Thanks for this module.
Hey, thanks so much for the kinds words! I\’m glad you are enjoying the content here! Happy reading 🙂
i will do that , however if i may suggest you should have a disclaimer at the begining of the chapter , so that we can be prepared .
After 4 days of work and learning all the tough regression and reseduals it leaves you here .
I will surely look for ADF tests outside and in the comments .
Cheers
I understand and you do have point. The only reason for not having is people would be discouraged to read, for example, you may have not read and which you make have not taken the efforts to figure ADF.
Hi Karthik …
Great things i have learned in this ..
ADF is looking like not for the novices or new learners ..
Now to run the ADF test , unless we know how to run it … the whole section on Pair Trading looks cloudy …
Can you guide us how and where to take the excel plugin and then how to run this test .
Without the ability to run the ADF test , how does this whole section help us .. ?
I agree with you on that Aman. There are few portals which give you ADF test, I think few have left behind the link to this source. Request you to run through the comments.
hai sir pls update adf test value sir its so difficult to find out which is less than 0.050 sir
Not sure if that can be done, will give it a try.
HAI SIR ACCORDING TO ADF TEST TATA MOTOR VS TATA DVR FOR ONE YEAR DATA SAMPLES THE ADF VALUE (P VALUE ) IS 0.733 .
MY assumption WAS 0.73% IT WILL NOT BE IN STATIONERY AND 37 % I WILL BE IN STATIONERY IS IT RIGHT SIR . ?
Jaya, I\’m not sure if you can directly correlate this to a probability. I need to double check this.
Hello sir,
Why are we restricting ourselves to 200 days? or How did we arrive at 200?
Can this be translated to 200 data points of any time unit?
Example – Close prices of last 200 minutes or hours.
Thank you.
200 – 252 of EOD data, is roughly 1 year of data points.
Sir,
When I am running algo myself, I observed some interesting facts – Number of data samples is drastic effect on p-value for given pair and also r2_score which predict how much model is accurate is changing with sample size.
So can you elaborate on how much past data we have to feed for better outcome ?
And u suggest lag value in ADF test should be cube root of data size- so can u please tell logic behind it ?
Ps : U deserve tons of credit for Varsity
Thankfully, I\’ve completed CFA L2 so this chapter flew was like a breeze to me.
Regarding the DF Test, don\’t we first need to check whether the equation has a unit root or not? Checking for unit root is fairly simple. We regress the change of X on the lagged value of X(X2 – X1) and check the DF t- table and hope that the hypothesis is rejected.
I really could have explained it better but it requires a longer explanation, much notation based . So not sure how to do it here.
Umer, isn\’t that what the ADF test does?
Hi Karthik,
The conditions for adf test when you run with \”constant and no trend\” and \” No constant and no trend\” returns different number of pairs and there is varied difference in calculating standard error for today.
Constant and no trend returns less number of pairs compared to No constant and no trend.
Which one you feel is the right setup for the adf test.
Thanks
Sunil, my research points to no constant and no trend as the right way.
so you recommend to run regression every day with eod close price??
and Thank for the reply karthik,
I would.
Hi Karthik,
How often do we check the Residuals. Do we do it everyday with EOD data or one in 3 to 4 days would suffice.
When am comparing latest Residual value with the Std Error (the ratio ) on daily basis using linear regression in excel do I take residual of Observation 1?
Based on experience, If am running manual tests in excel for finding P-value of adf value, How often will this adf value persist for that pair and when do i recheck it again?
Thanks
It largely remains the same if the latest prices don\’t change drastically or the oldest data which is going out of the time series is a large value. By the way, it is worth taking a look at the residuals whenever you run the regression.
one more question. Sir, is it always less than 0.05 of ADF value be considered good trade? What if ADF value is 0.1?
Again, its best if you custom fit this to each pair.
Dear Karthik,
What should be minimum value of ADF test, if all parameters are ok. I have seen that ADF with less than .01 is tricky because at this point both stocks do same direction with almost same percentage every day. What do you think? Please reply me
The answer to this depends on each pair. I\’ve found that its hard to assign 1 value and stick to it. Perhaps, it makes sense to evaluate which ADF value works for the given pair. A simple backtesting should help you here.
Dear Karthik,
Pl refer to Dated 14 Dec 2018 11.11 am in which you answered about the parameter of ADF test asked by someone that the parameter should be constant and no trend. It has created my confusion because I asked the same question some days back which you answered me the parameter should be no constant and no trend which is contradiction. Pl tell me actual answer what should be the parameter?
Rohit – no trend, no constant for pair trading.
please can anybody help me where I will find ADF test. I have tried ADF trst of different sites recommended by above esteemed readers but none of them is understood or unable to find it . Pl help me. If it is paid even then tell me. Anybody give me proper ADF test will be highly appreciated
Dear Karthik,
I have opened the site recommended by Himanshu but I don\’t understand how to use it. And he asked you to review it. Is ADF test mentioned by Himanshu reliable? Please help me.
I\’ve to review it Rohit, will try and do that sometime soon.
Dear Karthik,
If you don\’t know how to use ADF test then what is the use of writing articles regarding ADF test for the readers. As I have checked many sites to find the ADF test but none of them explained how to use it. Please help me.
Rohit, Have you read through the chapter? I\’ve explained how to use the ADF test but I\’ve not really shared a tool to do the ADF test as most of these are paid tools. But I think Himanshu was kind enough to share a free resource to run the ADF test (see the comment above).
@Karthik…Found a free addin for conducting ADF test (we need to install the addin to Excel). If possible, kindly review it once, since I dont have a paid tool and cant verify the result.
http://www.real-statistics.com/time-series-analysis/autoregressive-processes/augmented-dickey-fuller-test/
Hey, thanks Himansu. Will review and let you know. Thanks.
Hello,
The P value in the regression process output is same as the one we get after ADF test.If yes then there are two rows that indicates P value.which one to consider?
THANKS
No, the ADF is a test for stationarity of the residual series.
Hi Karthik,
I could not understand what you meant by Beta here.
As mentioned above in your comments, I also could not find anything in this chapter with respect to Beta:
\” https://zerodha.com/varsity/chapter/linear-regression/\”
With Beta do you mean the Slope of the Straight Line Equation ?
Kulbir
Yes, by beta, I mean the slope of a straight line. I\’d suggest you read this chapter to understand beta better – https://zerodha.com/varsity/chapter/hedging-futures/
This is the latest result. Excluding all the combination where the time series is not stationary.
If anyone can confirm this p-value looks correct then it will be very helpful.
+———+————+———–+————+———+——————+—————————-+———————–+——————————–+
| Y-Stock | X-Stock | Intercept | Slope/Beta | p-Value | Today\’s residual | Sigma/Std Err of Residuals | Std Err-DecisionMaker | Is the time series stationary? |
+———+————+———–+————+———+——————+—————————-+———————–+——————————–+
| MARUTI | TATAMTRDVR | 4107.6928 | 32.5515 | 0.0426 | -264.8458 | 444.2069 | -0.5962 | True |
+———+————+———–+————+———+——————+—————————-+———————–+——————————–+
+———–+———+———–+————+———+——————+—————————-+———————–+——————————–+
| Y-Stock | X-Stock | Intercept | Slope/Beta | p-Value | Today\’s residual | Sigma/Std Err of Residuals | Std Err-DecisionMaker | Is the time series stationary? |
+———–+———+———–+————+———+——————+—————————-+———————–+——————————–+
| SYNDIBANK | ALBK | 21.8551 | 0.3551 | 0.0263 | 1.0936 | 3.6487 | 0.2997 | True |
+———–+———+———–+————+———+——————+—————————-+———————–+——————————–+
+———–+———+———–+————+———+——————+—————————-+———————–+——————————–+
| Y-Stock | X-Stock | Intercept | Slope/Beta | p-Value | Today\’s residual | Sigma/Std Err of Residuals | Std Err-DecisionMaker | Is the time series stationary? |
+———–+———+———–+————+———+——————+—————————-+———————–+——————————–+
| UNIONBANK | ALBK | 39.9479 | 0.9308 | 0.0328 | 3.8069 | 6.6037 | 0.5765 | True |
+———–+———+———–+————+———+——————+—————————-+———————–+——————————–+
+———–+————+———–+————+———+——————+—————————-+———————–+——————————–+
| Y-Stock | X-Stock | Intercept | Slope/Beta | p-Value | Today\’s residual | Sigma/Std Err of Residuals | Std Err-DecisionMaker | Is the time series stationary? |
+———–+————+———–+————+———+——————+—————————-+———————–+——————————–+
| SYNDIBANK | BANKBARODA | 14.0244 | 0.1977 | 0.0054 | 1.6022 | 2.7753 | 0.5773 | True |
+———–+————+———–+————+———+——————+—————————-+———————–+——————————–+
+———+———+———–+————+———+——————+—————————-+———————–+——————————–+
| Y-Stock | X-Stock | Intercept | Slope/Beta | p-Value | Today\’s residual | Sigma/Std Err of Residuals | Std Err-DecisionMaker | Is the time series stationary? |
+———+———+———–+————+———+——————+—————————-+———————–+——————————–+
| SBIN | CANBK | 108.0908 | 0.6893 | 0.0436 | 15.0078 | 8.893 | 1.6876 | True |
+———+———+———–+————+———+——————+—————————-+———————–+——————————–+
+———+———–+———–+————+———+——————+—————————-+———————–+——————————–+
| Y-Stock | X-Stock | Intercept | Slope/Beta | p-Value | Today\’s residual | Sigma/Std Err of Residuals | Std Err-DecisionMaker | Is the time series stationary? |
+———+———–+———–+————+———+——————+—————————-+———————–+——————————–+
| CANBK | UNIONBANK | 54.7387 | 2.4862 | 0.0067 | -4.7415 | 8.8502 | -0.5358 | True |
+———+———–+———–+————+———+——————+—————————-+———————–+——————————–+
+———+———–+———–+————+———+——————+—————————-+———————–+——————————–+
| Y-Stock | X-Stock | Intercept | Slope/Beta | p-Value | Today\’s residual | Sigma/Std Err of Residuals | Std Err-DecisionMaker | Is the time series stationary? |
+———+———–+———–+————+———+——————+—————————-+———————–+——————————–+
| SBIN | UNIONBANK | 141.8861 | 1.7622 | 0.0495 | 11.2014 | 10.249 | 1.0929 | True |
+———+———–+———–+————+———+——————+—————————-+———————–+——————————–+
+————+———+———–+————+———+——————+—————————-+———————–+——————————–+
| Y-Stock | X-Stock | Intercept | Slope/Beta | p-Value | Today\’s residual | Sigma/Std Err of Residuals | Std Err-DecisionMaker | Is the time series stationary? |
+————+———+———–+————+———+——————+—————————-+———————–+——————————–+
| INDUSINDBK | YESBANK | 1096.8594 | 2.3158 | 0.0185 | 105.3708 | 75.3098 | 1.3992 | True |
+————+———+———–+————+———+——————+—————————-+———————–+——————————–+
+———–+———+———–+————+———+——————+—————————-+———————–+——————————–+
| Y-Stock | X-Stock | Intercept | Slope/Beta | p-Value | Today\’s residual | Sigma/Std Err of Residuals | Std Err-DecisionMaker | Is the time series stationary? |
+———–+———+———–+————+———+——————+—————————-+———————–+——————————–+
| SOUTHBANK | YESBANK | 9.1192 | 0.0277 | 0.0194 | 1.1547 | 1.7954 | 0.6432 | True |
+———–+———+———–+————+———+——————+—————————-+———————–+——————————–+
This appears right for me, Ashok. Do compare the results with the sample set.
Sir, thanks again….is the adf test done on the residuals?
Yup, that\’s right Ashok.
Thank you very much sir….
Good luck!
I have been trading all types of trading i.e. futures, options and equity spotfor last ten years. But I am not been able to make profit consistently and ultimatly lost. I have knowledge of charts and tried different syatems but not successful. So therefore give me suggestions which method I should trade. I know trading is not holy grail but profit can be made consistently from trading. I am interested in short term trading not long term. Pl give me suggestions.
Well, Rohit, how can I tell you that? In fact, how can anyone tell you that? You need to keep exploring and tweaking your methods until you get consistent and profitable.
Thanks for response. How will I do to successfully trade? Which type of trade option or futures or pair trading?
If you are a complete newbie, I\’d suggest you try with paper trading, then few shares in equity spot before transitioning to F&O.
I have the account of Zerodha. You mentioned that you will upload pair data sheet once in a week or 15 days. But I do not find this anywhere. Pl help me to find this so that I could be able to tradenbased on better p-value.
Rohit, somehow this does not seem to work. Tried for the initial few days. Btw, some of the readers were kind enough to provide free code, maybe you should try using that.
Dear Karthik,
Thanks for the response. As you grow hoping to learn more of the education trickling down to us similar to zerodha varsity. Shall surely mail you the details along with the data file for your perusal.
Regards,
Vijay
Sure, Vijay. Good luck to you.
Dear Karthik,
Congratulations on being the biggest stock brokerage firm in india and also the fastest to reach to the top. Was wondering if you had a chance to ponder on my query posted earlier.
Regards,
Vijay
Thanks, Vijay. Hope to learn and grow from here 🙂
Apologies for not posting a reply earlier. Can you please share the technique of how you did the ADF test and also the test result file? Maybe you can mail that across to [email protected], addressing me. Thanks.
Dear Karthik,
Thanks for your acknowledgement, shall look forward to the response at your convenience.
Regards,
Vijay
I have this on mind, will get back as soon as possible, Vijay. Thanks.
Dear Karthik,
Requesting your views on my earlier query ( 17th decemeber) on adf test scores about stationarity at levels and 1st levels please ?
Regards,
Vijay
Vijay, apologies for missing this query. This needs a slightly lengthy reply. I will try and draft one by weekend. Thanks.
There are many type of trading systems.
1. News based
2. Single Candle stick patterns like engulfing candle, dozis etc
Or patterns like double ot tripple tops and bottoms, head and shoulders, cup and handle etc
3. Combining Indicators like rsi, macd. Super trend, bollinger bands lab lab lab
4. Moving average cross overs
5. Trend following using S and R
6. Treand reversal or bottom fishing
7. Based on open interest and price relationship
8. Pair trading
9. Swing trade or intraday
10. Option trad
11. Just by watching price action
Many more…
Which is your favourite? Mean to say, in which you could able to generate more consistent profits
I\’ve had varied success across these strategies. I prefer 4,5,8, and 10 🙂
Dear Karthik,
Thanks for all the enlightening on financial modelling for pair trades. Few questions on the data for Hero motocorp and bajaj-auto i am trying to check for possible pair trade scenario for both companies with data count of 246 days for past 356 days till 14th december 2018.
-Having run the adf test in excel, with condition of constant only for unit root at levels got an adf score p value or prob of 0.153961 higher than 0.01
– Having run the same test with test for unit root in first difference the adf result was positive for stationarity withp values or prob values of 0.000000.
how should this be treated as there is stationarity at first difference while no stationarity at levels. should the adf data be considered only at levels and differences (1st, 2nd) ignored?
kindly advise,
Regards,
Vijay
Thanks for the reply Karthik.
For any pair why we regress two times first X as independent and Y as dependent and then vice versa for the same pair. How does this helps?
Regards
Deepu
This is to figure out the best possible combination of X and Y (dependent and independent). Guess I have explained this in detail earlier in the chapter.
Hi Karthik,
What\’s is the purpose of doing the exercise of identifying X and Y and how it helps in trading the pair?
As depending on deviation we decide which one to buy and sell.
Please advise.
Thanks
Deepu
We need them to value one stock versus the other. Remember, at the core of the strategy is linear regression where we try and explain the price of stock y (dependent) by using the price of stock x (independent).
Dear Karthik,
ADF output largely depends on 3 conditions of ADF test:
1. no constant & trend
2. constant & no trend
3. constant as well as trend
which condition shall we select…as all 3 conditions give diff value for \”p\” as all have diff critical values.
Constant and no trend, but I\’ll get back to you on this.
2 more queries Karthik,
1. running a script downloads dats for spot price but we r interested in futures. Analysis done on spot but trade to be taken on futures..is this wht we gonna do?
2. trade has to be initiated ONLY when Zscore touches nearly +2.5/-2.5 or it can also be initiated when it touches 2.6, 2.7 or 2.8?
1) Yup, remember its not about absolute price levels.
2) Any level that you think is fair. I usually prefer a z-score closer to 3.
what will be the target & stoploss in case of z-score of 3?
als, did u check with \”constant & no trend\” as askes earlier?
At z-score of 3, you\’d initiate the trade with probably 3.1 as the SL (remember, usually 3 itself is the SL). The target will be closer to the mean.
Hi Karthik,
Quick question -suppose the p value was around .30 three months back and now it is around. 05 for any pair than is it tradeable?
Any guidance on the p value? Do we need to see only the current p value or the historical ones too.
What\’s is the reason for such scenario happening in any pair?
Thanks in advance.
Deeo
Its good to see the historical P value, but I\’d pay more attention to the current value. The reason could be a drastic variation in prices.
Dear Karthik,
As informed by someone, R studio with urca package is excellent tool for ADF test. there is very simple programme to be written (credit youtube). I guess u must share this solution with other viewers of varsiry as it wil be of great help to all of them. Instead of leaving the users at the end with the statemnet that they will be stuck at ADF test, it is better to feed them with this solution. It will be an added cause to your already running great cause.
Needless to say, thanx for this lovely module on pair trading, It was thrilling.
You do have a point, Arun. Have you used this? If yes, would you mind sharing it with others?
I have used it but results I have not verified yet. I request you to pls run and verify on your pair data sheet, if possible. I m sharing a youtube link which will work for everyone.
https://m.youtube.com/watch?v=mkHtP0nONJY
R studio is open source software. easy to download and install for free.
sincere request to u Karthik that pls verify the results and let us know if it is useful. Thnx in advance.
Will do, Arun. Thanks.
Dear Karthik,
Have you tested it?
Regards,
Swapnil.
Yes, I\’ve traded this strategy quite a bit 🙂
Thank you very much Karthik for your efforts.
Can you please help me with the outputs?
If possible please give an example on how to use this output.
Regards,
Swapnil
Swapnil, this is kind of stuck. I\’ll try and put this up. By the way, did you check out the code one of the readers put up here?
Python Code Link – ideone.com/z3Xg6M
Sample Output – https://image.ibb.co/bCPp79/Output.png
Just feed any number of data points to it and get your output within fraction of a second 😉
Hey, this is interesting. Will check this out 🙂
Dear Karthik,
I found one free excel add-in for ADF test. I have tested it but don\’t know how useful the output is.
Can u please test it once, Just want to know it is the same we are looking for free ADF test.
To download click on below link.
http://www.web-reg.de/adf_addin.html#
Really appreciate your support.
Will try and check this by the weekend, Swapnil. Thanks.
Dear Karthik,
Any update on Excel plug in.
Swapnil, unfortunately, no. But I\’d suggest you look at the comments, one of the readers has been kind enough to publish a free algo.
But Karthik I don\’t know how to use python. Excel adf plug in will not take much of your time. Please help me, from last 2 months I stuck on adf test. And finally find a Excel plug in just run it once.
Please.
Sure, Swapnil, will try and do that.
Hey Karthik,
Won\’t the P-values outputted by the regression function in the \’Analysis ToolPak\’ add-in in Excel suffice for our purposes?
Hmm, not really cause we are looking at the stationarity of the residuals.
Sir
how to calculate beta in final pair trade sheet
The beta is included in the regression output, have explained how to run a regression here – https://zerodha.com/varsity/chapter/linear-regression/
Hi Karthik,
Really thankful for all your efforts. I am learning loads from it.
I am trying to reproduce all the steps which you mentioned in this blog. I have downloaded the excel sheet in which you have provided HDFC Bank and ICICI Bank data from 4th Dec 2015 until 4th Dec 2017. I have calculated slope, intercept, Standard Error and Standard Error of Intercept and finally the Error Ratio.
To calculate P value on time series data of residuals, I have used R language. There is a function adf.test() which executes ADF test on the given data. However, when I run the test, I receive the data as follows:
P value for residual of ICICI bank(Y) = 0.03729
P value for residual of HDFC bank(Y) = 0.08545
However, in your post, as you mentioned other results e.g. slope, intercept, Standard Error and Standard Error of Intercept and finally the Error Ratio, I could compare them to verify if the calculations that I am running are correct or not.
Can you please run the test on the same data and please confirm if the P values which I have received are correct or not? For reference, I run adf.test(c(The time series residual data here….)) function. Without passing any other arguments to this function. There are arguments by which Lag parameter can be defined. But I was not sure about that so ran the function with default arguments. Can you or someone from your team confirm if values which I have received are correct or not? If not then how exactly are they using R to get P values?
Thanks and regards,
Pratik
Pratik, can you download the pair data sheet here – https://zerodha.com/varsity/chapter/live-example-2/, I think this is for 12th June 2018. Compare your results with other pairs as well besides HDFC Bank and ICICI.
I got the latest excel sheet on 12th Jun 2018. Thanks for your pointer. Can you please clarify the From and To date of the data used for calculation of this sheet? So that I can use the same data and match the results precisely. Current I am using HDFC bank and ICICI bank data from 4th Dec 2015 until 4th Dec 2017 which you have shared in an excel sheet.
The sheet was generated on 12th June, so you will have to go back 200 trading days.
By reading your note for programmers in the following chapter I got that you are using last 200 days of data. Considering that you have data published last Pair data excel sheet which you have pointed out to me in your comment, I figured out that you are using last 200 days of data starting from 23th Aug 2017 till 12th Jun 2018. Now when I run my calculation on it, I could match values of beta, intercept, Std. Error and Sigma, precisely to decimal points. That gives my confidence that my calculations are correct. However, when I pass time series residual data of HDFC to adf.test function in R, the outcome is:
Dickey-Fuller = -3.1394, Lag order = 5, p-value = 0.09956
alternative hypothesis: stationary
The p-value does not match with the excel sheet value of 0.2073132413. Can you please clarify how you guys are executing ADF test to get the number. If anyone in your team can tell me how to get to this number using R, that will be great.
Pratik, I beginning to sense my HDFC data could be wrong. If true, then this is a mistake and the who premise of this chapter could be wrong – https://zerodha.com/varsity/chapter/live-example-2/
But the essence still holds valid. Anyway, I\’m in the process of figuring out 🙂
Hi Sir,
Did you get any chance to look into the ADF test data and parameters. I am also facing the same issue as reported in the above post. When checked with the latest provided pair data excel, I could also match (from 23th Aug 2017 till 12th Jun 2018) all the values (beta, intercept, Std. Error and Sigma) precisely to decimal points except p-value. Could you please check on this.
Manoj, swamped with work. I\’ll try and do this as soon as I can. Thanks.
Sir, i am also facing the same issue, other than p-value everything else is matching….whenever you get the time ..thanks in advance..
Hi Karthik,
What is the input for ADF Test?
200 Day Stock price data or any calculated intercept, residual data?
ADF test checks for the stationarity on the residuals. So you yeah, the inputs for the ADF test is the residuals.
Hi Karthik,
Good series on Pair Trading. Got me hooked!!
Just a small query..when you say data should be adjusted for bonus, split, dividend etc..Where do we get such data..I am Importing the data from NSE website..So can it be considered clean or else can you give any other source to obtain clean data?
Yes, Pranay, NSE Bhavcopy usually has clean data.
Hi Karthik,
I checked the NSE bhav copy which is published daily and does not have the adjusted price if you go back and pull the same file from the earlier dates like for example TCS whose price was recently got changed due to bonus .
Can you please share the link or tell me where to get the adjusted price ?
Thanks for the assistance.
Regards
Deepu
In that case, you need to evaluate a dedicated data vendor who will clean up the data for you. Check truedata.in.
Sir what is the name of the excel plugin that you use to perform ADF test.
I\’m not sure if there is an excel plugin, Vinay.
So can both method be used in intraday as well? What will be the data series in that case.Will it be 15 min close price in case of 15min chart.Which period would be more reliable daily or intraday? And what should be the profit expectection in case of intraday in percentage terms? Lastly are there some other pair trading method apart from the two (btw I found these two mehod very informative and practical)u showed us and can u suggest some books or reading for same.Thanks in advance
No Vinay, I would not suggest you do this for intraday. These pairs trades need time to evolve and this happens over 3-4 days. However, I have opened and closed pair trades on intraday basis, but this has happened due to luck and not design.
Hello sir for testing my algo, can you tell me the ADF test p_value of HDFC and ICICI pair, I am getting 0.007, is it correct?
based on the data you used in previous chapters sir.
ADF value was ard 0.04. I think 0.0007 is not correct.
if
x = ICICI Bank, y = HDFC Bank , adf_p_value = 0.0397,err_ratio = 0.4
x = HDFC Bank, y = ICICI Bank, adf_p_value = 0.0077, err_ratio = 0.2
are the above values correct sir?
The first one seems more like it.
ok sir thanks
Welcome!
Hello sir
My question is about updating the pair data everyday. I run regression analysis and copy the residual data and paste in another sheet where I analyse density curve. I\’m repeating the same actions everyday. Can you suggest me some smart way to keep my excel sheet updated?
Next question: Residual, i get everyday, slightly differs than that of previous day albeit the difference is at third or fourth places after decimal. Should i paste the whole set of data or instead add one day data to the already existing column?
Thanks
Varsity student
I understand, Kumar. This actually needs some programming help and unfortunately, I can be of very little help in that perspective. You can update the latest close to get the latest position of the residuals.
Hello sir
Weel, my quest for updating data fast has got some success. I learnt to use macros but it runs on the fixed amount of data. I mean if i recorded to perform on 255 set of data then it can\’t run on 256 set of data.
Now my excel sheet has become dynamic. Whenever i add new data (today\’s close price) the oldest data in the column gets deleted on its own and i have the same number of data but different a starting date.
I want to know if there is any issue with such dynamic updating of data. Hope you got me 🙂
Thanks
Varsity student
This is not an issue, Mayank. You need to ensure you are looking at the latest 200-day data.
Thank you, sir 🙂
Welcome, Mayank!
Sir who is your favorite trader? The one may be you try to emulate?
I\’m fortunate enough to sit with the best trader I know, Nithin Kamath 🙂
Lots of learning, not just about trades in markets but also trades in real life 🙂
That\’s good to know sir. But I always thought Nikhil was the better trader. Nitin\’s own words.
Hello sir
I have have installed EViews statistical package for one year trial period ? In the “lag length” drop menu of ADF test section there are many options available like Schwarz Info Criterion, Hann-Quin criterion, Modified Akaik, T- static each giving different P value for the same max lag of 15. You may see it here:
http://prntscr.com/jdu0xn
Even it gives value below the threshold value of 0.05 the header reads as Null Hypothesis: Residual has a unit root. If the series has a unit root how could it be a stationary series? I have taken a screen shot here:
http://prntscr.com/jdu7m4
Thanks
Varsity student
I\’ll get back to you on this soon, Mayank.
Thank you very much sir.
Welcome, Mayank!
Hello,
Thanks for providing wonderful modules in Varsity. I have some queries listed below:
When the next chapter will come?
How much time it will take to complete the entire module and how many more chapters will be added?
Can you please name some reference books or resources for a deeper understanding of Trading system and coding one by himself?
Thanks
Here is the next chapter – https://zerodha.com/varsity/chapter/trade-identification/
This module maybe completed by May 2018. We still have delta hedging with options to complete.
Check out Ganapathy Vidya Murthy\’s book on Pair trading, its one of the best on the topic.
Hello sir
We are eagerly waiting for the next chapter.
Thanks
Here it is – https://zerodha.com/varsity/chapter/trade-identification/
Sir you\’ve written exhaustive text on trading using Technical and Quantitative methods. Can you write a module on trading using Fundamental analysis (based on earnings or news). If not, can you give some methodology on how to learn them ?
Here is what we have, for now, Sundeep – https://zerodha.com/varsity/module/fundamental-analysis/
Its best you use FA for long-term investment and not really get into trading based on FA.
Sir I think FA is best used for long term too. But I think FA based plays gives the highest yield. What are your thoughts on that? Can you share why you think FA can\’t be used for short term plays?
You do have great setups based on PE expansion/contraction. For this, you need to keep track of daily PE. Further, you can even place trades based on quarterly results, employing options.
Yes sir that is exactly what I am doing right now. But the returns are all over the place. And I need some guidance. What books are there on the subject or if you can give me few pointers it would be very very helpful. Thank you.
Have you checked Ganapathy\’s VidyaMurthy\’s book on Pair Trading? Check this – https://www.amazon.com/Pairs-Trading-Quantitative-Methods-Analysis/dp/0471460672
Sir I have a very personal question to ask you. But since it relates to mindset of a good trader I decided to ask you anyway. How do you feel when your fellow trader made more money, assuming you started out with same amount of capital. I know I felt really bad when it happened to me. How do you deal with that?
Sundeep, this is personal. The way I react maybe different from the way another. I think you should be happy since you can always check with your friend on what went right for him and learn from his success. End of the day, the only way to move ahead in markets is by having an open mind to learn and adapt. Good luck and keep learning 🙂
Fantastic series Karthik. I had not been here for a while and had to skim through to get here. You have successfully managed to keep it as a easy read. Hats off.
Considering that I am starting my journey as a full time trader n a month, I see myself coming here more often.
Question:
Do you have tools within kite to figure out cointegration and other analysis ? Are you considering bringing any capability around it?
Glad to note that, Madhavan 🙂
Unfortunately, we don\’t have coint tools within Kite. Trying my best to figure out an alaternative.
Sir I know this is not a proper question but this is just eating away at me. A few days back Airtel had announced its results and it was bad. But it was better than what the market was expecting. Still the next day, the share went up. What do you think caused this?
Sundeep, the same thing happened y\’day with Axis. The past was bad but the future looks good. Remember, future is what the stock markets always looks at 🙂
Sir what you just said only brings me a few more questions sir. I\’m sorry to pester you like this.
1. You once said when you give market good news and bad news, it always reacts to good news first. By that logic, don\’t you think the shares of Airtel and Axis should have gone down?
2. In the hindsight, do you think you could have predicted that even if those two companies posted bad earnings, it is going to go up? (I\’m just asking that to see if seasoned traders can do that, since I had no clue it was a possibility. )
3. Is there a method to associate a particular news to its reaction to stock price. For example, in the above case, what were the factors that led to stock moving up?
I hugely appreciate what you\’re doing to help fellow traders like myself. Varsity is a treasure and I encourage my friends to read it as well. Thanks in advance for the answer.
1) The market always looks at futures, Sundeep. So, they expect a better outlook for these stocks as they believe the worst could be over. But your guess is as good as mine
2) My colleague actually had a bet with another colleague that the stocks would go up the next day 🙂
3) This is largely depended on your experience reading the markets
Happy to note that Sundeep, keep learning 🙂
Hi Kartik,
I m a regular student of Zerodha Varsity. I am wondering whether it is possible for you to have a separate chapter for \”How Stock/Financial Market Operates\” which cover basically the mechanism of stock market like Market Makers, Clearing Agents, etc. ( as there are many other components who operate on the back stage of Market and I\’m just mentioning couple of them that I know. Hoping you will cover the rest) How they operate and who they are on the context of Indian market.
There is not so much stuff available online also on this subject. I personally think that one should have knowledge about the mechanism which will broad our knowledge and I believe knowledge is Power.
Best regards,
I agree, Joshan. Have you looked at this module – https://zerodha.com/varsity/module/introduction-to-stock-markets/ , will help you with some basic information.
@kartik
greetings
– while studying co-integration i find web pages for pure calculation of how to calculate co-integration, frankly i could not understand any of math symbol and calculation.
– regarding 0.5 or 0.05 about p-value, 0.05 is confirm. but the afl i m using with ami is simply outsource the data to python servers and displays the coint value to amibroker afl window. i think we should divide the displayed value with 10. because some good pair with my experiment showing the coint value of 0.20…so i m taking it as 0.02…and its working fine. any python coder can crack its afl and throw some more light about it.
– http://prntscr.com/jahlrd in this my data starts from 12/4/17 to 26/4/18 almost 252 days period..co-int value is 0.08 so i will take it as 0.008 and
– http://prntscr.com/jahp5z in this tatamtrdvr/tatamotors pair coint showing 0.18 so i m taking it as 0.018…u don\’t believe that this pair is so tight spread that i m trading it on 60min basis and touch wood earning good money….pl click below link for hourly chart
– http://prntscr.com/jahsfo profit in hourly chart is less than day chart but there are plenty of trading opportunities..(on 5lac both side u can earn around 2500-brkrg in 2-3 days)
previously i started all good stocks pair, then after experience i narrow down it to good banking stock (total 104 pairs possible), but since last 6 month i narrowed down it further and i trade only nf/bnf, tatamtrdvr/tatamotors, hdfc/hdfcbank and acc/ambuja only.
besides theory any experience trader can tell after watching 2-5 yrs of daily chart that this pair is regularly mean-reverting or not?
after all earning consistent money is anyone\’s motto here…
thanks.
Hey, Akash thanks for the insights. Nothing beats practical market experience 🙂
Btw, what makes you divide the p-value by 10?
I was not aware of TM DVR future, I\’m sure it opens a window of opportunity.
Hi, Kartik,
dividing p-value by 10 was just my simple logic/intuition from motors/dvr exp…the long term chart showing its very tight spread and it regularly cross its mean, and coint value showing me 0.11 to 0.45 range, if we took this value this pair is not reliable for pair trade, but if we divide it by 10 we will get 0.011 and 0.045 and that would be v.good for pair trade. and second example was bn/n its coint showed me 0.15 to 0.68 but practically if we see that is also verygood pair. thats why i came on that conclusion that i should divide it with 10. i dont have any knowledge to write or read and understand AFL language… i believe in KISS. and i never regret for it. but i still not understand why axis/icici coint showing 0.00 value? that project is still under process…will let you know. mean time i m searching who has sound AFL coding understanding to crack the python AFL. hope this will help.
Interesting, Akash. Will certainly look at this. Meanwhile, do post any observations here!
Thanks Prakash and Kartik..
For p.value i use amibroker. Cointegration is not inbuilt indicator for p value so we have to outsource the data to pythone from ami . For that search \”how to calculate cointegration in amibroker\” on marketcalls.in, there is v.good step by step explanation on that.
I find nifty/banknifty, ambujacem/acc and tatamtrdvr/tatamotors very stationary pairs to trade even on 60min chart too..
I keep searching stocks in same sectors only.
@kartik,
the p value for axis/icici showing 0.00 all time i look, what does it mean? Is it 100% probability that its mean reverting?
And once again thanks u both of you.
Akash – I\’m not sure about the article you have mentioned, maybe I should give it a read. Also, the term \’p-value\’ is a generic term, make sure you are reading this in the right context.
hi karthik
ami gives me data in this format, copy below link paste in other tab to see the screen of amibroker.
http://prntscr.com/j9xawy
http://prntscr.com/j9xc40
http://prntscr.com/j9xcgu
http://prntscr.com/j9xct9
above are my favorite pairs. one can overlook the correlation data as i calculate 63 trading days correlation by amibroker builin function. but i took 252 trading days to calculate co-integration.
below is correlation table link which can run in amibroker by simple afl
http://prntscr.com/j9xeih
i have cointegration afl also but its not running properly otherwise we can just see the cointgration in tabular form in selected watchlist. so i keep looking cointegration in individual pairs only.
hope above info will usefull to other friends too.
forgot to share the link for amibroker users…
https://www.marketcalls.in/amibroker/how-to-compute-cointegration-using-amibroker-and-python.html
@karthik,
why this is written p-value should be less than 0.5? can u throw some light on this? might be its taking % value?
http://prntscr.com/j9xmxp
thanks for nice series of chapters.
when there is a break in correlation, there is a trade opportunity in good co-integrated pair, i think. here is amibroker screen for correlation.
http://prntscr.com/j9zaoy
Interesting, need to validate this, Akash.
I dont know why it should be less than 0.5. I\’d prefer less than 0.1 or even 0.05.
I hope so too 🙂
Btw, is there any insight into how the Cointegration is calculated?
Hello Karthik,
Thanks to you and Prakash for taking the pain to make us understand this chapter. Overall I am thoroughly enjoying this module. However, I have few questions in my mind while going thru\’ this chapter. Hope you can clarify the doubts here.
1. You mentioned that the look back period is 200 trading days. When I am calculating the pair (let\’s say PNB as x and Kotak Bank as Y), the Intercept coefficient I am arriving at is in the vicinity of 1111. However, in the sheet you shared it is around 1099. My data range is starting from 23rd June, 2017 till 13th Apr, 2018. Am I missing anything here. I am following the same procedure which you mentioned in chapter 9.
2. When I am calculating the p-value (using the python in-built packages), for the period as mentioned above – it is coming around .40 instead of .01. Not sure why such a huge difference. Can you please elaborate if there are any additional parameters go into calculating the p-value in your case.
Thanks
1) How did you source the data? Did you get it from Pi? Make sure its clean for splits and bonuses, if any
2) Not sure about this, will try and see why this could be happening.
I took the data from Yahoo finance. Generally it\’s adjusted for split and bonuses. But I will take it from Pi and do the calculation once again.
Ok. Also, we have considered the data from 20th June 2017 to 10th apr 2018. The intercept difference is due to that I guess. Also, as you may have figured, in most ADF functions, one needs to give a lag. In our case its 5. Recommend value is the cube root of the length of data points (or thereabouts). Since we had 200 data points, cube root is 5.8, decided to go with 5.
Thanks. I will use 5 then.
Sure, good luck, Mainak.
Can you please upload the PDF of all the chapters shared so far?
Thanks
The modules will be completed to PDF once this is completed.
Thank You Karthik sir,
Even though ADF test is not available , you have taught us how to calculate Stationarity using excel by dividing the data in to parts and calculate Mean,SD and 2 Lag correlation.But please mention how much variation in Mean,SD which would represent \’p\’value of 0.05 (rough estimate).
You can run ADF test in R software, load package called \”urca\” in R. It\’s really easy in R.
Dear Akshay,
Is this software free? If yes please suggest from where to download it.
you can download adf test excel add-in from below link
http://www.web-reg.de/adf_addin.html#
deear sunil thanks a lot for the link please elaborate how to use it on excel? thanks in advance.
For mean – I\’d suggest a tight variation, not more than 3-5 points difference. For SD, technically you will have to look at the standard error of the standard deviation, but then, it may just get a little overboard. Stick to -5-10% at the most. This should result in a pvalue less than 0.05%.
Thanks prakash lekkala sir and karthik sir for your effort..
Most welcome!
I\’m glad to know new learning with your guidance. Seriously Its very educative and informative.
Thanks for Enlightenment us.
Happy learning, Anil!
I would say, it\’s very addictive too along with being educative and informative.
Thanks a lot, Karthik.
Glad to hear that, Arbit 🙂
Keep learning!
Thanks Karthik.
Excellent writeup!!!
Is it possible to have the complete list of upcoming chapters to know where we are with regard this pair trade journey ?
Can we expect a few more chapters this month ? Sorry for being greedy…
Regards
Deepu
Deepu, glad you liked it.
I don\’t plan for it in advance, but generally, go with the flow. To give you a rough idea, the next step would be to take up an example of a trade and try and put all the learning together. Hopefully, that will be exciting enough 🙂
Thanks Karthik.
Request you to share 5-6 examples so that it covers most of the leanings. Further what is the ADF plugin cost and where to buy it from ? Please share the details.
Regards
Deepak
You can use R Studio package to run ADF test. There is a package called \”urca\” in r studio which enables this test.
Thanks, Akshay. Yes, I\’m aware R has a plugin, will have a look at URCA.
The idea is to share a couple of live examples. Will share the other details as we progress.
Dear Karthik,
As you said I have stuck on ADF test. no friend with programming knowledge.
If I need to buy a paid plugin then how much it will cost?
Any other way to do the ADF test?
Swapnil, unfortunately, I have not evaluated any paid versions. So cannot really comment. Thanks.