
4.1 – Correlation and its types
I have to mention this at this point. The pair trading technique we are discussing now is discussed in a book called, ‘Trading Pairs’, by Mark Whistler. I like this book for the fact that it got me hooked to Pair trading and over time as my interest grew, I explored the strategy beyond Mark Whistler’s techniques. Needless to say, I will discuss those techniques later in this module. At this point, my intention is to take you through the exact learning path I underwent learning pair trading.
Towards the end of the previous chapter, we introduced the concept of correlation and the way one can analyze the correlation values. We will take that discussion forward now and understand how to calculate the correlation between two stocks, on excel. As you may have guessed by now, the calculation of Correlation between two stocks is the key in pair trading.
For the sake of this example, I’ve considered Axis Bank and ICICI Bank. Both are Private sector banks and have similar business backgrounds, hence intuition says that the two stocks should be highly correlated.
At this point, I have downloaded the closing price of Axis Bank and ICICI Bank from 4th Dec 2015 to 4th Dec 2017, roughly 2 years of trading data or about 496 data points.
Before we proceed, a quick note on data –
- Make sure you are dealing with the same number of data points. For example, if you have 400 data point for Stock A, then you need to ensure you have the same number of data points for Stock B, corresponding to same dates.
- Make sure the data is cleaned for corporate actions such as bonus/splits etc
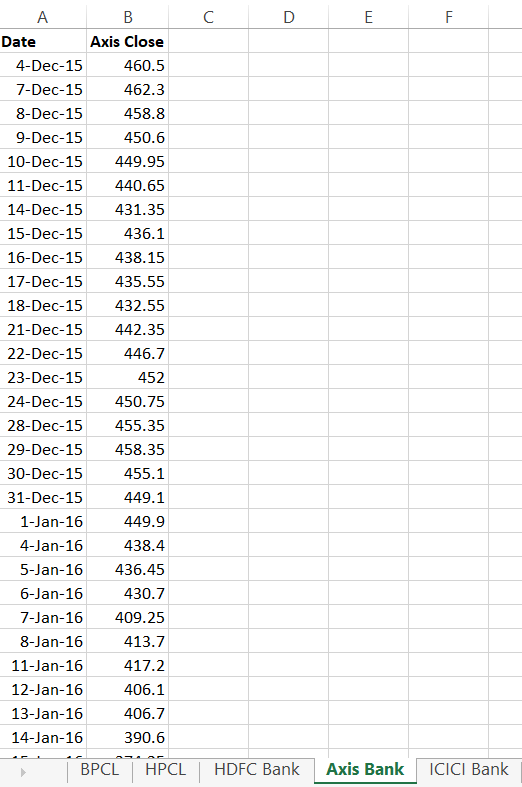
As you can see from the above image, besides ICICI and Axis, I have also downloaded the data for BPCL, HPCL, and HDFC Bank. You can use this data to build and test other correlations.
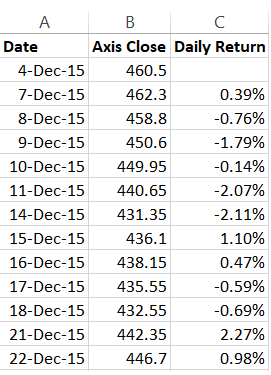
Anyway, at this stage, the only data we have is the date and the closing price of the stock. We will go ahead and calculate the daily returns. I guess you are familiar with the daily return calculation, we have discussed this several time in the previous module.
The daily return can be calculated as
= [today’s closing price / previous day’s closing price] – 1
I’ve calculated this for both ICICI and Axis Bank –
Now, correlation can be calculated on the basis of two parameters –
- The daily closing price
- The daily return series
The daily closing price correlation requires you to calculate the correlation based on the closing prices of two stock. I’m not a big fan of calculating correlation on closing prices, but then let’s just go ahead and do this for time being.
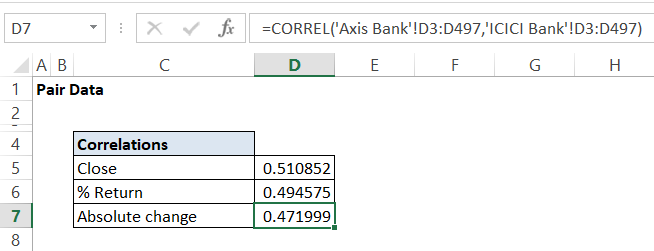
To do this in excel, simply use the ‘=Correl()’, function on the daily closing prices. I’m running this calculation on a new sheet, which is labeled it as ‘Pair Data’.
Here is the snapshot –
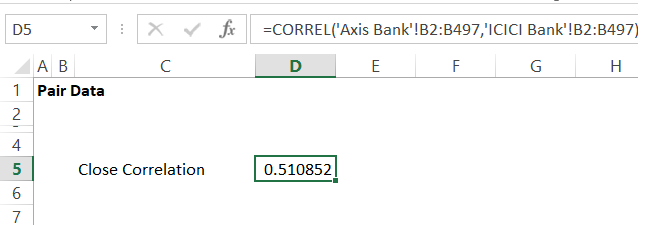
The correlation between the closing prices of ICICI Bank and Axis bank is 0.51. Not particularly a great correlation, but we can live with this for now. Do recollect, our gut said the two banks could be highly correlated as they have similar business backgrounds, but the number is painting a slightly different picture 🙂
We will now run the correlation on the daily % return series for the two stock. I’ve already calculated this % return, I’ll just have to run the correl function now.
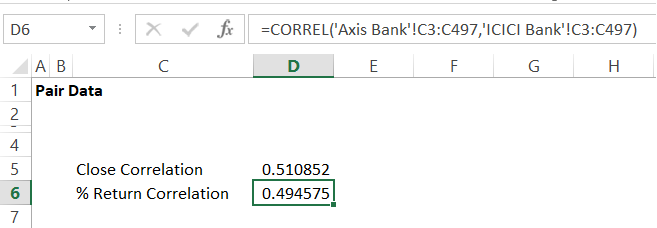
Again, not a very encouraging number, but that is ok for now.
Some traders, run the correlation on the absolute per day change calculated as ‘Today’s stock price – yesterday’s stock price’. Again, I’m not a big fan of this. But let me just go ahead and introduce the same to you –
In all the above calculations, I’ve run the correlation of Axis Bank versus ICICI Bank, the results obtained will be same if I had opted to calculate the correlation of ICIC Bank versus Axis. Generally speaking, the correlation between A and B is the same as Correlation between B and A.
In this method of trading pairs, the correlation number is considered sacred. Ideally speaking, the number should be above 0.75. Clearly, that is not the case with ICICI and Axis, but then as I mentioned earlier, we can live with it.
4.2 – Setting up the datasheet
In the previous chapter, we discussed three variables concerning the pairs namely the spread, differential, and the ratios. Let us go ahead and calculate these variables on the two stocks we are studying. We will do this on a separate sheet within the same workbook and name the sheet as the ‘Data Sheet’. Here is the snapshot –
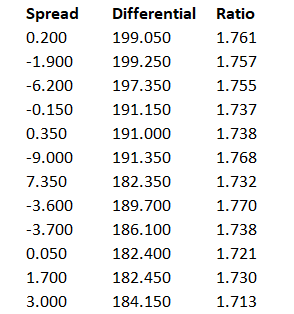
The calculation of these variables is quite straightforward, I’ve explained this in the previous chapter.
Different types of Pair Trading works at different complexities levels. We will deal with basic stats for this version of pair trading. Given this, we will now define 3 most commonly used statistic variables.
4.3 – Basic stats
I’ll discuss 3 basic statistical terms at this stage. These are basic terms which play a very crucial role in pair trading. I’m fairly certain that you’d have learned these in your high school math, even otherwise this is quite basic and you can pick it up anytime.
To help you understand these jargons better, I’ve come up with a set of arbitrary runs scored by batsmen across 10 cricket matches –
| Match | Runs scored |
|---|---|
| 1 | 72 |
| 2 | 65 |
| 3 | 44 |
| 4 | 100 |
| 5 | 82 |
| 6 | 55 |
| 7 | 100 |
| 8 | 23 |
| 9 | 51 |
| 10 | 34 |
Mean – Also called the arithmetic average, represents the average of a set of numbers. You can calculate the average by taking the sum of all the observations by the total number of observations.
So if I were to find the average in the above example, I’d total up all the scores and divide it by 10 (10 being the total number of observations).
Mean (Average) = 626/10
=62.6
On excel, you can simply use the ‘=Average ()’ function to calculate the average of any set of numbers.
Median – The median number represents the middle number of the data series when the data series is arranged in its numerical order. If there are even set of numbers (which is the case here), then we have to take the average of the middle two numbers to calculate the mean. However, if there are an odd number of data points, then we simply take the middle data point as the median.
So let me rearrange the data points in its numerical order –
23, 34, 44, 51, 55, 65, 72, 82, 100, 100
Since there are even numbers of observation, I’ll take the middle two numbers i.e 55 and 65, their average represents the median.
Median = (55 + 65)/2
=60
The excel function to calculate median is ‘=Median()’.
The mean and median when viewed together gives a sense of the trend. More on this later.
Mode – The mode of a data series is simply that data point which occurs the most number of times in the series. Clearly, 100 is repeating twice, with no other number appearing more than once, and that makes it the mode of the data series.
The excel function to calculate Mode is ‘=Mode()’.
In the next chapter, we will use these function in excel and understand its relevance to pair trading.
Download the excel sheet used in this chapter here.
Stay tuned.
Key takeaways from this chapter
- Care has to be taken to ensure the data is clean and adjusted for corporate actions
- Close correlation is the correlation when calculated on the closing prices of stocks
- The % return correlation is the correlation when calculated on the daily returns of the stock
- Mean is the arithmetic average of the data series
- Median is the middle observation of a data series.
- If the data series has even number of observations, then the median is the average of the middle two observations
- If the data series has odd number of observations, then the median is the middle observation
- The mode of a data series is that value which repeats the highest number of times
- The mean and median, when viewed together to each other, offers great insight into the data trend.
Isn\’t it better to use cointegration instead of correlation?
Have discussed that in the 2nd method.
sir,is it possible that the correlation between the two stocks can be negative value?
while i tried to calculate the last one year closing prices of hdfc and icici to find the correlation it is coming
-0.43.
Yes, thats possible.
This is written so simply in a language a newbie can understand, it\’s better than a trading book, it\’s better than a paid course obviously, statistical arbitrage which used to feel like a very difficult concept is explained so simply that art students like me can understand it as well, thanks to the author of this course! give this man a prize
Thanks for the kind words, Kaustubh. I\’m glad you found this useful and easy to understand. Happy learning 🙂
The daily closing price correlation requires you to calculate the correlation based on the closing prices of two stock. I’m not a big fan of calculating correlation on closing prices, but then let’s just go ahead and do this for time being.
On the above statement, The writer is not a big fan of calculating correlation on closing price and absolute per day change. What is the other way to calculate the correlation, Is he talking about Daily % return ? Is this a good way to calculate the correlation or there some other ways to calculate the correlation that we discussed later in this module ?
That\’s right, a correlation on % returns is better compared to the correlation on just prices. The reason is that stock price tends to trend (and not normally distributed) whereas the % return is normally distributed.
what to do after getting the value of differential spread and ratio that i didnt get
and also didnt understand the spreading up the datasheet section what does that indicate?
how to calculate the percent return corealtion i have already calculated corealtion between two stocks and i am currently stuck there can you help me with it
Not sure if I understood your query fully. Can you elaborate, please?
Oh got it! Thank you for clarification!
Good luck.
Data is clean & adjusted for corporate actions.
What does that mean?
Suppose stock gives a bonus of 1:2, that time-series data should reflect a smooth transition rather than a sudden drop in prices.
Hi Karthik,
Does it make any difference to use spot price or future price? Which one is preferred?
You can use the spot price, Sushil.
Hello Karthik, Is the Kite Connect clear for stock splits, bonuses, dividends, etc. so that I can use it directly into an algorithm.
It is. But I\’d suggest you check with the team on the Kite Connect forum once.
Sir, How to get historical closing prices of stock which you have used above in excel
You can download it from the NSE website, Pratik.
One More :
3. Can we calculate correlation on one year or 252 data points instead of 2years/ 496.
Yes, you can.
Sir,
Somewhere in the modules that I went through I read not to leave the strategy until it hits our defined SL. I must say that I have experienced trade coming back my way in a big way many times , that too at the last our, near expiry in nerve catching situation.
I thank you for providing such Important inputs in the module, which keeps us safe to an extent . 😊 Do you plan to write any module on Algo Trading .
1. In this module on Correlation you have mentioned “ Data should be cleaned of corporate actions – such as bonus n splits “ I have downloaded 2 years data . What should I do/ remove in this 2yr data considering the above statement .
2. In Correlation as data should be stationary , how much difference from average is
Acceptable in order to call it stationary .
No plans on algo trading, Dhawal 🙂
1) This can be a tedious task, the easiest solution is to subscribe the data from a data vendor who will give you the cleaned-up data
2) Hmm, I think I have discussed this in the chapter itself?
Yes sir, I have read all the concept of mean and mean with standard deviation too. But not mean with median.
Tushar, please ignore the Median for now. Not much use at this point.
First of all a very thanks for this wonderful module sir!
Sir, You said in this chapter that \”The mean and median when viewed together gives a sense of trend. More on this later.\”
I read all the chapters of this module but unable to find that topic.
So my question is \”how can a mean and median when viewed together gives a sense of trend?\”
Thankuuu!
Tushar, I\’ve discussed the \’mean\’bit I guess.
How to keep stop loss, sometime, the pairs keep diverging , how to handle in that case
The best way is to keep the SL based on standard deviation. Have explained this in the module.
Hi Kartik Sir !!
Good Afternoon. I asked you for trading strategy and you directed me towards link :- https://zerodha.com/varsity/module/trading-systems. (1) I already finished this chapter and it seems like all these calculation require lot of complex calculations in excel sheet and its not available ready made in Kite ?
(2) I thought strategy means something like … (a) Find the High and Low of a stock between 10:15 to 11:15 and whenever stock breaks the level setup trade. (b) When EMA crossover will signal buy etc. (c) When volume is double then 10 day avg then setup trade etc.
But what i am reading here is a completely different stuff. Kindly provide some Insight.
1) Yes, that\’s right. In fact, all good strategies are backed by calculations.
2) YEs, these are also strategies but rather simple elementary stuff. What we have here is a niche play.
Thanks
Dear Karthik,
completely off the track question.
In most of the modules in varsity, you are mentioning/referring to \”J\”.
\”hope you won’t mind my clumsy data handling skills J\”
curious to know who\’s J?
Ah, sometimes the smiley just renders as a J instead of the \’:)\’, so dont worry about that.
Thank You will do the same
Happy reading, Anil!
Hello Karthik Sir,
To understand from the learning point of view, is there a way to clean the historical data of a stock which have declared Spilt & Bonus.
or should we rely upon data vendors?
Thank You.
It is best if you opt for a data vendor. They will ensure your data is clean.
How or where can we obtain clean data?
You need to speak to a good exchange approved data vendor for this.
What is the minimum number of data points that needs to be taken? I am currently using 60 trading days (90 days).
Yeah, 90 days is good. 180 is better.
Namaskar Sir,
i want to know how to clean data for bonus , divident and any bonus .
what exactly \”clean \” means\” ?
thanks
Clean data = Adjusted for corporate actions like splits, bonus, dividends etc.
I am unable to calculate the Correlation numbers. Could you please explain me how to determine it in excel sheet.
Hmmm, have done that in the chapter itself, Biswanath.
I couldn\’t read the page because it always redirecting to add page. please advise. FYI. i trade with Zerodha.
Thanks,
Lenin.
We are looking into this, Lenin.
Hello,
Can you please elaborate more on \”The data should be cleaned for corporate actions\”. Suppose there is bonus issue 1:1 for the stock which is currently trading at 200 so after bonus it would be 100. so do we consider 100 for calculation?
THANKS
Yes, thats how it should be done. But suddenly breaking it down to 100 will show a crazy fall, so you will have to normalize the historical data also for the same. Its best if you can subscribe to good clean data providers. They do this job for you.
the correletion of icici bank and axis bank based on daily prices ? I could not get that line. As I read in the last chapter that correlation says the direction. And for our example we need atleast a + or – sign to sense the direction . How can closing prices be taken then ?
I\’m unable to get your query, Saurabh? Can you please elaborate? By the way, correlation can be calculated both on % close and closing prices. Nothing wrong with it.
Hello Sir,
There is a small difference in the co-relation which i got between Axis and ICICI bank. I got 0.47 and you got 0.51 for closing price. Then to check why did it happen i did a cross check on both the data and i found that the data which you took did not adjust for the price of ICICI bank for the bonus of 1:10. It shows,
19th June 2017 – 320.6
20th June 2017 – 292.45
So, is it the clean data or it should be like that only?
The daily returns and absolute change in your excel data for this date shows a change of -8.8% and -28.15%, which is very much deviated from their mean.
Please check and confirm, it would be really helpful for me to go ahead with my search for pair stocks.
Thank You in advance
Pritam, I may have overlooked the data for the bonus. Yes, the data should be cleaned for all corporate actions, else the results could be misleading.
Thank you very much Sir, Karthik Rangappa for sharing your knowledge, appreciate your effort. Could you please let me know what are things one need to consider for data cleanup other than stock split?.
Thanks in advance
Ashok, apart from stock splits please check for bonus and special dividends.
how to calculate abs change in excel with formula ??
Here is the formula – [Today\’s close/Y\’day close] – 1
thankyou sir
one more question plz assist, how to create spread contract ??
You just buy one month contract and sell the other, and with that, you\’d have actually created a spread contract.
One question
Is pair trading done only in the F&O segment or can it be done in the normal equity segment too?
can be done in cash but only for intraday….as we can not short cash segment on overnight. one can do pair trade by sell in fo and by in eq.
hello sir,
i m doing pair trading in stocks which have correlation above 75%, and also looking at their co-integration should be <0.5. but there is one question i could not search on google. how much lookback period(window) required for co-int on daily ratio chart. other things i look is z-score(63 period) +/-2. only thing confuse me is cointegration lookback period. pl guide. recently i go with 1 year cointegration.
thanks.
We will be covering the co-integration bit in some detail shortly. However, a minimum of at least 6 months is necessary as a lookback period.
thank you boss.
WHEN ARE YOU COMING WITH NEXT LESSON. EAGERLY WAITING FOR TRADING STRATEGY SETUP, ALSO PLS INCLUDE EXAMPLES.
Next week.
HELLO SIR
I have calculated correlation between two closely related stocks pfc and rec.
closing price correlation was 0.53
and i was expecting it to be above 0.7.
Their daily return correlation turned out to be 0.39 which is shocking.
Between infratel and nifty 50, closing price correlation is 0.74 and daily return is 0.24
Dont know which figure to believe??
Yes, correlation numbers can be quite shocking 🙂
Hello Karthik,
In the data of BPCL, on 13-jul-17 there was -32.93% change in price and on HPCL there was -33.59% change in price. Is this data valid for calculations? I have calculated the correlation between these stocks and got answers which do not match. I have got 0.82 as close price correlation and 0.19 and 0.18 as % change and abs change correlation. When I plotted the chart of spread,differential and ratio I am getting huge spikes on top and bottom of chart near the dates where there is huge price change. What do you think went wrong??
Ah, I\’m afraid the data is not cleaned up for corporate action. Apologies for this.
What do we have to do in that case? Should we only consider the data after there was huge change in price and calculate for the same?
You just need to ensure the data is clean. By clean, I\’m referring to the data being cleaned for splits and bonuses.
Sir,
Which is the best source to get the data that is clean and adjusted.. and how do we know that it is adjusted and clean or not ??
I\’d suggest you subscribe to an NSE authorized data vendor for this. If you see the stock price suddenly dropping by 50% on a single day, then most likely the data is not clean.
Sir..
Please suggest few names of such vendors which are reliable from your experience..
Check out \’True Data\’, I\’ve heard they are quite good.
Sir do you think it would be possible for you to give a list of suggested readings at the end of every module /chapters, so as to help enthusiastic varsity readers like myself? Thanks a ton.
Sure, makes sense.
Very excited to hear that sir. That mean you\’d be adding the reading list at the end of each module?
Yes, I\’ll do that at the end of the module.
Hi sir. Sorry for asking again, but did you have time to compile the suggested reading lists for each module? It would it much appreciated. Thanks in advance.
Not really, Shashidhar. However, if you are interested in Pair Trading, I\’d sugges you read \’Trading Pairs\’, by Mark Whistler first and then read the book written by Ganapathy Vidyamurthy.
Thanks for the suggestion sir. But I have already read the book by Mark whistler, and it was really good. I just need one more book suggestion. Is there any books that deal with how to trade using news and announcements? Thanks in advance.
Have you read the book by Alexander Elder, titled – \’Trading for a Living\’?
Thanks for the chapter. Hopefully the next one comes sooner as this feels being left out in the middle 🙂
Does kite give back-adjusted data? I look at weekly chart of infosys and it doesn\’t feel like that. Maybe it had crashes (during the dotcom bubble and in 2002-03) but still I don\’t feel like it is back adjusted. But YES Bank data is back adjusted.
Or is it that the back adjusting in Kite starts from a particular year?
Will we get an option to download the OHLC data from a chart in Kite 3.0 like there is in Pi?
I understand, but then few readers felt that the content was too long, so trying to shorten the length of the chapter. Yes, whenever corporate action happens, the charts are cleaned up. I\’m afraid there is no option to download the data from Kite, yet.
Will there be download from chart option ever available from Kite as it is from Pi?
No, not in the near future.