

16.1 – Defining Momentum
If you have spent some time in the market, then I’m certain you’ve been bombarded with market jargon of all sorts. Most of us get used to these jargon and start using them without actually understanding what they mean. I’m guilty of using a few jargon without understanding the true meaning of it, and I get a feeling that some of you reading this may have experienced the same.
One such jargon is – momentum. I’m sure we have used momentum in our daily conversations related to the markets, but what exactly is momentum, and how is it measured?
When asked, traders loosely define momentum as the speed at which the markets move. This is correct to some extent, but that’s not all, and we should certainly not limit our understanding to just that.
‘Momentum’ is a physics term. It refers to the quantity of motion an object has. If you look at this definition in the context of stock markets, everything remains the same, except that you will have to replace ‘object’ with stocks or the index.
Momentum is the rate of change of stock returns or the index. If the rate of change of returns is high, then the momentum is considered high; if the rate of change of returns is low, the momentum is considered low.
This leads us to the next obvious question i.e. what is the rate of change of returns?
The rate of change of return, as it states the return generated (or eroded) between two reference periods. For the sake of this discussion, let’s stick to the rate of change of return on an end-of-day basis. So in this context, the rate of change of returns means the speed at which the daily return of the stock varies.
To understand this better, consider this example –
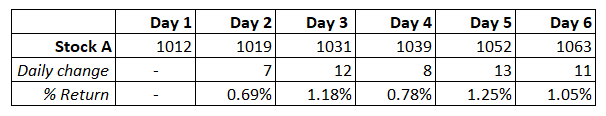
The table above shows an arbitrary stock’s daily closing price for six days. Two things to note here –
- The prices are moving up on day to day basis
- The percentage change is 0.5% or higher daily
Consider another example –

Two things need to note –
- The prices are moving up on day to day basis
- The percentage change is 1.5% or higher daily
Given the behavior of these two stocks, I have two questions for you –
- Which stock has a higher rate of change in daily returns?
- Which stock has a higher momentum?
To answer these questions, you can look at either the absolute change in the Rupee value or the percentage change from a close-to-close perspective.
If you look at the absolute Rupee change, the change in Stock A is higher than in Stock B. However, this is not the right way to look at the change in daily return. For instance, in absolute Rupee terms, stocks in the range of, say, 2000 or 3000 will always have a higher change compared to stocks in the range of 1000 or lower.
Hence, evaluating absolute Rupee change will not suffice, and therefore we need to look at the percentage change. In terms of percentage change, Stock B’s daily change is higher, and therefore we can conclude that Stock B has a higher momentum.
Here is another situation, consider this –

Stock A has trended up consistently daily, while stock B has been quite a dud all along except for the last two days. On an overall basis, if you check the percentage change over the 7 days, then both have delivered similar results. Given this, which of these two stocks is considered to have good momentum?
Well, Stock A is consistent in terms of daily returns, exhibits a good uptrend, and, therefore, can be considered to have continuity in showcasing momentum.
Now, what if I decide to measure momentum slightly differently? Instead of daily returns, what if we were to look at the return on a 7 days basis? If we do that, stocks A and B qualify as momentum stocks.
The point I’m trying to make here is that traders generally look at momentum in terms of daily returns, which is perfectly valid, but this is not necessarily the only way to look at momentum. The momentum strategy we will discuss later in this chapter looks at momentum on a larger time frame, not daily. More on this later.
I hope by now; you do have a sense of what momentum means and understand that momentum can be measured not just in terms of daily returns but also in terms of larger time frames. High-frequency traders measure momentum on a minute-to-minute or hourly basis.
16.2 – Momentum Strategy
Among the many trading strategies traders use, momentum is one of the most popular strategies. Traders measure momentum in many different ways to identify opportunity pockets. The core idea across all these strategies remains the same, i.e., to identify momentum and ride the wave.
Momentum strategies can be developed on a single-stock basis. The idea is to measure momentum across all the stocks in the tracking universe and trade the ones that showcase the highest momentum. Remember, momentum can be either long or short, so a trader following a single stock momentum strategy will get both long and short trading opportunities.
Traders also develop momentum strategies on a sector-specific basis and set up sector-specific trades. The idea here is to identify a sector that exhibits strong momentum; this can be done by checking momentum in sector-specific indices. Once the sector is identified, look for the stocks that display maximum strength in terms of momentum.
Momentum can also be applied on a portfolio basis. This involves portfolio creation with, say ‘n’ number of stocks, with each stock showcasing momentum. In my opinion, this is an excellent strategy as it is not just a plain vanilla momentum strategy but also offers safety in diversification.
We will discuss one such strategy wherein the idea is to create a stock basket, aka a portfolio of 10 momentum stocks. Once created, the portfolio is held until the momentum lasts and then re-balanced.
16.3 – Momentum Portfolio
Before we discuss this strategy, I want you to note a few things –
- The agenda here is to highlight how a momentum portfolio can be set up. However, this is not the only way to build a momentum portfolio
- You will need programming skills to implement this strategy or to build any other momentum strategy. If you are not a coder like me, then do find a friend who can help
- Like any other strategy, this too has to be backtested
Given the above, here is a systematic guide to building a ‘Momentum Portfolio’.
Step 1 – Define your stock universe
As you may know, there are close to 4000 stocks on BSE and about 1800 on NSE. This includes highly valuable companies like TCS and absolute thuds such as almost all the Z category stocks on BSE. Companies such as these form the two extreme ends of the spectrum. Do you have to track all these stocks to build a momentum portfolio?
Not really. Doing so would be a waste of time.
One has to filter out the stocks and create the ‘tracking universe.’ The tracking universe will consist of a large basket of stocks within which we will pick stocks to constitute the momentum portfolio. The momentum portfolio will always be a subset of the tracking universe.
Think of the tracking universe as a collection of your favorite shopping malls. Maybe out of the 100s of malls in your city, you may go to 2-3 shopping malls repeatedly. Clothes bought from these 2-3 malls comprise your entire wardrobe (read portfolio). Hence, these 2-3 malls form your tracking universe out of the 100s available in your city.
The tracking universe can be pretty straightforward – the Nifty 50 or BSE 500 stocks. Therefore, the momentum portfolio will always be a subset of the Nifty 50 or BSE 500 stocks. Keeping the BSE 500 stocks as your tracking universe is an excellent way to start. However, if you feel adventurous, you can custom-create your tracking universe.
Custom creation can be on any parameter – for example, out of the entire 1800 stocks on NSE, I could use a filter to weed out stocks that have a market cap of at least 1000 Crs. This filter alone will shrink the list to a much smaller, manageable set. Further, I may add other criteria, such as the stock price should be less than 2000. So on and so forth.
I have randomly shared a few filter ideas, but you get the point. Using custom creation techniques helps you filter out and build a tracking universe that matches your requirement.
Lastly, from my personal experience, I would suggest you have at least 150-200 stocks in your tracking universe if you wish to build a momentum portfolio of 12-15 stocks.
Step 2 – Set up the data
Assuming your tracking universe is set up, you can proceed to the 2nd step. In this step, you must ensure you get the closing prices of all the stocks in your tracking universe. Ensure your data set is clean and adjusted for corporate actions like the bonus issue, splits, special dividends, and other corporate actions. Clean data is the crucial building block to any trading strategy. There are plenty of data sources from where you can download the data for free, including the NSE/BSE websites.
The question is – what is the lookback period? How many historical data points are required? To run this strategy, you only need 1-year data point. For example, today is 2nd March 2019; then I’d need data points from 1st March 2018 to 2nd March 2019.
Please note once you have the data points for the last one-year set, you can update this daily, which means the daily closing prices are recorded.
Step 3 – Calculate returns
This is a crucial part of the strategy; in this step, we calculate the returns of all the stocks in the tracking universe. As you may have already guessed, we calculate the return to get a sense of the momentum in each stock.
As discussed earlier in this chapter, one can calculate the returns on any frequency, be it daily/weekly/monthly, or even yearly returns. We will stick to yearly returns for the sake of this discussion; however, please note; you can add your own twist to the entire strategy and calculate the returns for any time frame you wish. Instead of yearly, you could calculate the half-yearly, monthly, or even fortnightly returns.
So, you should have a tracking universe of about 150-200 stocks at this stage. All these stocks should have historical data for at least 1 year. Further, you need to calculate the yearly return for each stock in your tracking universe.
To help you understand this better, I’ve created a sample tracking universe with just about ten stocks in it.

The tracking universe contains the data for the last 365 days. The 1-year returns are calculated as well –
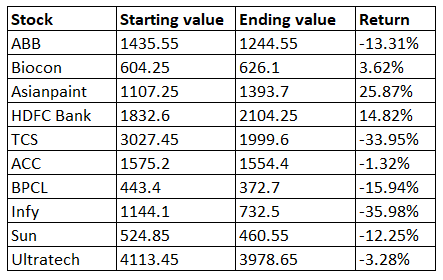
If you are wondering how the returns are calculated, then this is quite straightforward, let us take the example of ABB –
Return = [ending value/starting value]-1
= [1244.55/1435.55]-1
= -13.31%
Relatively straightforward, I guess.
Step 4 – Rank the returns
Once the returns are calculated, you need to rank the returns from the highest to the lowest returns. For example, Asian paints has generated a return of 25.87%, the highest in the list. Hence, the rank of Asian paints is 1. The second highest is HDFC Bank, which will get the 2nd rank. Infosys’s return, on the other hand, is -35.98%, the lowest in the list; hence the rank is 10. So on and so forth.
Here is the ‘return ranking’ for this portfolio –
![]()
If you are wondering why the returns are negative for most of the stocks, that’s how stocks behave when deep corrections hit the market. I wish I had opted to discuss this strategy at a better point.
So what does this ranking tell us?
If you think about it, the ranking reorders our tracking universe to give us a list of stocks from the highest return stock to the lowest. For example, from this list, I know that Asian Paints has been the best performer (in terms of returns) over the last 12 months. Likewise, Infy has been the worst.
Step 5 – Create the portfolio
A typical tracking universe will have about 150-200 stocks, and with the help of the previous step, we would have reordered the tracking universe. Now, we can create a momentum portfolio with the reordered tracking universe.
Remember, momentum is the rate of change of return, and the return itself is measured yearly.
A good momentum portfolio contains about 10-12 stocks. I’m comfortable with up to 15 stocks in the portfolio, not more than that. For the sake of this discussion, let us assume that we are building a 12 stocks momentum portfolio.
The momentum portfolio is now the top 12 stocks in the reordered tracking universe. In other words, we buy all the stocks starting from rank 1 to rank 12. In the example we were dealing with, if I were to build a 5-stock momentum portfolio, then it would contain –
- Asian Paints
- HDFC Bank
- Biocon
- ACC
- Ultratech
The rest of the stocks would not constitute the portfolio but will remain in the tracking universe.
You may ask what is the logic of selecting this subset of stocks within the tracking universe?
Well, read this carefully – if the stock has done well (in terms of returns generated) for the last 12 months, it implies that it has good momentum for the defined time frame. The expectation is that this momentum will continue onto the 13th month, and therefore the stock will continue to generate higher returns. So if you were to buy such stocks, you are to benefit from the expected momentum in the stock.
This is a claim. I do not have data to back this up, but I have successfully used this technique for several years. It is easy to back-test this strategy, and I encourage you to do so.
Back in the day, my trading partner and I were encouraged to build this momentum portfolio after reading this ‘Economist’ article. You need to read this article before implementing this strategy.
Once the momentum portfolio stocks are identified, the idea is to buy all the momentum stocks in equal proportion. So if the capital available is Rs.200,000/- and there are 12 stocks, the idea is to buy Rs.16,666/- worth of each stock (200,000/12).
By doing so, you create an equally weighted momentum portfolio. Of course, you can tweak the weights to create a skewed portfolio, there is no problem with it, but then you need a solid reason for doing so. This reason should come from backtested results.
If you like to experiment with skewed portfolios, here are few ideas –
- 50% of capital allocation across the top 5 momentum stocks (rank 1 to 5), and 50% across the remaining 7 stocks
- Top 3 stocks get 40% and the balance 60% across 9 stocks
- If you are a contrarian and expect the lower rank stocks to perform better than the higher rank stocks, then allocate more to last 5 stocks
So on and so forth. Ideally, the approach to capital allocation should come from your backtesting process, this also means you will have to backtest various capital allocation techniques to figure out which works well for you.
Step 6 – Rebalance the portfolio
So far, we have created a tracking universe, calculated the 12-month returns, ranked the stocks in terms of the 12-month returns, and created a momentum portfolio by buying the top 12 stocks. The momentum portfolio was built based on the 12-month performance, hoping to continue to showcase the same performance for the 13th month.
There are a few assumptions here –
- The portfolio is created and bought on the 1st trading day of the month
- The above implies that all the number crunching happens on the last day of the month, post-market close
- Once the portfolio is created and bought, you hold on to the stocks till the last day of the month
Now the question is, what happens at the end of the month?
At the end of the month, you re-run the ranking engine and figure out the top 10 or 12 stocks which have performed well over the last 12 months. Do note at any point, we consider the latest 12 months of data.
So, we now buy the stocks from rank 1 to 12, just like we did in the previous month. From my experience, chances are that out of the initial portfolio, only a hand full of stocks would have changed positions. So based on the list, you sell the stocks that no longer belong in the portfolio and buy the new stocks featured in the latest momentum portfolio. In essence, you rebalance the portfolio and you do this at the end of every month.
So on and so forth.
16.4 – Momentum Portfolio variations
Before we close this chapter (and this module), I’d like to touch upon a few variations to this strategy.
The returns have been calculated on a 12-month portfolio and the stocks are held for a month. However, you don’t have to stick to this. You can try out various options, like –
- Calculate return and rank the stocks based on their monthly performance and hold the portfolio for the month.
- Calculate return, rank the stocks based on fortnightly performance, and hold the portfolio for 15 days.
- Rank every week and hold for a week
- Calculate daily and even do an intraday momentum portfolio
As you can see, the options are plenty, and your imagination only restricts it. If you think about what we have discussed so far, the momentum portfolio is price based. However, you can build a fundamental-based momentum strategy as well. Here are a few ideas –
- Build a tracking universe of fundamentally good stocks
- Note the difference in quarterly sales number (% wise)
- Rank the stocks based on quarterly sales. Company with the highest jump in sales gets rank one and so on
- Buy the top 10 – 12 stocks
- Rebalance at the end of the quarter
You can do this on any fundamental parameter – EPS growth, profit margin, EBITDA margin etc. The beauty of these strategies is that the data is available, hence backtesting gets a lot easier.
16.5 – Word of caution
As good as it may seem, the price-based momentum strategy works well only when the market is trending up. When the markets turn choppy, the momentum strategy performs poorly, and when the markets go down, the momentum portfolio bleeds heavier than the markets itself.
Understanding the strategy’s behavior with respect to the market cycle is crucial to this portfolio’s eventual success. I learned it the hard way. I had a great run with this strategy in 2009 and ’10 but took a bad hit in 2011. So before you execute this strategy, do your homework (backtesting) right.
Having said all of that, let me reassure you – a price-based momentum strategy, if implemented in the proper market cycle can give you great returns, in fact, better more often than not, better than the market returns.
Good luck and happy trading.
Key takeaways from this chapter
- Momentum is the rate of change of return and can be measured across any time frame.
- A price-based momentum portfolio consists of stocks that have exhibited the highest momentum over the desired time frame.
- The tracking universe should be carefully populated. BSE 500 is a good tracking universe
- Calculate the returns for the tracking universe
- Rank the stocks based on highest to lowest return
- The momentum portfolio is simply the top 12 or 15 stocks
- The expectation is that the momentum will continue during the holding period
- The asset allocation technique can vary based on backtesting Equally weighted portfolio is a good asset allocation technique
- Momentum can be measured on fundamental data as well – growth in sales, EBITDA margins, EPS growth, net profit margin etc
- Price-based momentum works best in an upward trending market and not in a sideways or a down trending market.
Sir, instead of looking for last 1 year prices, can we look at last 6 months of prices, I guess 6 months is good because you want to ride the momentum when it is happening, after 1 year of momentum it might break. What\’s your say?
Well, you can do that if you want to set up super short term trades.
Hello Sir,
You are the person who sparked my interest in finance—so much so that it led me to shift my career from medicine (I am a doctor) to pursuing an MBA in Finance at NMIMS Mumbai. Your F&O module explained concepts in such depth and clarity that I was able to crack the NISM Equity Derivatives module within 15 days with a 90+ score, even before starting my MBA, when I had almost zero prior knowledge.
In that same module, you also spoke about “Quant,” which further motivated me to pursue data science. I am now enrolled in an MSc in Data Science and Financial Engineering (WorldQuant). You have been a true inspiration to me. I have rarely seen someone explain finance with such clarity. You are the best finance mentor I have come across.
I have one request. If possible, could you please consider starting modules for people like me who are entering the quant finance domain? Any beginner-, intermediate-, or bridge-level guidance you could provide would be of immense help.
Thank you for your time and for the impact you’ve had on my learning journey.
Thanks a lot and a big respect to my guru and favourite teacher.
Best regards,
Dr. Pritam Kumar Das
Thanks for reaching out Pritam. Your kind words mean a lot 🙂
I believe we have exchanged emails over this 🙂
I was trying this strategy and made a momentum portfolio for a weekly basis however when I ranked them on the basis of the returns what they gave last week out of the top 10-20 stocks many turned out to be having a stair pattern in the chart and hitting upper circuit almost everyday which doesn\’t seem okay to me, what if I get stuck to that. Can you suggest a way how should I proceed if I am using this strategy on a weekly basis and then rebalancing after a week ? Some suggestions what should I consider in my stock screener any particular ratio etc would definetly help.
Also Thank You so much karthik, you content is amazing and one can easily learn stock market in detail from your courses without spending a dime on the financial influencers.
Thanks Nikhil. Glad you liked our content.
What you can do is to filter out the stocks manually. Run this only on say top 100 or 200 stocks and see how it performs.
Dear Sir,
When will the volatility based delta hedging strategy be published. It\’s been 5 years and am waiting…
Dont think I will, Tanush. It is a very expensive strategy and not suited for most. Plus the complexity is quite high in these strategies.
Hi Karthik,
That\’s fine, Is it possible for you to suggest some resources like books, academic papers and analyst reports related to \”volatility based delta hedging\”. So that I can try to map the concepts myself… It would really help me build my system.
I would also love to hear more about \”Volatility Arbitrage\” and \”Delta-Neutral Gamma Scalping\”.
Thanks,
Tanush
Ah, I need to dig through this a bit. Its been a while, let me check and get back.
Okay 👍
Hi Karthik,
Just following up on our earlier exchange about Volatility Arbitrage and related resources.
Were you able to find any materials or references on that topic? I’d really appreciate any pointers whenever you get the time.
Tanush, nothing that I can recommend. Sorry about this.
How to do adjustment for volatility in momentum portfolio
You need some volatility for momentum to sustain 🙂
Looks like bigger chapter but gives a lot of details. Even this is my big chapter on investing ever since.
I hope you found it useful, Nandisha. Happy learning 🙂
I backtested the simple momentum strategy from 2014 to 2023 on NIFTY500. Here are the results:
https://medium.com/@nkdhruw/ride-the-wave-unleashing-momentum-trading-in-the-indian-stock-market-3c962ea77bf7
I read through, your backtesting results are quite intuitive :). Would you like to publish this on Varsity Blog under your name?
Great post !!
I was checking streak for backtesting but I don\’t see any option to filter through stocks and sort by returns and rebalancing as well.
If you can help us with the options to backtest, it would be great !!
Thanks again for sharing this information.
Tejas, did you try connecting with Streak folks? I guess they can help you with this.
Hi Karthik sir,
Thanks for building this amazing module. Based on this module I have built trading system around this and making healthy profits. Can you please make more module like this say, momentum portfolio so it will be helpful for all of us.
Regards
Happy to note that Rakesh. Yes, we try and put up modules and chapters as frequently as possible 🙂
Sir In this strategy, do you think taking into account some of the technical indicators like RSI, MACD, ADX would help ?
Not that much, but you can probably experiment with few ideas to see how it goes for you 🙂
Sure sir. Already watched it when you uploaded it. And I watched it again. So it seems manual maintenance is also an option but time consuming. Got it. Thanks
Yes, it is time consuming, Sathish.
Your writing style is so good, I was able to complete the entire module within 2 days. Big salute to your work. I have 2 questions.
1. In the calendar spread chapter you have added a great point that should you be able to implement this strategy by screening all stocks, you would be able to find many opportunities more frequently. But given the fact that most oportunities come at the end of the month and the physical settlement rule, won\’t it complicate things like high margins requirements just to get small profits?
2. In the momentum strategy, you had mentioned that programming skill is needed. But I didn\’t understand where it is applicable exactly? I mean can\’t we manage the data manually? These days you even have options in Google sheets which fetches the last price with a easy code.
Thanks
1) Sathish, yes, high margins kind of mess up the opportunity. I\’ve not tested this recently, but it feels these strategies are better suited to close before expiry.
2) I recently made a video on this, check this – https://www.youtube.com/watch?v=eMuGV8t3ejo
Sir how can we apply this strategy on option calender strategy
Wow, thanks for your reply. This being an old article, I though my query will be lost in the sea of other queries, but I am surprised that I got the reply. Thank you again for your time and reply.
Got it. I will cut only the losers and replace them with the new stocks. And no the re ranking engine, as of now, didn\’t suggest too many replacements.
Good luck, Prasanth. Happy learning. We try an answer all queries and try not to miss, even if its an old article 🙂
Hi,
Great article, really useful! According to the article, I created a paper portfolio of 15 stocks with an initial capital of 15 lakhs, allocating one lakh towards each stock. It has been exactly 1 month since portfolio creation, and I have achieved returns of 1,80,006 (12.07%).
Now, it\’s time to re-balance the portfolio, and I find myself stuck with the following dilemma:
Invested value: 14,91,124
Current value: 16,71,130
Gains: 1,80,006
The question is:
After re-running the ranking engine, a few stocks need to be removed and replaced. How should I re-balance the portfolio and re-allocate the capital? Should I book profits from the top performers to make their value 1,11,408 (1/15th of the current value), so that the new portfolio will again have equal capital allocation to each stock?
Or
Should I keep the top performers as they are, cut only the losers, and allocate the freed funds to the new stocks? The concern with this method is that new entrants will receive less than 1 lakh capital, as we booked losses to free up funds for the new stocks. Consequently, the old stocks/early entrants will have more weightage in the portfolio, which may lead to accelerated losses if the top-ranking stocks start reversing. The later-stage stocks, despite performing well, won\’t have enough weightage to contain the portfolio losses. All the gains can be wiped-off before the next re-balancing cycle comes.
I hope I have made my query clear, and I apologize if it is not. Please help me out.
Additionally, it would be incredibly helpful if the article could provide an example with at least 2 re-balancing exercises.
Thank you!
Prasanth, thanks for articulating your query well 🙂
I understand the concern you have. One of the least complicated ways of doing this is to cut the losers and replace them with the newly suggested stocks from the re-ranking engine. Yes, this won\’t be equally weighted – your top stock will be heavy compared to the new ones, but remember the agenda here is to chase momentum, and we are hoping the bottom one catches up too.
The only reason why I suggest this is to not disturb your winners and you can continue riding the momentum. There will be times when you will have to rebalance 6-7 stocks…maybe at that point you can consider doing a full overhaul and make your portfolio equal weight.
Also on a side note, if the re ranking engine is suggesting too many replacements over consecutive months, then maybe the momentum is dying and the markets are getting choppy.
hi
can free float market capitalization be used as momentum indicator ?
also can you please suggest few backteting softwares or methods to perform momemtum back testing
How exactly do you please to use this as a momentum indicator? For backtesting, I\’d suggest you look at Streak.tech.
Hello Sir,
Whenever we have to calculate return it is always considered start and end date, now whether we consider yearly, weekly or daily, it should always be start and end, right ?
Regards
That\’s right, Rahul. You need start and end reference dates to calculate the returns.
Hello Karthik,
I am trying to mimic someone\’s smallcase momentum portfolio. I have used (a) Log (t-1/t-11), (b) Change from 200 DMA and (c) Distance from 52wh. But still I am not able to fully reproduce the same selection. What other parameters on price can we use to rank stocks? Your suggestions please.
Ah, I\’m not sure. By the way, can you check with sm on how they calculate the returns?
Karthik, thanks for your response.
1. What do you mean by \”Eq curve\”?
2. As a retail investor, without too much computing power, how do you suggest we do back testing? Any suggestions where we can get \”clean data\”? Links where we can download the info?
3. Ok.
4. Can you please give some reading material for portfolio variances? I was looking at this more for choosing stocks that have less volatility on a day-to-day basis.
Thanks.
1) A curve that plots the performance of your portfolio, I have explained that in later chapters
2) There are authorized data vendors who provide clean data, maybe you should check with them
4) Later in this module, there is note which explains portfolio optimization. Do check that.
Hello Karthik, I suppose these questions has been asked previously also.
a. Why do we need the data of a stock for a year when we were looking at point to point returns only?
b. Will an additional momentum measure like 6 months along with 12 months make the selection better?
c. Can we construct a portfolio using the stocks in the strategic indices like Nifty 200 Quality 30 etc? This will take care of the fundamentals and momentum.
d. Instead of looking at just the rate of change, will it be useful to add another measure to check volatility? Select stocks that are high on momentum, but low on day to day volatility.
1) You will need the time series to plot the Eq curve, else you get it.
2) Perhaps, but some back testing will help
3) Yes, you can
4) Yes, we do that with portfolio varience.
How do you calculate the returns for ranking the stocks. In your article, you have example of Asian Paint that, \”Asian paints have generated a return of 25.87%, which is the highest in the list.\” This is not monthly return as evident from the figures given. If it daily return then which day it is and how would you rank different stocks based on daily return calculation?? Could you please elaborate?
That\’s a regular way to calculate the return, Roshan. So if you get the daily return, for monthly return you need to multiply by 30.
Hi Karthik,
All strategies are amazing and they work too but limiting myself to knowing only certain strategies could be the worst thing I can do. Can you suggest some good books, web references and anything like that which will help gain understanding and knowledge of more and more strategies possible. Do you think integrating these 3-4 strategies beautifully into an algorithm is enough for making decent returns? How much maximum returns do you expect these strategies can make annually since leverage is continuously reducing? Are they even relevant in today\’s context?
Thank you.
Lakshay, yes you can integrate 2 or more strategies and build your own strategy based on your risk appetite. The expectation of return depends on how you tweak your strategy. As you can imagine, there are a number of factors that are involved in defining your profitability.
Thankyou, Also what are the two values that you have used in the table to derive the return percentage of Asian Paints to +25.87%
Thankyou, Also what are the two values that you have used in the table to derive the return percentage of Asian Paints to -25.87%
I\’ve mentioned the dates in the date column, Anuragh.
Hello Karthick
Couple of questions based in Momentum portfolios topic
1. For calculating yearly returns we need the data for the last 12 months like wise what is the ideal data required to analyse for a weekly , fortnight, monthly and Intraday stocks. Can you please give me the look back period for each seperately.
2. This question has been asked before but i haven\’t got a clarity yet so to calculate returns do we need to pick data for every month for a year or is it just enough to get the ending and start value as per the formula. Can you please elaborate that for better understanding.
Thankyou in advance
I would suggest, you stick to the end of day data, Anurag. I think EOD data is quite good and suits many different analysis that you intend to do.
i created a momentum trading strategy and let it trade for a few months.
My algorithm would check the bhav copy from NSE daily after market hours and calculate momentum and average true range for each symbol in the equity series. I would then shortlist the symbols which show increasing momentum and average true range and sort them based on its relative momentum (momentum/price). My algorithm would allow a maximum of 5 positions so if there were any holdings from previous trades, i would fill in the gap slots from the selection. Example, if i was holding 2 stocks from Monday on a Tuesday, I would place orders for only 3 stocks. The position size would be the same as the average positions size of the stocks in the portfolio. I had a variable trailing stoploss ranging from -5% to -0.5% so if the stock is trading above 15% trailing stop loss would be 0.5%. I let this \”strategy\” run for a couple of months and the returns were -100% as in i lost all my money 😶.
Sourav, I think you\’ve overengineered this. Btw, why do you want to rejig this on a daily basis? Momentum by definition should run – at least by a few weeks right? The purpose is defeated if you keep changing the stocks so frequently.
Hiii, excellent write up.. pl opine about 🔸momentum ( +ve 200D SMA + >50% of positive daily return ) + 🔸low volatility ( high Beta ) to overcome less churning even in bear or sideways market… Thanks, Sir
Sounds like an interesting combination. I\’d suggest you do some backtest to see how the results pan out.
Hello, how to arrive at Sharpe ratio of a given stock.. not on total portfolio..
Thanks
Its the same way, nothing changes really. Instead of the expected return of a portfolio, use the expected return from the stock.
which programing skill is required for momentum strategy build up?
I guess Python is heavily used by traders these days.
I am not a coder so can I use Zerodha platform \”streak\” for algo trading
Yeah, you can. You don\’t need coding skills to use Streak.
Karthikji,
When can we expect the addendum that you had promised on handling volatility factor? Also, can you please suggest some good books on various momentum strategies with volatility factor being considered? Thanks in advance.
I\’m not sure of books on this topic, Shankar. Let me check on the addendum.
Hello,
here we define momentum as rate of change i.e returns by a stock is increasing eg – acceleration .
But the formula above is using returns for 1 year to get top stocks. Should it not be that selection of stocks whose returns are increasing for past \’x\’ period.
Yes, its the rate of change measured over 1 year. You can shrink this to any time frame you want.
Dear Karthik,
Thank you for writing such an informative article. I use Zerodha for investment in equity and Mutual Funds (COIN). Recently I came in contact with Mr Alok Jain of weekend investing. Com through Twitter and developed interest in momentum based strategy. More I read/learn about this strategy I feel less I know. Let\’s see how it goes. Thank you once again for sharing vital information to start with.
Regards
Happy learning and investing, Dr.Singh!
Greetings Karthik.
I have another follow up question, this is about to volatility.
will it be better to select stocks that are decreasing in volatility (measured by ATR) on a day to day basis or select stocks that have increasing volatility, along with increasing momentum ?
If active trading is what you are looking for, then higher volatility with momentum is what you\’d want.
Hii Karthik its great module please keep adding more Strategy it will be great..
I have some queries regarding data
1. I downloaded clean data from supplier but adujsted close price is different from close price on day to day basis. Corpor6 events doesn\’t happen everyday then why adusted close price is diffrent from close price. source: https://www.alphavantage.co/query?function=TIME_SERIES_DAILY_ADJUSTED&symbol=RELIANCE.BSE&outputsize=full&apikey=demo
2.If you can suggest some cheap data supplier Historical as well as live.cheap because I\’m still in learning phase so its not good to bleed before earning i hope you can understand…
Thank youu and kee sharing knowledge…
1) Adjusted close is the close price provided by the vendor. You just need to ensure the data is cleaned for corporate actions
2) I\’m not really sure as I don\’t use a data vendor service.
Hi, I have more questions if you have the time.
Q1. what parameters should we use to screen stocks for my momentum portfolio. Right now what I am doing is,
mom = most recent close price – close price X days before
then dividing that mom value by the close price, so that we can compare momentums between say MRF and SUZLON.
I am doing this for all symbols listed and then ranking them from highest to lowest, the I am select top 10 symbols which forms my portfolio.
is this how it is done ?
Thanks in advance.
Thats correct. Maybe you can define your selection universe…say restricting to top 100 stocks.
@Karthik
About the question asked by Varun about a stock becoming a multibagger, in an equal weight portfolio, would we not sell this multibagger and distribute the gains among the loosers so that all of them have the same exposure ?
Example:
stock 1 : exposure = 5000 gain = 700
stock 2 : exposure = 5000 gain = 100
stock 3 : exposure = 5000 gain = 40
after rebalancing
stock 1 : exposure = 5280
stock 2 : exposure = 5280
stock 3 : exposure = 5280
rebalancing by summing up all the gains and spreading them across all the stocks in the portfolio.
Is this the right way to rebalance an equal weight portfolio ?
You are right, for this investors often don\’t rebalance stocks, especially the ones earmarked as long term investments.
Hi,
Greetings.
I was reading up on momentum trading strategies and a research paper talks about skipping the most recent month data for a yearly momentum strategy. Do you know what and why this is ?
https://papers.ssrn.com/sol3/papers.cfm?abstract_id=3247865 3.1 (Strategy: Price-momentum)
Hmm, not sure why to skip recent data. Maybe you should read this with a larger context.
Hi Karthik,
Thank you for illustrating the concept of momentum portfolios.
Regarding step 6- rebalancing the portfolio, if at the end of one month say one of our stocks becomes a multibagger(let\’s say > 20% return), how exactly do we rebalance the portfolio ? Because as per the momentum strategy, we shouldn\’t sell it, however it is now a bigger percentage of our overall portfolio and the portfolio will no longer be equally weighted
Thanks
In this strategy, you continue to hold the stock. You basically sell the losers and hold the winners. So the rebalance is performance-based, not on the weightage.
I have tried to open an account with Zarodha, but after uploading photo of cancelled cheque, I was redirected to start position. ?????
Sushil, I\’d request you to please contact the support for this.
Sir if I need to take 1 year as look back period then today Feb 2nd 2020 to Feb 2nd 2019
Or
1st feb 2019
Since month has started I can\’t build portfolio now and I need to wait till the month end
And I think this type of started will be great when used in market conditions like now which we are seeing
Always go back 1 calendar year back, Chandu. Keep that as a reference, actual dates do not matter.
Hello Sundeep, can you shed some light on how you set up your momentum based portfolio, i.e. where did you get the data from. I currently don\’t have office 365 so I am confused as to where I can get live market data to track momentum. Any help would be greatly appreciated!
How do we re-balance an \”equal weight\” portfolio in following example?
While rebalancing, suppose Stock-A is out and Stick-B is the new stock to be added.
Do we sell A and invest the proceeds in B, or re-balance the whole portfolio to equal weight?
These are short term portfolios which are rebalanced on a monthly basis anyway.
How to rebalance portfolio can anyone pls elaborate
Say it was equally weighted one stock has given 50% return n has now lost momentum new stock has come now how to allocate
You run the momentum check every month and include the latest one and replace the one which is not performing.
Sir, I wanted to know the reason why did you mention that we\’ll need a coder for this?
Because it\’s quite hard to do this manually and also update this regularly 🙂
Awaiting for Delta Hedging module
HI Karthik,
Couple of questions below
1. If we are only calculating yearly returns, then why do we need to have 1 year data and calculate daily returns? If I plot the daily returns for 1 year, it\’s just a zigzag(up-down) line with no pattern as such.
2. Can we combine the price based strategies with other indicators like RSI, EMA crossover etc?
3. How do you backtest the strategy as the portfolio keeps changing every month
Thanks,
Mohammed Sunasra
1) Yes, in fact, I\’ve suggested the same when I took ABB as an example
2) Hmm, probably, but I\’d avoid mixing indicator with an exception of EMA
3) This is tough to do manually, hence the need to know programing
Hi Karthik, you mentioned wall feature in phone app, I do use zerodha on iphone. Didn’t come across this, what is this feature about? Thanks
The Wall is to share opinion or short insightful articles related to markets, trading, and investment.
Hi Karthik,
By \’yearly\’ returns do you mean we just have to calculate % change between the closing price from start of the year to end of the year and shift the window every month? Also, should we have a stoploss for each stock in the portfolio? If yes, what should be the method to calculate it.
Thanks,
Mohammed Sunasra
Thats right, thats how you calculate the returns. There is no SL on a individual stock basis, but there is no harm adding that as a risk measure.
Yes, this is good strategy. However, I would recommend following changes.
Please use 1 year annualized sharpe ratio to rank stocks. Do not select a stock of sharp ratio is negative. Also, LTP should be above 20DMA-LOW.
Keep a hardstop loss for portfolio when nifty500 closes below 20DMA-LOW
Sure Subodh. This is just a starting point and you can build on this.
Sir, Why didn\’t varsity app have all modules?
We are updated the app one module at a time.
Dear Kartik I found the subject is much interesting and more technical too. At this developed market , anybody have developed algo, screener on this so that we can subscribe.
Binod, you can look for momentum-based themes on smallcase which packages the concept of momentum and offers a portfolio.
Sir, while ranking the stocks in for building momentum portfolio, do we need to rank them based on Absolute Return? Or on the basis of Average return of the daily return? I am sorry, I am really confused.
Absolute return will do, Dhruv.
Hey there, Karthik!
I am very much Intrigued by this method. You shall be appreciated. Can we apply this method in these days? Because recently market was distorted and there may be misperceptions about the market, I think.
Yes, you can Chay.
Hi Kartik
Great post..
I had one question about creating my own tracking universe. Let\’s say I want to create filters based on market capitalization. Also, I want to back-test my strategy. Currently, I am unable to find historical time-series of market cap. data for the listed universe. Can you tell us what are the best sources (preferably free) to get historical market cap. data?
Thanks
Ah, I\’m not sure. Maybe you should check with folks from Screener.in. Alternatively, since you know the share capital, maybe you can do this yourself.
Hello Karthik, 🙂
I have been trying to become a short-term (< 1 day – 7 days) momentum trader ideally. Had an interesting lesson with NDTV recently. I bought some stocks and it did a U-Turn. Every day it would hit the lower circuit before I could sell them. Even AMO didn't work. Good that I learnt the lesson sooner than later.
I have finished reading most of the previous modules here with some exceptions. I hope I am ready at least somewhat. I am a programmer and also building a custom screener too to identify good trades. It's working but I can think of a lot of features to add to it to make it smarter.
Questions time. 😀
#1: Are these market spread opportunities really available these days? It seems like bots probably should have already diminish them by now.
Spreads are available, just that it gets filled and disappears at the blink of an eye 🙂
Hi karthik,
Throughout this Module you have emphasized on getting clean data. Can you explain what it means. What is \” adjusted for corporate actions like the bonus issue, splits, special dividends, and other corporate actions\”. Please explain.
A stock trading at 500 gives a 1:2 split, that means the stock price reduced to 250. This reduction is due to the split and should not be mistaken for a 50% crash…so the data has to be adjusted for this from the start. This is called adjusted for corporate action.
Hey karthik
Can you tell me how to adjust stocks for any split, bonus issue or any corporate event in the moment strategy. And you are talking about programming skill to build that , what about tickertape ..
Thanks
AK
Yeah, tickertape gives you the adjusted data.
Thank you Karthik sir
I am gone through varsity in lockdown period and I am found it very useful . After reading this I personally feel that trading and investing is vast concept , You should think in different way than others .
But I have question , Can we consider Trading is business because we have to deploy capital and we have to innovate new strategies to make money although old strategies work but to make difference between us and other traders?
Thank you once again.
Like in any field, continuous innovation is required here as well 🙂
Karthik, at the current moment the ATM options for June 4 expiry have a IV for 30 and 15 for the Puts and Calls respectively. So can a pair trade be established assuming that either of the one will revert to its mean original position? And if yes, how?
Thanks!
Hmm, but how would you don that Ram? YOu cant pair trade calls and puts, these two are two different options and the drivers for these are different.
Hi,
You mentioned here that data should be clean and adjusted for corporate actions. What does that mean? How can I do it?
It means that the data should be adjusted to splits, bonus, special dividends, mergers, and acquisitions.
sir please translate remaining module in hindi..we will be very very thankful to u for your kindness w
Working on it, Anchal.
Yes, i meant shorting it in futures. Do you think undertaking this kind of a long-short momentum strategy would result in better results than just the long strategy?
Hmm, I\’d suspect yes, but you will have to account for transaction charges and taxation.
Sir,
What if along with longing the top gainer stocks, we short the top losers also?
That becomes a long-short strategy. Unfortunately, you cannot short the stock in spot and roll it over many days.
what is algo trading
A set of instructions to perform a task is called an algo. For example, buy when 50EMA crosses over 100EMA is an algo. The same thing when automated results in an algo trade.
hi sir,
I was wondering why u did not tell to short the stocks which are not performing well so can we create a bigger universe of say of fifty liquid stocks and long top 5 and short the bottom 5 performing stocks but as i have been trading in the markets from my experiance shorting a good company despite of the fact it has performed badly for the last couple of months could be very risky and in ranking there will some good compony wich will come in radar of shorting .so sir how to create ranking to avoid this , one way what i thought was craeting to raning scheme one for long only stocks and in this scheme we create a universe of good compony and go long top stocks and craeting a week stock universe and short the worst-performing stocks in week stock universe do u think it is a good idea
You cannot short and carry forward the position, Sahil. This is not possible. You will have to do this (shorting) in futures, which is capital intensive.
Sir, what\’s the coding role here if it involves calculating and ranking returns on a monthly basis.
Life will be much easier if you can code and rank all the 500 stocks at once instead of doing it manually for all right?
If it is dependent on each stock,can I get an idea to find SL….For example,if the stock is AXIS BANK,how will you try to find the SL for this momentum based strategy?
What should be the stoploss for each stock for holding period of 1 month and lookback périod of 1 year?
This is dependent on the stock, Karthik. We cannot generalize this.
Hello Karthik,
Thanks for the pair trading strategies and I have gained some bucks by executing axis bank Vs ICICI bank and hdfcbank Vs HDFC.
My question is what is the minimum correlation needed between two stock to execute pair trading.
And if I follow all the f&o stock , how many pair trading opportunities will I found on a year approx??
I\’d suggest you look for correlations higher than 0.85. I think a good pair will give you around 3-4 decent signals in a year.
Which sock has a higher momentum?
*Please correct the typo 🙂 Which STOCK has a higher momentum ?
Done 🙂
Sir, could you please elaborate on how we could do intraday momentum portfolio?Could you give one or two variations as examples?
It is the same way, instead of running the returns engine every month, you\’d do it every day and rank. Buy the stocks in the morning and sell by EOD.
Hello Karthik,
A big thank you to you and your team for Zerodha Varsity.
I have a request, if its possible please do a series on Trade Life Cycle. Using some examples from zerodha kite.\’
Thanks,
Shilpi
Thanks for suggesting, Shipi. What are you trying to look for in this topic?
thank you sirji , i appreciate your hard work
Happy reading, Vimal!
sirji when it will be availabe for download ?
This week, Vimal.
Still sir, I consider you my mentor as I am sure many people in this community would. I am just curious to know what it is, psychologically that sets a winning trader from a losing one.
Like everything else in life, I think disciple plays a key role in trading and investing. You need to structure a plan, develop with all conviction and stick to it. I often see people do the first part but fall through majorly when the sticking to the plan part kicks in. This is where I think the discipline bit plays a key role.
Sir I have been greatly enjoying varsity. I do have a question. In all these years of trading, what do you think is your personal edge (psychologically) that you think has enabled your success? Can you please talk s bit about it? Thank you.
enabled your success –> I don\’t think I have had great success in either trading or investing. I\’m learning along with everybody else here 🙂
Thanks for taking time for creating this. They are pretty interesting too. Certainly you will be busy. But, would you take time to upload the pdf?
Hari
Yes, Hariharan. Will try and get this PDF uploaded in the coming week.
Awesome modules (all 10). I understand you are busy with a lot of stuffs. Thank for taking time out on this time and again
Cheers and safe trading 🙂
Its a pleasure, glad you liked it 🙂
Karthik I know it would be unfair of me to ask you what stocks you have in your portfolio. But I am a little bit confused about portfolio allocation. I get a bonus at the end of the year and i do not know where I should invest, if the stocks I have researched have crazy valuations. So, could you let me know what exactly is the portfolio allocation that you divide between Equity, Bonds, Derivatives and any other, if any? Thank you.
Sumit, its not like I don\’t want to disclose the stocks that I have in my portfolio, but then it will bias your opinion. For that reason, I\’ll refrain 🙂
Btw, I\’m a 100% equity guy from now…so whatever little I have saved up goes to direct stocks and MFs.
As far as the crazy valuations are concerned, you will have to just wait and time it well 🙂
Karthik i do understand what you\’re saying. But what i wanted to know was, events like bonus, interest income come regularly and I do not know how to allocate it if the process are high. I just wanted to know what kind of portfolio management you do. A flowchart or some pointers would be very much appreciated. Thank you.
My analysis largely revolves around understanding the financials and the business of the company, Sumit. An integral part of this is understanding the management quality as well. The other factors are just a by-product of the investment decision.
Also I do have one more question sir. You said descriptive statistics is essential for quants. Which is the best starters book for learning descriptive stats? Just one or two books would suffice. Thank you sir.
I find the first year BSE Mathematics book good for this 🙂
I am not kidding but this happend today.
BNF is -300 in spot
BNF 32400 CALL is up by +100 which is 1500%
How is this possible?? and please make me understand the technical reason behind it?
This is because of the volatility, Jagadeesh. Since the volatility is high, the premiums are shooting through the roof.
Sir I wanted to know which sectors in Indian equity are cyclical? And how do i study the cycles in market sectors?
Most of the business (barring health care and education) are cyclical in my opinion. Business involved with commodities are (BPCL/HPCL/Hindalco etc) are all cyclical in nature.
Sir could you please expand what exactly cyclical means? And would you point me towards how one would go about studying the cyclicality of sectors? Thank you.
Cyclical business is those which have seasonality in earnings. For example, people tend to buy more ACs in hot summers than cold winters. Hence, companies selling ACs tend to make more sales in summer. This is a cyclical business. So any business which displays such earning patterns is called a cyclical business.
Thank you for the reply sir. I just wanted to know, how to find out the cyclicality of particular stocks that are in my portfolio?
I\’d suggest you read the Management Discussion and Analysis in the Anual report, if the business is cyclical, the management would state it themselves. Alternatively, you can check the last 10 years revenue numbers and you should be able to identify trends and cyclicality.
Sir, I am great fan of your teaching, and want to lean algo trading, please add some chapters on algo trading from basic (including topics from excel algo, amibroker, streak etc). I am not able to find from where should I start and build my system in a economical way. Please add chapters from start to end like you did for every topic in zerodha varsity.
Thanks Satyam. I will try my best to do that, however, algo trading involves quite a bit of programming which I don\’t know. Will try and see if I collaborate with someone for this. Thanks.
Sir also, you have recommended me some amazing books like Mastering the trade, Little book of valuations.. Etc. If I\’m being honest, I am s better trader now because of that book. It taught me how to fix my psychology. Of course varsity taught me the abcs of Stock markets. I had requested you put out the comprehensive books you think would help traders? I would really love to read more sir. Thanks for all your service. Greatly appreciated.
I\’m super happy to note that you read and enjoyed the books 🙂 Will certainly try and put up a list of books.
Sir I\’ll certainly wait for your list. But since I have some time on my hands right now, would you recommend 3 advance trading books that you think might be useful? Thanks a lot.
I\’d suggest you start with Alexander Elder\’s – Trading for a living. Its a classic book.
Sir I am trying find 3-5 different different stocks from different sectors that do not have any correlation to each other. My question is, how do i find the relationship between different sectors?
Sundeep, instead of finding sectors and being subjective, maybe you should run the correlation test and figure out the actual value.
Sir you mean correlation test between the stocks present in the portfolio?
Yup. Select the universe and run the correlation test.
Sir out of topic question but wanted to ask your opinion on Quantinsti Epat course if you know about it….?
Is it worth the price..- 2L?
I\’m really not sure, Nikhil. However, I\’ve met the guys who run Quantinsti and they come across as really good in their domain.
Hi Karthik,
I have started working on creating and testing a trading system which trades \”With Trend Pullbacks\”.
I was able to do this using technical analysis by looking at candlestick charts but after going through your modules I want to adopt a more staistics oriented approach.
Could you suggest something on how to go about creating a pullback entry system using a statistical approach.
Any help in this direction will mean a lot.
Kulbir
Kulbir, the classic approach to get you warmed up is by testing the mean reversion strategies. Measure the average, figure where the stock is now wrt to the standard deviation and then estimate the reversion.
Hi Karthik,
Thanks for your reply.
I was not able to get what you meant by: \”Measure the average, figure where the stock is now wrt to the standard deviation and then estimate the reversion.\”
Are you suggesting something with respect to a pullback system, can you please elaborate a little ?
Kulbir
I\’m talking a simple mean reversion strategy, Kulbir. All you have to do is figure out the current market price of the stock and estimate how many SD away it is wrt to the mean. The general perception is that stocks which have deviated away from the mean tend to revert to mean. You may want to test this hypothesis across different stocks and indices.
Sir what is the first chapter in next module and when is it coming out? I\’m just very eagerly waiting.
Will start work on that soon, Sundeep.
Awaiting for next chapter keenly Sir on Managing Personal finance and mutual funds
Will start work on that soon, Sankar 😉
sir, I read all your chapters on trading systems thankyou for explaining concepts with utmost simplicity u explained these strategies and these strategies in an academic paper are written in so much mathematical rigour that its harder to understand .as u shared your experience with the readers and u keep stating that u lack coding skills I learnt python programming in 5 months and its very easy nowadays . programming has gotten to simplicity that we just have to apply some functions and conditions to get strategy backtested and then implemented .ok a bit more complex but still easy and there are IDE just to backtest and implement trading strategies so implementing low to medium term frequency strategies are even more simple with the trading IDE and API so from my experience learning also trading i would advise u to learn to programme
Hey Sahil, thanks for the kind words and encouragement 🙂
I\’m guilty of not taking the efforts to learn to programme. But from what you say, it seems doable. Hopefully, I should motivate myself to dabble with it soon. Thanks for letting me know 🙂
Hi Karthik sir,
First of all I want to thank you a lot for posting all this content in such a logical manner in Varsity. This has been very helpful to me and I am sure to many other traders like me. Please keep contributing to trading community in the future as well.
I have started reading your module on Trading Systems and would like to learn more about quantitative trading systems.
Previously you suggested this book(Quantitaive Value Investing by Joe Marwood), this book is good for investors , but could you also suggest other books which have quatitative trading strategies discussed for swing traders or short term traders. You can please suggest some advanced books as well, I am sure I will be able to handle them after going through your content in Varsity.
Your guidance will be greatly appreciated.
Kulbir
Kulbir, thanks for the kind words. Unfortunately, there aren\’t many books related to Quant trading strategies. Let me run through my list once and get back on this.
Hi Karthik,
Could you find any books on Quant trading from your list ?
Kulbir
No, not actually. However, I think you should check this book for some insights – https://www.amazon.in/Hedge-Modelling-Analysis-MATLAB-Finance/dp/1119967376
I\’ve had the good fortune to be David\’s student 10 years ago.
Thanks Karthik
Hi karthik,
I Would like to know whether,if we download Bhav Copy Archive of Historical Data for any Scrip from BSE/NSE. Do they Adjust all corporate actions like Stock Split,Dividend,Bonus issue etc. Inorder to perform BackTesting on a particular Scrip say from 1999 to 2019.How can we rely on that Data?
Regards
Harish
Harish, Bhav copy is for the day and it just shows the change in price wrt to the corporate action. I personally think its best to look for the data from an exchange authorized data vendor.
Sir, how to calculate 1 year return… is it the algebraic sum of daily returns over the year? Or is it just with the two values at the start and end of the year?..If it is the latter then, could please verify the example calculation of yearly returns of ABB that you have shown.The ending value is wrong when taken from the table in step 3.
If the return is for less than a year, then a simple absolute return will do. Yes, the start and end of year value will do. Can you please quote the numbers that you are seeing? I\’m unable to figure.
\”Return = [ending value/starting value]-1
= [1244.55/1435.55]-1
= -13.31%\”
I Just wanted to know if the ending value is the close price on 6th March 2019 which is not specified in the sample tracking universe table.
Sir, and also why do we need the entire 1 year historical closing prices to calculate the yearly return of a stock .What if we get to know only the starting and ending closing prices for that period or year?
You need daily returns to see the trend. Starting and ending values gives you the absolute return.
Thats right Karthik, the ending value is the closing price on the last day.
Sir, how should we judge the momentum of stocks with daily returns over a period of 1 year after finding the yearly return for that year.Can u give me the logical explanation such that I can program it because the daily returns are sometimes negative and sometimes positive unlike the example of consistent positive returns you have illustrated?
Karthik, frankly I just took a set of random stocks. If you think about it, stock selection should not really matter since you rank the returns anyway.
Sir,do you mean it is enough to rank the stocks in the trading universe based on yearly returns and then assume that stocks in top have good momentum and can be held for the 13th month(or next one month)?
Yes, this is one of the many ways you can define momentum.
Sir, I have been live testing momentum portfolio and thanks a ton for this chapter. My question is, I want to get more into Quantitative Trading and want to learn more like the Pair Trading strategies you\’ve put up. What do I start for this? What kind of Statistics do I start learning?
You need to know the basic of descriptive statistics, Sundeep. The ones that I have explained is the starting point for this. I\’d suggest you pick up from here and learn more in that direction.
Perhaps this
https://www.quantopian.com/lectures
Resourceful! Thanks for sharing!
why i can not downlod this module in pdf ?
all other module downlode in pdf then why is not ?
We are yet to make this as a PDF, working on it.
sir if u can it would great if u can show the use of kalman filters for pairs trading in one chapter
Ah, that can be a little tricky. Will check though.
can u please provide the pdf for this module?
Looking into that Somi, will update soon.
Dear sir ..what will be the next module… I wish if it could be on mutual fund and fixed income / debt markets
That\’s the plan. Hopefully soon 🙂
Hi Karthik,
Thanks for putting in the efforts to compile this module on Trading Systems.
You discussed Calendar Spreads in great detail and also discussed Momentum Portfolios.
Do you think that you can add other trading systems to this module , for example Mean Reversion Systems and Trend Following systems ?
Kulbir
Kulbir, pair trading is mean reversion and trend is momentum portfolio 🙂
Karthick, Is there any way to download historical data for multiple stocks at the same time??. From the nse website , I can download only one stock at a time, I am looking to download historical data for 200 stocks at the same time as I am planning for a 200 stock universe
Sadha, I think you should check with an NSE approved data vendor for a solution for this.
Karthick,
I have searched over the internet for the past few weeks and could not able to find one.
Can you please help me and provide me a link where I could download historical data for multiple stocks at the same time??.
Please note : I have not tried excel macros kind of things, is this can be downloaded only by this way?
You can use this link – https://www.nseindia.com/products/content/equities/equities/eq_security.htm
But this is one scrip at a time. For multiple stocks at the same time, I think you will have to speak to a data vendor.
Sir, could you please guide as to how to download historical data for momentum protfolio? I am struggling with this. Also how does one identify if the trend is not up and when to sit in cash? thanks
Ankit, the easiest way is to download from NSE, check this – https://www.nseindia.com/products/content/equities/equities/eq_security.htm
Dear Karthik,
I wonder where to put stop loss in momentum strategy?
in case I have intraday momentum portfolio, what shall be my stoploss?
You can keep a 2% SL at a portfolio level, Arun.
Hi,
This article was awesome, Karthik. Would appreciate if you could give the link of PDF download for module 10
We are working on the PDF, should be up by next week or so.
Hi, Sir,
Coincidentally i was reading a book called. \” Stocks on the move by Andreas F. Clenow\”. Awesome book on momentum strategies.
Thank you as always for your efforts to make us understand jargons in a very simple manner.
Sir, Happy to see you in writing back. We, lot of individuals reading this but has fear in investing trade market. Hence, please write on Personal Investing on the next module. My humble opinion. Thanks
Sankar, I\’m happy to hear that. The next module that I\’m thinking about is more on personal finance, including topics on mutual funds.
Eagerly expecting topics on Personal finance like how to allocate money in different instruments and mutual funds pros&cons. I know many friends who had reasonably lost money in share market. I am sure that those read this VARSITY may or may not gain money but they will not lose money. Great and different approaches taught by you is mesmerizing. Although I am an engineer, the way you thought us about straight-line equation is superb and thought provoking. No book can teach like this. Thanks
Sankar, thanks for the kind words. I\’ll put my best efforts to put up a good module on PF.
Sir correct me if I\’m wrong but this is one of the longest chapters in varsity and I enjoyed reading it in one sitting. I\’m currently in the process of back testing the portfolio based on momentum. What would the next chapter be about sir?
I\’m glad you could read through it in one sitting, do share the backtested results if you are comfortable with it 🙂
This module ends with this chapter. We are moving ahead with the next one.
At present I am investing on long-term basis and good results and very much Happy with the returns. I want to start trading shortly and watching articles related… thanks… waiting further.
Good luck, Shakeel!
Sir,
Thanks for an this topic was waiting for it to be covered..
According to you which is the best source to get eod data which is adjusted of splits and bonus for bse 500 stocks apart from nse/bse websites.
And secondly you said u need a coder to get a this strategy working can u share excel sheets to calculate momentum score as you did for pair trading chapter
Thanks
Nick, there are plenty of data vendors who provide you clean data. I\’d suggest you subscribe to any of them. Unfortunately, I was unable to produce the excel, hence I took up the example of 10 stocks.
When will Varsity Android app launch.. waiting for it..
Here you go, Ankit – https://play.google.com/store/apps/details?id=com.zerodha.varsity&showAllReviews=true, please don\’t forget to rate us on play store 🙂
Hey thanks sir.. app is awsum.. hopeing for all the modules to be added soon.. and even the new app of kite 3 is awsum.. thanks alot…
I\’m happy to note that, Ankit! Lots of efforts towards building these apps 🙂
Yes, eventually all the modules will be added to the app. Did you check out the wall feature?
h1
Dear sir,What about volatility based delta hedging strategy?
Kehav, perhaps I\’ll add that sometime as an addendum. Moving forward onto the next module.