
13.1 – Tracking the pair data

We have finally reached a point where we are through with all the background theory knowledge required for Pair Trading. I know most of you have been waiting for this moment ☺
In this last and final chapter of pair trading, we will take up an example of a live trade and discuss factors that influence the trade.
Here is a quick recap of pre-trade theory –
- Basic overview of linear regression and how to perform one
- Linear regression requires you to regress an independent variable X against a dependent variable Y
- The output of linear regression includes the intercept, slope, residuals, standard error, and the standard error of the intercept
- The decision to classify a stock as dependent (Y) and independent (X) depends the error ratio
- Error ratio is defined as the ratio of standard error of intercept/standard error
- We calculate the error ratio by interchanging both X and Y. The combination which offers the lowest error ratio will define which stock is assigned X and which on as Y
- The residuals obtained from the regression should be stationary. If they are stationary, then we can conclude that the two stocks are co-integrated
- If the stocks are cointegrated, then they move together
- Stationarity of a series can be evaluated by running an ADF test
- The ADF value of an ideal pair should be less than 0.05
Over the last few chapters, we have discussed each point in great details. These points help us understand which pairs are worth considering for pair trading. In a nutshell, we take any two stocks (from the same sector), run a linear regression on it, check the error ratio and identify which stock is X and which is Y. We now run an ADF test on the residual of the pair. A pair is considered worth tracking (and trading) only if the ADF is 0.05 or lower. If the pair qualifies this, we then track the residuals on a daily basis and try to spot trading opportunities.
A pair trade opportunity arises when –
- The residuals hit -2 standard deviations (-2SD). This is a long signal on the pair, so we buy Y and sell X
- The residuals hit +2 standard deviation (+2SD). This is a short signal on the pair, so we sell Y and buy X
Having said so, I generally prefer to initiate the trade when the residuals hit 2.5 SD or thereabouts. Once the trade is initiated, the stop loss is -3 SD for long trades and +3SD for short trades and the target is -1 SD and +1 SD for long and short trades respectively. This also means, once you initiate a pair trade, you will have to track the residual value to know where it lies and plan your trades. Of course, we will discuss more on this later in this chapter.
13.2 – Note for the programmers
In chapter 11, I introduced the ‘Pair Data’ sheet. This sheet is an output of the Pair Trading Algo. The pair trading algo basically does the following –
- Downloads the last 200-day closing prices of the underlying. You can do this from NSE’s bhavcopy, in fact, automate the same by running a script.
- The list of stock and its sector classification is already done. Hence the download is more organized
- Runs a series of regressions and calculates the ‘error ratio’ for each regression. For example, if we are talking about RBL Bank and Kotak Bank, then the regression module would regress RBL (X) and Kotak (Y) and Kotak (X) and RBL (Y). The combination which has the lowest error ratio is considered and the other combination is ignored
- The adf test is applied on the residuals, for the combination which has the lowest error ratio.
- A report (pair data) is generated with all the viable X-Y combination and its respective intercepts, beta, adf value, standard error, and sigma are noted. I know we have not discussed sigma yet, I will shortly.
If you are a programmer, I would suggest you use this as a guideline to develop your own pair trading algo.
Anyway, in chapter 11, I had briefly explained how to read the data from the Pair data, but I guess it’s time to dig into the details of this output sheet. Here is the snapshot of the Pair data excel sheet –
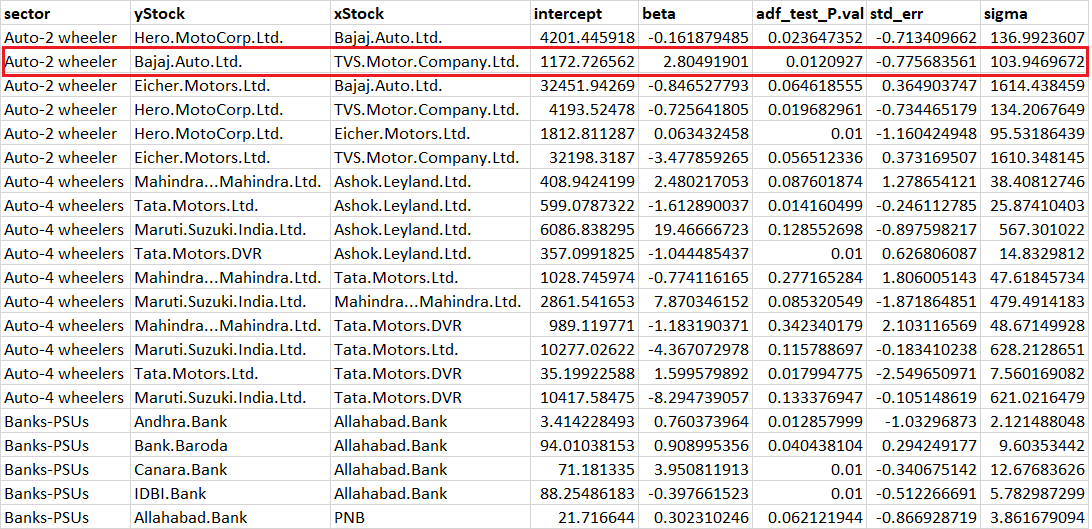
Look at the highlighted data. The Y stock is Bajaj Auto and X stock is TVS. Now because this combination is present in the report, it implies – Bajaj as Y and TVS as X has a lower standard error ratio, which further implies that Bajaj as X and TVS as Y is not a viable pair owing to higher error ratio, hence you will not find this combination (Bajaj as X and TVS as Y) in this report.
Along with identifying which one is X and Y, the report also gives you the following information –
- Intercept – 1172.72
- Beta – 2.804
- ADF value – 0.012
- Std_err – -0.77
- Sigma – 103.94
I’m assuming (and hopeful) you are aware of the first three variables i.e intercept, Beta, and ADF value so I won’t get into explaining this all over again. I’d like to quickly talk about the last two variables.
Standard Error (or Std_err) as mentioned in the report is essentially a ratio of Today’s residual over the standard error of the residual. Please note, this can get a little confusing here because there are two standard error’s we are talking about. The 2nd standard error is the standard error of the residual, which is reported in the regression output. Let me explain this with an example.
Have a look at the snapshot below –
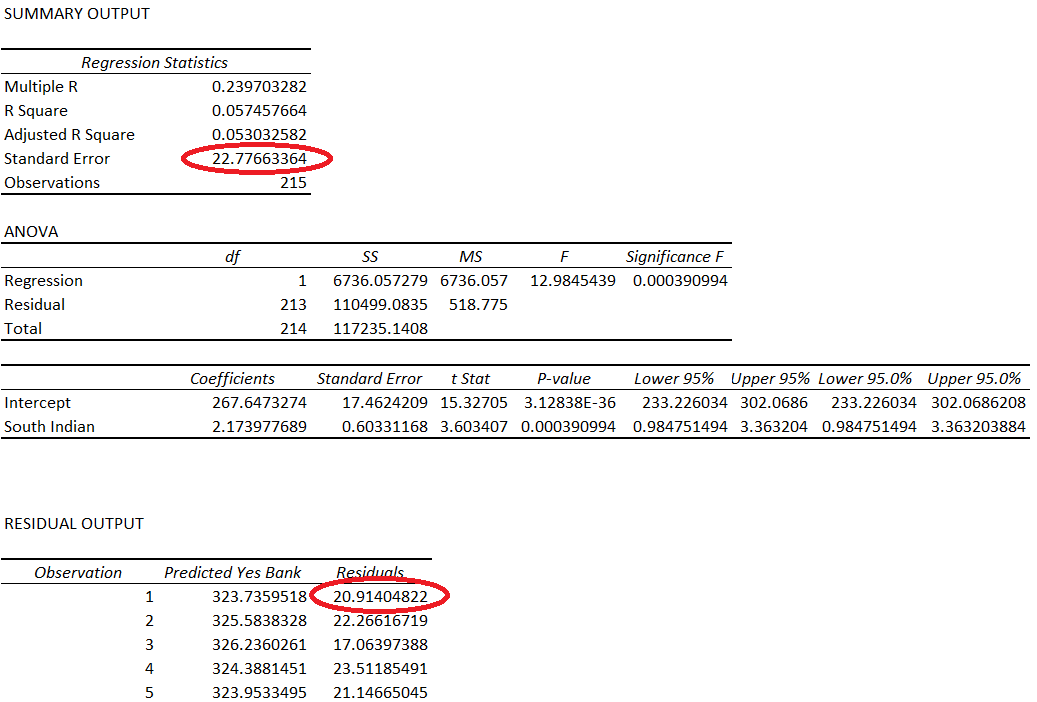
This is the regression output summary of Yes Bank versus South Indian Bank. I’ve highlighted standard error (22.776). This is the standard error of the residuals. Do recollect, we have discussed this earlier in this module.
The second highlight is 20.914, which is the residual.
The std_err in the report is simply a ratio of –
Today’s residual / Standard Error of the residual
= 20.92404/22.776
= 0.91822
Yes, I agree calling this number std_err is not the best choice, but please bear with it for now ☺
This number gives me information of how today’s residual is position in the context of the standard distribution. This is the number which is the key trigger for the trade. A long position is hit if this number is -2.5 or higher with -3.0 as stop loss. A short position is initiated if this number reads +2.5 or higher with a stop loss at +3.0. In case of long, target is at -1 or lower and in case of short, the target is +1 or lower.
This also means, the std_err number has to be calculated on a daily basis and tracked to identify trading opportunities. More on this in a bit.
The sigma value in the pair data report is simply the standard error of the residual, which in the above case is 22.776.
So now if you read through the pair data sheet, you should be able to understand the details completely.
Alright, let us jump to the trade now ☺
13.3 – Live example
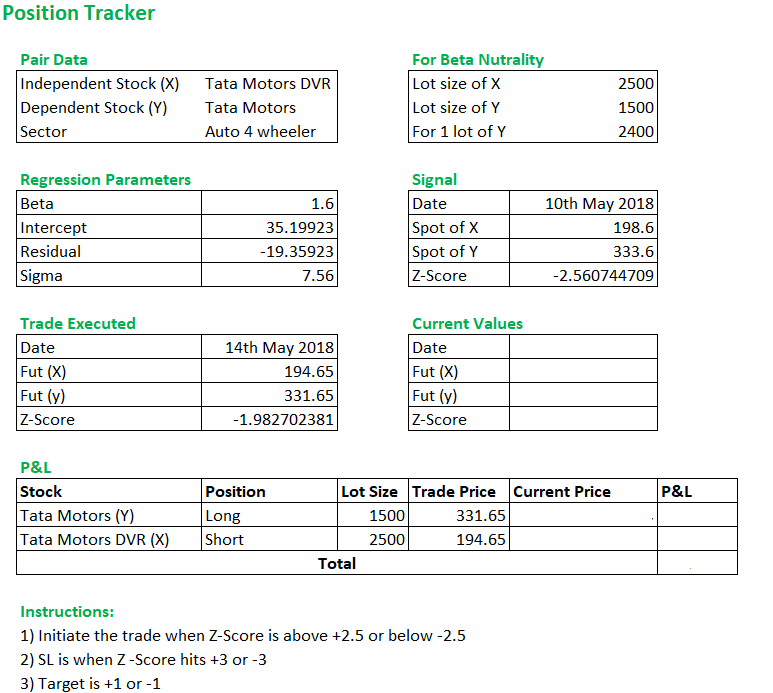
I have been running the pair trading algo to look for opportunities, and I found one on 10th May 2018. Here is the snapshot of the pair data, you can download the same towards the end of this chapter. Do recollect, this pair trading algo was generated using the closing prices of 10th May.
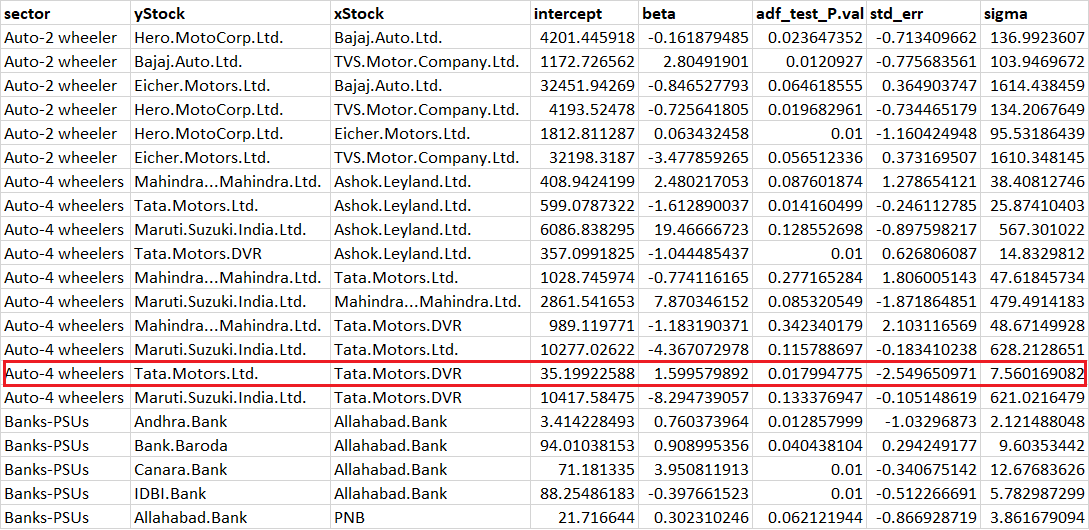
Look at the data highlighted in red. This is Tata Motors Ltd as Y (dependent) and Tata Motors DVR as X (independent).
The ADF value reads, 0.0179 (less than the threshold of 0.05), and I think this is an excellent adf value. Do recollect, ADF value of less than 0.05 indicates that the residual is stationary, which is exactly what we are looking for.
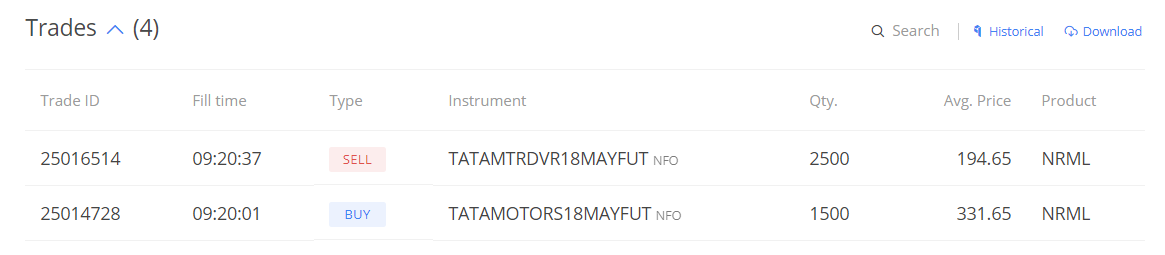
The std_err reads -2.54, which means the residuals is close has diverged (sufficiently enough) away from the mean and therefore one can look at setting up a long trade. Since this is a long trade, one is required to buy the dependent stock (Tata Motors) and short the independent stock (Tata Motors DVR). This trade was supposed to be taken on 11th May Morning (Friday), but for some reason, I was unable to place the trade. However, I did take the trade on 14th May (Monday) morning at a slightly bad rate, nevertheless, the intention was to showcase the trade and not really chase the P&L.
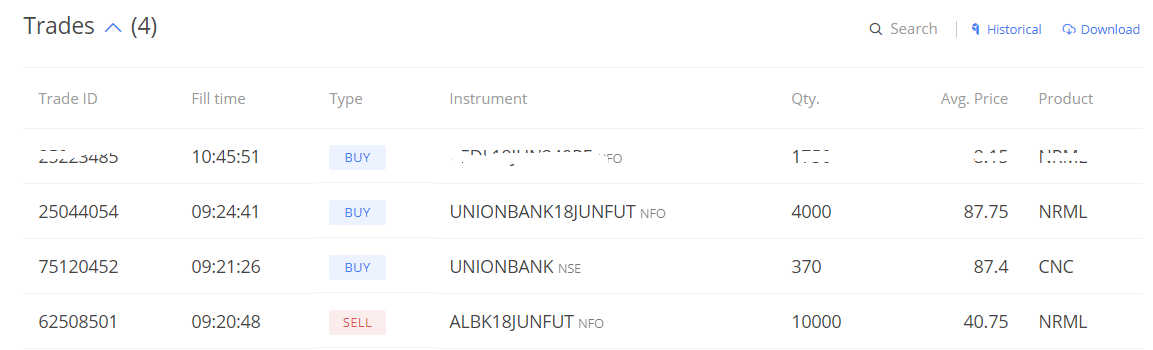
Here are the trade execution details –
You may have two questions at this point. Let me list them for you –
Question – Did I actually execute the trade without checking for prices? As in I didn’t even look at what price the stocks, I didn’t look at support, resistance, RSI etc. Is it not required?
Answer – No, none of that is required. The only thing that matters is where the residual is trading, which is exactly what I looked for.
Question – On what basis did I choose to trade 1 lot each? Why can’t I trade 2 lots of TM and 3 lots of TMD?
Answer – Well this depends on the beta of the stock. We will use the beta and identify the number of stocks of X &Y to ensure we are beta neutral in this position. The beta neutrality states that for every 1 stock of Y, we need to have beta*X stock of X. For example, in the Tata Motors (Y) and Tata Motors DVR (X) for example, the beta is 1.59. This means, for every 1 stock of Tata Motors (Y), I need to have 1.59 stocks of Tata Motors DVR (X).
Going by this proportion, the lot size of Tata Motors (Y) is 1500, so we need 1500*1.59 or 2385 shares of Tata Motors DVR (X). The lot size is 2400, quite close to 2385, hence I decided to go with 1 lot each. But I’m aware this trade is slightly more skewed towards the long side since I’m buying additional 115.
Also, please note, because of this constraint, we cannot really trade pairs if the beta is –ve, at least, not always.
Remember, I initiated this trade when the residual value was -2.54. The idea was to keep the position open and wait for the target (-1 on residual) or stop loss (-3 on residual) was hit. Until then, it was just a waiting game.
To track the position live, I’ve developed a basic excel tracker. Of course, if you are a programmer, you can do much better with these accessories, but given my limited abilities, I put up a basic position tracker in excel. Here is the snapshot, of course, you can download this sheet from the link posted below.
The position tracker has all the basic information about the pair. I’m guessing this is a fairly easy sheet to understand. I’ve designed it in such a way that upon entering the current values of X & Y, the latest Z score is calculated and also the P&L. I’d encourage you to play around this sheet, even better if you can build one yourself ☺
Once the position is taken, all one has to do is track the z-score of the residual. This means you have to keep tracking the values and the respective z-scores. This is exactly what I did. In fact, for the sake of this chapter, my colleague, Faisal, logged all the values (except for the 14th and 15th). Here are the logs –
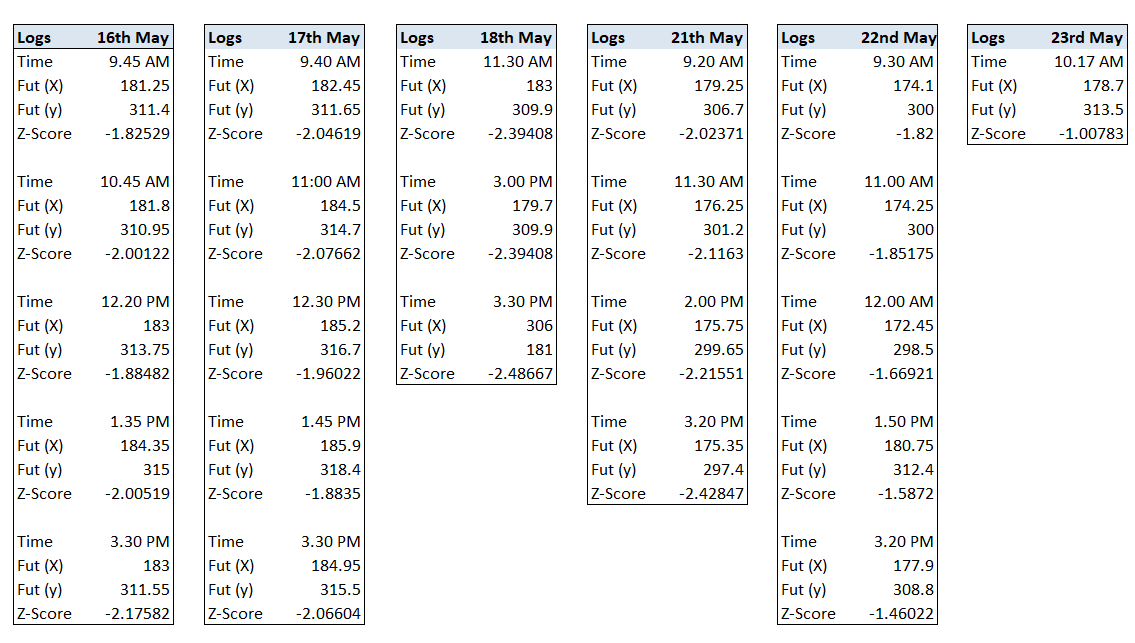
As you can see, the current values were tracked and the latest z-score was calculated several times a day. The position was open for nearly 7 trading session and this is quite common with pair trading. I’ve experienced positions where they were open for nearly 22 -25 trading sessions. But here is the thing – as long as your math is right, you just have to wait for the target or SL to trigger.
Finally, on 23rd May morning, the z-score dropped to the target level and there was a window of opportunity to close this trade. Here is the snapshot –
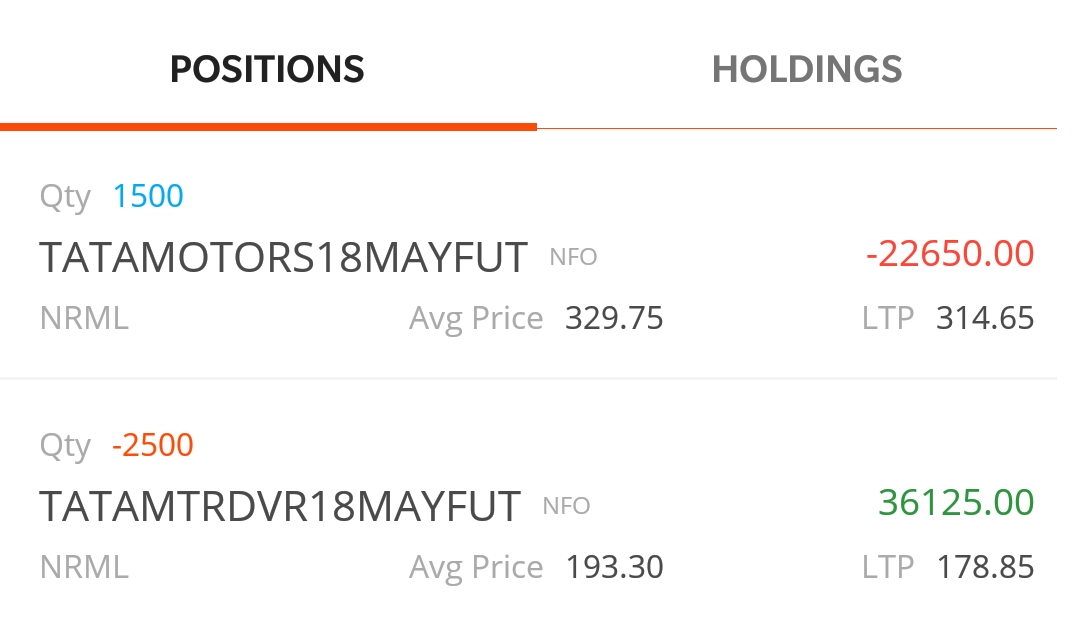
Notice, the gains in Tata Motors DVR is much larger than the loss in Tata Motors. In fact, when we take the trade, we will never know which of the two positions will make us the money. The idea, however, is that one of them will move in our favor and the other won’t (or may). It’s however, just not possible to identify which one will be the breadwinner.
The position tracker for the final day (23rd May) looked like this –
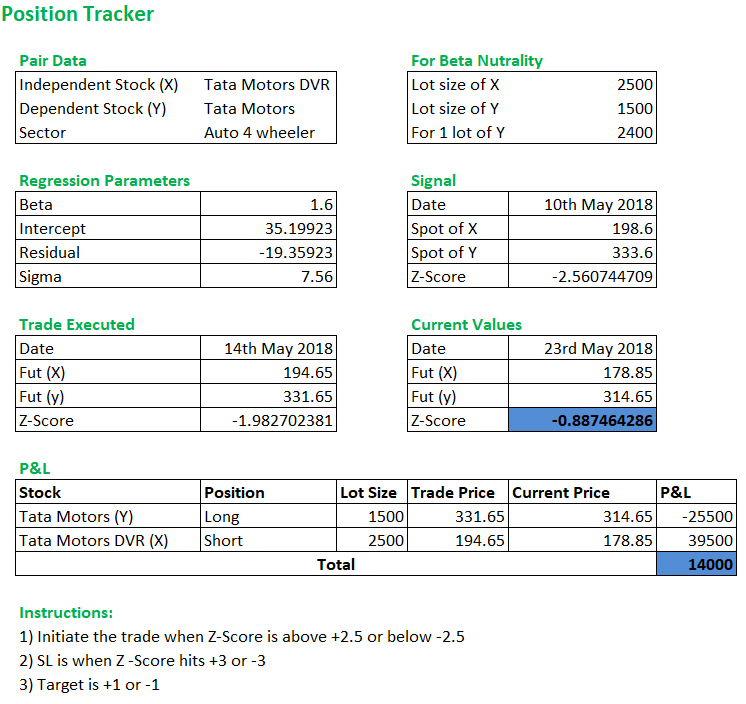
The P&L was roughly Rs.14,000/-, not bad I’d say for a relatively low-risk trade.☺
13.4 – Final words on Pair Trading
Alright guys, over the last 13 chapter, we have discussed everything I know about pair trading. I personally thing this is a very exciting way of trading rather than blind speculative trading. Although less risky, pair trade has its own share of risk and you need to be aware of the risk. One of the common ways to lose money is when the pair can continue to diverge after you initiate the position, leaving you with a deep loss. Further, the margin requirements are slightly higher since there are two contracts you are dealing with. This also means you need to have some buffer money in your account to accommodate daily M2M.
There could be situations where you will need to take a position in the spot market as well. For example on 23rd May, there was a signal to go short on Allahabad Bank (Y) and long on Union Bank (X). The z-score was 2.64 and the beta for this pair is 0.437.
Going by beta neutrality, for every 1 share of Allahabad Bank (Y), I need 0.437 shares of Union Bank (X). The Lot size of Allahabad Bank is 10,000, this implies I need to buy 4378 shares of Union Bank. However, the lot size of Union Bank is 4000, hence I had to buy 370 shares in the spot market.
Well, I hope I trade is successful ☺
I know most of you would want the pair data sheet made available. We are working on making this sheet available to you on a daily basis so that you can track the pairs. Meanwhile, I would suggest you try and build this algo yourself. If you have concerns, please post it below and I will be happy to assist.
If you don’t know how to program then you have no option but to find someone who knows programming and convince him or her that there is money to be made, this is exactly what I did ☺
Lastly, I would like to leave you with a thought –
- We run a linear regression of Stock A with Stock B to figure out if the two stocks are cointegrated with their residuals being stationary
- What if Stock A with Stock B is not stationary, but instead Stock A is stationary with stock B & C as a combined entity?
Beyond Pair, trading lies something called as multivariate regression. By no stretch of the imagination is this easy to understand, but let me tell you if you can graduate to this arena, the game is different.
Download the Position Tracker and Pair Datasheet below:
Key takeaways from this chapter
- The trigger to trade a pair comes from the residual’s current value
- Check for beta neutrality of the pair to identify the number of stock required in X and Y
- If the beta of the pair is negative, then it may not be possible to set up the trade
- Once the trade is initiated, check the z-score movement to trade its current position
- The price of the futures does not really matter, the emphasis is only on the z-score
Hello sir. here it says that we have to track std_error daily, now when we calculate it daily, do we have to consider the past rolling 200 days for the intercept, slope, coffcient etc calculation also? Thanks!
You can if you have the programing capability to do that. But often most people only track for days following when the trading position is initiated.
Hi Karthik and team,
Based on this algorithm I have made a pair trading tool website for Indian stocks in different sectors, available for free access to everyone. I wanted to check if it is appropriate to share the website details here.. Please let me know if this goes with your policies.
Hi Bhalaji, sure, as long as its not a paid promo 🙂 Please share the link here once 🙂
Thanks for acknowledging. No it is not a paid promo, but I have opened the page for advertisers. Is that ok ?
Thats ok, good luck!
I would really appreciate and value your feedback if you get a chance to try the tool ! Thanks in advance.
Sure, will try and do that 🙂
Happy new Year Karthik !
Did you get a chance to play with the tool 🙂
Happy New year to you as well. Not really, tried once, I think it asked me for email id, so dint proceed after that 🙂
Oh thanks for that..!
Recently I have made a change and people can access pair analysis tool without login while one would need to login if they need to create a watchlist.
Ah ok. Will try it then 🙂
Hi again Karthik, please do consider using my tool to provide your valuable inputs.
Hi Karthik,
Thanks for allowing to share my tool here.
Link: https://quantpairtradingindia.co.in
A short writeup:
Users can select the sector, the tool will then:
1. list the pairs with their ADF, Z-score.
2. Z-Score history chart
3. Qty to buy, sell based on lot size and additional qty to buy for strict beta neutrality
4. A watchlist for people to track their favorite pairs
5. The pair universe is run everyday 5:00 PM IST and the results are cached for optimal API calls and performance.
Hope this helps and supports traders who come from the school of Quant / mathematics based approaches!
Site not working ?
Thanks for attempting. I did a migration of database, now it is ready for use..
sir in the above example why did you consider 1500*1.59 it should have been 2500*1.59 as Y is tatamotors=1500 & X is tatamotorsdvr=2500 so now if Y=mX OR X=(1/m)Y whichever way
for eg: Y=mX:1500=1.59*2500(but here LHS is not equal to RHS) BUT by your logic i.e 1500*1.59 are you using X=mY EQUATION ?? which is the case even in the next chapter example
PLS HELP WITH THE POSITION SIZING
Sachin, need to revisit and relook at this for me to get the full context, its been a while since I visited this module.
sure sir pls do reply back when you go through the module
I agree with you, Sachin. This is seems to be a mistake in the module.
Hi Karthik,
Hope you\’re well.
I\’m trying to get the report generated and backtest it.
My concern is regarding the position sizing, in this chapter, as an example, you said you bought 1 LOT of TM and 1 lot of TMD,
which are 1500 and 2400 respectively, but for beta neutrality, shouldn\’t it be really like 2400*1.59 instead of 1500*1.59
also, in the next chapter, regarding the HDFC and ICICI example, the beta is 0.79 and the lot sizes are 500 and 2750,
if i go with my concern, it should have been 2750*0.79 = 2172.9 or approx 4 lots of hdfc and this is where i\’m actually struck.
let\’s say that ICICI is Y and the HDFC is X, and the beta is 0.79, in that case, 0.79 *500 would be 395 and to circumvent lot size discrepancies and to maintain beta neutrality we\’d go with 2750/0.79 which would be 7 lots of HDFC and I\’m clear on it.
But what i don\’t understand is, why did you multiply beta with Y in the first example and divide X in the next example.
We are going by Y=mX+C+E right, so when Y=mX, i don\’t get the logic behind your position sizing, just wanna know if i\’m missing something or is there any error.
Hope to get this sorted,
Ravi.
yes, we are trading Y=mX+C+E
In the above equations. C is constant. E is mean reverting.
The only way mean reversion happens is when, Y – mX price move towards the mean.
The trade should always be 1 stock Y and m stocks X
or
1/m stocks Y and 1 stock X
which ever works best based on lot size of each stock.
Is it possible to use pair trading for options where we can simultaneously buy call and put option or simultaneously buy and write the call option of the two stocks.
For example if you have a signal to go long on HDFC and short Icici is it possible to buy a HDFC call option and buy an ICICI put option? Or Buy HDFC call option and write ICICI call option?
I think there are traders who do this, but I\’ve not pair traded via options, so cant really comment.
Thanks a lot
Hi Karthik Sir, I am a programmer and am trying to code this strategy, a small doubt. Once you have entered the trade do you keep the \’beta\’ and the \’const\’ constant until you have exited the trade and once the trade has been exited then run the regression again.
Yup, you can keep it constant. At least that what I used to do 🙂
A small typo in the penultimate line,
*we execute the trade with a higher confidence level that…
Noted, thanks 🙂
Hi Karthick,
In the formula — \”Todays residual/Standard error of the residual\”
By \”Todays residual\”, do you mean to say the standard deviation of today\’s residual?
So essentially, the denominator part is 1SIGMA [which is the standard deviation of the time series of residuals till (today-1)th day]. If the numerator part[which denotes the standard deviation of the observed value of today\’s residual from the mean] exceeds 2.5SIGMA or -2.5SIGMA to execute the trade with a higher confidence level that it will revert back to mean(which is 0SIGMA).
am i right?
Yup, thats right.
Thanks a lot for the reply karthick.
Just to clarify,
From what I understood, we must look at the pair\’s previous arbitrage occurences and see how much time it took to converge back to the mean so as to confirm that the pair is not time sensitive, right?
And also, going by this logic, why are some pairs not time sensitive?. What I mean is, quant firms can easily identify all the possible arbitrage oppurtunities at any given point in time using their algorithms, right? If a pair is not time sensitive, it is safe to assume that big players are not into the arbitrage oppurtunity. So what makes these big firms ignore these oppurtunities (If what we take behing is bread crumbs left behind by the quant firms, why was it left behind in the first place?)
Yes, it always makes sense to check how the pairs have behaved. By design, pair trading is not time sensitive trades. They can take time to converge or diverge. Yes, also pair trading is not a standard template, it is all about how you define the pair. Hence the same pair, there can be two different trade ideas.
Beautifully written. Thanks a lot for sharing this. I have a doubt:-
Do retail investors stand a chance with all the big quant firms executing orders the moment they find a statistical arbitrage opportunity.
I mean, they\’ll be having an edge with all their sophisticated models finding opportunities way before small retail investors do, right?
Thanks Vishal. One way is to figure trades that are not time sensitive. This is an advantage to retail. If its a speed game, them retail has no chance.
ok somehow i will find a way to create a multivariate regression model. i have another doubt, it would be great if you could help. assume there is a company x and y and that pair has p-value less than 0.05, rest everything looks good so i initiate a trade. then i regularly keep updating the close price of both the companies and after holding the trade for few days i again check its p-value but now it shows a much higher p-value. what to do in such case should we immediately exit the trade if it is in profit/loss? or should i still hold it till the standard deviation is less than 1.
It all depends on your risk taking abilities. You exit if either the profit or loss is within your permissible limits.
Dear Sir,
I have successfully created a pair trading setup for myself using python and it is working fine. Thank you so much for your guidance. As you mentioned at the end of this chapter about multivariate regression, I did some research about it but I am not getting any useful information. I want to start working on setting up a multivariate regression model but I am not getting a heads up. can you help me guide a bit like from where/how should I start. Or if there is any book related to it then it would be of great help.
Regards,
Devansh Patel
I\’m happy to note that, Devansh. Good luck with pair trading.
Multivariate, unfortunately there is no content around it. One of the reasons is that its too expensive for retail to set up. Institutions do, but of course they wont write about it.
Here is the thought process – in regular trading we have X and Y, and we find a relationship b/w them. In multivariate, the idea is to define X with A and B. Maybe A,B,and C. So long stock one, short stock two and three.
Of course, I also know this in theory, have never implemented this myself.
Certain pairs do well during certain times and others during some other time. How to select which pairs to trade (out of many which fit the criteria) at that moment in time for this strategy to be profitable in the long run?
There could be seasonality within these pairs, which unfortunately does not get captured in this method. But you can look at it purely from the convergence and divergence of the residuals. Thats ok too.
Hello sir when u were talking about z-score u said we have to calculate it using todays residual to std error of residual but in past modules u have been using data from past to present and all of sudden in this sheet when talking about z-score u used the residual of the 1st output of the given data and if we go by ur last chapter they are not today\’s residual but of the past data, so im actually confused about or its just that you inverted the data to go from present to past and if we do so does it affect the regression output. I\’ll definitely make this sheet and check on it but i just wanted u to clearify it so it would be easy.
Hey, these are two different techniques right?
best source or books to read about multivariate regression pair trading.
Last time I checked, there weren\’t any.
Hi Karthik
In the above you mention the following:
The second highlight is 20.914, which is the residual.
The std_err in the report is simply a ratio of –
Today’s residual / Standard Error of the residual
= 20.92404/22.776
= 0.91822
Since the residuals are in ascending order of date (old->new), today\’s residual will be the last row of the residuals isn\’t it? Not the first row as you have indicated. As per my understanding, your formula will give the residual of the oldest date whereas we want the residual of \’today\’ or the newest date. Please correct me if I am wrong.
Regards
Uday Mudholkar
Yes, thats correct. Let me recheck this.
The Beta calculated in ADF test report is between the X & Y stocks? if so how can we calculate in excel? Thanks 🙂
I think its tricky to calculate the ADF in excel, I myself got it from elsewhere.
Sir how I graduate myself to multivariate regression
Well, Karthik, if you ever feel like diving into the deep end, I\’m sure there\’s at least one eager student ready to tackle the challenge!. I’ll bring the enthusiasm if you bring the multivariate regression!
I\’ll keep that in mind 🙂
Hello @karthik , can you also teach about multivariate regression, have a chapter on it?
Ah, I could try that. But hardly any takers for that given the complexity Rachit. Also, I know that only theoretically and I\’ve never practiced it myself. I\’ve done quite a bit of pair trading though 🙂
Dear Sir,
I wrote a code to run the adf test and i got the p-value. what i did is i found the p-value of all the fno companies irrespective of the sector. i made combinations like aarti industries and apollo hospital. many such combinations gave me p-value less than 0.05. so is it okay to go ahead with such combinations for pair trade and execute the trade?
Yes, as long as you look at this purely from a statistical point of view. If you try to pair them in the traditional way, then you wont be able to justify the relationship 🙂
Hi karthik,
I wanted to get your view on using yahoo finance (python library, yfinance) to collect closing price data. Is the data cleaned for stock splits/bonus etc.
I have\’nt worked with the nse bhavcopy data before, im able to find daily closing prices for each security but am unable to find a file with more than a day of historical data. What am i doing wrong.
I have worked with kite api before too.
I am not sure which one to go with, as youve suggested the nse bhavcopy.
Thanks in advance!
Hey Abhay, I\’ve not really used Yahoo finance data, so cant comment. But do check this – https://kite.trade/
hello sir,
how can be std. err. or z score can be negative
Hi Karthik,
From your experience, do you think the cointegration method is better than the basic ratio method?
Yeah, it is, but also needs more background work.
One More Question Sir,
we all witness about splitting stocks or any event like dividend giving etc. then data was disturbed, then how do we clean up the data?
I know this is data science part, But I just want to know the basics
Check this – https://www.youtube.com/watch?v=MX-6rdHDPbE
\”What if Stock A with Stock B is not stationary, but instead Stock A is stationary with stock B & C as a combined entity?\”
Can you give me an practical example for this statement? cant get this one
Short HDFC Bank + Long (SBI + ICIC), something like that 🙂
Hi Karthik,
How do I calculate return for a pair? Can you explain using an example?
Thanks,
Krishna
You can calculate the return for individual legs and then take a combined position.
Hi Karthik,
Should I use the log prices to use in the cointegration test or normal price will suffice? Can you also explain the importance of the respective answer.
I remember using normal prices, but dont have a reason to explain why I dint take log prices 🙂
But maybe you can use both to see which one fits the model better?
Hi Karthik,
I am trying to automate pairs trading in python. I need help in building the conditions for back testing. I am using past 12 months data to fix pairs and the coefficients. I use the next 6 months data as the trading period. Now I get negative PnL\’s due to the fact that some pair\’s trade are not settled due to the threshold condition not reached at the end of the trading period. What should I do about it?
My idea: Should I stop opening trades at month 5 out of the 6 months? Will it work?
Do you have any idea to help me with this?
Thanks in advance,
Krishna
Maybe try and optimize for the threahold conditions instead of restricting trades on 5th month? The reason is that most of these trades are short term in nature, restricting on 5th month may mean you are losing signals. What if all signals are clustered around the 5th month for a given pair?
Hi Karthik,
What is the number of data points do we consider for forming the pairs? Is there a certain answer and why did you consider almost a year of data for the pair formation?
A year\’s worth of data is reasonable. One of the important factors to consider is how the pair is behaving in recent times…given this there is no point going into past years.
Sir,
which library will required daily closing stock price from Nse
and how yo automate scripts on daily basis on excel like Downloading daily prices or bhavcopy
Bhav copy on NSE will provide the daily closing prices. I\’d suggest you see Kite Connect APIs for this – https://kite.trade/. You can also ask these queries on the discussion forum there.
Sir,
You suggested to avoid rollover as much possible. So, in either pair trading/calendar spread, will it be a better option to trade with the Near month/far month specially for liquid assets (Index/Stock futures like HDFC/TCS etc.). What will be your advice here?
Thats right, pick the instrument based on the time to expiry. If there is lot of time to expiry, pick the current month series, which is the most liquid. Otherwise, select the next month series.
Sir,
While calculating the std err (=Today\’s residual/standard error of residual) you have taken today\’s residual value for Observation No.1. However, I feel today\’s residual value should be of the last observation No and not the first Observation No. Could you kindly help to understand here? Else, my whole understanding may fetch bad result.
Sir,
This is with regards to pair trading-
Suppose we took trade on 25-MAR-2023 with the current month futures where 27MAR2023 is the current month expiry date. Now, we have the equation as- HDFC=f(ICICI). The std err touched +2.7 and we short sell. Now, we sell HDFC and buy ICICI with beta neutrality. However, it is seen that although 27MAR passed by but the std err don\’t converge. In this respect, should we do the below:
(i) We should buy HDFC and sell ICICI of the current month just before the expiry. Then we should again sell the HDFC and buy ICICI futures of APRIL (which should be the current month now) in same beta neutrality. Now, we should keep on tracking as long as it either hits target/stoploss.
(ii) If the above is correct, can we make loss during the roll over? If yes, is there any way to mitigate or overcome?
(iii) If we want to avoid rollover, is it feasible to trade the pair with next month future?
(iv) Is the same way to be followed for calendar spread too if it doesn\’t hit target/stoploss?
1) Yes, you can roll over of neither the target or the SL is hit.
2) Yes, that is a possibility too. One thing that that when you roll over, your future prices are different and your spread may not be the same. So do watch out for that. Try your best to avoid situations like rollover.
3) Yes, but again, check the spread before executing
4) Yes.
Sir,
Reposting for this if you may help with a little more elaborate please:
Suppose on a certain day, I find the std error val to be +2.75 and the ADF is 0.01 and a intercept value within a good tolerance and I take the trade. Then on the following day, should we necessarily have to track the ADF value/intercept or since the trade set up is already taken, we have to only track the std error till the stoploss/target is hit?
I mean to say that while taking the trade all the ADF (less than 0.05),std err and intercept remains favorable. As per rule, we hve to track the std err for the reversion. Now, on the next day, the ADF gets 0.1. Shoudl we exit or since the trade is already taken, we have to just now keep track of the std err?
Please help.
Sir,
(i) Please let know if I am correct-In Mark Whistler\’s, two stocks should besimilar companies/business and that the correlation between them should be positive.
(ii) Please let know if I am correct-Now, in case of RVT method, if the p value of the ADT test is less than or equals 0.05, then it means that the series is stationary and that it can be recognized as a pair to trade on.
1) Yes
2) Yes
Sir,
(i) Suppose the ADF value between two pairs is 0.01 on a certain day for the residuals. Now, can it change above 0.05 on some other day?
(ii) Suppose on a certain day, I find the std error val to be +2.75 and a intercept value within a good tolerance. However,the ADF is 0.1. Should we go for taking trade?
(iii) Suppose on a certain day, I find the std error val to be +2.75 and the ADF is 0.01 and a intercept value within a good tolerance and I take the trade. Then on the following day, should we necessarily have to track the ADF value/intercept or since the trade set up is already taken, we have to only track the std error till the stoploss/target is hit?
1) All these values can change if the intraday prices changes drastically.
2) You\’d be breaking the system rules if you look for other triggers. In any trading system, you need to have consistency in terms of initiating, risk management, and closure of trade. If you are going with ADF as a trigger to initiate a trade, then I\’d suggest you stick to that itself.
3) Yes, to keep an eye on how prices have changed and therefore its statistical impact.
Sir,
While we require to calculate the standard error on daily basis, we know std err= today\’s residual val/std err of the residual. Now, which data should we take for today\’s residual value? Is it the residual value shown in the Observation No.1 or the data shown at the last in the observation? Please advise.
Daily residual value is what you need to track.
Sir,
In RVT, you have mentioned to trade the residuals once hit +/-2.5SD and accordingly close once hit the target/stoploss. However, finally you have suggested to track the std error once it attains a value of +/- 2.5 and accordingly close once hit the target/stoploss. In this context, I require the below understanding:
(i) Does it imply then that +/-2.5SD is equivalent to hitting +/- 2.5 value of the standard deviation?
Yes, thats right.
Sir,
In the RVT method, you have automated fetching inputs for ystock,xstock,intercept,beta,adf_test_pvalue,std err,sigma.
In this context , I would like to understand the below:
(i) If today say for two stocks A & B, it satiesfies A=mB+c based on the error ratio, is there a probability for satisfying B=Ax+C tomorrow? If this could come out true, then is it necessary to track \”ystock,xstock\” for everyday? If this is true to track ystock,xstock\” for everyday, then should we have to track the error ratio of the pairs on everyday to figure out the dependent and independent variable too?
(ii) Based on everyday closing price, the \”intercept, beta,adf_test_pvalue,std err and sigma\” will also be changed. So, do we require to track all these on a daily basis?
Please help with the above understanding.
1) Yes, you will have to track the stocks everyday, especially in times when the volatility has increased and the price changes are raipd.
2) Usually traders have a program to track the changes on a daily prices and update the same.
how to bhavcopy to make automated excelsheet??
Not sure, maybe you will have to check with a developer for this.
Sir,
In the second method of pair trading, the most challenging thing should be the set up in excels/programming. In between, since, I am in learning phase, can I start the pair trade with the first method instead? How is the results of the method?
I thought of slowly approaching towards the 2nd method when the set up gets completed in excel/program. Please suggest.
Thats also ok. But 2nd method is preferred, but I understand, it is way more complicated 🙂
Sir,
Do you still able to update the pair data sheet/position tracker now on regular intervals? If it is, could you kindly share the link so that I may track and bet accordingly? I am lost somewhere.
Ah, no. This was not possible to do daily, so stopped it.
Sir,
We should trade only when the residuals hit +/- 2 SD. Now, you have also mentioned that we should trade when the standard error reaches +/- 2.5.
Now, I would like to know that does +/- 2 SD implies directly to +/- 2.5 standard error and we would only have to track the standard error to spot the pair trading opportunity? So there is no need to separately track when the residuals hit +/- 2 SD. Right? Am I missing anywhere here?
Yeah, you need to track the standard error, Anirban.
What are some free reliable sources of historical data?
You can download it directly from the exchange website.
Great stuff Karthik. Can you help with some material on multi variant regression?
A few had asked the same earlier, not sure if there is anything around. Let me check again.
Sir, I\’ll expand on my example:
Consider that on 18th May 2022 the SD value crosses 2.5. I get the SD value using the last 200 trading points. For instance, these are some sample SD values as of 18th May:
15th May- 2.3
16th May- 2.39
17th May- 2.45
18th May- 2.51
Now, on 19th May, should I use the last 201 trading points (including the new data point obtained on 19th May)? If I do that then consider the following sample values:
15th May- 2.28
16th May- 2.35
17th May- 2.37
18th May- 2.46
19th May- 2.53
Now, the code changes the date for executing the date from 18th May to 19th May for calculating the P&L. How should I proceed?
Hello sir. Consider that in the pair trading strategy I use the last 200 data points and find a trading opportunity on 18th May 2022 (the value crosses 2.5). Now, the next day the total number of trading points will equal 201. In some cases, the value of the previous day now becomes close to 2.4 and the system recommends to execute the trade today (today\’s value crosses 2.5). The problem is that I am developing a code for this strategy and as a result this small detail leads to large changes in the P&L. What should I do?
I\’m not sure if I understand this right. So with the change in SD value, you initiate and close trades, right? So at more than 2.5 you\’d have initiated a trade and lesser than 2.4 you\’d close resulting in a profit or loss?
Hi Karthik,
Is there any book you could suggest that goes deeper into pairs trading? I see that you had mentioned earlier in 2021 that there aren\’t any good sources for Multivariate regression, have you found anything on the same since then? If not, is there a book that you could recommend to study Multivariate regression, I\’m sure you must\’ve gained this knowledge from a written resource.
Miltivariate, I\’m still not sure. But do check the book by Ganapaty Vidyamurthy on Pair trading.
Hi Karthik,
I\’m trying to build pair trading system. The pair passes ADF test. My problem is std of residual is crossing more than 3 and sometimes it is going beyond 5-6. 99.7% of datapoint comes under +3 std to -3std. What should I do?
Any tips?
Gaurav, here are a few things you can try –
1) Check if the data is clean. Adjusted for splits and bonuses.
2) If it is just a few points, maybe you can ignore them?
3) If you don\’t want to ignore it, maybe backtest for performance and see how it results.
Let me know.
Thanks Karthik, I am have combined few softwares oracle and python to get this output. infact it is like magic to analyse and get the result of the whole market at a glance. I have learnt this chapter atleast 10 to 15 times to understand each line of this lesson to extract the deep of knowledge you explained in this chapters. Thanks for that and I shall ping you once i setup the complete system.
Glad to now that, Harish. Happy learning and good luck 🙂
do i need to calculate for 2 years daily or i can have the intercept and slope as same and continue to calculate on zscore daily basis till the trade closure. plz clarify
If you are running a system, then daily update should not be a problem I guess.
Hi Sir, It is a great service kind of you are doing in this forum. Thanks for that. My query is if we have identified a trade with 2 years hist data on say 15 mar 2022. and my intercept, slope are available with me on 15 mar 2022 and entered a trade on 01 apr 2022. from 2nd apr onwards do i need to recalculate the slope and intercept and arrive at the z score or i can have the same intercept and slope ason 15 mar 2022 to calculate the zscore. plz clarify
Yes, assuming you\’ve backtested this for two years data.
Is it okay to use same system on 15 Min data or so lower time frames?
If yes then are there any other considerations I need to take into account for lower time frames?
Thank you for your reply!
Also I would like to share that I developed simple system in Python to check whether given two stocks are valid pairs or not. If yes then it gives all the parameters related to pair equation. Feeling good! 😊
Amazing! Super happy to note that 🙂
Good luck with the system!
Please clarify if this is correct
1) I use beta to decide appropriate hedge ratio between two entities
2) std error [(latest residual) / (residual std error)] is what I will be tracking for trading opportunities. When it hits 2.5+ I will go short on pair and when it hits -2.5 I will go long on pair
3) Once I enter, I have to keep track of z-score. z-score is nothing but the [(latest residual) / (residual std error)]. Once z-score drops or rises to desired levels I will square of positions
confused in z-score specifically. Please let me know if my interpretation of z score is correct!
z-score = (latest residual value) / (residual std error)
Thats correct, have explained the same in the chapter I guess?
Hi Karthik,
Great explanation & apologies for waking up the dormant comments section :). One thing that\’s causing a little bit of confusion, though. When you are tracking it regularly once you have initiated the pair trade, are you running the linear regression every time you want to know where the trade stands. For example, from the \”logs\” screenshot above, on 21st May, you have 4 updates. Was the regression run 4 times to get the \”std_err\”. I am assuming that values is the z-score you are referring to.
Thoroughly loving your explanations!
Thats right, you need to run the linear reg model to get the std error.
Dear Sir, I have one question from the options topic.
I want to ask,
Suppose I bought a OTM call option (2-3 strike away from ATM). Now, from the two examples that you wrote in one of the module (1. During 2009 election your friend made whooping 28 lakhs, 2. On 24th aug 2015, market falls by 5.92%, but the premium of CE above strike price did not decline rather increased). Here I tried to come up with one result and want you to confirm whether am I right?
The result is:
Buy OTM call option, if you are certain that on a certain day the market is gonna move by a big percentage, but not sure in which direction.
what this does is-
If market gets up then our OTM call option will convert into ITM option and we will make decent profit.
If market gets down then, as we have bought OTM option we have 2 things:
1. OTM is of less delta.
2. volatility increases on that day => vega increases => premium gets increase.
In both the cases we will make some profits.
If you are buying CE, especially a naked CE, then it implies that you are bullish. So you need to be sure about the direction. But that said, yes, if the volatility increases, then so does the premium of the options. But then, this is a bet on volatility, not the direction if you realize.
Hello Karthik,
Quick question –
Why is the stoploss at +/- 3 SD?
Does that not mean that there is a 99.7% chance of reverting to the mean?
Is that not a better place to initiate a trade than +/- 2 SD?
Please explain.
Thanks and Regards,
Abhinav
It indicates that 99.7% of the returns are within the range. Hence 3SD.
So if my trades are working then I can say that calculations are right and can go ahead to deploy it
Yes, but keep an eye on factors that you think are driving your profits or dragging your losses.
I run ADF test in R suing URCA package. It\’s working fine but I don\’t know whether the results are correct or not. I did visual backtesting, it worked but again it was only one trade so I can\’t just stamp it as correct one.
I request you to have 1/2 chapters on this. It will be very helpful
Thank you!
Noted. But the best way for you to check is to track the trades live and see how it goes.
Don\’t we have to check whether or not 2 stocks are having more than +0.75 correlation? As we did in 1st PTM?
Hmm, not really. We are looking at other factors here.
Hi Karthik,
I want to understand how to clean the data wrt results, splits & bonus. Can you please help me understand 1) how to spot from past data and 2) How to clean them.
Thanks
Anuraag
Anuraag, you can consider subscribing to an authorized data vendor for this, you will get clean data from the vendor.
Sir,
Residual calculated by regression and by subtracting Predicted price of Y from Actual Price of Y (As done in Position Tracker sheet) is coming different everytime. Why is it so? Am i missing something or its happening with everyone? Pls reply.
Not sure, Sushil. I\’d suggest you follow the technique step by step till you get comfortable.
where can i get stock data on an hourly granularity for a specifc date ? what im getting from BHAVCOPY has a min granularity of per day (OHLC)
I\’d suggest you speak to an authorized data vendor for this.
Hi Karthik,
This is with reference to the above comment regarding NULL Values. I am not sure which other model to use. So for now I have changed the algorithm a bit. Example, company A has 500 entries and company B has 350 entries. So I will take the latest 350 entries of company A with all 350 entries of company B and run my algorithm normally. Is this fine? Any corner cases which you might want to point out?
Anyway, thank you so much for these awesome blogs. From not knowing what NIFTY is to doing well in the market on a regular basis, I have come a long way all because of you and your amazing teachings. Thanks a lot for this!
Yes, Anivrat, that\’s a reasonable way to move ahead. Take the 350 data points that match both the time series. I\’m glad you liked the content and find it helpful. Good luck 🙂
Hi Karthik
I have some questions regarding the market data used in your example spreadsheets. I am trying to write my own algorithm without Excel or any other spreadsheet app. I have a different source of data than the one you mentioned in your article – NSE\’s bhavcopy.
1. I dowloaded the data for AXISBANK for the period given in your spreadsheet (2015-12-04 to 2017-12-04) and my data and your data matched exactly. But when I downloaded data for ICICIBANK and HDFC bank the data does not match. For e.g. your closing price for 2015-12-04 for ICICIBANK is 261.45 while I get it as 237.68. Following is that particular data point from my source:
{\”date\”:\”2015-12-04T15:30:00.000+00:00\”,\”open\”:239.14,\”high\”:240.0,\”low\”:237.09,\”close\”:237.68,\”volume\”:8259643}
Same is the case for HDFCBANK. Can you shed some light on why this can be the case?
2. I have checked on NSE website and they have a paid model with an annual fee. Until I complete my algorithm I don\’t want to pay a yearly fee. Do you know if they have a \’pay as you go\’ model? The source I am using has a PAYG model.
3. Is there any other source of data that you can recommend other than bhavcopy?
Thanks & regards
Uday, the difference in data is most likely due to a corporate action or maybe there is a difference between LTP and closing price. For data, you can try this as well – https://kite.trade/
Hi Kartik,
I have implemented the entire algorithm but I there\’s something I want to clarify. There are a lot of companies that do not have the entire trading data. Like, COFORGE got added to the index in Aug 2020 and since I am taking the data from Jan 2020 for rest of the IT companies, the regression throws me an error because the two data sets are not equivalent. So I entered NULL values to all the previous dates for companies where the data for a particular date is not available. So should I need to change the regression model as well? What do you suggest?
Null values won\’t help as they still skew the results (I think). But what other regression model will you use?
Hello Karthik,
I, as a learner, would like to say that it has been splendid reading your articles on various topics. Thank you for such simple explanations!
At the end of this chapter, you mentioned \”multivariate regression.\” Can you suggest to me some sources/references for it? I found research papers by googling, but I would like to read on some practical side of this.
Thanks again!
Shubham
Thanks for the kind words, Shubham. I\’m glad you liked the content. Unfortunately I could not find any good articles on this said topic, but I\’m sure its hidden in few online forums, need to google it 🙂
Thank you kartik sir, I am also completed this module and i took lots of notes from your pair trading module. Thank you for your help sir.
Happy learning and trading, Vijay!
No no this trade is from backtest.
Got it, but it\’s likely to happen. No surprises.
Edit:(Excuse grammatical errors above (can\’t edit) 😛 .
Please see the following trade for the example:
LOOKBACK_PERIOD: 300Days
RegressionDetails:
COEFF: 0.785840
INTERCEPT: 220.509276
RESIDUAL_STD_ERR: 102.657799
MIN_ERROR_RATIO: 0.164728 (Y: AUBANK; X:INDUSINDBK)
ADFCheck:
ADF (p-value): 0.020033
Entry: 2021-04-01
STD_ERR(Z-score): -2.599084
AUBANK(Y) LONG_ENTRY_PRICE : 1267.90 QTY: 500
INDUSINDBK(X) SHORT_ENTRY_PRICE: 993.30 QTY: 900
Exit: 2021-04-30
STD_ERR(Z-score): -0.477996
AUBANK(Y) LONG_ENTRY_PRICE : 1004.30
INDUSINDBK(X) SHORT_ENTRY_PRICE: 934.95
Yes, this is a possible situation wherein one of the stock moves in the opposite direction while the other stays flat. I\’ve experienced this too. Nothing much that can be done with this. But you held this trade for 30 days? Dint you get a better exit during these days?
Hi Karthik,
I have implemented the above mentioned strategy in python. I was found some weird trades while backtesting the strategy, for some of the trades PNL was actually increasing in +ve direction cases when Z-score(residual/std_err_of_residual) was approaching towards stoploss and also in some cases when the Z-score was approaching towards the mean PNL was becoming negative. Can this happen or I made a some mistake in the implementation(I\’ve reviewed the code many times)?
Congrats! I wish I had the skills to program stuff 🙂
Profits cant increase when the trade approaches SL, I think there is some error here. In fact it is the opposite behaviour. Guess you will have to integrate through and identify this.
Hi Karthik,
Thank you for the prompt response 🙂
One more doubt : Between R1(St err of intercept/ St_error of residuals) and R2(intercept/actual value of Y) which ratio should be given more weightage for decision making?
For a pair of stock I am finding the following values
R1=0.64 and R2 =18% when regressing Y on X
R1=0.72 and R2 = 0.10% when regressing X on Y
Which one ideally should I choose?
Best,
Rohan
Tricky, since both are quite close. I\’d suggest you establish the entire model and see which performs better when backtested.
Hi Karthik,
May you kindly help to understand the following doubts?
1) Beta/Hedge ratio of the two stocks can be negative (most probably for unrelated sector), and hedging in that case might be done either by buying both or selling both, is it correct? Same sector negative beta sounds strange and we should avoid such trade?
2) Intercept of the regression, if negative, we should discard that X, and Y combination as negative intercept (fourth quadrant) doesn\’t make sense realistically for predicting the Y price, am I correct?
3) For very close error ratio of X, Y combination is there any threshold(delta of more than 10% in error ratio between the two combination etc) beyond which we chose one combination over another?
Best Regards,
Rohan
1) Yup, true if its -ve
2) Yes. But do try changing Y and X and run the regression again
3) Hmm, the close range should be ok. You can go with either.
Sir,
While calculating std-err = TODAYS residual value/ std error = 20.92/22.77
In regression report the 1st residual value is the oldest data as the series is (oldest-newest format) so for today’s residual value should we not take the residual value from the last slab instead of the first slab .
Sir just noticed our linear regression test only gives us p-value
Is that enough whether to know a pair is stationarity or not given probability is <5%
Hmm, not really. YOu will have to do the ADF as well.
Sir understood the concept I\’m stuck at Adf test.How to approach and ask a programmer to create a system for me when he has zero knowledge about pair trading, my brother knows python,what to ask him?
Sure, please do. Also, do use the plugins other readers have suggested.
Hello Karthik,
This article is very well explained covering all concept of linear regression very much effectively. Do we still share such trades somewhere or do we have any place in Zerodha where can scan and pull such trades for pair trading?
Glad you liked the content Ravi. We stopped sharing the pair data long back.
Sir can I just follow first pair trade method which you discussed in the module
No idea about programming or algo
Sure, you can. See how it goes for you.
Dear Sir,
Consider two scenarios, (meets all the criteria of pair trade)
1. Have been tracking pairs for a while. Consider, One pair, Standard error is 1.61 (after yesterday\’s closing) and after today\’s closing the standard error is 2.54. Can we initiate the trade or what is the probability that it can reach 3SD and not to trade that pair?
2. Standard error after yesterdays closing is 3.23 and after todays closing the standard error is 2.72. Can we initiate the trade or will the pair come back to 3SD?
Have been also practicing multivariate regression in excel using NUMXL for ADF. The above problem / doubts arises even for multivariate regression.
Please clarify. Thank you.
Assuming all pair trade conditions are met.
1. The chances that it will go from 2.5 to 3 sd is about 1% and going to 1.5 sd is much higher
2. Can\’t guarantee how it moves but the chance that sd will move close to 1 is higher than moving above 3
and mean of residual tends to Zero only?
Yeah.
what actually is beta, is it the slope of X and Y only?
also, are we calculating the z-score of residuals only? which means z=[(current residual)-(avg of 200)]/standard error of residual
Am I correct
That\’s right. Also, beta is the slope of y (dependent variable) over x (independent variable).
Hi Sir,
From the comments I could figure that dates are 23-Aug-2017 to 11-June-2018. My coeff, intercept, std_err and sigma are matching with yours 12th June updated sheet, but not the p-value. I tried with lag of 14 (sqrt of 200) as well as 5 (cube root 200), along with no constant and no trend.
I have used both statsmodels.tsa.stattools.adfuller function and arch.unitroot.ADF function in python.
Will it be possible for you to share which function are you using in your code to calculate ADF p-value? I just want to verify my results before taking a trade.
Thanks
Robin, unfortunately, I don\’t have the code, had to use my friend\’s code and he obliged since this was for the educational purpose 🙂
Hi Sir,
Thank You! for sharing in detail.
Can you please let me know what days of data (date-range) is taken in the input of code of Pair-data sheet (https://zerodha.com/varsity/chapter/live-example/)?
I have made a code that downloads the last 200 days of data from yahoo finance, but getting different p-values. I just want to verify my results with yours.
Best Regards,
Unfortunately, I don\’t have the exact dates, but from the trade snapshot, I can see its around May 2018.
Hi,
Thanks for sharing all this details.
I\’m a bit curious to learn about multivariate regression. could you please help me with more details please.
Regards,
Chaitan
That is a slightly complicated task, Chaitan. Not many would want to look into that, hence refrained from discussing it.
HI Karthik,
First of all Guru Namaskar. I really became a fan of your teachings.
Indeed, your articles are well organized, the choice of words are comprehensible and particularly the metaphor or analogy you put together to explain jargons are really easy to understand the nuances of the trading and investment.
Sincerely,
Kumar
Thanks so much, Kumar! I hope you continue to like the article here. Happy reading 🙂
Here, Standard Error(Std_err)/Z-score (or Standard score, as referred to in statistics) is defined as a ratio of (Today’s residual) over (standard error of the residual). I\’m having a doubt that it should be (Today’s residual – Mean Residual) over (standard error of the residual) to make sense.
Kindly correct me if I am wrong.
Hmm, but the residual itself is estimated by the difference right?
Hello Karthik,
Is there any third part software company or website who provides the pair trading data on daily basis with subscription basis?
Thanks in advance
Not sure about that, Manhar.
hello karthik
can you please through some light on the working of mulivariant regression
That is a different module on its own 🙂
Sir, I understand beta neutrality but what to do if we required to sell in spot market for beta neutrality…..
That you cant, so you will have to choose in such a way that long spot offsets short futures.
Hey karthik,
I coded up the algo to get the pairs and I have got around 143 of them for stock in nifty100. My question is how should I validate the resulting pairs? Is there a source from where I could validate my results? I need a way to validate these pairs and make sure that they are. indeed correlated and that there\’s no error in the implementation of things
You will have to validate the pairs quantitatively. I\’m not sure about any other source to do this 🙂
Hey Karthik,
Once we have pair ready and a signal is generated, we are initiate our positions using just stocks as well right? My concern is, I might not have enough capital with me for initiating multiple pair trades simultaneously with futures if the signals arises.
Yes, just stocks. Unfortunately, pair trading is a capital intensive affair.
Are you still regularly uploading the pair datasheet?
If not are there any other traders doing and posting it online?
No, I\’m not. Not sure if others are doing as well.
Can you show how to find ADF values through paid plugin in excel?
I\’m sure there are quite a few available, I\’ve not really looked into this.
hi Karthik,
as naked futures required huge margin, how about doing spread with options?
but i had a doubt in this,
for a pair x and y.
given x>y
i have two choices
1) do debit spread for both: buy call spread for y and buy put spread for x
2) do credit spread for both: sell put spread for y and sell call spread for x
or maybe mix and match, sell in one, buy in another, but respectively with our assumption of the future direction,
Please guide, Thanks a lot
I\’ve never really thought of this from options perspective. But options can be tricky as it has greeks playing on it. Pair trading is a pure directional play (delta), you don\’t want to complicate it with other parameters. However, since I\’ve not really thought through this, I\’m not sure 🙂
Thanks, Karthik,
I would also like to ask your views on using
spread as: stock(a) – stock(b)
or
spread as: stock(a)/stock(b)
rather than the residuals (y_predicted-y) which we use?
stock(a)/stock(b) — basically as a ratio.
hi Karthik,
quantsapp recently released a pair trading tool on their app and they are using 20 days lockback to calculate SD rather than the previous 200 days.
I tried their backtesting tool with 20 days and 200 days lockback for SD. and 20 gave better results.
1) Could you please check which lockback period would be appropriate?
2) if we want to choose 20 days, then does that mean that we have to do the calculations daily, rather than what we were doing before, like updating our sheet every 2 weeks because we took 200 days, but that won\’t work in 20 days, right?
Thanks
I\’m not familiar with the app, so I\’m not really sure, Ronit. Ideally yes, you need to run the calculations daily. Once you take the trade, you freeze it trade.
Hi karthik, appreciate the response,
Can you please provide data which categorized stocks of the same group.
Anything would work, a link to a source, maybe google sheet link, website, or my mail id: [email protected].
I have already tried to group these stocks but I\’m not able to do a good job. Please help.
THanks
I dont seem to have that anymore, let me check again.
16 0.190 0.92 39.171 0.001 3.544 0.0 \”Auto\” BHARATFORG APOLLOTYRE
They both belong to the same Auto Index.
I used this website:
https://www.topstockresearch.com/rt/IndexAnalyser/FuturesAndOptions
to get which futures scripts belong to the same group.
Some stocks didn\’t have a group, so i grouped them together( I shouldn\’t have done that, my bad)
414 57.262 0.92 1633.833 0.000 92.470 -0.0 \”misc\” ACC TATACHEM
could you please provide your groupings of stocks, I searched the internet and nse by didn\’t get it..
It would help me a lot.
Other than this, do you think there is some error in the calculations, or it\’s common to get these low p_values between stocks of same index.
Thanks
Ronit, group them by intuition and then figure further details. For example, I know HDFC Bank and ICICI Bank is a good pair. But is HDFC and Corporation Bank a good pair? No, because one is a Pvt sector bank and the other is a PSU. The bank\’s size is also not comparable. Similarly, Mindtree and HCL maybe a good pair, MindTree and Airtel may not. So you have to put intuition behind paring.
Low P-value is possible.
hey karthik,
Could you please confirm that is it unusual to get p_value much smaller than 0.05, I am getting 36 pairs with p_values less than 0.01 with the historical close price of last 200 days
beta corr intercept p_val residue_error residue_mean sector xstock ystock
2 3.162 0.92 702.674 0.009 89.343 -0.0 Auto AMARAJABAT BAJAJ-AUTO
7 0.245 0.93 65.888 0.002 24.059 0.0 Auto HEROMOTOCO AMARAJABAT
8 0.899 0.96 215.872 0.003 18.769 0.0 Auto M&M AMARAJABAT
10 4.698 0.93 191.660 0.000 24.011 0.0 Auto MOTHERSUMI AMARAJABAT
16 0.190 0.92 39.171 0.001 3.544 0.0 Auto BHARATFORG APOLLOTYRE
22 45.280 0.92 882.464 0.001 174.972 0.0 Auto APOLLOTYRE MARUTI
24 282.852 0.93 32816.837 0.000 1039.562 -0.0 Auto APOLLOTYRE MRF
43 0.864 0.96 726.155 0.008 64.844 -0.0 Auto HEROMOTOCO BAJAJ-AUTO
84 3.394 0.95 720.147 0.004 78.234 0.0 Auto M&M HEROMOTOCO
308 0.584 0.92 373.481 0.000 12.201 -0.0 FMCG UBL MCDOWELL-N
344 1.078 0.94 79.684 0.000 5.656 0.0 Metal NMDC COALINDIA
389 0.029 0.94 9.636 0.003 1.287 0.0 misc CENTURYTEX ACC
410 12.333 0.95 152.284 0.000 15.783 -0.0 misc ACC NIFTY
414 57.262 0.92 1633.833 0.000 92.470 -0.0 misc ACC TATACHEM
460 16.068 0.92 716.933 0.010 93.179 -0.0 misc ADANIENT TATACHEM
16 0.190 0.92 39.171 0.001 3.544 0.0 Auto BHARATFORG APOLLOTYRE
22 45.280 0.92 882.464 0.001 174.972 0.0 Auto APOLLOTYRE MARUTI
24 282.852 0.93 32816.837 0.000 1039.562 -0.0 Auto APOLLOTYRE MRF
43 0.864 0.96 726.155 0.008 64.844 -0.0 Auto HEROMOTOCO BAJAJ-AUTO
84 3.394 0.95 720.147 0.004 78.234 0.0 Auto M&M HEROMOTOCO
308 0.584 0.92 373.481 0.000 12.201 -0.0 FMCG UBL MCDOWELL-N
344 1.078 0.94 79.684 0.000 5.656 0.0 Metal NMDC COALINDIA
389 0.029 0.94 9.636 0.003 1.287 0.0 misc CENTURYTEX ACC
410 12.333 0.95 152.284 0.000 15.783 -0.0 misc ACC NIFTY
414 57.262 0.92 1633.833 0.000 92.470 -0.0 misc ACC TATACHEM
Thanks 🙂
Ronit, on what basis have you selected the pairs? ACC and Tata Chem? Bharath Forge and Apollo tyre?
in the live trading example, you said that the trade is skewed towards the long side, but isn\’t it skewed to the short side as you have sold a greater number of shares than the beta demands?
Ah yes, thanks for pointing that.
Thank you so much!! I will surely look into it.
Great. Happy reading 🙂
Hi Karthik,
This is a lockdown period when I am reading you. Thanks for writing the best tutorial on the internet. loved reading Varsity.
now I need technical assistance here, do you know API or endpoint connection to get excel data (at the start of the chapter) of all stock prices and their sectors?
Thanks
I\’m glad you liked the content, Ganesh. I don\’t have much idea on the API, but please do check if this helps https://kite.trade/.
sir AS you mentioned about \”sigma value will teach you again \” at which period we can except sir?
Sigma is nothing but the standard deviation, Jaya.
This really peaked my interest in trading, are there any other strategies that I could read?
Thank you 🙂
There are plenty, Kumar. I\’ve discussed whatever I know 🙂
I guess the if adf values goes beyond the threshold ( say 0.2) i will immediately take a loss and exit the trade. If the adf value is 0.2 chances are it might not converge at all. I hope i am correct on this. 🙂
I hope so too. For this reason, backtest and be prepared 🙂
Hi Karthick,
Thanks for the reply.
I have two questions
1. Assuming that we calculate adf value every day during the trade, there should be a threshold for the adf value. If that goes beyond the thresh we should book a loss and exit the trade. My guess is this should be greater than 0.05 otherwise even slight change in adf value (say 0.05 -> 0.6 and back to 0.05 the other day) would make us keep hopping between entering and exiting the trade. What do you think should be the threshold of adf value to exit the trade.
2. The regression parameters are also not stable and would vary each day we re-perform the analysis. Suppose we enter a trade at z-score of 2 and wait for the z-score to come down to 1. It it possible that by the time it reaches 1 the regression parameters has drastically changed and we are are getting a loss even if the z-score is 1 at the time of exiting the trade.
1) Hard to say, because this can drift from 0.5 to 0.6 to 0.8, which would only increase the losses right? So how would you accommodate for that scenario?
2) Yup, part of the trade. Parameters change as and when the price changes. It is just that the change is drastic when there is a drastic movement in price.
Hi Karthik,
Suppose i initiate a trade with low adf value (<0.05). However in between the trade the adf value rises to greater that 0.05. Should i close the trade or disregard the adf value as we have already entered a trade?
Thanks
You need to keep ADF in perspective, you cannot disregard that 🙂
Hi Karthik,
First of all, thank you so much for the awesome content, this is gold!
Q1: How are you calculating the standard_error (I know its today\’s residual upon standard error of the regression model), but should we run regression every day with last 200 records and calculate the standard error for today\’s price using the newly ran regression model?
Q2: When we identify a trading opportunity and keep track of the z-scores, how are you calculating the z-score, again should we run a new regression every other day or just use the last regression model when we identified the trading opportunity to calculate the residuals (and then z-score)?
Regards,
Amit
Regression relation between stocks is not stable, they keep changing with time. Hence its recommended to perform regression analysis regularly [preferable daily or at least weekly]
The pair data sheet which you shared is an output from pair trading algo right?
If someone wants to perform whole process in excel then he/she has to perform the following steps:
– Download clear data from NSE Bhavcopy.
– Run Linear regression;identify suitable X &Y through error ratio.
– Then we check if the residual time series is stationery or not which can be checked through p value or the 3 conditions i.e. mean, SD, Autocorelation.( Can that P value directly comes in excel through some formula maybe T distribution?)
– Now here is big hurdle how to check p value of pair?
– Also there are so many pairs in your data sheet. Am i suppose to follow the same process as above to get the right pair and form my own pair sheet or the one which you provided back in 2018 is still good to use.
Lastly, I am extremely sorry that i am buzzing you up with lots of queries and at the same time extremely grateful that you are so humble to read each and every comment and respond it back.
Thank you.
1. Download clear data from NSE
2. Run linear regression on stock pairs from same industry, and identify suitable X&Y from error ration
3. Check if P-value of beta < 0.05, then perform ADF test on Residual, if the P-value of ADF test is also < 0.05, the pair is eligible for trading
4. If the standard error indicates a trade (i.e. if it is above +2 SD or below -2 SD), take the positions
5. Track the trade and close it
Perform this analysis every day. The sheet given in 2018 is valid for that day/week, you can't use it today.
For Non programmers the pair data sheet which you made available in the end does that rightfully tells that these are the pairs we can track. Also how do we get P value since you said its not available online. Is there by any chance some way from where we can get P value. Last question is standard error (today\’s residual/ std error of residual) same as Z score?
Unfortunately, the plan to support with updated values did not go through, hence you will have to calculate the P values yourself. Yes, they are the same.
Doing great job. All the best.
If I am not wrong, Z score and Std_err are same right?
Hmm, yes sort of.
Thank you. Your explanations are really easy to understand and follow. You\’ve done more than a great job. I just have a question, I would assume you have collected lots of data about this technique, what is the win:loss ratio using this technique? Thank you in advance.
Its got a decent success ratio, unfortunately, I cannot plug in a % here. Just that its a bit complex to implement.
Based on your next chapter, it appears like such ratios are common. However, will appreciate if you can confirm based on your experience.
Yup, it is.
Brilliant stuff Karthik! I read multiple places about stat arb but yours is the best explanation.
I followed your steps but I\’m getting some weird beta values. In addition to negative ones, which I\’m ignoring, I also get combinations that are highly impossible. E.g. 1 TataMotors to 0.2 AshokLey i.e. 5 TaMo to 1 AL. Are such values normal or do you think there is something wrong with my process? Thanks in advance
What is the time frame you are looking at? This maybe possible if there are crazy movements in stocks. I\’d suggest you skim through the data set once. Also do a hygiene check on the data, ensure its clean for all sorts of corporate action.
hai sir gold vs silver correlation 0.78 but adf test is 0.832 and z score was 2.70 is it trade worthy sir.
Probably 🙂
Trending Markets do make it tougher to recognise actual trading opportunities. Since my complete model depends on historical data of past 200 trading sessions, then my output would become wrong in case of wrong selection.
I am actually new to trading, can you please elaborate on your suggestions.
1. You said about taking data of stock pair deviating at least 100 points. Is this mean to take you want the actual difference be more than 100 and consider only those data points for my Regression model instead of considering continuous daily data.
2. You talked about using different lags in adf test. Currently I am using ad fuller algorithm in python from stats model library. By default it uses some lag value based on a formula or we can explicitly input it. While researching I found using AIC is best option for lag. You said to use up to cube root of 3, does that mean use multiple lags till that number ? Please clarify
Thanks for the quick reply.
But using different Z-Scores wouldn\’t invalidate the hypothesis we were using ?
We were taking Z-Score bracket of 2.5 & -2.5 since it is highly unlikely to reach that level & it would come back to Z-Score of 0 with high probability, making it profitable.
I created a simulation to track the Z-Scores of eligible Pairs and found no discernible pattern which has high probability of profitable trade. The Z-Scores were diverging or converging randomly.
I can share the simulated data with you, if you want.
You are right on the Z score, but we are trying to establish the possible pattern for stocks. Some may just trade within -1.5 to +1.5, who knows.
Btw, when markets are trending, almost all stocks move in the same direction, due to which you will get high r2 score and low p-value. One should be cautious about it. Instead of number of data points, I\’d suggest a window where the stock pair trend had deviated but not less than 100 points to avoid sampling error. Ideally, you should perform adf test for all lags, however, multiple experiments have shown that performing up to a lag of cube root of 3 is good enough. This is more a thumb rule followed by traders rather than a mathematical proof.
Hello Sir
I tried using your pair trading method by writing an algorithm in Python. The algorithm followed the following steps :
1. Extract Stock prices for all Stocks (for which Futures are available) for past 200 trading sessions
2. Run Linear Regression on all possible combinations of pairs, identify the independent variable & apply ADF test
3. Identify all pairs having Z-Score either greater than 2.5 or less than -2.5
4. Track daily the Z-Score basis the regression outputs
But more than 50% of times, the prices were diverging i.e. the Z-Score crossed 3 or -3.
I also backtested the approach and calculated next 15 trading session Z-Score for past 200 Trading session prices but found no visible pattern for high success rate.
Am I doing something wrong or this trading system doesn\’t actually work ?
Aseem, these are the broad steps. You will have to start calibrating this for results. For example, try -1.5 and +1.5 with 2 as SL or something like that. This is true with all strategies, you will have to calibrate the parameters and find your edge 🙂
Hi Karthik,
I wholeheartly thankful to you and team Zerodha for such a wonderful educating efforts.
my query is,
When i initiated trade, Z-Score for my pair is 2.56 and ADF test p-value <5 % [all other parameters are within as per your explaination]
but after 2 days Z-Score is 2.93 but ADF test p-value is 5.5 % [crossing critical value of 5 %]
So is it worth to hold the trade till Z-Score to be (3 for SL or 1 for Target) or to exit the trade as ADF test p-value is not favorable now?
Depends on you risk appetite, Sorabh. I tend to hold till 3SD, but there are times when I\’ve gone ahead with gut feel and cut/booked earlier to 3SD and that has proved to be the right call.
Hi karthik,
One last question with respect to today\’s residual/sigma.
Then excel data imported contains close prices in chronological order ie oldest close in first row and latest in last row below.
After running the linear regression which residual do I use. The example shown by you inputs observation 1 residual as numerator.
In my calculation should I use the last row observation 200. kindly correct me if am doing something wrong here.
Yes, I\’d suggest you use the last row.
Hi Karthik,
With respect to negative Beta.
UBL (Y) = -0.49 (Mcdowell)
may be it works out to be 4 lots of UBL to 1350 shares in mcdowel.
I know we avoid trading negative beta. what are your comments on this position sizing?
Thanks
Sunil, I\’d suggest you ignore pairs with -ve beta. It is very hard to get the positions right in such cases.
Karthik,
Since I have no programming experience, request you to kindly share last 300 days data for all equity based securities, will add the daily data myself going forward. Or if this is not feasible then please share some script with instructions. Thanks in advance!
You can always download the same from the NSE\’s bhav copy or you could subscribe to data services from a data vendor.
Sir,
I run pair trading algo myself and found some pair like…
x = RELIANCE
y = IOC
beta =-0.1058
intercept = 280.036
closing price of IOC on 30 Aug = 122.45
Now as closing price of IOC for 30 Aug is 122.45, so as you pointed out in very last chapter of Pair-trade that, intercept is value by which model can\’t estimate value of y-stock (IOC in this case). So,if we apply this logic here then,it implies that,Regression model can\’t predicate IOC(y-stock) price 280.036 out of 122.45(or around -128%). I know this is very tricky.So, can you please clarify this situation as I am getting same thing with all pair which have negative beta.
Thanks
Kevin, -ve beta is a tricky situation and from experience, the model break when we face such a situation. For this reason, I avoid trading such pairs.
Karthik,
First of all thanks alot for this knowledge bite series on trading analysis and specially on pair trading. Love this piece, so simple to understand.
Request you to kindly tell from where we can download 200 day (historical) data in one go for all equities? On NSE\’s Bhavcopy, it is daily data, which needs to be compiled for 200 days. Please help where to get this data. Thanks
Hiren, I\’m glad you liked the content. Bhavcopy is the best source, but you will have to figure a way to build a script which will compile and download in 1 go.
In chapter 15 you share a Exls how to calculate Intrinsic Value in excel
Share Price (INR) = (F23-F26)*10^7/F29
Share Price (INR) = (Total PV of cash flow-Net Debt)*10^7/Number of Shares
in formula 10 is the 10% then i can\’t able understand the 7 which u used
please clarify my doubt on 10 (if not 10%) and 7
Alekha, are you sure you are referring to a chapter in this module? I\’m unable to get the context here.
i taken data 10 minutes time frame for 60 days in excel i got nearly 1640 cells .
correlation bpcl vs hpcl 0.72
but, density curve reaches to 0.000234 below or 0.99986 above near to 1
my question was what is the differences between collecting data for 2 years and 10 minutes time frame for 60 days ?
which one should i need follow ? sir
I\’d suggest you stick to daily EOD data, simply because the noise component in your intraday data is quite high.
SInce I am not a coder I tried for some free sources to calculate ADF test and found an excel plugin called as Real stats (http://www.real-statistics.com/) If you spare some time to look into it and write an article how to use the plugin it would be helpful
Thanks, I will try and do that as soon as time permits. Thanks.
SInce I am not a coder I tried for some free sources to calculate adf test and found an excel plugin called as Real stats(
Can we use error ratio concept to decide which one is stock A and stock B 1st method of pair trade you explained? If not so how can we decide stock A and Stock B to calculate the ratio StockA/Stock?
Hmm, but since this largely based on correlation technique, it does not really matter which is Stock A and B.
The second highlight is 20.914, which is the residual.
The std_err in the report is simply a ratio of –
Today’s residual / Standard Error of the residual
= 20.92404/22.776
= 0.91822
sir, I got confused with this calculation as in the paragraph u have written that u want to find the position of the current residual in the distribution of residuals if I am not correct u I trying to calculate the zscore of the residual I am may be wrong but for zscore (data point -mean of the distribution /std of the distribution but above u directly divided the residual with std is something else u are trying to calculate pls clear
pls clear do we subtract the mean from residual value or not to get the z score
Yes, thats right Shashank. The idea is to figure the z-score of the residual. I guess someone had a similar query, have answered the same. Can you please run through the comments?
Sir, I know u must be busy but it would be great if also do a chapter on PCA and if u can point me to some resource which u came across which explains PCA without heavy maths pls share
Sahil, here is a chapter on PCR – https://zerodha.com/varsity/chapter/max-pain-pcr-ratio/
sir, I was asking the reference to principal component analysis pls share
We dont have anything on the Principal component analysis yet. Will try and see what best we can do about this.
sir , as u have been mentioning in all the chapters in order which pair should be y and which should be x we look and error ratio wich std error of intercept /std error of the residuals but sir I couldn\’t get the intuition behind it like simple intuition for r squared is tries tell how much y explained by x could be wrong this pls correct. So how is error ratio helping
Sahil, the idea is to pick a pair (by identifying x and y), in such a way that one variable explains the maximum of the other.
The second highlight is 20.914, which is the residual.
The std_err in the report is simply a ratio of –
Today’s residual / Standard Error of the residual
= 20.92404/22.776
= 0.91822
sir, I got confused with this calculation as in the paragraph u have written that u want to find the position of the current residual in the distribution of residuals if I am not correct u I trying to calculate the zscore of the residual I am may be wrong but for zscore (data point -mean of the distribution /std of the distribution but above u directly divided the residual with std is something else u are trying to calculate pls clear
Sahil, yes…the idea is to figure out the position of residual wrt to its average. In other words, the Zscore of the residual.
please see the weblink. I used this method to find ADF. For your ref.
https://www.quantinsti.com/blog/augmented-dickey-fuller-adf-test-for-a-pairs-trading-strategy
Sir, I used some online information for calculating ADF wherein the regression is run between Delta of residuals and t-1 residual. Is this right way? Because as you have stopped updating the pair data, the most calculations must have changed. When I did Eicher (Y) and Bajaj Auto (X) I got following
Intercept = 12263
Std error = 3274.478
Slope = 4.26
ADF = 19.14%
So I have two questions to ask:
1. Should I change Bajaj Auto as Y and Eicher as X. What will be risk. (I guess as you mentioned in the 1st few chapters that you may get 2 or 3 trades in one pair a year, changing X to Y and vice versa may not help. Also it means one must wait for the ADF to be favorable over time.)
Or
2. Where can I get ADF plugin for Excel. (I have no idea how to use python or do the same in R even if there is plugin available)
Regards,
Narendra
Delta of residuals and t-1 residual. Is this the right way? — I dont think so, Narendra, but I cant point a finger and say why. Will get back on this.
1) The decision of which one is X and Y is really depended on how strongly one can explain the other (in terms of daily variation). Go ahead and do it and check what results you get
2) This even I\’m not sure 🙂
Sir pair data sheet which is available to download is it updated or we have to download 200 day values, regress it and do it ourselves? Thank you.
Its not updated, Kiran. We stopped doing it long ago.
Okay. Will you suggest any vendors or sites where we can subscribe and get latest pair data updates? Thank You.
I\’m not too sure of vendors who provide this data, Kiran.
Hello sir, small correction in log of 18th may, 3.30 PM values of X and Y are entered opposite. I was going through and it showed me profit of 518350. For a second i had a big smile,haha!
Ah, need to check this, Kiran. Thanks for pointing this out.
Hi Karthik
Do we not have to run Correlations between all the stocks of a sector, say all stocks in nifty bank, BEFORE doing the regression analysis?
We did that in the first case.
Thank you.
Should we not run regression on only those stocks that are statistically significantly correlated >.75?
Should we run regression on all stocks without looking at their correlation?
Thanks
Is the stationarity of the residuals a necessary and sufficient condition of a statistically significant correlation?
Would running correlations apriori not reduce the number of regressions needed to be run?
Would running correlations apriori exclude some trading opportunities that would otherwise have been spotted by NOT doing a correlation analysis and only looking at the regression and cointegration of the pair?
Thanks
I\’d suggest you to not look at correlations if you are using this approach to pair trade.
You can, this really depends on the program that you have developed.
Thanks
Dear Karthik
At the end of the chapter you talked about trading using multi variate regression. Could you please point to a source where I can read this?
Thank you so much.
Unfortunately, I\’m unable to find a good/reliable source for this, Prafulla.
Thanks
Welcome!
Hi when I downloaded that excel file I can just see the variables confined to that particular date and time. What can I do to run the excel file for any given date and time?
That sheet is just to demo the trade, Kaushik. It does not run on its own.
Can u tell me how u calculated adf value and error ratio for all pairs of stock in excel?
Kaushik, its explained in the chapter itself.
I recently read this thesis paper by Hakon Andersen & Hakon Tronvoll in which they did pair trading using PCA(Principal component analysis) and Density Based Clustering. Which one is better? Linear regression method or PCA method. Can u add and explain this PCA method in zerodha varsity website?
I\’ve never used PCA method, Kaushik. Rather, I\’m not sure about the technique to do so. But if I were to guess, PCA would be nice, since PCA emphasis is only on factors which explain the maximum variance, ignoring the other factors.
Dear Nithin , I want your advice on technical course available online ,which as per your recommendation is best suited for professional who want to understand the technical analysis from beginning to advance level .
Dharmendra, frankly whatever you need to know is already available online on Varsity. Why do you want to spend money?
Hi Whats your take on USDINR & EURINR PAIR Trading. Have you analysed or tracked the pair.
I\’ve not really looked into this.
Sir, how do we do this on intraday basis?
Should we use last 200 EOD prices and track z score at suitable intraday frequency to look for opportunities or should we use last 200 candles of corresponding intraday frequency?
I\’d suggest last 200 days EOD candles, Kushal.
Dear Karthik,
Some of the stocks don\’t have Futures but only Spot. for ex. Andhra Bank, Bandhan Bank etc. hence they don\’t have lot sizes.
Do we need to avoid such stocks or there is a way of pair trading in them?
Hmm, as long as you only need to go long on this and short the other stock\’s future, it should be ok.
Dear Karthik,
My apologies, I didn\’t get it. can u plz elaborate, probably with example?
Meaning, the X and Y ordering should be such that the non-derivatives stock always needs to be bought and the derivative on needs to be shorted, if this is taken care off then you can look at the combination of non-derivative stock + derivative stock.
Dear Karthik,
I have 2 queries.
1. Initially it was told that data available (lock back period) shall be atleast 1 year, it is better if it is 2 years but at the end of module, it is told that 200 days data is best? which statement is correct then?
2. If I see today that two stocks are co-integrated and their residuals are stationary then does it mean that they will remain co-integrated (along with stationary residual) in future too? or we need to check co-integration and stationarity at frequent intervals?
1) 200 data points is roughly a year, Arun. So stick to at least a year.
2) Not necessary, the stationarity may break based on price movement (drastic price moves).
Regarding Point No. 2, does it mean that I need to run adf test DAILY till I find p-value<0.05?
Yes sir, its better that way.
Hello Karthik,
Thank you for interesting series. I have 2 questions:
1: Given that X and Y are stock prices – shouldnt the beta neutrality be applied on nominal exposure so if tata motor (Y) – Tata Motor DVR (X) has a BETA of 1.59 shouldnt it mean that exposure on tata motor should be equal to 1.59 times the exposure on Tata Motor DVR? so if nominal value of one lot of tata motor is (1500*331.65) Rs 497,475 the exposure i need to take in DVR is 1.59*497,475 = 790,985 which translates into 4064 shares of DVR @ 194.65. please clarify?
2: In computing the Z score shouldnt we see how far is the current datapoint from mean rather than absolute value. so Z score should be (current value of residual – mean of last 200 onservations)/ standard deviation of 200 observations of residual. Please clarify?
Many thanks,
Vipin
Given that X and Y are stock prices – shouldnt the beta neutrality be applied on nominal exposure so if tata motor (Y) – Tata Motor DVR (X) has a BETA of 1.59 shouldnt it mean that exposure on tata motor should be equal to 1.59 times the exposure on Tata Motor DVR? ——-> This is correct.
so if nominal value of one lot of tata motor is (1500*331.65) Rs 497,475 the exposure i need to take in DVR is 1.59*497,475 = 790,985 which translates into 4064 shares of DVR @ 194.65. please clarify? ————-> Beta adjustment should happen on the stock price, not the contract value. Remember, price is already factored in when computing the Beta.
In computing the Z score shouldnt we see how far is the current datapoint from mean rather than absolute value. so Z score should be (current value of residual – mean of last 200 onservations)/ standard deviation of 200 observations of residual. Please clarify? —————> This is how Z score is calcualted. Not sure if I\’m missing the point here.
Hello,
how to convert MIS to CNC before squareoff.?
thanks in advance
Check this – https://support.zerodha.com/category/trading-and-markets/margin-leverage-and-product-and-order-types/articles/how-to-convert-mis-to-cnc-nrml-and-vice-versa
Hi Karthik,
First of all loved the way you explained this complex subject.
I\’m bit confused while selecting the lot sizes of X and Y. If Y= m*X (m is slope/beta) then for 1 lot of X is equivalent to m lots of Y (substitute X=1 in equation Y=mX ). But you have taken other way round. Am I missing something when you say \” beta neutral \” ?
Thanks and cheers. 🙂
Govil, Y = Beta * X, restating this
X = Y divided by Beta
Not sure if I\’m missing your point.
Thanks for the reply Karthik,
You are right X = Y divided by m. So for one lot of X you need m lots of Y (substitute X=1 in Y= mX). BUT in 13.3 LIVE EXAMPLE of Tata motors and Tata motors DVR, this is what written (copying directly)
\”The beta neutrality states that for every 1 stock of Y, we need to have beta*X stock of X\”. This is applicable to equation X=mY by substituting Y=1lot, you get X=m lots. As per my understanding, its not Y=mX equation. Please correct me if I\’m wrong. Thanks.
Govil, let me go through this again.
HI Karthik,
Can you help me with link on NSE site that gives sectorial categorization of stocks and their EOD data ?
I need to look for this myself, Ravi. Will share the link if I find.
Thanks Karthik, I thought it is available handy as you mentioned in the point below,. i tried to look it up but couldn\’t find. we can form this ourselves but its already done by NSE and readily available, one less thing to automate 🙂
\”2.The list of stock and its sector classification is already done. Hence the download is more organized\”
That was the plan, Ravi, but I had few operational issues to deal with. Will check on what best can be done 🙂
Hi Ravi, any progress made on the sector wise classification of F&O stocks ?
\”What if Stock A with Stock B is not stationary, but instead Stock A is stationary with stock B & C as a combined entity?\”
Does the statement mean that we have two independent variables and one dependent variable and if we regress stock A(dependent) against stock B and stock C combined we can generate one column of residuals and hence by that we can check for cointegration by the equation Y=mX + nZ + constant…where Y is stock A ,X is B and Z is C, m and n are betas for B and C and the constant may be considered as equivalent to intercept???
Exactly! This is how multivariate regression for trading stock pairs works.
Hi Karthik,
Thanks for this wonderful module, got to learn another very useful trading system. Towards the end of this chapter, you mentioned something about multivariate regression, I really wanted to know more about this. I have good or decent enough background in linear algebra, regression analysis, and programming, hence, I really want to dig deeper into this subject. Could you please provide some pointers to get me started on this? Thanks for all your help!
Glad you really liked the module 🙂
Unfortunately, there is not much content on Multivariate and I\’m really not sure if we should put up anything, it could be a little hard for the readers here.
Hello Karthik,
Thank you for the wonderful explanation. In some cases, I have observed that the std. error went down to -4 as a result of certain events, case in point being YESBANK from Sept 21 to 28, was a drastic drop.
Do you recommend going long when I see the error being much lower or higher than -2.5/2.5 trigger or do you think i should avoid it due to volatility. ( the error has gone back to around -2 now so if i took the trade I would have profit). On the other hand, If i took the trade at -2.5 I would have lost money going down to -4. Any idea if there is any other parameter to look at to avoid this?
These are fundamentally driven events, Sudharsan. The best case for pair trading is when all else are equal. Given this, I\’d not initiate a trade even if I saw a 4SD in the backdrop on fundamental events.
Hello Sir, thank you for strategy. Can i do this in equity than futures? the only reason being capital.
You cannot really short in Equity, so you cant.
sir unable to download 200 days closing price data from NSE’s bhavcopy. it is providing day wise data for all securities. kindly guide is there any link to download nse bhavcopy 2oo days for particulaar stock together
I\’d suggest you download the eq data, Vikas.
Sir can u post the exact link?? Even I am unable to find the 200 day report of stocks
We have not updated this, Karthik.
`Dear All I wish to know in 8k option strategy how do choose??
Thank you so much for very easy understanding language in explanation. I went through all the content here on varsity, also i went through a course for stock trading with one institute. Anyways my little confusion is when i was in Options chapter i did paper trading and made few conclusion on my trading way. Now after this chapter im in a small dilemma whether to trade options or the pair trading. First i use to trade equity, after learning options i felt equity day trading is more on luck than rational trading. Pair trading and the calculation are more rational now. Please help me understanding which is more right way to trade and more rational between options and pair trading. Happy i found Varsity,thank you sir.
Kiran, both are very different because the instruments and their risk-reward profile is very different. I\’d suggest you pick up both techniques and eventually decide which one suits you better. Good luck.
Hello Sir,
I am confused as to, for tracking position after executing the trade, we will have to calculate the std_err by using the current price based sigma , beta and intercept (by doing regression by replacing the old with new data for past 200 look back period) or the initial values which we used to execute the trade?
Because, the beta, sigma and the intercept values will change the next day if we add the recent data in the 200 look back period and so will the std_err.
In the position tracker excel which you provided the beta, intercept and sigma are kept same for 14th and 23rd of May.
Please, help me clear this doubt.
Thank you, in advance.
Once the position is taken, the new data set will exclude the oldest data and include the latest data point. The position tracker considers the pair data at the time of trade trigger.
Hi Sir,
Could you please provide the data excel for a single pair from the \’Pair-Data.csv\’ . For example please provide the data excel for Hero.MotoCorp.Ltd as YStock and Bajaj.Auto.Ltd as XStock. So that the values (intercept, beta, adf_test_P.val etc) generated at my end
can be verified against the Pair-Data.csv
That would be difficult, Manoj. I\’m trying to set up a daily source of pair data to be made available on the site. This may take some time.
Hi Sir,
Ok, understood. In that case could you please run the adf test (using your plugin) against the \’Chapter-10_Residuals.xlsx\’ excel file from chapter 10 and provide the intercept, beta, adf_test_P.val etc. So that I can check the values generated at my side against the values generated using your plugin. I need to verify this only once to make sure that the logic at my side is correct.
Sure, Manoj. I will try and do that over the weekend.
Great chapter, really enjoyed it. Also are you going to be giving the pair data sheet?
Will try and upload the sheet today.
Sir wt is use of sigma.
With due permission from Karthik sir, I will try to explain sigma,
Sigma is the standard deviation of residual, which we get while we hedge Y in terms of X.
Hope I am right!!!
That\’s perfect, Mani!
Thanks Mani..
Sigma tells you the standard deviation of the residual.
Thanks a lot sir
Welcome!
Ohh beta \”neutrality\”, been wrecking my brains to understand what beta natality could be, theek kar do sir. Also, pair trading ki updated sheet de do?
Beta is a measure of volatility between two stocks, so when you beta neutral two stocks, you are essentially trying to minimize the volatility between them.
I meant its been misspelled so I was trying to figure out what beta natality could be…also where can we find the bi-weekly update to the pairs data?
I get it now. Will make the change 🙂
I\’ll have the sheet updated t\’row. Thanks.
Hello sir,
can adf p_value be used for any timeseries data to confirm its normal distribution property sir, does it have any limitations?
Yes, it can be applied on any series on which you want to check the stationarity.
if a time series data passes stationarity test, does it mean that it is normally distributed?
I\’m not very sure about this, but yes, I\’m inclined to believe this is true.
ok sir thanks
While optimizing lookback, is net profit only criteria or any other factors need to be considered sir?
You can optimize this across any criteria – frequency of signals, profitability, risk, ADF etc
I have taken 2 lots (8000) of Baroda and 1 lot (2000) of Indianbank. But for 8000 of Baroda the lot size of Indianbank should be 2176 or for 2000 of Indian bank the Baroda should be 7352.
Thanks
Sure, as long as you ensure its beta neutral.
Hello sir
When I run the regression b/w Unionbank & ALBK for past 200 days beginning from 2nd of Aug\’17, the trading signal generated on 22nd May. The important parameters are as follows:
Unionbank(X) and ALBK(Y)
BETA: 0.437861306
INTERCEPT: 7.503194585 (19% of ALBK price)
STD_ERR: 2.714924731
Z-SCORE : -2.64
ADF: 0.0601(Lag length 14,Schwarz info criterion)
The trading signal was generated on 22nd May to go long on ALBK and short on Unionbank. Oh my God! It is just opposite of what you traded. I have cross checked my regression analysis. Please help me, sir.
Thanks
Kumar, you are right. I\’m guilty of this trade information that I put up. It misread this as 2.64 instead of -2.64, but I think I lucked out because the Z-score expanded over the next few days and I actually was in profit when I realized my mistake.
Btw, great job on this one 🙂
Sir here kumar used price data from 2nd of Aug’17 to 22nd May\’18, if so doesn\’t it workout to be more than 200 days? I think I am missing something sir?
I guess its ard 200, need to check the data points, Mani.
I get it sir, trading days.
I made a mistake in my code that calculates number of trading days sir. So was using less data points.
Glad you could rectify it.
Thank you, sir 🙂
While updating the pair data sheet, luckily i got the following trading signal on 4th June\’18.
BANKBARODA(Y) & INDIANB(X) (200 trading day data)
Beta= 0.272
Intercept= 61.9 (45% of Y)
Z-Score= -2.89
ADF= 0.0311(lag length 14)
Lot size Baroda=4000, Lot size Indianbank=2000
If i take 8000 Baroda then according to the eqn the lot size of Indianbank should be 2176.
What is you view, sir?
Except for the intercept, everything is convincing enough 🙂
Did you take the trade? If not, at least track it on paper and please share the results here. I\’m not tracking this.
Hello sir
I didn\’t take the trade but i am tracking it on paper & definitely will share it here. Btw, its my first pair trade though it is on paper 🙂
I have a question, sir. When i checked the 100 trading day data for the same pair, the ADF value was 0.5135 and Zscore was -3.58. Is it convincing that we should check this way or should stick with 200 data set?
Thank you 🙂
I remember doing some optimization on look-back period and if I remember right, I figured 200 days is the best look back period. You may want to do this yourself once 🙂
Hi Mayank,
Thanks for constantly sharing your insights on the pairs. I check the z-score and getting -2.09 for 200 days. Not sure where the error is ? Can we connect on at deepucal at gmail dot com.
Thanks
Deepu
I was testing my algo on the trade that you took on 23rd May
x = UnionBank
y = ALBK
beta = 0.437
for that trade I am getting adf_p_value = 0.3637
am I missing something here sir?
also sir for TATAMOTORS–TATAMTRDVR trade what was your look back period sir? because for that also my backtest values are not matching
Look back period is 200 days.
but I am gettings same backtest value for ICICI HDFC price data that was provided in the earlier chapters sir, is it possible for you to share closing price data for TATAMOTORS–TATAMTRDVR, I think that would help me a lot.
Mani, go back 200 trading days from 10th May, that would be my closing price data. Also, this data was obtained from NSE bhav copy.
What lag did you select for the ADF test, Mani? I think the algo we use has a lag of 14.
Look back period is 200 days.
Sir what I found is that there is a slight change in beta = 1.67, because of which intercept = 21.96, residual=-19.21 and sigma=5.82 is also different. Because of all these changes adf is different
Value that I got from my algo is same as excel output, so I guess I can continue.
Is my conclusion good enough sir?
Hmm, maybe Mani. Request you to check this across multiples examples to be doubly sure.
Dear karthik,
There is one website, pairtradepro. Com which is giving pair trade signals.
Can you anything sure about that???
I\’ve never really tried it, Ashwin. Hence cant comment on it.
Hi karthik sir,
Thanks for your lessons on pair trading. I want to know is it possible to do pair trade in commodities as well like GOLD:SILVER, COPPER:NICKEL, LEAD:ALLUMINIUM?
Yes, you certainly can.
Sir, have you tried pair trading using 2 ATM options? Since historically option premiums data are not available I couldn\’t test the effectiveness of it.
No, have not really tried pair trading with options. There would be other dynamics when you trade options.
hii
i am new at treading and not so familiar with ADF test but i have software known as E VIEWS which will test ADF. but i don\’t know how to run with it. how to enter data in software if sum one know let me know.
Thnx in advance..
Karthik,
In your live trade example, the trade was open for almost 7 days. How is it that the institutional traders did not spot this opportunity to jump in and close the divergence more quickly? Am I missing something?
Thanks and regards,
Samir
Samir, as retail traders, we have the advantage of liquidity (or maybe illiquidity). Institutes want to trade few 100 of lots with low slippages… a couple of lots here and there won\’t matter to them, but it would make a big difference to an individual.
Hi karthik,
Had one question. If Lot size of X is , say 800, and Y is 1000.
From Linear Reg. slope comes out to be very low, say 0.001.
Then how do we calculate hedge ratio in this scenario?
This would be tricky as the beta is near zero. YOu cannot really trade this pair.
Hello sir
When i regressed TM(Y) & TMD(X) over one year data set(249 data), it didn\’t show any trading opportunity on 11/05/18. While comparing the two regression analysis i noticed that the regression done on 200 set of data generated better results than that of one year data analysis. Also the ADF value was lesser in the former(200 day data) regression.
1) Is 200 day data optimum for data analysis? Can we regress 100 set of data too?
2) The ADF value i got after regressing the same set of data as done here on Varsity is 0.0567 while your value is 0.017. I used both Schwarz Info criterion & Alkaike Info criterion with the lag length of 14 (it was automatic). Which criterion should i use and what should be the optimum leg length to run ADF test? I had asked this question almost 3 weeks ago and you told me to wait.
Thank you, sir 🙂
Varsity student
1) I remember running some sort of optimization years ago and realized 200-day data is a sweet spot, sticking to it since then
2) The lag is usually set to the square root of the number of data points…so a lag of 14 is good (sqr root of 200). Btw, I\’m really not sure why there is a difference in ADF values.
Hello sir.. was eagerly waiting for it. A big thanks. ?
Happy learning, Thirumal!
Thanks for educating us sir 🙂 . It would be of great help if you could share/made available the pair data with \’P\’ values on weekly basis.
Thanks for everything again.
I\’m trying to figure a way out to share the excel sheet on a daily basis. Hopefully it should be possible 🙂
Can this method be used in cash also or in future only because I have less capital also trial purpose can pair with small quantities
Its best if you do it in futures because the strategy requires you to short stocks as well, which is possible only in futures.
How to calculate z score
You can divide the residual by standard error of residual to get the Z-score.
Sir what is use of Z-score.M not geeting.
Z-Score tells you where the variable is with respect to its mean. For example, a Z-score of 2.5 indicates that the variable is 2.5 standard deviations away from the mean.
Thanks a lot sir
Welcome!
When we run linear regression using python statsmodels library we don\’t get STD error of residuals in the output. Is there any formula to calculate the STD error using residual values?
You actually don\’t need the standard error of residuals, you only need the residuals. The standard deviation of the residuals is the standard error of residuals.
Hello sir
I have a doubt. Are the regression parameters \”static\” or \”dynamic\” in your basic excel tracker sheet? As we know these estimators (coefficients, std. error….) have variance. Everytime we regress the securities the values of the estimators get varied. So taking the parameters of the eqn. y=mx+c as constant and calculating Z-Score based on earlier calculated estimators might give some error, i guess.
What is your view, sir?
Thank you very much for this most awaited chapter, sir!
Varsity student
You are right on that. Given this, you may also want to look at the variance or standard error of the intercept as well. However, these trades are open for few days, unless there is a drastic move in the share price, you will not experience big changes in the variables.
Hey Karthik,
how do we position size the trade? Is it possible for us to know the amount we would lose if the trade goes wrong?
You will have to go by beta neutrality to position size this trade. Have explained this in the chapter.
It is hard to know how much you may lose in advance as the trade is on the z-score.
hey Karthik,
I understood the beta neutrality part of position size. My question is, let me take an example from above. lets say 1 lot of tata motors is equal to 1 lot of tata motors DVR. In this case if I want to trade 2 lots of each of the script then how do I know if it is safe for me to position 2 lots assuming I have funds to take the position. That\’s why I wanted to know if their is any way if we could know the amount of loss we would suffer in case the SL hits. Assuming I am willing to risk 5% of my account in one trade. If trading 1 lot of both has a SL at 2.5% then I can probably do 2 lots right? Is there any rough approximation of finding out the loss. I am not worried about winning because we are entering at 2SD level. And from the trade you mentioned above, you have entered the trade of tata and tata dvr on 14th and profit was taken on 23rd. Assume you have not got the profit signal and the trade is open, there was a quaterly result announcement on 24th, what do you recommend us to do? Should we close the trade or keep it open if there is any situation like this?
Thank you.
I get your concern, Nikhil. Unfortunately, there is no way this can translate to a Rupee value. Or maybe I need to do some research, I will certainly get back to you on this. But here is what I have observed, whenever this position makes a loss (assuming its initiated at 2.5SD), it is usually in the range of 10-12K per beta neutral pair. This is purely from my observation and no concrete science backing this.
Thanks Karthik.
What about the 2nd question on result announcement part?