5.1 – Deferred tax
A gentleman posted an interesting comment in the previous chapter. The company he chooses to model did not present the gross block data in the way the company we are dealing with has, i.e. –
Gross block – Depreciation = Net block
Instead, the company directly reported the ‘Net block’ data.
Given this, how would one go about building the assumptions with Gross block as the base for many balance sheet based assumptions?
While the balance sheet reports only the ‘Net block’ number, the associated notes usually carry the gross block and depreciation numbers. One has to extract these details from the associated notes and rebuild the gross block.

It may sound a bit complex at this stage, but don’t worry; we will take this up in the next chapter and lay down the steps involved one at a time.
By the way, I hope you got to look at the raw data of P&L and Balance Sheet and layout the data in a model friendly manner. Assuming you’ve done that, we will now continue from where we left off in the previous chapter.

The previous chapter calculated the deferred tax’s growth rate from Y2 to Y5 and its average from Y6 to Y10. While this is ok, it still results in a somewhat volatile set of numbers. There is a better way to do this, and I’d like to discuss it.
If you understand deferred tax, you’d know that it occurs due to the way depreciation is treated. Hence deferred tax and depreciation is connected.
So, rather than taking the growth rate of deferred tax, it probably makes sense to consider deferred tax as a percentage of depreciation.
For Y2, the deferred tax is 16.95Cr, and depreciation is 121.73 Cr. So deferred tax as a percentage of depreciation for Y2 is –
16.95/121.73
= 13.92%
We can continue this for Y3, Y4, and Y5 on excel –

As you see, the numbers look much more stable. I’d request you to please make this change in your model. Now, for the projections, you need to take the rolling average. For Y6, it would be the rolling average of Y2 to Y5; for Y7, it’s the rolling average of Y3 to Y6 and likewise.
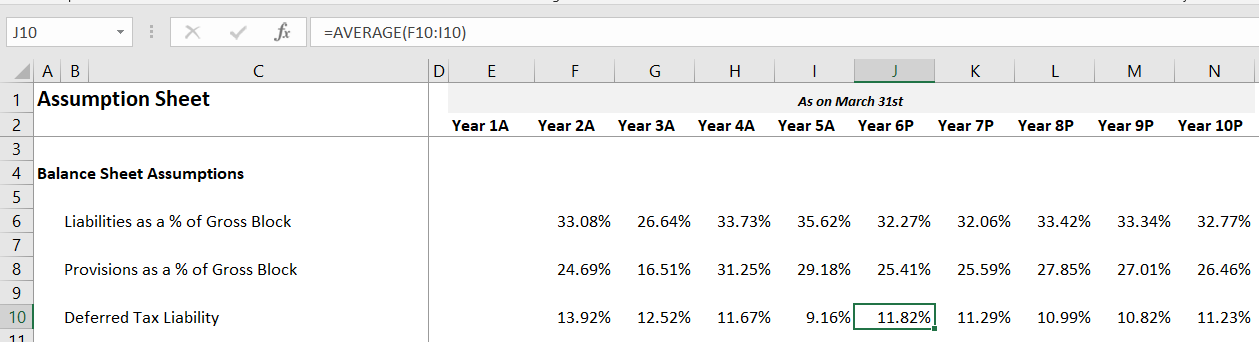
The resulting percentage range is also relatively stable.
Before you crib and curse me for making you redo the deferred tax bit, I’d like to tell you that the growth rate method for assumptions is critical, and we will use it in this chapter when we take up P&L assumptions.
So in that sense, you already have a heads up 😊
5.2 – Dealing with inventory
With the deferred tax assumption, we also complete the liabilities side of the assumption. Please note that we have not made any assumptions for share capital and borrowings; these are line items we will deal with separately by building ‘schedules’.
So we now proceed to the asset side of the balance sheet, and the first line item to consider is the inventory.
If you look at the inventory data as stated in the balance sheet, you’ll realise the worth of inventory that’s lying with the company. For instance, for Y1, the inventory worth was 92.17 Crs; for Y2, it’s 194.33 Crs, Y3 it’s 160.83 Crs etc.
Any manufacturing company ends up having inventories in its balance sheet, and as you know, the inventory is nothing but the company’s finished goods. The objective of the company is to sell the inventory as quickly as possible. Hence lesser the number of days the company takes to sell the inventory, the better it is for the company.
Based on the nature of every company, the company takes up a certain number of days to convert its inventory to sales.
For example, a company manufacturing pressure cooker may convert its inventory to sales in 30 days, but a company manufacturing cars may take 75 days to convert inventory to sales.
When it comes to the inventory assumptions, we take the following approach –
-
-
- Convert the Rupee value of inventory to the number of days the company takes to convert to sales
- Find the average number of days for the future years
- Convert the average number of days back to the Rupee value for the future years
-
Sounds complex? Perhaps, but let’s go ahead and execute the above steps in our model and see how it goes. I’m sure you’ll eventually find it easy 😊
But before we proceed, why even take the pain of doing all the above? Why not directly take the growth rate of inventory and its average and move ahead (like how we treated deferred tax in the previous chapter)?
When you convert the Rupee value of inventory into the number of days to sales, you also get additional insights about the company. These insights help make investment decisions. For instance, imagine there are two companies manufacturing cameras that are similar in all aspects. Company A takes 40 days to convert inventory to sales, and company B takes 70 days to convert. What can you infer from this?
-
-
- Company A seem to have a better inventory management
- Maybe Company A has a superior product. Hence the market prefer cameras from company A
- Or maybe Company B’s sales incentives for merchants is not as attractive as A’s, so merchants tend to push Company A
- Perhaps, company A have efficient management, meticulously planning these things
-
You see, the list of insights can go on and on. Hence it makes sense to take that extra effort to juggle and calculate the inventory number of days and let’s do that right away.
On excel, the inventory number of days is calculated easily by applying a formula. I call it the conversion formula because it converts the Rupee value of inventory to the inventory number of days.
For Y1 and Y2, the inventory value is 92.17 Crs and 194.33 Crs, respectively. To convert, we apply the following formula –
= (Average inventory of Y1 & Y2 / Materials consumed for Y2) * 365
In the denominator, you may ask why we use the materials consumed for Y2 and not Y1. Well, this is because we are calculating the inventory number of days for Y2. If we were to do this for Y1, then the formula is –
= (Average inventory of Y0 & Y1 / Materials consumed for Y1) * 365
Since we don’t have the Y0 data, we start with Y2.
So applying the formula for Y1 and Y2 –
= Average (92,17, 194.33)
= 143.25
Material consumed for Y2 (data available in P&L) = 762.86 Crs
=143.25/762.86
= 0.18778
Finally, we multiply the above result with 365 to get the inventory number of days –
= 0.18778 *365
= 68.53
The above number means the company takes about 68 days to convert 143.25Cr of inventory to sales.
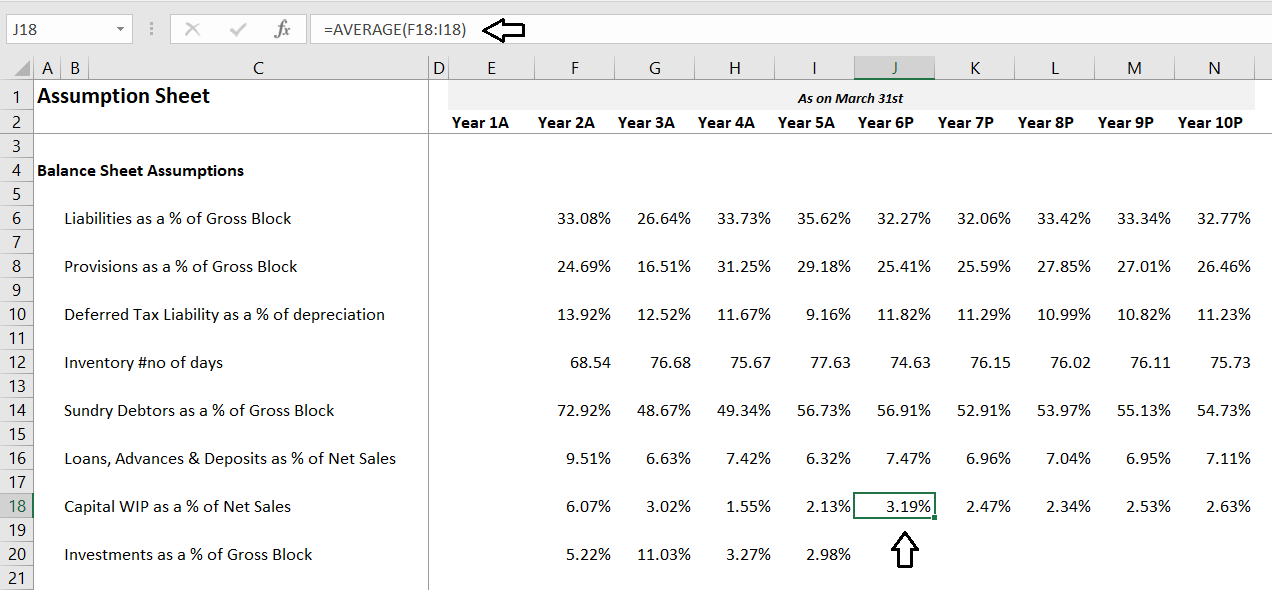
Of course, you can do this in excel in one shot –

Please notice, I’ve included ‘inventory number of days in the assumption sheet and executed the conversion formula directly. I’d suggest you do the same in your excel.
Once I’ve calculated the inventory number of days for Y2, I can drag the excel to rows Y3, Y4, Y5 and get the respective values.
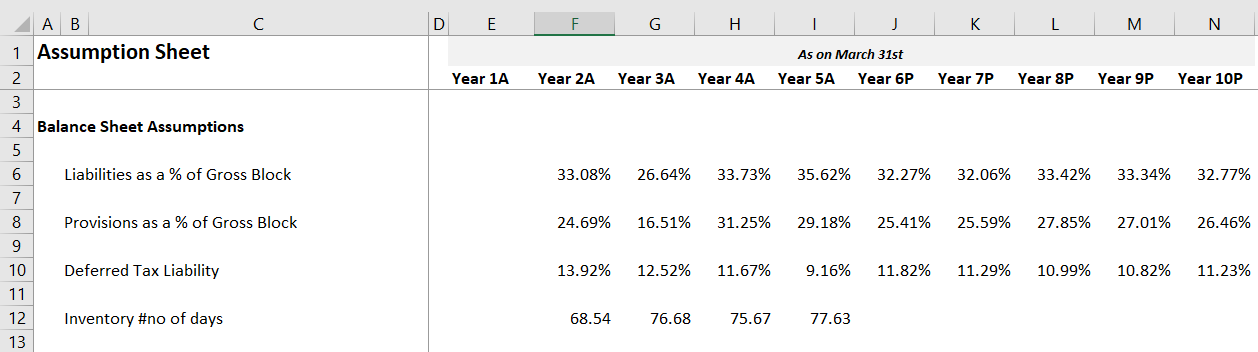
Notice, the inventory number of days consistently ranges between 68 to 78 days. To get a sense of how good or bad this number is, you need to compare it to a company operating in the same sector, of similar size. For example, Bajaj Auto and Hero Motors are similar companies doing similar business.
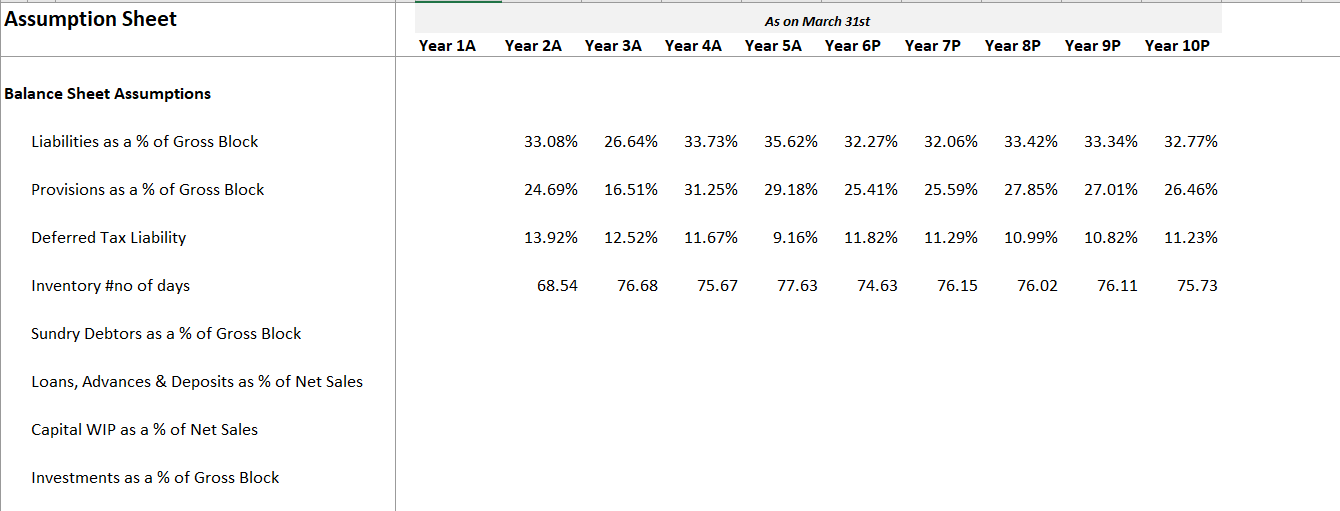
Moving ahead, for the Year 6 to Year 10, we can take the moving average of the inventory number of days.

We have calculated the historical inventory number of days and projected the inventory number of days for the future years.
In fact, you can take a similar approach to Sundry Debtor/Account receivables as well i.e. to convert receivables from Rupee value to receivable number days and then back to receivable in Rupee value.
In the next chapter, I’ll probably explain the process with the help of the helper model.
For now, let us move ahead with other balance sheets and P&L assumptions.
5.3 – Other Balance sheet assumptions
If you look at the asset side of the balance sheet, these are the line items stated by the company –
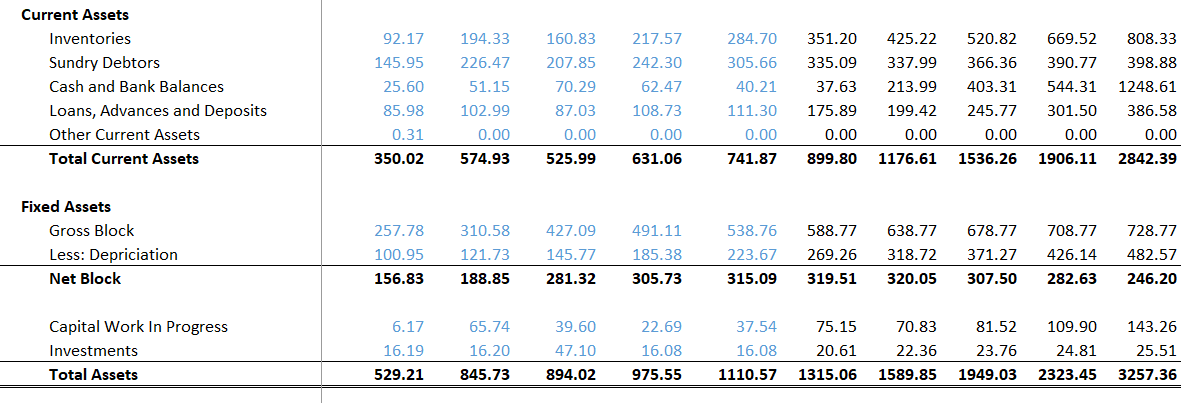
We have dealt with the inventories already.
Just like on the liabilities side, we will build a schedule for the gross block. Cash and Bank balance in current assets will be dealt with in detail in the cash flow statement.
We will make the assumptions for the remaining line items on the asset side. Let me quickly run you through the thought process before we jump to excel.
-
-
- Sundry debtors – I’ll consider this as a percentage of Gross block (but remember there is an alternate way i.e. to convert to days and back)
- Loans, advances, and deposits – As you can imagine, this line item is related to the company’s working capital. Hence I’ll consider this as a percentage of net sales
- Other current assets – This is a small number for Year 1 and does not exist for the rest of the years, so I’ll ignore
- Capital work in progress – As a percentage of net sales
- Investments – As a percentage of Gross block
-
Once I calculate the historical percentages, I’ll go ahead and calculate the rolling average for the future years. Like I’ve mentioned earlier, feel free to change the denominator based on your understanding of the firm and its financial statements. Remember, assumptions are the art bit in financial modelling; you are free to experiment, but ensure it is not too way out of wack 😊
So let me go ahead and implement the above in the excel sheet. I’ll post a series of snapshots hopefully that will be self-explanatory –
I’ve continued on the assumption sheet and lined up the line items in the same sequence as it appears in the balance sheet. Remember, I’ll do all the necessary calculations starting from Year 2 for consistency with the other assumptions.

I’ve calculated the percentages for Year 2, and I’ve highlighted the loans, advances, and deposits as a percentage of net sales. You can see both the formula bar as well as the F16 cell. I’ve highlighted this to showcases the P&L line item in the denominator.
Hopefully, you will find this as an easy step to implement. Do let me know if you find any difficulties in implementing this by commenting below.
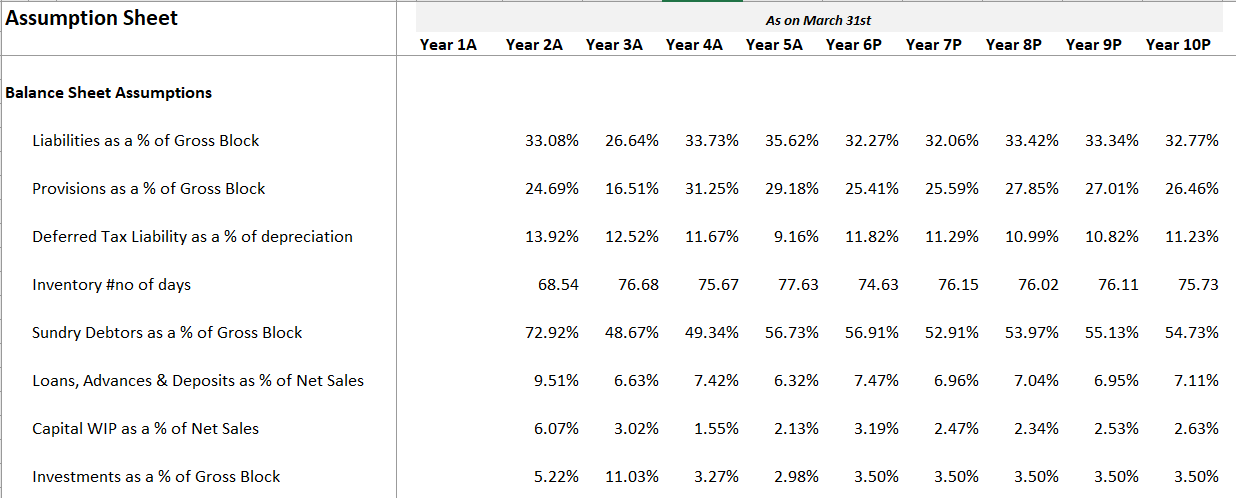
In the next step, I’ll drag the rows to the right till year five, and from year 6 onwards, I’ll take the averages.
I’ve highlighted the average calculation for your better understanding. For the last balance sheet line item, i.e. investment as a percentage of Gross Block, I’ll not calculate the average for Y6 to Y10. Instead, I’ll assume a constant of 3.5% of the gross block.
Why not the average like other line items? Why 3.5%? Why not 4% or 3%? These are all valid questions.
The percentage calculated is quite volatile. It ranges from 3% to 11%, I’m not too happy with it, and therefore I’d like to keep it at a constant 3.5%.
Why not 4 or 3%? Well, that’s the beauty of a financial model. Once the model is complete, I can change this to any value that I think makes sense. Hence I don’t have to stress on it now and stick to 3.5% and move ahead.
With this, we have completed the balance sheet side of assumptions. Whatever is left out will be dealt with in the form of schedules.
We will now move ahead with the P&L assumptions; this should be pretty easy.
5.3 – P&L assumptions
Let us start by taking a look at the P&L –

There is the revenue side, and then the expenses side to the P&L. Revenue side has the sales and other income data, while the expense has the details on all the expenses incurred during the year.
Making assumptions on the expenses side is super easy; all these line items are calculated as a percentage of the net sales or the total income. Revenues, on the other hand, is very interesting. You can either calculate the growth rate or deep dive to build a revenue model.
I want to discuss both these methods. In the primary model that we are dealing with, let us discuss the growth rate method of revenue forecasting. However, we will take the help of a helper model to build a revenue model.
Perhaps we can do both the revenue model and the receivable number of days in the next chapter.
Moving ahead, I’ll create another section in the assumption sheet to accommodate the P&L assumptions. Just for your clarity, this is how my assumption sheet looks at this stage –
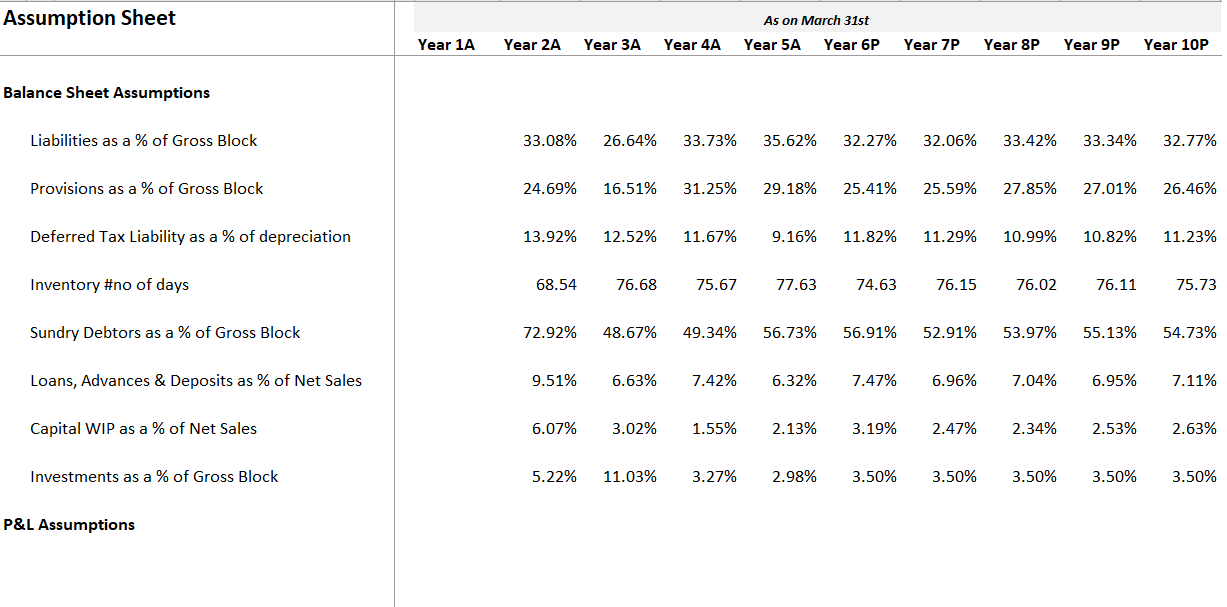
Under the new P&L assumptions section, I will proceed sequentially, in the same order that the line items are present in the P&L.
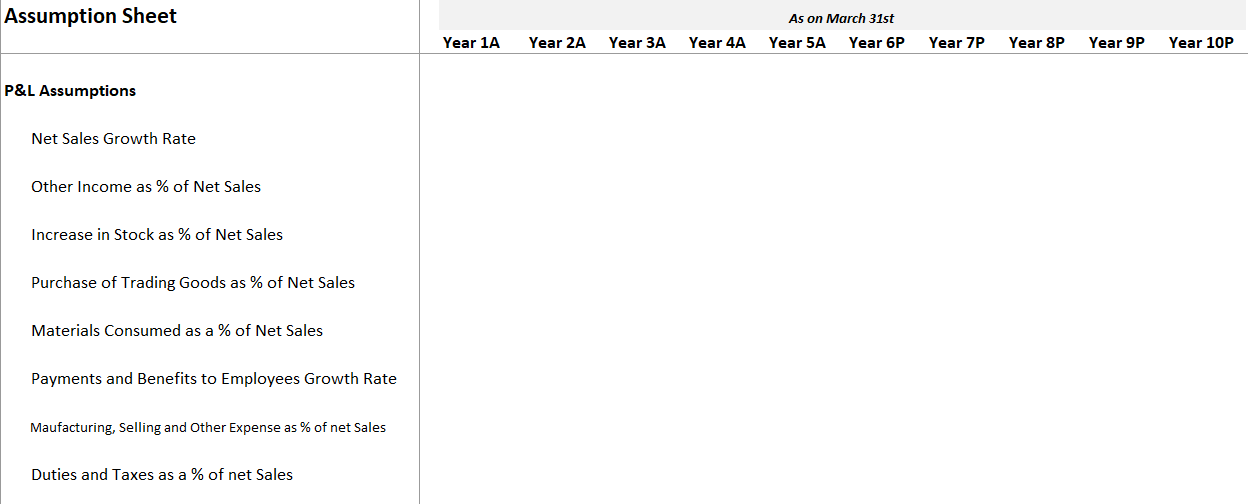
Notice, as discussed earlier, I’ve considered the growth rate for net sales, and for the remaining line items, I’ve considered these as a percentage of net sales. For example, other income is the percentage of the net sale; and the increase in stock is also a percentage of the net sale. So on.
Let us start with the Net sales growth rate; the growth rate is calculated the same way we calculated the deferred taxes growth rate in the previous chapter. Here is the snapshot of Net sales growth rate –
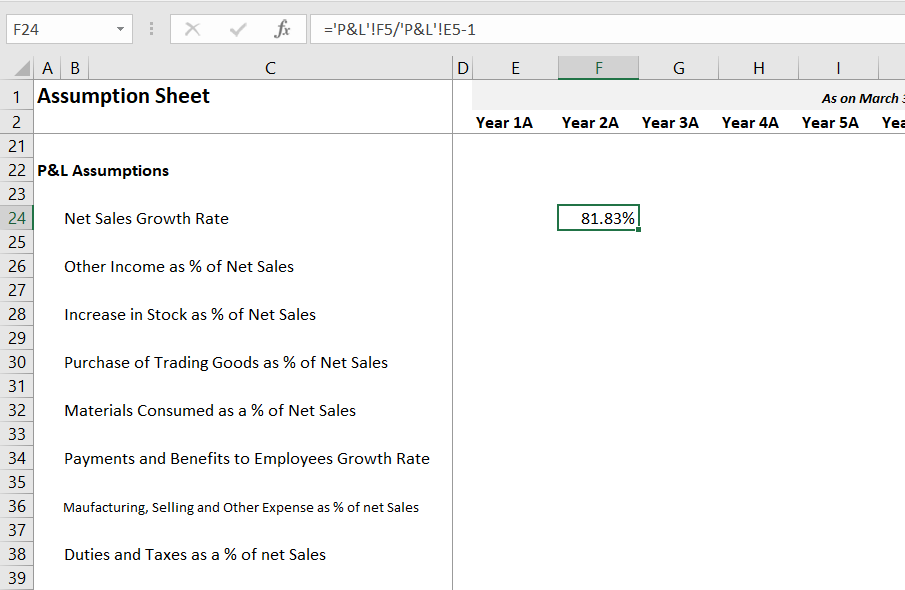
Yes, 81.83% seems high, but it is based on the net sales numbers reported by the company in Y1 and Y2. Here is something interesting that you can do. If you feel the numbers are unusually high, then you can always cross-reference how the peer companies performed during the same period.
If a company belonging to a particular sector has done phenomenally well for a particular year, its peer companies would most likely have performed equally well. For example, if MRF posts a 20% increase in revenue for Y1, you should expect Apolo Tyres to post a 20% increase in revenue. But for whatever reason, Apollo posts 16%, then you know that MRF probably has the edge over its competition.
Of course, this is a very rough example, but I’m highlighting this to give you a perspective of how you can think about companies while building the model.
I’ll go ahead and complete the P&L assumptions. As you can imagine, it is pretty straightforward, or so I assume because we have done this in the balance sheet assumptions.
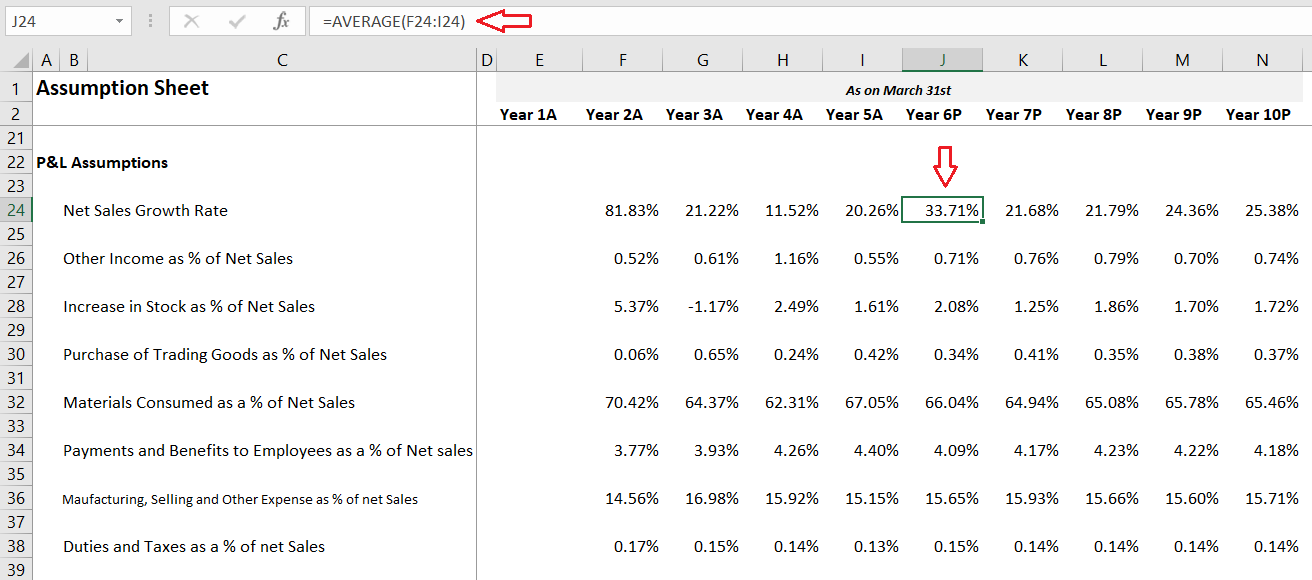
I’ve highlighted the Year 6 cell for net sales to showcase that subsequent calculations are all simple averages. Of course, this excel will be available for you to download and inspect each cell.
If you look at the P&L, the last two items on the expense side are Depreciation & Amortization and interest expense. These numbers will flow from the schedules that we will build subsequently.
The assumption sheet is now complete, and this is how it looks –
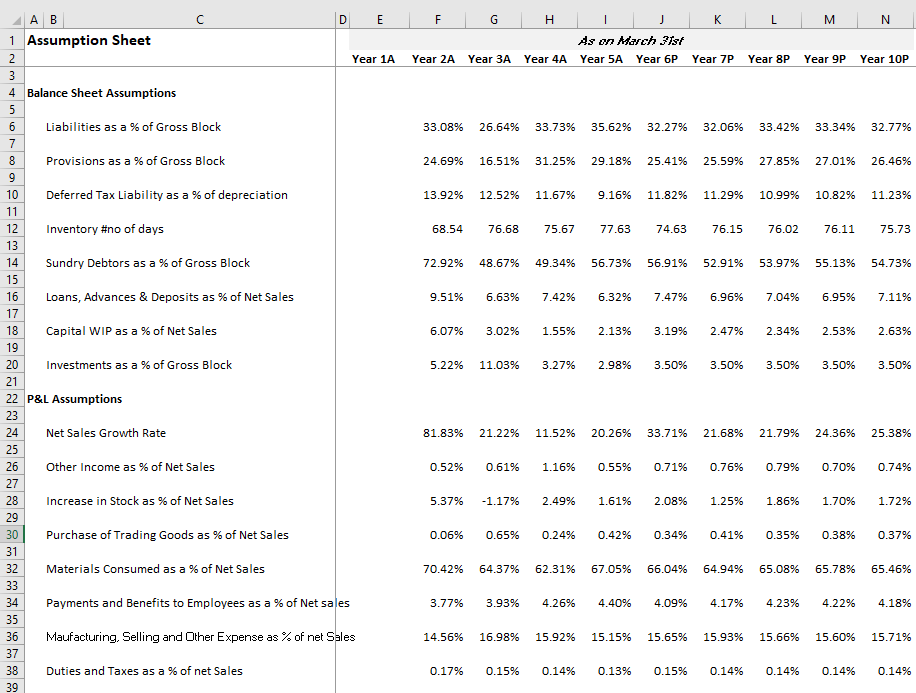
I’ve compressed the image to ensure you get to see the entire page.
I hope you followed the steps we’ve discussed in this and the previous chapter. Please do let me know if you have any queries; I’ll be happy to reply to your queries to the best of my abilities.
In the next chapter, we will take the help of a helper model and understand how to deal with receivables (assumptions) and set up a revenue model.
Download the excel sheet used in this chapter here.
Key takeaways from this chapter
-
-
- Deferred tax is as a percentage of depreciation
- Converting inventory data from Rupee value to the number of days helps us develop unique perspectives into the functioning of the business
- Likewise, with the Receivable data
- A detailed revenue model gives granular insights into the revenue pattern of a company
- All line items belonging to P&L and Balance sheet are assumed in the assumptions sheet. A schedule is built for the items which cant be assumed directly
- Specific schedules give us granular insights into the specific line item
-
Hello Sir,
I really appreciate you taking the time to explain all the topics in such great detail.
I have one confusion, though. How did you fill the balance sheet data from Year 6P to 10P as shown in the screenshot under \”5.3 – Other Balance sheet assumptions/If you look at the asset side of the balance sheet, these are the line items stated by the company-\”
Could you please explain the process? I understood the assumptions sheet, but not how to calculate the future data in the main balance sheet. Averaging, like done in the assumptions sheet, is giving much different results.
Thanks Rimpi. The Year 6 onwards is a projection, thats why its \’6P\’, to indicated its projected. The projections come from the assumption sheet.
Sir, I have projected revenue for the next year and also projected COGS components like cost of material consumed, purchase of stock-in-trade, and other direct expenses as a percentage of sales. I have also projected total COGS as a percentage of sales based on historical data by taking it whole as % of sales.
Now, for changes in inventories of finished goods, stock-in-trade, and WIP, I am considering calculating it as:
Changes in Inventories = Projected Total COGS – (Material Consumed + Purchase of Stock-in-Trade + Other Direct Expenses)
So that if total COGS is higher than the sum of other components, the inventory change comes positive, otherwise negative.
Is this a reasonable and acceptable approach to project Changes in inventories of FG, SIT & WIP
, given their volatility?”
Harsh, I think this is ok. Do make the calculations and see how it flows through. Also keep an eye on how the historical changes in inventory has been – gives you a sense of the business/change in inventory and how the customers are reacting to the company\’s products.
“Sir, for my model I have kept current tax liabilities/assets, deferred tax assets, goodwill, and investments constant at FY24 levels since they are not operationally linked and depend more on tax laws or M&A activity. Is this approach fine? Also, I had a doubt on provisions — is it better to keep them constant, link them to sales, or take them as % of employee benefit expense or it is better to link provisions with gross block, and can you explain why??
Yes, that is fine. Also, I\’m assuming this is not a big part of the balance sheet. These tax line items is best if left constant.
Hi
In case above, there is an increase in stock which has been added to revenue, usually the same is not present, while change in inventory is not present in expense, can you explain the treatment here?
Sorry, I\’m unable to get the full context. Can you share more details please? Thanks.
In the P&L shown above(the table just below P&L assumption), increase in stock is taken as revenue item, while there is no (change in inventory) in expenses(which largely is taken under expense for most of the firm). Hence just wanted to confirm the consideration of this entry
Hi , I am practicing DCF for Infosys Ltd, i faced the Problem regarding deffered tax asset and deffered tax liability, how to address both of them? also their current tax rates change every year.
What problem did you face? Current taxes are largely the same Souptik.
The current tax rates are changing every year like its 28%, sometimes 29%. and the main problem i am facing is when i am forcasting balance sheets, the balance sheets is not matching, can you please briefly describe how to address the forecasting of deferred asset and liabilities both in the balance sheets. In the given module you took deferred tax liabilities as a percentage of depreciation, but what how to address defferred tax assets?? and also if there is any relationship between current tax liability and defferred tax asset and liabilities. I have tried to understand from annual reports but not understanding the flow of the amounts in these items of Financial Statements.
The problem with differed tax assets (or liabilities) is that it comes directly from the income tax department. The computations can be complex, hence its best to assume a static number, unless and until the management gives explicit guidance on this.
Hi Kartik, just wanted to highlight our colour coding rule, in the assumption sheet when we consistently took 3.5% rate for investments as a % of gross block, can we color code the same and keep it in bule so that we know that this number in the assumption sheet is hard-coded and not calculated?
Of course, this is entirely upto you on how you\’d like to design this 🙂
Hello Sir, The company on which I am currently working on has reported other current Assets and I have taken that as % of Revenue to project it further. The numbers which I got were not too off the mark and were reasonable according to me. They have also reported other non current assets. So should I take the same approach of marking it against revenue or is there any other approach to it. Thanks in advance
Yes, you can. Make sure the numbers are consistent, though.
Sir Some Questions related to making assumptions:
1.for projecting the % for changes in inventory i should do the same like changes in inventory as % of net sales (because this figure is add from others)
2.In my balance sheet there is item called intangible assets under development how can i create projected assumptions for it?
3. Like you have told for inventory number of days, can i do same for trade payables no of days (what will be the formula for it, same?)
1) Yes, better.
2) Try taking a %?
3) Yes, you can.
please explain when do we have to take growth rate in assumptions and when to take the ratios. (and in ratios part how to we get to know which denominator will be best fit for the particular numerator).
btw your modules are great.
Harsh, this is completely based on your understanding of the ratio. There is no hard and fast rule to this. But whichever one you use, make sure the output has certain trend or consistency in it, only then it is useable.
Hello Karthik Sir,
Thanks for this module, as quoted in earlier chapters \’Hopefully, by not quoting years, someone reading this module five years later will also understand that the overall structure of a financial model remains the same\’- i am reading this module after three years you have written and finding it very useful. I hope someone reading the module in future years also feels the same.
Here is my question, why is the deferred tax as a percentage of depreciation is not calculated for Y1, because both deferred tax and depreciation value is available for Y1 as well. Calculating the same for Y1 would be helping in better projection of Year 6 right? because we can have rolling window of 5 rather than 4.
or Is it for consistency we did it this way?
PS: My question is not just confined to deferred tax, let say if we have a scope to increase the rolling window for any projection can we even do that?
Let me know your thoughts.
Thanks.
Rajkumar Sundaram
Thanks, Rajkumar. Yes, I do hope many find it useful. Y1 would have been used for calculating growth for Y2, for some line intem interlined with deffered tax of depreciation or for that matter wherever its not used. That\’s why 🙂
Why not consider sundry debtors as a percentage of depriciation as well like we did in deferred tax liability? Since according to my reading, sundry debtor works in similar way too?!
Thats the entire point of this model, it allows you to configure these assumptions based on what you think makes sense. So go ahead and use the sundry debtors as a % of depreciation and see if you can draw some consistent percentages.
Hi sir.
Actually I was already working on the Britannia Ind. financial model when I found this Zerodha\’s course.
What is creating problem for me is that in the Balance sheet under the sub-head of Non-current and current assets, I have lot of items like PP&E, intangibles and goodwill, investment in associates and joint ventures and also the financial assets under which we have the Investments, trade receivables, other financial assets etc.etc.
So, I ain\’t able to understand which ones\’ to group like you have did at the time of forecasting and if it can\’t be then how to forecast those items.
Thanks.
Ah, this will be the case with most balance sheets. You will have to approach this by looking at the lance sheet, the way the line items are structured and then replicate this in a model like format. What I\’ve explained is the way you can make a model for a given financial statement.
Sir I am unable to understand from where did you get \”Increase in Stock\” value under other income. Kindly explain?
We have discussed that in comments, request you to please check Nabojit. Thanks.
nevermind, i got it
As ok. Good luck!
How did you project inventories in balance sheet using the inventory days assumptions ?
You can do this –
1) Calculate the historical inventory number of days using the inventor days formula
2) Take the average for the future years.
So i checked elsewhere and im finding that they are also adding purcahse of stock in trade with cost of raw materials and consumption . so i did that and arrived at 235 days .
Ah, ok.
Really appreciate the response , So i checked it again and im still getting the same number , the inventory for FY19 and FY20 is 8393.60 and 8736.81 respectively (numbers are in INR millions) and in the P&L the cost of raw materials and components consumed for FY20 is 2569.59 , so if i want to calculate the inventory days for FY20 the average of FY19 and FY20 inventories which are 8393.60 and 8736.81 is 8565.20 so 8565.20/2569.59 * 365 which is 1216.93 .
Ah ok. Can you double check this from someone else\’s model? Also, one common mistake when implementing this formula is the placement of brackets, so please check that as well 🙂
really loving the chapters so far , so the compnay im doing this on is Bata india and was trying to calculate the inventory days and im getting a very big number like 1216 for FY2019 and i dont think thats right , i did the calculation manually also through a calculator and im still getting that number , can you guide.
Glad you liked the content Sahil. Yes, for a company like Bata, 1216 days does not seem right. Please check the formula and its implementation once.
Financial Modelling looks pretty interesting to me the way you make available to us.Thank you from the inner Heart.
Happy learning 🙂
When we talk about deferred tax as it was in the balance sheet we considered it as a % of accumulated depreciation.However,the company i have chosen to analyze has deferred tax in P&L statement.So can we take it as a %of depreciation and amortization from P&L itself or have to consider the accumulated depreciation as for the latest FY the deferred tax has -ve value.Do guide for the same.
Thanks in Advance.
Yeah, then take it in P&L itself. % method in this case will always give a -ve value. Alternatively, you can keep it as a constant or tapering value.
I found out a good explanation regarding forward EPS calculation in the other book written by Mr.Aswath Damodaran called \’Investment valuation\”. In this he talks about multiplying retention ratio with ROE to find the growth rate. So I built an excel sheet model and derived the forward PE based on this going back to 1 year. Seems to somewhat resemble the current results. Although I understand that some tailwinds has to be considered as well. I would like to know whether I can use this or am I missing something?
You can use this 🙂
AD is the OG investment valuation guru!
Sir, there is a minor mistake. You put \”,\” instead of \”.\” while calculating average inventory days.
Thank you for being a fabulous teacher, you are helping me a lot.😊
Ah, will check that and thanks for the kind words 🙂
Sir how to calculated forecasted EPS for forward PE calculation? Thanks
Hmm, I\’ll probably do a video on this 🙂
Why did you consider loans, advances and deposits as % of net sales and did you take current and non-current both?
If its current in nature, then the denominator should also be current in nature. YOu are free to experiment with other % values as well.
Hi Karthik,
Instead of considering \”growth rate for net sales\”,can we consider it as % of \”cost of material consumed\” which are narrower than \”growth rate for net sales\”
Yes, you can. But make sure the output is consistent and not erratic percentages.
Hi Karthik
IN Relaxo,
Change in inventory finished goods, stock in trade, and WIP -33.82 5.16 -13.62 -57.81 -53.54
most of the values are negative,do we need to consider these as postive or negative in assumption sheet?
It would help if you took it as is the balance sheet.
Thanks Karthik for your reply.
Here it is mentioned as
\”Other current assets – This is a small number for Year 1 and does not exist for the rest of the years, so I’ll ignore\”.
Does this hold good for all imprtant lines items like investments.
Depends on the value of the line item and its recurrence in the balance sheet.
Hi Karthik,
I am trying to fill in the assumption sheet for Relaxo.The following are the line items under liabilities side.
Non Current Liablities
Financial Liabilities
Lease Liabilities
Borrowings
Other Financial Liablities
Provisions
Defered Tax Liabilities(net)
Current Liabilities
Financial Liabilities
Borrowings
Lease Liabilities
Trade Payables
Other Financial Liabilities
Other Current Liabilities
Provisions
Current Tax Liabilities (Net)
Can you please clarify the following.
1)All the line items under liabilities except the \”Current Tax Liabilities (Net)\”,\”Deferred Tax Liabilities(net)\” and Inventories can be considered either as % of net sales or gross block whichever has a narrow range.
2)Can \”Current Tax Liabilities\” be considered as % of net sales as it depends on the sales.
3)In the main model example in this chapter,\”secured\” and \”non secured loan\” are dealt in debt schedule. In Relaxo,can \”borrowings\” under current and non current liablities be considered in debt schedule.
In the Fundamental model module,amaraja battery annual report was used throughout the module.It was easier for us to compare the values then and there after each module Karthik. But in this module,it is bit confused.It would be very helpful if Relaxo company\’s sheet is shared so that we can compare our values against that.
1) Yes
2) Yes, this is possible too
3) Its the same thing, actually
I understand, but this module is a little complex. All things that need to be taught cannot be done in 1 model. Hence I\’ve taken the help of \’helper\’ models.
The Above Model Would be helpful In Video Format . Thanks for sharing such great information
I understand, will try and do that sometime in the future Bhavya.
The above example is of YOY right,but if it as element let us say liabilities or provisions which we have considered as a % of gross block_average,we will require gross block of forecasted period and the calculation would now be for Y6=Gross block in Y6*% calculated for Y6 from assumption sheet.Right?
Another query regarding the inventory no of days conversion to amount,how is the calculation done to derive the numbers from the days calculated?
Yes, that\’s right. That also explains why we must project different line items in parallel, as the entire model is interconnected. The calculation part I have mentioned, else download the excel and place the cursor in the inventory cell to see the formula.
Can you explain how did you derived the values for the projected periods after finding the values in % from the assumption sheet.
As in the case of YOY it is pretty much clear but when we talk about liabilities as a % of gross block for historic periods we get the % figures as we have the data but for the projected period liabilities a a % of gross block ,we would require gross block for the projected period.So will it come from the schedules sheet? And what about the conversion of inventory no of days to amount for projected periods?
Do guide for the same.
Thanks in advance.
Not sure if I understand the query completely, but here is the thing – the projected value for Y6 is let\’s say 7%. Then you will take the actual value for Y5 and increment it by 7% to get the value for Y6. Now, if the projected value for Y7 is -2%, then you will decrement Y6\’s value by 2% to project the value for Y7.
thank you
Hi Karthik,
wouldnt it be better to calculate cost of sales and then use cost of sales in order to calculate rate of inventory turnover as the actual formula of of rate of inventory turnover is average inventory/cost of sales*365 ?.
for calculating the cost of sales i assumed the manufacturing expences to be a constant percentage of manufacturing, sales , admin and othe expences since the breakup wasnt given. (will this be accurate enough)?
Of course, you can do that and probably that makes sense. The beauty of the approach to financial modelling is that you can freely experiment with things that you think makes sense. Nothing is set in stone here 🙂
How to calculate gross block if it is not given in the balance sheet of the company?
Check the associated notes, it will be there.
Sir, pls help
Stuck in Depreciation, In annual report Financial Statements I get all data, you said in original BS does not have the Gross block data, where i can get the seperated one, gross block and depreciation data. Pls help sir
Please check the associated note.
Hi Sir,
In the above deferred tax chapter, you discussed about the calculation of deferred tax liability.
however, I have both deferred tax assets and deferred tax liabilities, so, for liabilties part i did the calculation but for the Assets part i am having confusion that how should I treat this items.
So, again in assets side of b/s I have deferred tax assets and “Non-current tax assets (net)” both under non- current assets section, so, do i need to add both deferred tax and non – current tax and then divide them by depreciation? how should calculate it?
Sonal, because of the nature of deffered tax, I\’d suggest you keep it flat for all the future years as its hard to make any projections for deferred tax asset or deferred tax liabilities. Also, don\’t get stuck with these 1 or 2 line items. Remember, this is an integrated model and you can always come back to fix if you feel its not working well.
Hi Sir,
Goodwill & intangible assets also will get divided by Plant Property Equipment , i.e goodwill as a % of PPE, like others we did.
Yeah, it does.
Hi Sir,
I have few doubt,
1. The co. balance sheet I am working on, in that there are few items which has mention in both current assets and non- current assets sections, like Investments, Loans, Trade receivables, Other financial assets – so, how should I make an assumption here? Please suggest.
2. Also, I have another line items i.e \”Non-current tax assets (net)\” under non- current assets section, how should I make assumption for this line item?
3. How should I treat these line items i.e Goodwill, Intangible assets and Intangible assets under development, how should I make assumption for this line items?
1) You can make two different assumptions…for example, current investments and non-current investments as two different assumptions
2) This one you cant. We discussed this under deferred taxes, I suggest you check that
3) Yeah, you can assume these items.
Where can i pick the depreciation value?
Check in the associated notes of Gross block.
Hi Karthik,
The P&L in which I am working on, not showing \”Net sales\” directly in my P&L statement. It\’s showing
Income:
Revenue From Operations
Other Income
Total Revenue
How should I consider net sales for calculating.
Thanks in advance.
Net sales = Total revenue. But you can ignore other income and consider only revenue from operations.
Hi Karthik,
The balance sheet in which I am working on, in that \”other current assets\” are available under Current assets.
So, which line item should I take to calculate other current assets % for assumptions.
You can try other current and current assets to see which one has a better consistency and stick to that.
The helper model (Relaxo) doesn\’t contain gross block or net block, so what should be done in those cases??
YOu can always look at the notes for net block and extract depreciation from the notes.
otherwise sir please tell me name of the company of which you used the data from annual report so it can make easy for me to relate
Its a generic model, Naresh.
sir can you help how to extract
01- secured loan and unsecured loan form raw data
02- In current liability (A) libility- data taken by you is it simply current borrowing or it is the sum of( current borrowings+other financial liabilities+other current liabilities) (B) provisions- is it only current liability provisions or we have to add provisions of non current liability
03-sundry debtors – is it trade receiavable, which is a part of current asset
04- cash and bank balance – is it only sum of cash+bank balance or cash equivalent also included in this
05- loans and advances – is it addition of loand and advances which are part of both current and non current liability
06-investments – is it addition of invesments which are part of both current and non current liability
I stuck in main model balance sheet due to confusion so please help me i want to complete this module
1) Look for it in liabilities. It maybe be called long-term liabilities and current liabilities
2) It\’s the entire liability list. Look up in the associated notes for details
3) Yes
4) Yes
5) Its current liabilities
6) Investments are usually non current in nature.
Hi Karthik,
How about investment as % of Gross Block? The % shows that investments should be
Y2A – 56.54
Y3A – 144.84
Y4A – 47.88
Y5A – 52.48
But on checking the BS, investments are mentioned as:
Y2A – 16.20
Y3A – 47.10
Y4A – 16.08
Y5A – 16.08
Can you throw light on what else have you considered as investments?
Nithin, did you check the excel for working?
सर मेरा प्रश्न है कि आपने सीधे तौर पर ऐतिहासिक डाटा उपयोग कर नयी बैलेंस सीट बनायी है परन्तु समस्या यह आ रही है कि आपने किस किस लाइन आइटम से डाटा लिया है क्योंकि जैसे करेंट लाइबिलिटी में कियी सब पोइन्टस तो उनमें से कौन सा डाटा हमें लेना है और कौन सा छोडना इसमे ंदिक्कत आ रही है।
दूसरा नॉन करेंट लायेबिलिटी में कौन अन सिक्योरड लोन और सिक्योरड लोन कहॉं से लिया है।
तीसरा सबसीडरी डेबेटर कहॉ से लिया है ।
सर यदि किसी कम्पनी जैसे आपने रिलेक्सो का हिस्टोरिकल डाटा लिया था उसी तरह इसमें हिस्टोरिकल डाटा का उपयोग कर नयी बैलेंस शीट बनाते तो स्पष्ट रहता ।
ऐसा हो जाये तो आपकी कृपा होगी।
Hi Karthik,
For Inventory # of days, do we only use the Cost of Materials Consumed or full COGS:
Cost of Materials Consumed + Purchases of Stock-In-Trade + Power & Fuel + Stores & Spares Consumed?
Just the cost of materials consumed, Nitish.
Thanks for the great knowledge
I have a few questions
1. What is the formula to calculate Sundry debtor number of days
2. In liabilities we assume current liabilities as a percentage of grossblock, but current liabilities are also used for working capital requirements, So isn\’t it better to assume current liabilities as a percentage of Net sales.
3. Can we also use Creditor number of days for creditors/suppliers in balance sheet and what\’s its formula for creditor number of days .
Thank you again.
1) It is similar to the receivable number of days which I\’ve explained
2) Yes, you can. As I\’ve mentioned in the chapter, there are no hard and fast rules to make these assumptions.
3) Yes
Hello Sir
Can you please tell me, if there is negative growth in two consecutive years, then when I take average, it will show negative for further months too.
But thats not possible like the growth could be increased in future
So is it correct to take average with two negative values ?
If the objective is to find the free cash flow (which we had discussed later in the module), the cash flow has to be +ve. The valuation model will not work in -ve cash flow companies. In your case, will the growth rate ensure the cash flow becomes positive? Unless your growth rate itself is -ve?
Hello sir, the company that I am trying to model reported unusual numbers in FY-21. This was addressed by the board of directors in the earnings call as well. In FY-22, the numbers were in line with FY-20. It even suggested to take FY-20 as the base instead of FY-21 as a few line items were very different in FY-21. How should I go about forecasting the line items sir? Should I ignore FY-21 or consider it while taking averages. Assigning a constant growth rate for each line item will be very hectic. Please advice.
Why were the numbers unusual? Is there a board explanation for it? YOu will have to consider these numbers can\’t ignore. Most importantly, figure why the numbers changed and see if there are any changes in business logic.
Great module. Was planning to learn financial modelling as I aspire to get into investment banking. instead of using gross block for debtors wont it make more sense to use it with relation to the credit sales? Just my curiousness. Would love some insight. Thank you
That makes sense too. Like I mentioned earlier, you are free to use whatever as long you can justify it.
Sir, while calculating inventory days, taking raw material cost into account should we also consider purchase of stock in trade in addition to cost of raw materials. I was conductinf the financial modlling of relaxo footwears. There two rows have been mentioned. purchase of stock in trade and cost of raw materials used.
Thank you so much
Take just the raw material used, Saroj.
What I meant to say is that instead of taking gross block can we take total of liability or asset as the base?
We hit a circular issue when we do that. Will try and discuss that in the next chapter.
Can we take base as total revenue for all apart the items i.e., for those items for which we are not preparing the schedule and also for deferred tax liabilities, inventories and debtors?
Mansi, thats not the best idea. But why did you think about it that way? You can take relevant line items right?
Understood All! Thanks.
Thanks much 🙂
Hey, My balance sheet doesn\’t have gross block or net block, so how can I calculate them from scratch? any feedback will be much appreciated.
I do have below items though.
ASSETS
Non-Current Assets :
Property, Plant and Equipment
Right of Use Assets
Capital Work-In-Progress
Goodwill
Other Intangible Assets
Investments accounted for using equity method
Thanks in advance.
Property, plant and equipment = Fixed assets = Net block. Check the notes of this line item and see the depreciation details.
I am not able to find any Excel sheet attached anywhere in this module. Could you please help?
Please look just before the key takeaways from this chapter part.
Yeah Sir, whenever I have some doubts or confusion, I go through your slides to refresh the concepts.
Happy learning, Sumit!
Bdw Sir, I am liking your content. The way you incorporated granular insights into each and every aspect right from Excel setup till forecasting , it\’s just commendable.
Thanks Sumit, I hope you continue to like reading the content on Varsity 🙂
Sir, is the flat rate assumption same as a straight line method of forecast?
Hmm, I\’m not sure Sumit. These are new terms for me 🙂
Do we have to copy all entries from annual reports by typing or is there an easy way to get data on excel? otherwise it becomes too cumbersome.
Its just the Balance sheet and P&L that you need, a bit of an effort I agree, but it is worth taking that effort.
Hi Karthik ,
this is so informative, just a request would you please post chapters week wise. ab raha nhi jata 🙂
its so informative that i want to find intrinsic value for all my companies.
I really wish I can do that Rahul. But this module is so complicated (as you can see already), that it is extremely challenging to simplify this yet cover all aspects. I\’ll try my best, but until then, thanks for your understanding 🙂
sir if I post a comment in previous any module will you answer that ?
Yes Sir, I will.
Sir, how to download hindi module pdf?
I can\’t manage to read online in laptop or in browser.
We dont have the PDF ready for this just yet.
It fells like a series where we have to wait months for next Session(in this case chapter).
In a day or 2, I promise!
Sir, TCS has international clients, how will we take into account the dollar risk/premium and volatility
Also sir, excited about this module, what are some future modules you will write about?
They have forex hedges Akhil. Do check the associated notes. At present, the focus is on this module, and after this the personal finance part 2 🙂
Everyday I check whether the next part is published but go disappointed…..Its been months…Hope it will be published soon.
In 2-3 days for sure.
Hindi translate wale pdf ko download karne ka option hi nahi aa raha he, hindi translate pdf kese download karu from module 2 to module 13.
Aur module 12 to english me bhi download karne ka option nhi aa raha he
Sir, please upload others modules of this series fast. 🙏🙏
And I want to say I had learned everything about stock market and financial markets from you
Big fan of yours sir 😍😍
Hi, Sir…
Please make this module for offline download like other modules…
Module has to be complete.
waiting for next model sir?
when it will be released?
Next chapter you mean, hopefully in the coming week.
Forex Rates with inflation is also important parameter in assumption for long project. So can you please show some small calculations & assumption based on that and where it has to consider at the end or in calculation portion itself?
Thats right, especially for service-oriented companies exporting stuff. I\’ll see if I can include this as well.
what is \”drivers\”
Things that drive a line item. For example, if a company is manufacturing flip-flops, then the key driver for its revenue is also the rubber prices.
4. finance costs
how to treat:-
1. advertisement expenses
2. Loss allowance on trade receivables and other financial assets (net)
3. other expenses
YOu can club this under expenses are you can build drivers for each of these. I\’ll build a revenue model in the next chapter, hopefully that gives you a perspective.
(Changes in inventories of finished goods, work-in-progress and stock-in-trade) is this same as increase in stock cause in my model company something like increase in stock is not given
Can you check the associated notes once?
I have a question
due to pandemic all the companies underperformed in every aspect so while building the model should I take the year 2021 into consideration or not and if I have taken it into consideration will it affect in building the model
Yes, you\’d need to take 2021 into consideration 🙂
The company which I have taken have 1 million in investments only for the Y2 and for rest of the years its nil. So, should I ignore it
Yeah, you can keep it at zero.
While calculating net sales, for my company from revenue from operations there were two things given
1. Income from brand franchise arrangements
2. Income from BCCI-IPL franchise
the company which I have taken is mcdowell\’s
so will these two be considered in net ales or not
Yes, it should be assuming it forms a significant portion of revenue.
Hi, How can we know DII/FII holding in a particular stock. I want to track Institutional activity in a particular stock. Is it possible?
You need to check the share holding pattern of the stock.
For Costs , we could make schedules such as breaking Costs into drivers. For eg COGS could be broken down into it\’s components.
For balance sheet items , again breaking down liabilities & assets into much more detail
Yes, will be building these drivers for few line items in the next few chapters.
Do these assumptions really do the purpose? Just simply taking assumptions as a % of various items doesn\’t actually do the job. At the end , the modeller won\’t be confident himself because he knows that he had simply assumed many items as a % .
Simply taking a % carries forward inconsistencies & these assumptions are more prone to errors . And given less detailed, they make lack sufficient details for decision making.
Instead a better way to be breaking down items into it\’s core drivers .
For eg:- Revenues could be forecasted by breaking down into volume & price(bottom up) . Or assumed through market size & market share (top-down). Or through regression analysis.
Yes, you are correct. In fact, I have highlighted this in the chapter itself. Few things to note –
1) Ensure the assumptions when calculated as % is not volatile, it should be consistent. That way you know you are not too way out of wack.
2) Go ahead and build the model anyway (Which is what we will do), and the assumptions can be tweaked
3) Revenue model and few large items will be broken down into core drivers to ensure granular insights.
Hi Karthik,
Great Modules! I am however stuck on one point- The company I\’m trying to model has Right-of-Use of Asset and they have just started incorporating it in balance sheet for last 2 years. There is no discernable trend which I can observe. Can you help me on this? Thank You.
Invariably, this will be a constant for the rest of the years. By contact, I mean, it will be the latest year\’s value for the projected years.
respected sir,
I agree that swap, swaptions, forwards are not used in retail trading. It can be used for educational purposes. Not a lot of books give a lucid explanation u do sir. It would of great help for mba finance students. thank you sir
I understand, Ramanathan. I will try and do this when possible.
Dear Team
I understand that this is a simpler version of model you are trying to create but still, some expenses like employee salary are fixed in nature they don\’t have correlation with Sales. Therefore, is it not better way to forecast them based on their past growth rate rather than equating with the % of net sales ?
Of course, you can. Like I have mentioned in this and the previous chapter, there are no hard rules while making assumptions.
Hii karthik,
I know that which learning material you provide us is suffice but I want to dig deep so please if you some other material related to valuing a business then It\’s a great pleasure to me.
You can check these – http://pages.stern.nyu.edu/~adamodar/
Respected sir,
Please consider a module on forwards, swaps and swaptions sir. Your way of presentation is very simple and lucid. Would help a lot of mba finance students.
Ramanathan, but these are things not available for retail trading.
Hi, just rechecked the P&L statement again, confusion came up due to clubbing all the orders(of different dates) of a particular scrip as a single order and reporting it, got the necessary clarification after checking out the breakdown.
Thanks.
Glad you did 🙂
Hi Karthik,
Had a problem with Zerodha, bear with me for this small off topic question. For an equity intraday trade, the promised brokerage charge is 0.03% or 20/order whichever is lower but zerodha charged me the higher one!
Just came across this discrepancy while going through my P&L statements, felt cheated as this cannot happen by mistake. Lost all my respect for Zerodha. Raised ticket, awaiting reply. But felt like having a word with someone higher up other than the customer service executives, so posted it here.
Thanks in advance.
Prashanth, these are system driven and does not vary for one another. PLease share your ticket number.
Hey Karthik,
I learn a lot from your lesson. Can you suggest Books for us on Financial modelling or valuation.
I\’m hoping this module will suffice 🙂
Please do the same in video format.
Noted.
Hello Sir,
How many chapters would this module have?
Also would you be talking about enterprise value, PEG ratio, EV to EBITA, EV to EBIT, EV to sales etc, related party transactions etc?
There are at least another 10-12 chapters here. Yes, I\’ll cover all these aspects.