
13.1 – Indirect cashflow
We are at a crucial juncture in our financial modeling journey. This chapter will derive the cash flow statements and plug that cash flow number into the balance sheet. After we do, hopefully, the balance sheet balances. Notice, I used the words ‘derive the cashflow statement’. What do I mean by that? You need to take a few steps back and think about the cash flow statement and its purpose.
The cash flow statement of a company gives the company’s cash position. The cash position itself is estimated after reviewing the cash inflow and outflow from the company’s operations, investments, and financing activities. Each of these activities either generates cash or consumes cash. If you are new to cash flow statements, I’d suggest you look at this chapter – https://zerodha.com/varsity/chapter/cash-flow-statement/.
Think about the high-level summary of cash flow and how the company’s CFO and their team prepare the statement. Like the P&L and Balance Sheet, the cash flow is also prepared by considering the voucher entries, bills, receipts, and bank reconciled statements. Preparing the cash flow statement with bank reconciled statements, invoices, and receipts is called the ‘Direct cashflow method.’
As a financial modeler, you have two options to prepare the cash flow statement in the financial model.
-
- Get access to bills and vouchers of the company and prepare the cash flow just like the finance team
- Hardcode the historical statement just like the way we did for P&L and Balance sheet and then project for future years

Of course, option one is ruled out for obvious reasons. Option 2 is possible, but we miss out on the ‘validation of the model’ part if we take the hardcoded approach. I’ll explain what this means in a bit.
There is a third approach to cash flow. It is called the ‘indirect method’ of cash flow preparation. In the indirect method, we take the P&L and the Balance sheet data of the company as input and process the input based on a series of logical steps. The result of the process is the company’s net cash flow. Here is the good part – the net cash flow derived from the process should match the company’s cash flow stated in the balance sheet. If it does, then it kind of validates the model for us. If the numbers don’t match, then it is because we’d have made an error somewhere in the model, and it allows us to recheck. For this reason, we will use the indirect method of preparing the cash flow statement.
By the way, speaking of validating the model, you may argue that the model is heavily dependent on the assumptions that we make and therefore bound to have errors. Yes, I won’t argue with that. I’m aware of this fact, but at the same time not concerned.
Think about it this way; our main focus is to build the structure of a house with a solid foundation. Once the house is built with the proper foundation, we can mix and match the interiors as many times until we find it to our satisfaction. Extending the same thought, our objective is first to build the model with the right linkages. Once the model is fully built and completely integrated, we will spend time debating each assumption, figuring out if it makes sense, and changing the values accordingly.
I’m sure you have questions about this, but hang on and read through the rest of the chapter (and module), and I’m sure you will get all your answers. For now, let’s look at the indirect method of cash flow statements.
13.2 – Cashflow activities
A company can be looked at from the perspective of its activities. Broadly speaking, the activities are –
-
- Operating activities
- Investing activities
- Financing activities
Consider Bajaj Auto, for example; what does the company do? It manufactures two and three-wheeler vehicles, sells these vehicles, and services these vehicles. The company needs to invest in plants, machinery, and equipment to carry out the operations. To finance the operations, it may (or may not) needs funds from external sources. If the company borrows money, they have to repay. Then, of course, from the profits, dividends are distributed.
Can you think of any other activity that the company does? You can extend this framework to any company and realize that all the activities are within the scope of these three categories.
Each of these categories either generates cash or consumes cash. For example, consider the inventories of a company. The inventory of a company is directly related to the company’s operations. If the company’s inventory has increased compared to the previous year, then it means that more money is stuck in terms of finished goods. Hence, inventory (which is an operational activity) has consumed cash. On the other hand, if the inventory is less in year two than in year one, inventory has generated cash or conserved cash.
Let us take another example. Assume that a company has borrowed money from the bank to fund operations. Borrowing funds is a financing activity, and by borrowing, cash is credited to the company’s bank account, hence considered as generated cash.
Likewise, when paying dividends (financing activity), money goes out of the company’s account; hence, it is treated as an activity that consumes cash.
Imagine if you can look at all the line items (mainly from the balance sheet) and –
-
- Categories them as operating, financing, or investing activities
- Figure out if it is consuming or generating cash
Then, by summing cash flow from different activities, you should generate the company’s cash flow statement and get the company’s cash position.
Let’s go ahead and do this for our model.
13.3 – Categorizing line items
The idea is simple, we list all the balance sheet line items and figure out their impact on the cash position if it were to increase or decrease. Eventually, each line item either tends to generate cash or consume cash.

For example, if the company were to issue more shares and increase the share capital (raise more equity), then cash comes into the company, and the cash position tends to increase. If the CAPEX spend were to reduce, then from the perspective of the cash position, it tends to increase cash.
13.4 – Cashflow from operating activity
Using the above framework, we can now derive the cash flow statement in the indirect method. The idea here is simple, we treat each line item basis the activity type and then figure if that particular line item increases or decreases the cash position.
You know the drill, we create a new excel within the workbook and rename it as ‘Cashflow.’ We index it like we did the other sheets. We will start with the operating activities first.
The idea here is to find out if the company’s operation has generated cash or not. We start with the PAT, add back depreciation, and then add the net change in working capital by considering each line separately.
Remember, depreciation is an accounting expense. Hence we need to add back depreciation. Here is the snapshot of the excel sheet –
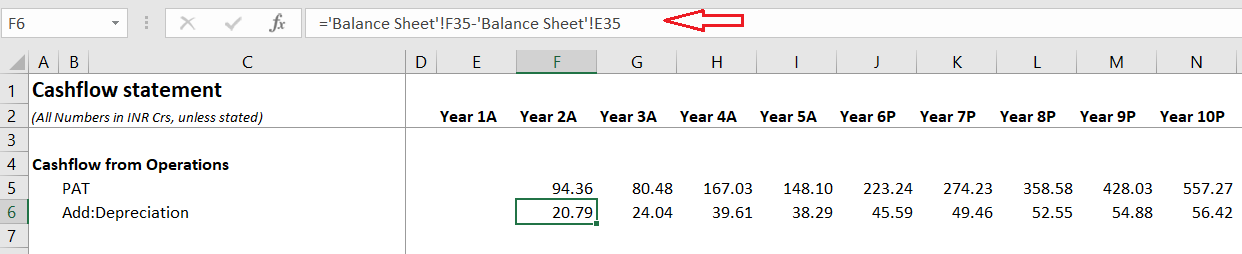
I want you to notice two things here. First, I’m starting the sheet by directly working on the Year 2 data. There is a reason for this, which you will soon realize. Second, I’ve extracted the depreciation value from the balance sheet and not the P&L, and this is because the P&L depreciation is only for the year, but in the balance sheet, you not only get the yearly depreciation but the depreciation non-expense as well. Alternatively, you can also get the depreciation data from the asset schedule.
Continuing on the operational activity, we now look at working capital changes and their impact on the cash position. Here is the excel setup –
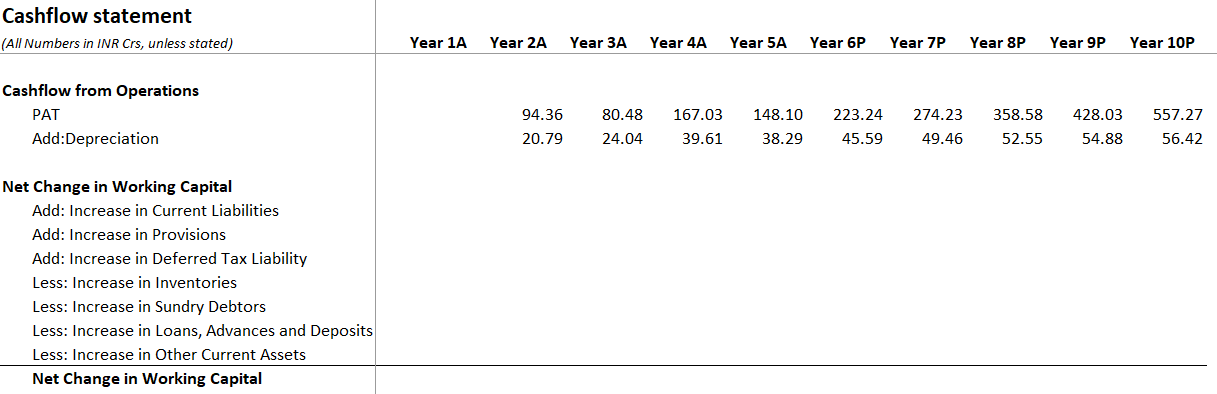
As you can see, since we are calculating ‘increase’ for the previous year, we are starting from Year 2 and not Year 1.
All the line balance sheet items that I’ve considered here are related to the current assets and liabilities. These two together help me identify the net change in working capital. Let me do the very first calculation and explain a particular nuance here.
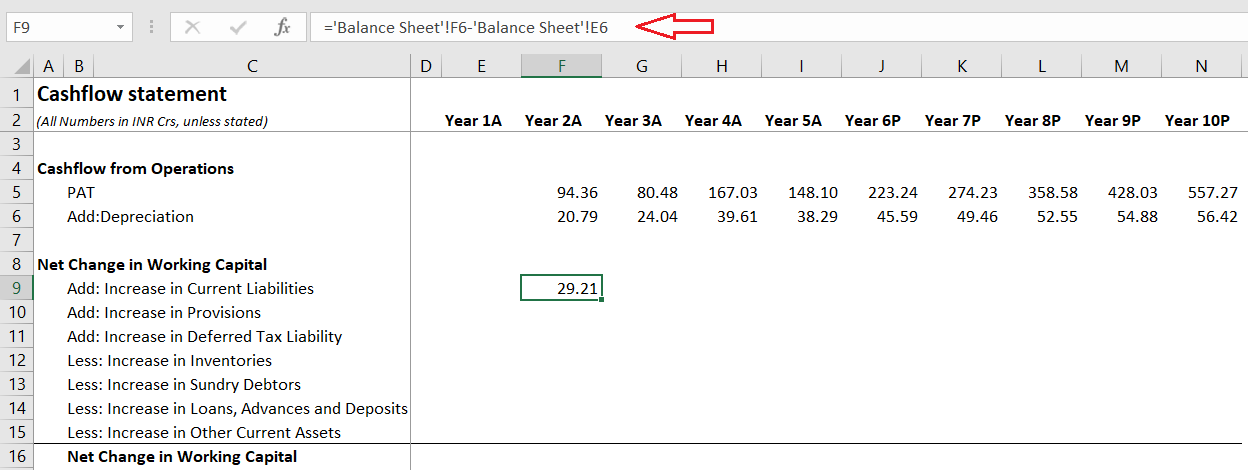
From the balance sheet, Y1’s Current liability is 73.53 Cr, and Y2’s current liability is 102.74Cr. An increase in current liability is –
Y2 – Y1
= 102.74 – 73.53
= 29.21 Cr
We discussed earlier that if the current liabilities increase, then from a company’s point of view, the company retains the cash as it is deferring payments against its liabilities to a later date. It’s as simple as, ‘I owe you money, but I will pay later instead of paying you now. Hence my bank balance tends to increase.
Therefore, if there is an increase in current liability, we will add it. Now, let us flip the numbers for a momentum –
Current liability of Y1 = 102.74
Current liability of Y2 = 73.53
If we do Y2-Y1
= 73.53 – 102.74
= – 29.21 Crs.
Here is a situation where the company is reducing its current liability, which means it will tend to reduce the cash balance.
If we plug this on our ‘Add: Increase in current liability framework,’ we automatically deduct cash, thanks to the negative sign.
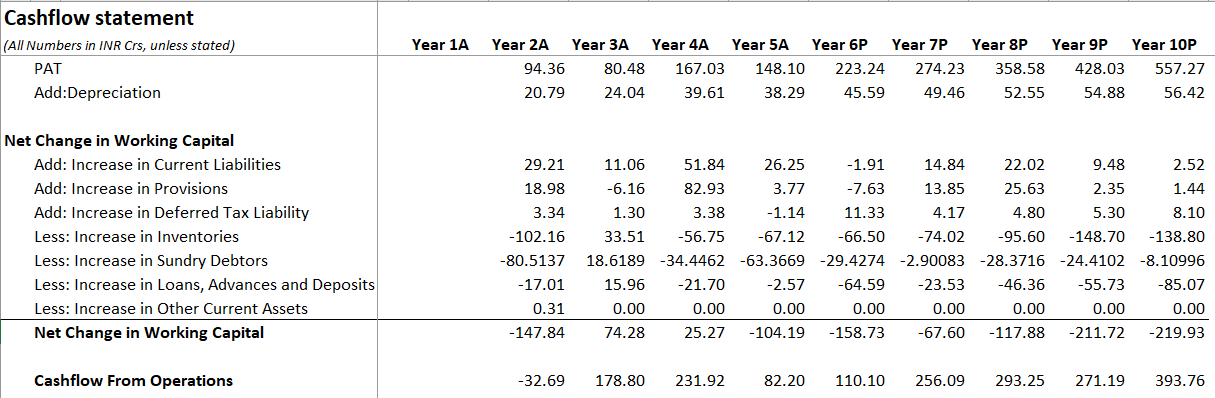
I hope this explanation is clear; else, please do feel free to ask your queries, and I’ll be happy to explain whichever bit you find challenging to understand. I’ve extended the same to all the other line items, and here is how it looks –
One common query at this stage is why we are adding things like provisions and current liabilities and deducting things like inventories and sundry debtors. We are calculating the increase in value in Year 2 over Year 1. Some of these line items tend to increase the cash balance, and some tend to decrease.
The total of all the values of all these line items is the net change in working capital. Cash flow from operations is (indirect method) –
= PAT + Depreciation + net change in working capital
For Year 2, the operating cash flow or operating activity is –
94.36+20.99-147.84
= 32.69 Crs.
At this point, financial modelers will usually quickly check the company’s annual report and compare the stated cash flow from operations to check if it matches.
The numbers won’t match for obvious reasons. But don’t worry about that; in the Indirect cash flow method, or primary concern is to match the overall cashflow number i.e.
Cash from operating activity + Investing activity + financing activity
Here is what the cash flow from operating activity looks like –
Next up is cash flow from investing and financing activities
13.4 – Cashflow from investing and financing activities
The first thing we need to consider while dealing with investing activities is the CAPEX spend. If the CAPEX spend increases, then it consumes cash, and if the CAPEX spend decreases, it generates cash (or conserves cash). We can get the CAPEX data from the asset schedule.
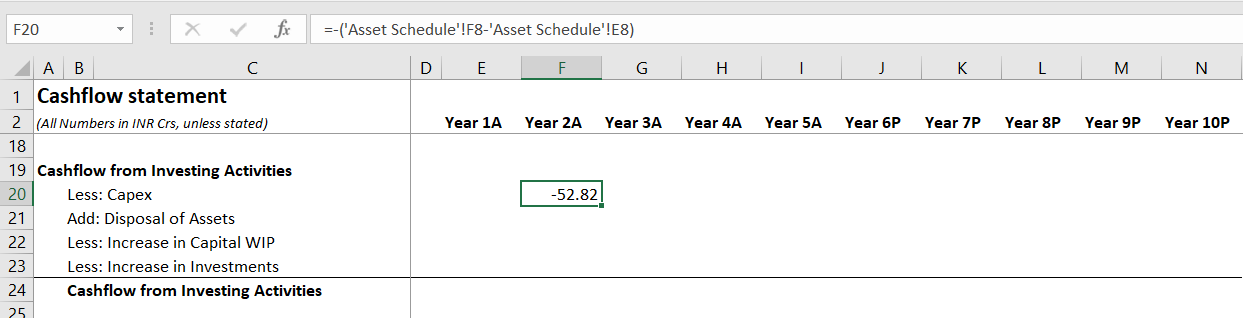
Notice, I’ve specified ‘Less: CAPEX’ to indicate that the increase in CAPEX results in cash consumption. I’d also request that you notice the necessary adjustment in the formula bar.
The company has not disposed of any assets, and we know this from the asset schedule. Hence, the disposal of assets will be zero.
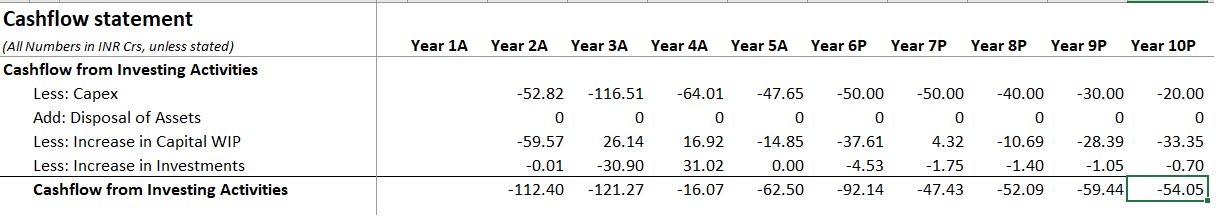
The other two line items, i.e., capital work in progress and investments, are straightforward, and we get that from the balance sheet. The total of all the four-line items is the cash flow from investing activities.
Next up is the cash flow from Financing activities. I’ve completed this on excel, do check the snapshot –
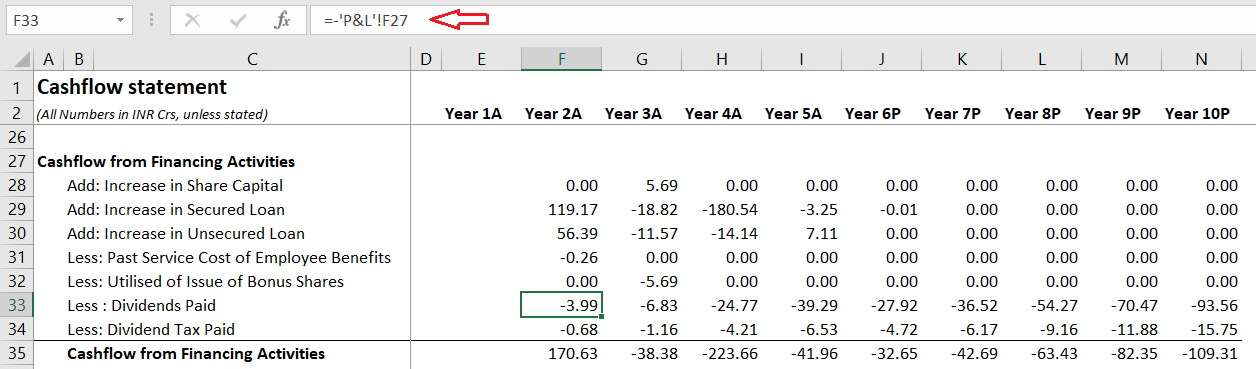
I think you know what’s happening with the increase in share capital, secured and unsecured loans. I’ll focus on the last four line items. Past service cost of employee benefit is a one-time cost specific to this company. Costs such are one time in nature should be dealt with slightly differently. Here, you don’t consider the difference between the two years; instead, take the expense applicable for that year directly.
Dividends, too, are a yearly expense, and the company may even decide not to pay dividends for a year. So all such one-time costs should be treated as is. I’ve highlighted the same in the formula bar above.
We have now calculated the cash flows from all three activities. The sum of these three activities gives us the cash flow for the year. Here is the same –
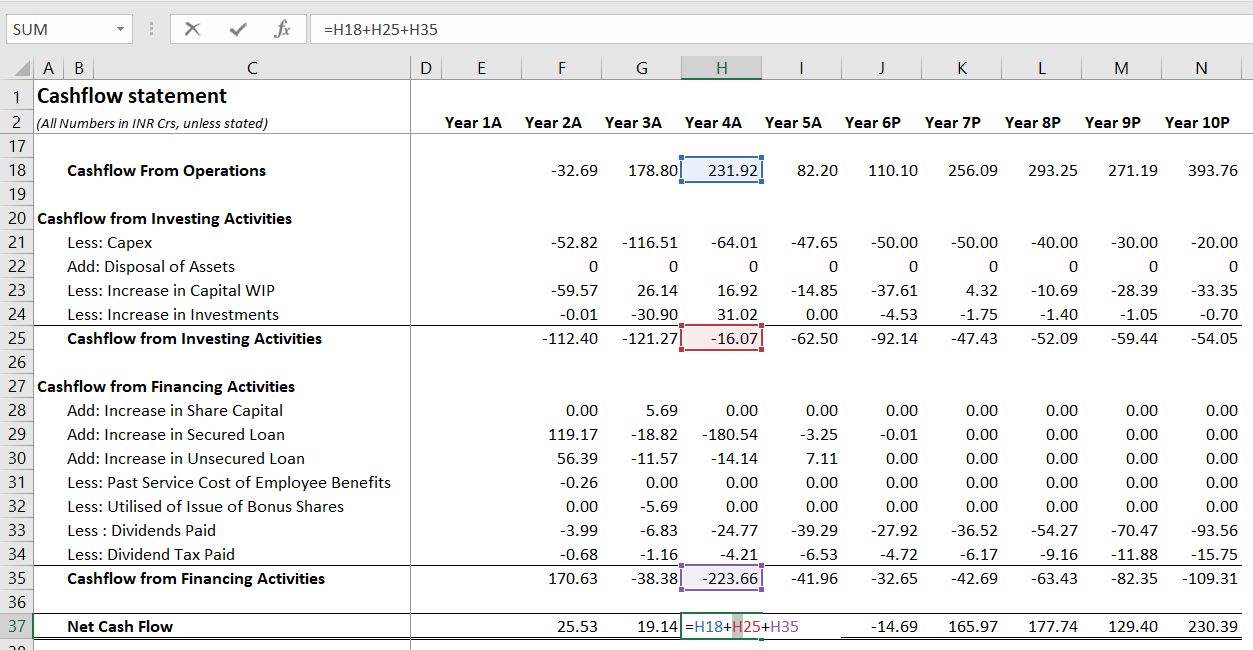
Now, don’t be in a hurry to plug these numbers into the balance sheet. It won’t balance just yet. Remember, we have calculated the cash position for the given year.
What do we need to do to get the complete cash flow picture? Please look away from your device and think about it for a few minutes.
I hope you got the answer. The number we calculated above is for the current year’s cash position. To this number, we need to add the previous year’s closing balance (of cash position) and then arrive at the total cash position for the year. Yes, we are talking about applying the base rule here.
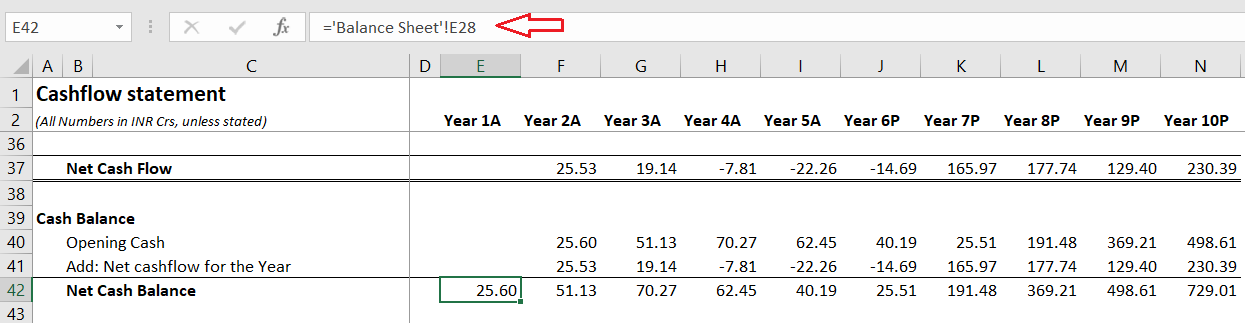
We can get the closing balance of cash and cash balance for Year 1 from the balance sheet. The exact value is now the opening balance of the cash position in Year 2. Add to this the cash flow for the year (which we calculated); we get the closing balance of Year2.
This net cash flow that we have calculated should match the balance sheet numbers. To clarify the same, I’ve pulled the balance sheet numbers –
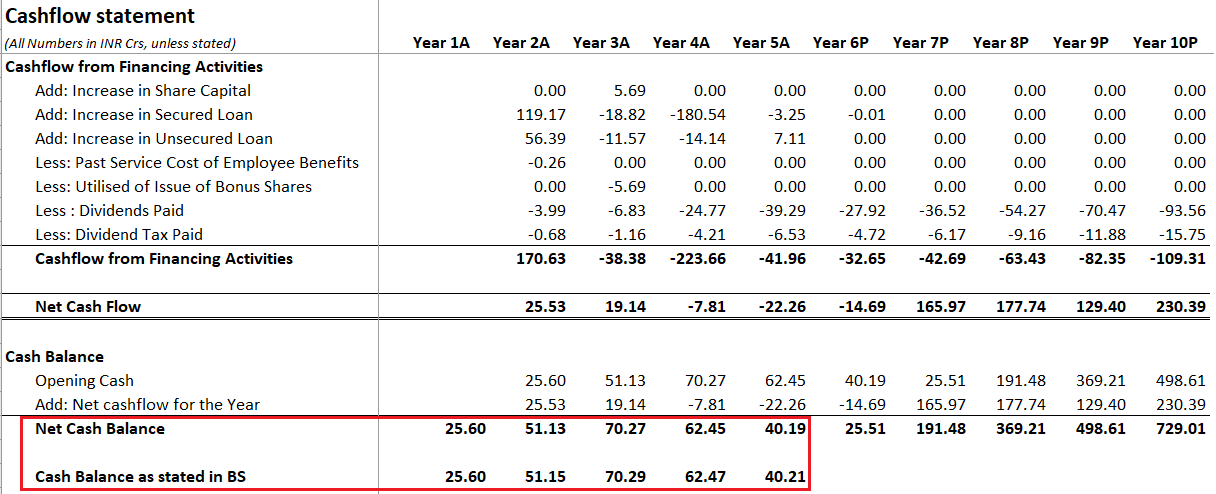
The historical numbers match (ignore the decimals), so we can now pull the cash flow numbers back into the balance sheet for future years. Yet again, by linking cash flow back into the balance sheet, we continue to integrate the financial model.
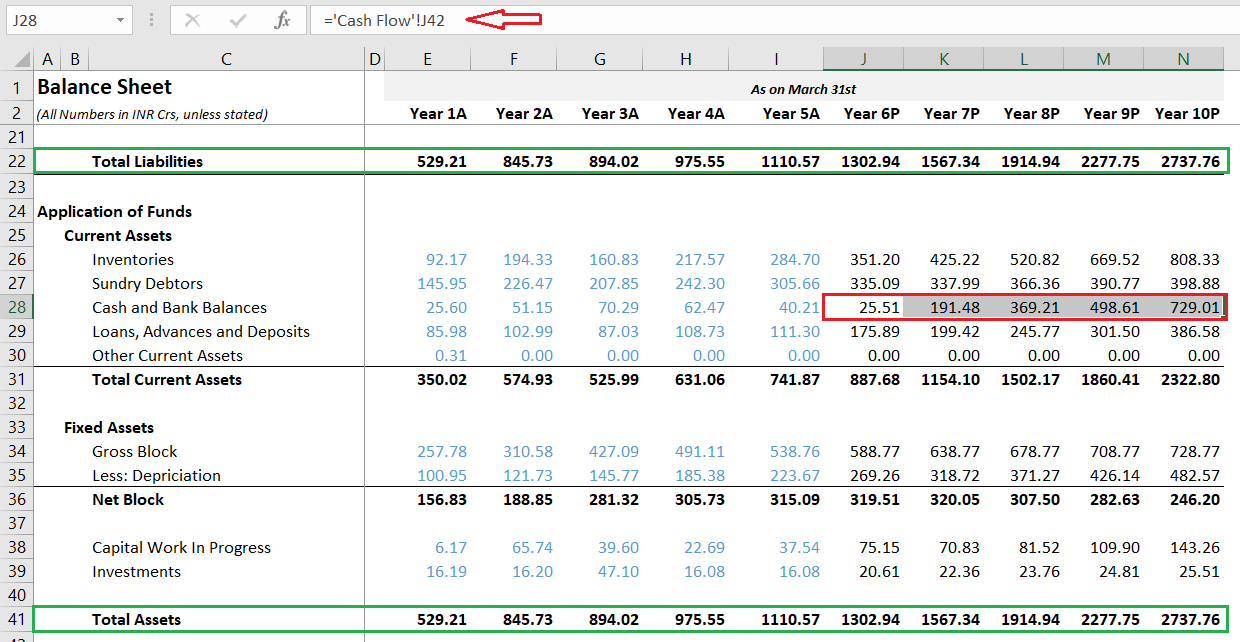
I’ve done the same, and like magic, the balance sheet balances 😊
As I mentioned earlier, this is a landmark moment in our financial modeling journey. At this point, we are at least 80% done with the model. In the next chapter, we will take up the valuations.
You can download the excel used in this chapter here – [Cashflow statement Excel].
Key takeaways from this chapter.
-
- One can derive the cashflow from P&L and Balance sheet; this is called the indirect method of cash flow preparation
- Few line items tend to increase the cash balance, and some tend to decrease the cash balance
- We should use the depreciation from the balance sheet (or asset schedule ) in the cash flow statement
- After deriving the cashflow numbers, we need to add the previous year’s cash flow to get the closing balance of the cash position
- The net cash flow flows back into the balance sheet to balance the balance sheet.
Some questions:
1.Other Financial Liabilities (comes in operating in WCC or in financing ) (in current liabilities in BS) (same for other financial Assets both mentioned in current assets and non current assets.
2.Current tax asset and current tax liabilities and deferred too (in Current asset and CL of Balance sheet) (will come in WCC or like their is other treatment for tax and all things..
3.there is a item like non controlling asset in equity section only for one year 2020
Deferred tax assets and non current tax assets mentioned in non current assets will also be included in Investing activities..
what about provisions in non current liabilities..
sorry sir for this much.
1) Increase in other financial activities tends to decrease cash balance and vice versa
2) Same as above
3) Not sure, this is with respect to group companies?
4) Taxes is financing activities right?
Hello sir, actually I have tried many time to match my cash by doing some jugad too Removing something adding and all (but i guess due not strong knowledge about every line items i cannot able to match cash flow )
is there any chances i can build cash flow the other way like from annual report or from screener copying that (ik you have told to not use 3rd party data but for now)..
or any other way ??
Yeah, you can do that as well Harsh.
Thank you your valuable article.
I have a problem. In Cash Flow Statement net cash does not match with that of balance sheet. I also had applied fix you provided in comment section.
Can you provide me any contact to which I can send my model and you could help me.
Thanks in advance.
Sorry Sanjiv, wont be able to do that. But in most cases, the problem lies with interchanging +/- signs or wrong entries while populating the sheet. What I\’m saying is that the mistakes could be so trivial that we\’d have missed paying attention to. Can you please double check you excel sheet once again throughly?
Can you guide us on how would we project the Bank balances other than the above Cash and Cash Equivalents component?
We derived the cash component as the Net of Cashflow activities.
YOu can check this – https://zerodha.com/varsity/chapter/banking-part-1/ , would also suggest you please post this query there 🙂
Hello Karthik,
As requested above by a few people, can you please create a full financial model of any company and attach it at the end of the session which would be a kind of summary of all your sections.
Yes, noted. Thank you, and I will try and do that 🙂
Sure, thanks a lot. Will try and get back in case of difficulty.
Done. Good luck!
Hi Mr Karthik
I am stuck here, the indirect cash flow is still not matching the net from the cash flow statement, even after following your above suggestion given to a comment. If I am not asking for too much, would it be possible for you to share/ email me the fields/items used by you along with the values for one year (so that the net CFO statement matches) , this will help me in seeing where to correct my model.
Thanks
Subha
Please do check my previous comment.
Hi Mr Karthik
I am also stuck here, the indirect cash flow is still not matching the net from the cash flow statement, even after following your above suggestion given to a comment. If I am not asking for too much, would it be possible for you to share/ email me the fields/items used by you along with the values for one year (so that the net CFO statement matches) , this will help me in seeing where to correct my model.
Thanks
Subha
Hi Subha, please do check the comments from Jay, he has shared a linewise items which add up and subtract from the cashflow. Hopefully that helps.
Regarding the second question of non cash expense, i think i would get my answers on that once you share the cash flow statement for the given year.
Will wait for that and reach out to you for further queries.
Thanks
Sure, will connect shortly.
Hii Karthik
Thank you for looking guiding me in this.
Not sure why that email id is not working. But I am adding another email here which i use frequently.
Could you please use this one?
Thanks once again..
Done, will connect you with someone. Hopefully that should help.
Hii Karthik,
So I am trying to figure out why my Net of indirect cashflow statements is not matching the net cash flow statement and I found out that they have added the taxes back along with many noncash expenses and they started with PBT. We are starting with PAT and adding the Depreciation and amortization back, but don\’t we need to add the other noncash expenses?
Also, the difference is huge between the net cash. The example you took had pretty straightforward data but the actual FS of a company deals with multiple notes and the Cash flow statements have line items from them. Will the indirect method work on these kinds of data?
It is supposed to work on all cash flows. By the way, what other non cash expenses are you referring to?
Hii Karthik
I made the necessary changes as you mentioned but the cash flow is still not matching the net from the cash flow statement.
Can you guide me in any way so that I can fix this? I tried searching on other sources but they usually use different methods than the one we have used here. I have a high dependency on you for creating my first model as I want to continue with your approach and reach the end goal.
If possible can you share the fields along with the values for one year(2020-21) such that it matches the net cash flow of the statement, please? Then with that reference, I would be able to tweak my model as well.
Regards,
Jay
Ok. It will be tough for me handhold given time is a massive constraint. I\’ll email you.
The email you use to comment here does not seem to work 🙂
Hii Karthik,
Can you confirm if I have categorized the values correctly, please? The doubt I have is regarding the other equity. So there are a few line items under the note for the Other Equity. Dividends is also present in the same line item.
The Net cash flow does not match the cash flow statement\’s net. Have checked the depreciation (taken the accumulated depreciation for PPE, intangible assets, ROU Assets) and have taken it from the Asset Schedule.
Cashflow from Operations
PAT
Add:Depreciation
Less: Deletions/Adjustments
Net Change in Working Captial
Less: Right of Use Assets
Add: Disposal
Less: Inventories
Less Trade Receivables
Add: Other financial asset (Current)
Less: Other current assets
Add: Other financial Liabilities (non-Current)
Add: Provisions non-current
Add: Deferred Tax Liabilities (Net)
Add: Total Outstanding dues to micro and small enterprises
Add: Total Outstanding dues of creditors and other than above
Add: Other financial Liabilities ( Current)
Add: Other Current Liabilities
Add: Provisions current
Add: Current Tax Liability (net)
Net Change in Working Captial
Cashflow from Investing Activities
Less: Property, Plant, and Equipment (non-current)
Add: Deletion/adjustments
Less: Captial Work in Progress (non-current)
Add: Deletion/adjustments
Less: Intangible assets (non-current)
Add: Deletion/adjustments
Less: Intangible assets under development (non-current)
Add: Deletion/adjustments
Less: Investments (non-current)
Less: Loans
Less: Other Financial Assets noncurrent
Less: Other Non-Current Assets
Less: Investments (Current)
Less: Loans Current
Cashflow from Financing Activities
Add: Equity Share Capital
Less: Dividends
Less: Transfer to General Reserve
Add: Securities premium received on exercise of shares under Employee stock option
Add: Lease Liabilities (non-current)
add: Lease Liabilities (Current)
Add: Borrowings
This seems ok. If some of these things are small, maybe you can ignore.
Add: Total Outstanding dues to micro and small enterprises
Add: Total Outstanding dues of creditors and other than above
Also, ensure the line items are presented across all years, and not just for 1 or 2 years within the 5 year period you are considering.
Hello Karthik,
Apologies for this, but I am not here asking a doubt. I am shooting my shot and applying for a job at Varsity. I have worked as a content manager at upGrad for four years and as a writer for six years. Your commitment to replying to all of these comments is genuinely inspiring and I feel Zerodha is a genuinely great place to work, especially considering your content is free. No sales pressure.
I am sending a comment here because I could not find any other way to contact you (X.com included), and I did not see any varsity job openings on Ln.
I can send more details on any email ID you can add here of the company.
Thank you so much for your time and apologies again if this is feels like a nuisance.
PS – Please don\’t make me go viral on Twitter for this. Thanks.
Cheers,
Malhar.
Hey Malhar, Varsity is the only place I answer everything that comes my way. My bad if I\’ve not responded to you on other platforms.
We dont have any opening at Varsity for now, but if something comes up then we\’d put it up on social media. So please keep an eye on our social media handles.
Also, whats with going viral on Twitter? 🙂
Also, depreciation is not present in the BS of Relaxo. So we need to use the asset schedule and while doing so do we only need to add the depreciation or do we need to include the Amortization as well while calculating the depreciation for Cashflow statement?
It will be in gross block section, look in the notes associated with net block.
Hii Karthik,
I started with Relaxo Footwear as discussed above. But again I am stuck at this step of projecting the cashflows.
So we need to take all the line items of the Balance sheet and P&L and categorize them according to the activity. Right? But in doing so I tend to get confused about which line to pick. In Other Equity do we need to include all the sub-line items from the notes? Because in your Excel there are a couple of line items that are derived from the Reserve schedule and are not present in the BS or P&L.
I know you would be trying your best to share the reference model we discussed above, but till that time would it be possible for you to share categorized line items under the Cashflow activities for Relaxo Footwear with which we fill the line items of our cashflow statement and start the projection, please?
This would be able to help me a lot to understand how to categorize various line items from a proper balance sheet and enter them in the Cashflow statement.
Nik, so essentially these are primarily BS line items. Only PAT data from P&L flows in for OA. Reserves schedule, you pull sharecapital, this can also come for BS directly, not necessarily from schedule.
Please try the above, focus only on B&S and not P&L.
I can understand the amount of time you would need to devote to this Karthik. But it could be a great add-on to this course.
As you have already simplified the learning with an example, a real company\’s model will help us to understand the linkage in a more efficient way.
I would request you to spare some time over the weekend if possible to create that model.
Thank you so much for your replies throughout the course. I always see a reply from you within the timeframe of 24 hours which is great. It has been a great learning journey with you Karthik.
Appreciate your efforts. 🙂
Thanks for the kind words, Nik. Sure, I\’ll attempt to do that, but please forgive me in advance if I don\’t do it within the next few weeks 🙂
Hello Karthik,
I have picked Excide Industries only but it does not have consistent Annual Reports for the last 5 years. So can you suggest any other
Also, I have taken depreciation as a current year – Last year. Hope this is correct.
Yup, thats correct. Also, I hope you\’ve taken that from consolidated reports.
Balance sheet consistency is the key in financial modelling. I\’d suggest Bajaj Auto or maybe Relaxo? This is just for learning 🙂
Also, can you suggest a company I can pick and start with again from 0? I tried with Excide Industries and I think I picked the wrong company to start with.
Pick something like Exide, simple business to understand. Should not have too many verticals.
Hii Karthik,
I have taken all the line items from the balance sheet and divided them into the Activities categories. The values are far away from the actual net Cash flow in the cash flow statement.
The line items are too many and very different from the ones we have used in our model. I have cross-checked the numbers too many times now but am unable to figure out what went wrong.
I have a request if possible can you share one model of any company? It would give us a better idea of how to treat the line items. It would be a great help if this can be done.
Hoping for your positive response. 🙂
I\’ll have to build one from scratch for that, Nik. Let me try over wekeends 🙂
Meanwhile, one area where many ppl make a mistake is while taking depreciation numbers. Make sure you are treating it properly.
consolidated balance sheet
Ah ok, then you need to double check the math again.
Thanks sir, will do it.
Happy learning 🙂
Hi kartik,
i\’m trying to build one model for a company and i notice some discrepancy for ex, when i was trying to calculate change in inventory with our formulae it turned out that it\’s not matching with the one that is provided in the Annual report, so i was wondering if the company calculated it in some other way and should we not get bother with this and continue as is and eventually later the statements will match?
Thanks.
Are you taking consolidated or standalone balance sheet numbers?
Good evening sir,
Many thanks for this excellent lesson. I am new to finance and am slowly learning from your modules. I have taken amara raja for my study. But am very confused as to which line item to be add and when line item to be less in the indidrect method of CFO. Can you please clarify if I have correctlly stated the same for the below line items.
Cashflow from Operations:
Non-current assets
ADD: Deferred tax assets (net)
LESS: Other non-current assets
Current assets
LESS: Increase in Inventories
LESS: Increase in Loans, advances, deposit
LESS: Increase inTrade receivables (sundry debtors)
ADD: Increase in Bank balances other than (iv) above
LESS: Increase in Other current assets
ADD: Increase in other financial assets
Non-current liabilities
ADD: Increase in Provisions
ADD: Increase in Deferred tax liabilities (net)
ADD: Increase in Other non-current liabilities
Current liabilities
ADD:Increase in Provisions
ADD: Increase in Other current liabilities
Net Change in Working Capital
ADD: depreciation
ADD: PAT (from P & L)
Cashflow From Operations
———
Cashflow from Investing Activities:
Non-current assets:
Less: Property, plant and equipment (CAPEX)
LESS: Increase in Right-of-use assets
LESS: Increase in Capital work-in-progress
LESS: Increase in Other intangible assets
LESS: Increase in Intangible assets under development
LESS: Increase in Investments
ADD: Increase in Other financial assets
Current assets:
LESS: Increase in Investments
ADD: Increase in Other financial assets
Add: Disposal of asset (From asset schedule)
LESS:Increase in other tangible assets
LESS: Increase in other income tax asset
LESS:Increase in other non current asset
Cashflow from Investing Activities.
———–
Cashflow from Financing Activities:
ADD: Increase in Equity share capital
Non-current liabilities:
ADD:Increase in Borrowings
ADD:Increase in Lease liabilities
ADD:Secured loan (non current liability)
ADD:UnSecured loan (non current liability)
Current liabilities:
ADD:Increase in Borrowings
LESS: Increase in Lease liabilities
ADD: Increase in Trade payables
LESS:Past Service Cost of Employee Benefits
LESS:Utilised of Issue of Bonus Shares
LESS:Dividends Paid
LESS:Dividend Tax Paid
Cashflow from Financing Activities.
———
Requesting you to kinly upload an excel with indirect CFO for amara raja. This will be very very helpful. Thanks a lot. Please requesting you to consider the request as I am stuck in this excel, not balancing.
Thanks sir.
Suba, unfortunatley I wont be able to add this to excel. But this seems to be ok. Have you double checked the numbers flowing in from one sheet to another? Usually the problem occurs when you dont interlink the cells correctly. Please do check that once.
And sir do we have to segregate every line item of p%l and balance sheet into these three category(operational, investing, financing activity). And if yes then do we have to use it in our cashflow statement accordingly?
You will have to understand the nature of these activities and tag them as ops, finance, or investing activities.
Dear sir,
We have used PAT in our indirect cashflow statement, but when I check cashflow statement of all the companies in the annual report they have used PBT. Why soo?
They use direct method of cashflow statement 🙂
For the past years for which annual report are already available, is it absolutely necessary that our cash flow numbers match exactly those shown in the annual report?
Or is it okay if my numbers are withing a small range, say, +/- 10% of those shown in the AR coz for future years/projections we are playing a guessing game anyways?
The problem is because in the official AR, there are a lot of line items which are not explained clearly and their values have to be hardcoded without understanding where those numbers come from rather than linking them to BS/P&L…(the company I am trying to model is Thyrocare)
The trick is to ensure your balance sheet matches and balances. Rest are ok, if there is a small variance.
Hi how did you come up with the figures for \’Less:Past Service cost of Employee benefits\” and \”Less:Utilized of Issue of Bonus Shares\” under Cashflow from financing activities? Thank you.
As stated in the annual report, Prithvi.
Hi karthi, vga, i see right use of asset in balance sheet for some years, i searched for it, i understood this part that it is the leased fixed asset for the particular year. on basis on this can we say company might have capex investment soon, as they are leasing out the assets such as building and machinery?
Also what does it say about a company. ty
If it is for previous years, then there should be an associated notes for this right? If its CAPEX, then the company should/will usually talk about it in the analysts meetings or management interviews.
Hi Karthiak, we talked about talking the consolidated annual report, can we consider standlone statements too for financial modelling. ty
If the company is simple without any major subsidiaries, then you can. Else, I\’d prefer to go ahead with the consolidated financials.
hi karthik, you share quite many times in this module, depreciation present inboth balance sheet and p&l, but i could nt find it neither in amarraja nor relaxo, kindly share what can i take here. ty
In P&L, look under expenses and in balance sheet, look for it in Gross block (asset side) of the balance sheet.
Hi Karthik, i was having trouble understanding, why is dividend and cost of employee service a financial activity. shouldnt cost of employee a operational activity as operation cant move on without employee. similarly, what creteria does it needs to staisfy financial activity.
the way i understood was, if money is coming in company then its financial activity like loans. kindly share some light on this.
Dividends are essentially taking money off business, so its a financial activity. Employee salaries are operational activity, but anything apart from that, like ESOP activity is considered financing activity again.
Dear Karthik Sir,
I trust this message finds you well. I am writing to express my heartfelt gratitude for the immense guidance and mentorship you have provided, which has significantly impacted my financial journey.
Under your tutelage, I have learned to navigate the world of options trading, pledging 50% of my total capital in stocks and 50% in debt funds. This approach has enabled me to earn a consistent 2% per month, all while maintaining my 9-6 job without feeling overwhelmed. Your teachings have not only provided me with financial stability but have also equipped me with valuable knowledge in various financial concepts.
I appreciate the efforts you put into teaching fundamental analysis, particularly with Amara Raja Batteries. The insights gained from this exercise have been invaluable. However, when it comes to financial modeling, the company used in our sessions was unfamiliar, leading to some uncertainties and doubts on my part.
Considering the significant impact that your teachings have had on my financial success, I kindly request your assistance in conducting a financial modeling session specifically with Amara Raja Batteries. It would immensely help if you could provide an Excel model to accompany the session. This way, not only would it clarify doubts for me, but it would also allow others to correlate fundamental analysis with financial modeling, making the learning experience more comprehensive for everyone.
I understand the complexity of financial modeling, especially for individuals without an accounting background. Your expertise has been instrumental in simplifying these concepts, and I believe a session with Amara Raja Batteries would further enhance our understanding.
Once again, thank you for being a guiding force in my financial journey. Earning a consistent 2% per month has become a reality, and I am truly grateful for your teachings. I eagerly await your response and guidance on the proposed financial modeling session.
Warm regards,
[Amanvas]
Thanks for the kind message and for letting me know, Amanvas. I\’m glad you are making consistent profits, and I hope that gets bigger and better for you.
About the amaraja financial modelling, let me check how I can do this. I\’ll give it a though. Thanks.
sir i have added all line items except net block and other equity,shall i include line item net block in non current asset and other equity line item in cash flow sir, if not why?
The CAPEX in operating activity would have taken care of gross block right?
Not balancing sir i have cross verified all the line items but not able to understand where i have done mistake sir
This is a typical issue. Do check the assumptions once. Also sometimes the balance sheet wont be balancing because of minor decimal difference, do double check that once.
Hi Karthik sir,
I am working out with amar raja batteries, the cash flow statement has lot of deviations, could you please correct where i have done the mistake
Cashflow from Operations
PAT
Add:Depreciation
Net Change in Working Capital
Add: Increase in Current Liabilities
Add: Increase in other non Current Liabilities
Less: Increase in Inventories
Less: Increase in Loans
Add: Increase in trade receivables
Add: Increase in Bank balances
Add: Increase in other financial assets
Less: Increase in other current assets
Add: Increase in non current Provisions
Add: Increase in Deferred Tax Liability
Net Change in Working Capital
Cashflow From Operations
Cashflow from Investing Activities
Less: Capex
Add: Disposal of Assets
Less: Increase in Capital WIP
Add: Increase in other financial assets
Less: Increase in non current Investments
Less: Increase in Investments
Less: Increase in Right of use of assets
Less: Increase in other tangible assets
Less: Increase in other intangible assets
Less: Increase in other income tax asset
Less: Increase in other non current asset
Cashflow from Investing Activities
Cashflow from Financing Activities
Add: Increase in Share Capital
Add: Increase in borrowing
Less: Increase in lease liabilities
Cashflow from Financing Activities
Please where i have taken add instead of less and less instead of add
This overall seems ok to me. Is the cashflow number balancing the balance sheet?
Upload latest varsity modules in telegram channel as pdf
Thanks for the response. I rethought and started the CFS derivation using PAT instead of PBT and used the depreciation schedule to get the depreciation numbers. Now, the BS and CFS is validated. Hope this is a correct alternative method?
I had another question, if the company I took has negligible debt, is it okay to skip making a debt schedule and just take the difference between previous and current debt numbers to account for in the CFS?
Yes, that helps. Glad you got that sorted.
Yes, but at times that can cause balance sheet to not balance. So please be aware of that.
Hi Karthik,
Since every company has many different line items, the derivation of cash flow is something that I couldn\’t understand from this chapter. Other than that, rest of the chapters were easier to understand, including the subsequent valuation chapters.
I am not sure how to even make sure where I have gone wrong in my derivation of the cash flow statement. I checked all linkages, all reported numbers, all assumptions and other calculations, even made a new company model with 3yr data, all to the same fate. Checked out multiple YouTube videos, but even those don\’t address my doubts. I know it is a bit far fetched, but would you be able to take a look at my model?
Hi Phil, that would be tough for me. But some pointers, the usual culprit would be in the –
1) Depreciation numbers in Operating activity – make sure you take from P&L.
2) CAPEX – make sure you are dealing with gross block.
3) Make sure you are accounting for dividends if any.
4) Ensure you are also taking into consideration balance sheet line items that emerge from one off yearly events.
Good luck!
Hi Karthik!
In this chapter while calculating Cash flow from Operating Activities(CF(o) we have taken PAT and added changes in Working Capital to get to CF(o), while what we generally do according to AS 3 is take PAT, do the changes in working Capital and do the adjustments for non operating expenses and incomes(like finance expenses), which we haven\’t done in this chapter. Could you please confirm this or am I missing something?
Btw Ram here from the earlier years of Varsity.I was a small kid when I started to read Varsity around 5th grade and now have recently cleared my CA Intermmediate exams with an All India Rank and working in EY.
Karthik Sir you are the man responsible for this! Thanks for everything! Wishing you and your family all the best!
Cheers!
Ram, about the AS3 adjustment, I\’m not sure, I\’ll have to check this 🙂
But thanks so much for the message. It made my day and I\’m soo happy to read that you are doing so well. Hoping you get all the success 🙂
These details were there, so should I also project them for future while making the statement. Also, how is this method different than what you have showed us?
What we have discussed here is the indirect method of cashflow preparation. CFOs us the direct method with bills and vouchers.
Hi Karthik,
I am creating Cashflow statement for Relaxo, I checked the format for the same in their annual report they have calculated operating profit before working capital changes and then made the adjustment. For calculating the operating profit before working capital changes they have made adjustments for finance costs, Intrest income, Share-based payments etc.
1) Can you shed light on operating profit before working capital changes?
2) How do I go on with making the cashflow statement as the adjustments for the same are not mentioned directly in the BS or P&L?
Sakina, did you check the notes? Usually, the associated notes accompanying the financial statement will have these details.
How are employee benefits a part of financing activity, shouldn\’t they be operating activity?
One-time benefit, you need to check the associated notes to understand the nature of the expense before classifying it in a relevant activity.
I got bit confused in scheduling thanks for uploading the excel and this module is such a huge help sir. Thank you
Happy learning, Tanya!
(AR 2021-22)Voltas
IN Balance sheet, 2022 2021
Trade receivables = 16 2,109.67 1,800.93
IN Cashflow Statement,
Trade receivables = (386.81) (87.01)
If we calculate cashflow from Trade Receivables, it should be(308.74), but it isn\’t matching with Cashflow statement numbers. Same story applies for some other items as well.
There is no cash flow per say from trade receivables, Sahil. The money from TR or any other item either increases or decreases and collectively they make up the cashflow.
The increase or decrease in cashflow either tends to increase or decrease the cash balance.
Hello Karthik Sir,
While calculating Cashflow from Working capital changes, I see lot of line items\’ numbers given in cashflow statement doesn\’t match to my calculation for those items.( I mean to say, when I calculated difference between last year and current year Trade Receivables, that difference doesn\’t match with the figure given in cashflow statement in AR). I am working on voltas ltd. Plz check if possible. Is there any way out?
Are you calculating these line items yourself? If you are taking these numbers from the AR, then the numbers should match right?
Hi Karthik,
Thanks for your reply….For the cashflow derivation,apart from PAT,depreciation and all line items of balance sheet,can you tell me what all have to subtracted.
Please do check the module on Financial modeling, I\’ve explained this in detail.
Hi Karthik,
Can you pls explain why only the below line Items are subtracted
Less: Past Service Cost of Employee Benefits
Less: Utilised of Issue of Bonus Shares
Less : Dividends Paid
Less: Dividend Tax Paid
Also,why Reserves and Surplus is not considered ?
Because these line items tend to decrease the cash balance, hence deducted. R&S tends to increase the cash balance, hence tends to get added up.
Hi Karthik,
I tried to derive cash flow statement for Relaxo.But first years derived cash balance is negative.Can you pls clarify whether my below understanding is correct..
1)for Add:Depreciation,the depreciation in the Balance Sheet of current and previous year are subtracted.But for Relaxo,it is negative(-184.67).So even in this case,do we need to mention as Zero or negative itself.
All current Liabilities and current assets line item comes under \”net change in working capital\”.
2)All Fixed Assets line items comes under \”investing activities\”.(In Relaxo,both Tangible and Intangible assets are given in the balance sheet.So,do we calculate the intangible asset as Tangible asset(Less: Capex,Add: Disposal of Assets))
3)Share capital,non current Liabilities line items under \”Financing Activities\”.Can you please clarify what all line items has to be subtracted from this.(here
Less: Past Service Cost of Employee Benefits
Less: Utilised of Issue of Bonus Shares
Less : Dividends Paid
Less: Dividend Tax Paid…..these line Items are not mentioned in the balance sheet
)
1) No, cant make it zero. You will have to consider it as is.
2) You can have a separate line item for intangible assets
3) Dividend in B/S is inclusive of dividend tax. Do check the balance sheet notes once.
please explain how isuue of Bonus share will consume CASH
Ah, I may have to correct that. Dividends do.
1) When we talk about deferred tax liability and its nature ,in our model as it is non-current in nature so do we have to consider the same in working capital adjustment\’s or we can consider it separately if it is non-current but if it is current we can take it in Working capital?
2)When we talk about CFO and its structure we know it is as PAT + non cash,non operating adjustments+working cap adjustments,so is that all the activities which are operating in nature we have to further classify it in these three sub categories only?
3)Interest paid/Interest received is further considered as financing activity, however it is been deducted in P&L,so do we have to again make adjustments in operating activities and by adding it there and deducting it from financing activity (for interest paid) or it would further depend on the way company has reported and prepared the cash flow as per Ind As 7?
4)We use B/S and Income to derive the cash flow,while doing so as we required data of 1 year only because of which for balance sheet figures we minus it as the data is accumulated in nature ,whereas for P&L as it is already 1 year data we consider the data as it is.
Guide for the same.
Thanks in Advance.
1) Consider it separately. It should not impact WC as the company would have provisioned for this.
2) No need for further classification.
3) Depends on how the company has declared. I\’d suggest you understand where interest is coming in and going out from, this is the key. You can check the associated notes for more calrity
4) Not sure if I fully understand this query.
Sir,
My net cash balance figures are way too far from the original figures in the balance sheet. don\’t know where I have mistaken.
Ah, you will have to start looking at each line item and inspecting where you could have gone wrong.
Sir, why is it so?
Hi Sir,
In the line items there is no gross block and depreciation in the image you have shown where you have identify each line items in Cash flow activity, do we not have to consider gross block
Ah no, these line items wont come here.
Karthik,
Have a suggestion/question regarding the Balance sheet/P&L sheet and cash flow sheet
i am not from finance background , post Varsity reading I can now decipher these statement to certain extent ( thanks to you again)
question : don\’t we have the regulation to publish the data in standard format for these financial statement , at least same sector companies
problem statement : the \”integrated financial model is a great learning to connect the dots\” however it is really a time-consuming
process and it takes days to get to one company at least for me
i don\’t know the regulation , but i am speaking loud here
cant we have a standard format of Balance sheet for all companies at least in same sector to have all the line item listed and
if the company does not use that let use \”NA\” or \”0\” value
connecting the dots: once we have this data we can use the API and populate the csv/excel sheet and should be ready to review
i could not find any service vendor who provides data for the Indian stock market
Yahoo finance does for a certain extent , but again we need to have the standard format mandated or yahoo finance should
webscrap or read \”annual statement\” and populate the date in the format where customer can consume
Idea : can we have Zerodha or any partner of Zerodha have a look into this
there is one website which is doing and not for indian stock is
example of the Data
https://eodhistoricaldata.com/api/fundamentals/AAPL.US?api_token=demo
copy and paste the data from the above URL and use formatter to read the data
https://jsonformatter.curiousconcept.com/#
Madhu, so the exchanges now mandate the companies to file their reports (quarterly, annual) in XRBL format. Check this – https://www.bseindia.com/static/about/xbrl_info.aspx
Hello sir, isn\’t loans and advances part of cash flow from investing activities?
No, investing activity is more of investments in fixed assets and intangible assets.
Thank you for the efforts !
Would have better if there is an additional chapter on how to do valuation based on financial model. Ithink that was the objective of doing this modeling.
Of course, will be adding soon. Mostly like the next chapter will be up today.
There are some times when company report closing and opening figure in difference. I have read in so many reports, it is sometimes due to amortisation, sometimes change in reporting and other reasons. What to do in such cases.
Could be due to numbers getting restated.
Thank you, Karthik for your advice, but I want to know how did you learn all this. explain your journey, please.
Its been a non stop journey with learnings everyday, guess it never stops 🙂
Karthik Rangappa please read it and reply
I m a self-thought trader. I have read almost all your modules. I m an 18-year-old with more than 16 lakhs of capital and I m an equity and futures trader, I have just invested 14 lakhs in stocks but now I want to pledge it and start option selling. I know all the theories of option selling but I want someone to mentor me. could you please help me how can I find someone to mentor me?
And how to connect with other professional traders.
Hi Aksah, that\’s a great start. My advice, be ultra-careful with the money, all it takes is a few minutes for it to disappear. So keep that in the back of your mind. About the mentor, I really don\’t know who does that. I guess you will have to look around, but then, be really careful of whom you choose as a mentor 🙂
Almost one year has past to this module, still the work is under process. Feeling like Sarkari Scheme thats free but will take its time,😎
Will complete it soon, Sourabh.
Eagerly waiting for the next article of this module.
Will try and put this up soon.
When will this particular course be over?? Kind request to finish this asap as it has stretched too long.
Soon, Gaurav.
Downloading of this module is not available…
Please wait for the module to be completed.
Hi
I was scrolling through this particular module ( Module 13) and was trying to download the pdf format of the same just like other modules but couldn\’t find any PDF download option
Can you please help?
Rgds
SB
We will put up the PDF once the module is complete. This module is still work in progress.
Hello sir, when do you expect to publish the next chapter
Sometime early next month, Anurag.
Is the course complete or more chapters are left
At least another 2-3 chapters more.
sir cost to employee services is not financing activity it is operating activity…
Thats right. Let me check if I missed that.
my cashflow figures are way too far from the original figures in the balance sheet
Net cash flow or the cash flow from activities? If net cash flow, then check the individual activities again.
so should it be treated same as employee benefit expense
Yes, you can.
is \”past service cost of employee benefit expense\” is the same as the \”employee benefit expense\”
Yes, similar in nature.
in the operating activities the deferred tax liabilities are being taken under the current liabilities or the under the non current liabilities.
the company which I have taken don\’t have deferred tax liabilities for under current liabilities instead they have income tax liabilities.
so if its of current liabilities then should I take income tax liabilities instead of deferred tax liabilities or just discard it
Its under current liabilities. Yes, treat the income tax liabilities the same way as current tax liabilities.
Link to download excel sheet is not available at the end of article.
Updated. Please check again.