
9.1 – Dealing with debt
We dealt with fixed assets in the previous chapter. The fixed assets, as you realize, is the most oversized line item on the asset side of the balance sheet. In this chapter, we will deal with the debt, which is present on the liabilities side of the balance sheet.
We will use the base rule again to help us deal with debt.
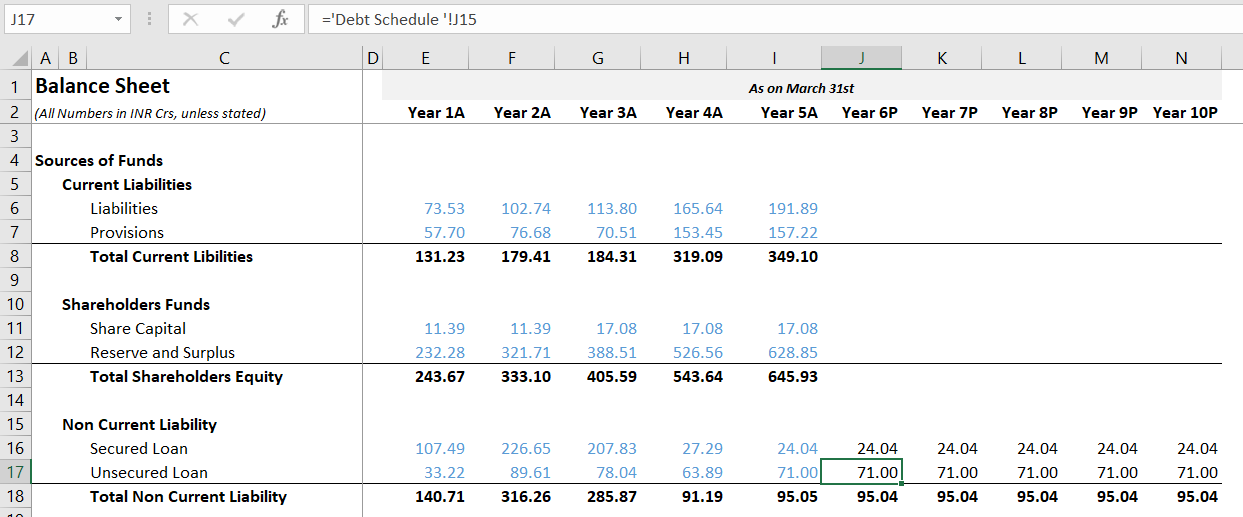
If you glance over the balance sheet, on the liabilities side, you’ll see the debt figures –
There are three things to note here –
-
- The debt numbers are ‘non-current, in nature. This means these are long-standing debt, carried across multiple years
- Secured loan – loan against collateral (mainly in the form of tradable securities)
- Unsecured loan – Non-collateralized loan.
Generally speaking, an unsecured loan comes at a higher rate. In our model, we have secured and unsecured loans stated separately, but this may not always be the case.
To give you a perspective, I’ve picked the balance sheet of Relaxo Footwear here to highlight the borrowings –
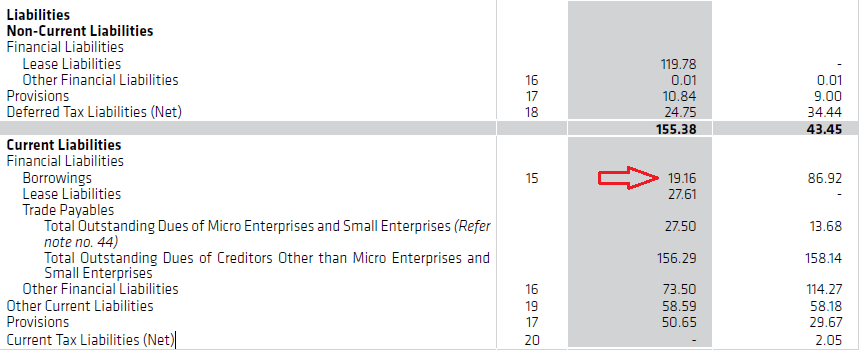
The borrowing is under current liability, which means the borrowing is short term in nature. As you can see, the company generalizes the ‘borrowing’ and does not specify if it’s secured or unsecured. To figure the nature of borrowing, you can dig deeper into the associated notes; note 15 in this case.

The notes specify that there is no non-current borrowing. But if you notice, there was a non-current, secured loan in 2019, which is repaid.
For FY 2020, the current loan outstanding (Rs.19.16 Crs) is secure. Further, we can also see the securities tendered for securing the loan.
Take another example –

We have the balance sheet of Biocon Limited for March 2021. The company has borrowings under both current and non-current liabilities side. Note that the company does not give any details of the nature of these borrowings in the balance sheet. Instead, the associated notes give us all the details.
Here is the snapshot of Note 14, giving the details of the borrowings under the non-current liability side –
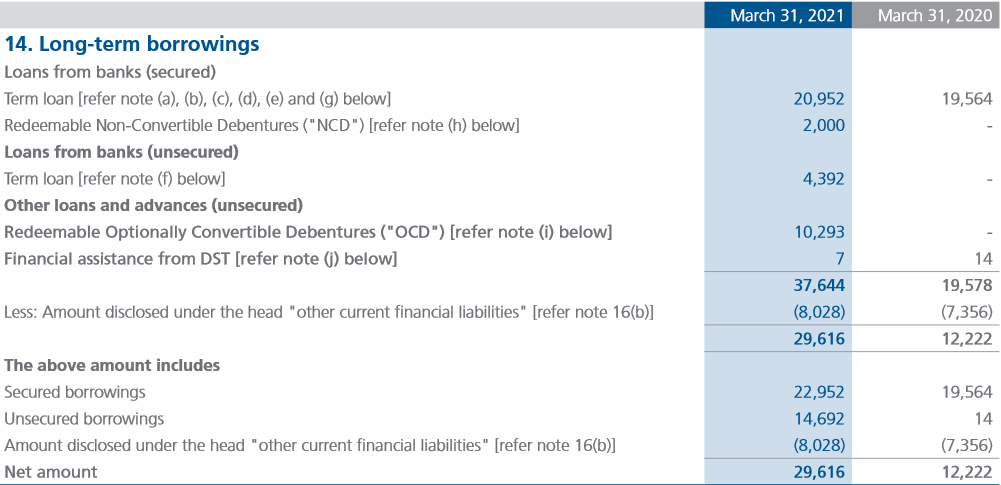
The borrowing is both secured and unsecured.
The details of the current liability borrowings are as follows –
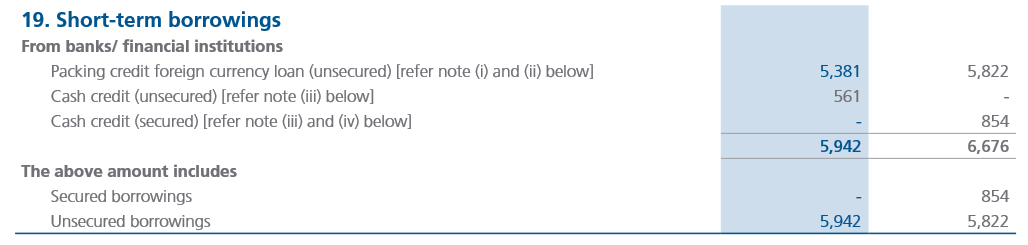
Now, as long as you get the split of the loans, you can build a debt schedule using the technique we will discuss in this chapter.
9.2 – Sheet setup
We will set up a sheet similar to the asset schedule. I suppose you are pretty familiar with how to go about setting up the sheet –

We follow the usual format protocol here, i.e., index columns A & B, expand column C, freeze panes, and link Y1 to Y10 from cell E to N. I hope you are comfortable with the base rule to deal with the opening and closing balance figures. Else, I’d suggest you go through the previous chapters to figure how.
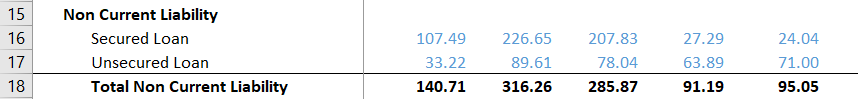
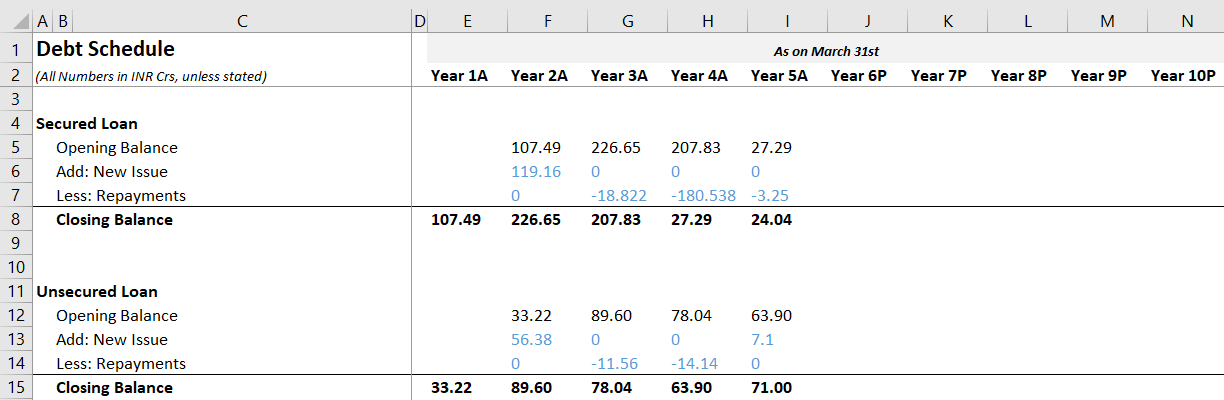
As you can see below, I’ve set up the base rule for both secured and unsecured loans.

In cell E8, I’ve linked the secured loan value of Year 1 to denote the closing balance for Y1. As per the base rule, the closing balance of Y1 works as the opening balance of Y2.
For Y2, the closing balance of the secured loan is Rs.226.65 Crs, clearly suggesting that the company has new loan issues to the extent of Rs.119.16Crs.
Further, in Y3, we see that the closing balance for the secured loan is Rs.207.83Crs, which implies that the company has repaid a portion of the loan.
You can extend the same for all the years for secured and unsecured loans and build the sheet. Here is how my sheet looks now –
The next bit is the projection of how the future year new issues and repayments will look like. The best way to estimate this is by understanding the management’s CAPEX plans. If the management has ambitious CAPEX plans, I think it’s fair to project the debt, keeping the management’s guidelines in perspective.
I’d like you to watch this video clip, where the CMD of HPCL talks about CPAEX plans and the means to fund the CAPEX –
https://www.youtube.com/watch?v=HiCybI9sjEY
The CMD also states figures to indicate the amount via debt. The point here is that when you have to project the new issue and repayment figures, always look for what the management has to say. You can find this information by skimming through the annual reports, analysts conference call transcripts, management interviews etc.
If none of that is available, then you will have to project based on the previous trend. The trend in our model is easy to establish. In the years Y1 and Y2, the company had a large outstanding loan, which over time has reduced.
 The company availed no new fresh issues, and we can also see that the company has repaid the loan. We can expect a similar trend to continue and project for the future years. To do that –
-
- Keep new issue at zero
- Calculate the average repayment
If the above technique does not fit well with your approach, let the debt remain. The worst that will happen with some debt on the book is that our final valuation may turn out a bit conservative, which is not a bad outcome, in my opinion.
I’ll keep the debt as is in this model and complete the secured and unsecured loan.

Please look at the schedule at this point. There is an opening balance and a closing balance, and then there is secured and unsecured debt. If I were to estimate the company’s debt position, how can I do that? Should I consider the opening balance as on 31st March or the opening balance on 1st April?
To address this, we can take the average across the opening and closing balance of both secured and unsecured debt and get the average loan outstanding.
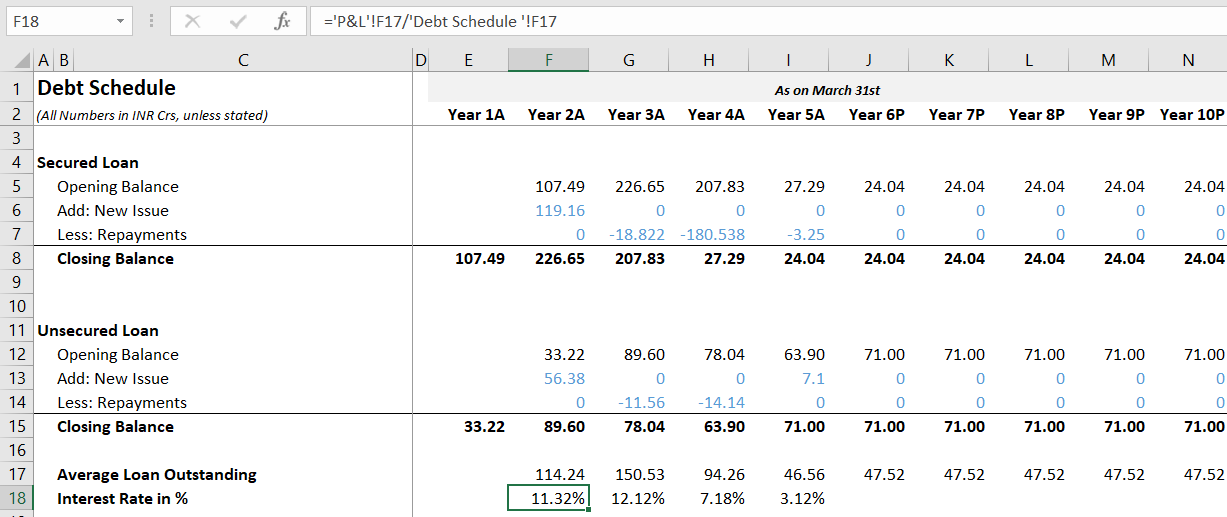
Next, from the P&L, we know the interest expense for the year. By dividing the interest expense over the average outstanding loan, we get the interest rate applicable to the company. I’ve executed both these steps on excel, and here is how my sheet looks now –
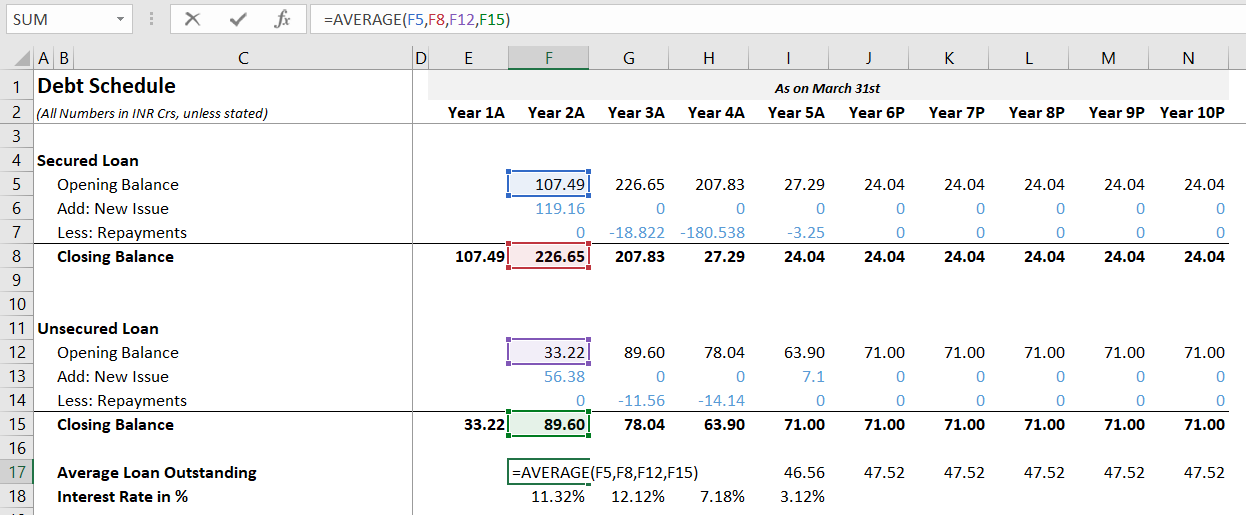
As you can see, I’ve calculated the average of the opening and closing balance across both secured and unsecured loans.
I’ve divided the interest expense stated in P&L over the average outstanding loan for the interest rate.
Now that we have the applicable interest rate, we can project the future year interest rates by taking an average.
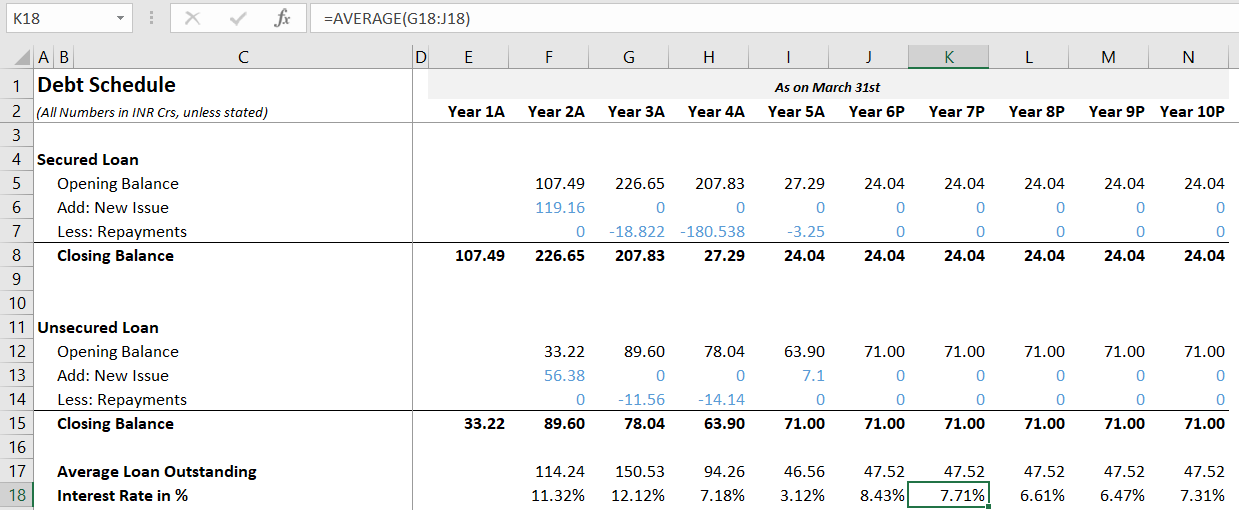
At this point, we have the average interest applicable, plus we have the average loan outstanding, with we can project the future year’s interest expense as well. All we have to do is multiply the interest rate with the average loan outstanding.
We can do this directly in the P&L.
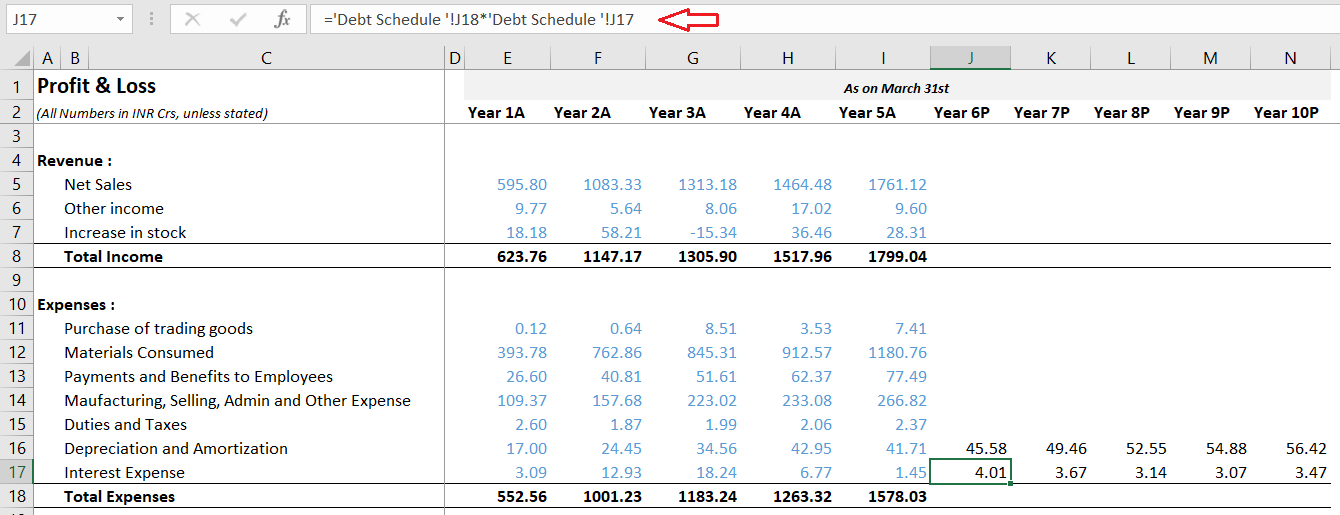
Note the numbers from the debt schedule are flowing into the P&L, and with that, we have made the 2nd P&L projection.
We can pull the numbers from the debt schedule to complete the non-current liabilities on the balance sheet.
You can download the excel sheet used in this chapter here. In the next chapter, we will look at the reserves schedule.
Key takeaways from this chapter
-
-
- Debt can be secured or unsecured
- The balance sheet gives us the overall debt; associated notes give us the split between secured and unsecured loan
- We can calculate the average of opening and closing balance across secured and unsecured loans to get the average loan
- The best way to project debt is by understanding the management’s view on CAPEX
- If there is no management guideline, its best to keep debt at the same level
-
Hi Karthik,
In the example mentioned, since we started with a closing balance of 107.49, that becomes the opening balance of the next year, the closing balance of that year is 226.65, so we added a new debt of 119.16, and since the closing balance of year 3 is 207.83 we assumed that there is a repayment of -18.822. While this method of calculating repayments and additions is fine, will these numbers exactly match the additions and repayments in the cash flow statement of the company
Regards,
Achyuta
It should, you can also cross check managements commentary to validate this.
Thanks Karthik, yes once we look at management comments in the notes the reason for the difference might become clear but I think the formula “ending balance = opening balance + new debt – repayment” might not always work mathematically as there are reasons such as non-cash adjustments, long-term debt moving to current liability, amortization of debt discounts, due to which the numbers in the balance sheet and cash flow statement might not tally exactly, what do modelers in real life do for such scenarios, do they include a line item such as non-cash adjustments or miscellaneous adjustments?
In fact even in the PP&E calculation, I see that “Ending = Beginning+New Capex-Depreciation” might not always tally, when I investigated I came to understand that it is because of some non-cash transactions which happen
Please confirm if my understanding is correct
So its –
Ending balance + debt adjustments = closing balance.
Debt adjustments = New debt – debt repayment +(-) other adjustments.
This should help, especially when you build a schedule.
Quick question\’s:
1) Why can\’t I directly add the unsecured loan and secured loan closing balances to get the total loan outstanding of that year, what is the need to take average. Can you explain in detail. Still not clear.
2) We discussed that to forecast the current year\’s addition in loans and repayment we can analyze CapEx and management\’s guidance on how they would be sourcing the same. Can we take this as a % of CapEx (Addition on loan in current year/CapEx) and model the same accordingly?
1) This is to get a quick sense of how the loan and debt situation is moving, gives you a perspective.
2) Yes, but ensure the % gives a trend to base your model on. If the numbers are volatile, then thats a problem.
Hi sir, I have doubt in taking average in interest rate of average debt (expected). if all the year have same debt, then why we took average? can I took a interest rate which is common for all the expected years.
please reply sir
Then the average does not really help 🙂
Oh okay sir I understand now when i approached to notes to account I saw that Finance Cost was seperated into two segments.
1.Cash Credits and overdraft (main interest on borrowing)
2.Depost from dealers and contractors and other
Again when i calculated {(Cash credit and overdraft)Finance Cost/ avg. loan outstanding} I got % like these 11%,5%,1.5% ,5% like this sometimes kinda too small so is it okay to comes a % like this or still a problem..:(
Do check my previous comment on this 🙂
when i calculated Average Loan Outstanding and then divided by Finance Cost its is coming around 30-35% and it seems kind of odd please tell is it okay to comes %ages like this. ??
Hmm, yeah, does not seem right. Please double-check the numbers. Also, in the director\’s report, if they have mentioned this rate, then take that directly, there is no need to set up a schedule.
Sir my questions is …
In your model you have secured and unsecured debt in non-current liability section (Does that secured and usecured loan include both current and non current borrowing)..
In my Model maruti has both non current and current borrowing but only unsecured as mentioned in notes to account.
Hence i did not made the secured loan part instead i made the Unsecured loan bifurcation for both current and non current borrowing. (is it okay or i need to show secured part too (putting 0 in figures)..
and sir i know that maruti will do capex in future but cant able to find that (will they take debt how much and what) (currently trying to find)
and if not able to find how can i forecast it.(currently maruti has paid its all non current borrowing and current borrowing is as low as 331 million something…
That\’s okay; if a line item is not mentioned, it means that it is not relevant to the company. Of course, there is no need to include it in the schedule as well. About Capex, please check my previous comments.
Karthik,
I didn\’t understand the meaning in taking the average of opening and closing balances from your explanation below
\’There is an opening balance and a closing balance, and then there is secured and unsecured debt. If I were to estimate the company’s debt position, how can I do that? Should I consider the opening balance as on 31st March or the opening balance on 1st April?\’
Could Average of the Secured and Unsecured Loan have been a right option too?
Do you have an example to explain the intention behind including the opening and closing balances also in the average?
This is to ensure we factor in any new debt that has come in during the financial year or debt repayment that is done.
Hi Karthik,
I am working on projections of debt for a listed company for which Capex details/investor ppts/quarterly presentations are not available. This company has availed debt every year i.e. every year there has been a debt raise and there are repayments every year. In such a scenario, how should the debt be projected?
You will have to look at trends of new loan and repayments. Also, maybe look for management interviews?
Hii Karthik,
As Relaxo does not have any non-current Borrowings then we would not be creating a Debt Schedule for this Company. Right?
Also, the lease liabilities in the noncurrent section have big values so do we need to treat them under a different asset? or can it be dealt with in the Assumption? If yes how would we deal it in a different schedule?
Moreover, there are current borrowings as well as Trade Payables and Lease Liabilities. Can you guide how can we deal with these items? Do we need a Schedule or can it be dealt with within the assumptions?
If the long term debt component is not there, then perhaps its ok to treat it in assumptions instead of building a full fledged schedule. Yes, maybe you can treat the lease liability separately, and even the trade paybale.
5. Can you please confirm how can we project the finance cost?
So in your example, we have projected Interest expense as it was one of the line items in the BS.
But the company that I have selected, has finance cost as a line item which consists of Interest cost and Lease Liabilities.
I\’ve taken Finance cost from P&L. So its ok, you can club all charges and consider it as a single line item.
Hii Karthik
The company I have selected has both Current borrowings and non-Current Borrowings.
1. How would I project the Current Borrowings in the BS.
2. In P&L, finance cost is given and under notes of it, only interest expense is mentioned. But this interest expense consists of both the Current and non-current borrowings. So while calculating the Interest%, will it be okay to select this directly?
3. The interest% which I calculated on the above finance cost for Current borrowings is having a very large number. (15.20%, 42.88%, 33.75%, 32.21%) Can these numbers be valid or am I making any mistake?
I have currently selected the closing balance of both Secured and unsecured loans as while doing the average the % was around 85%.
4. The company is continuously having new issues with Secured loans. So can we take an average and project future loans? The company has a plan for increasing CAPEX.
1) For this you need to understand what the management says about borrowings. Based on that you can either increase or taper down. But the management view on capex and how they will fund it (debt or EQ), is important.
2) Yes. We are anyway looking at overall finance cost.
3) Anything upwards of 10-12% needs to be looked at again. Its unlikely to be that high.
4) Yes, you can. There could be a trend here.
Thank you, MR.Karthik for the wonderful study material,
my questions are as follows:
1) should we add both the current and non-current loan to find the average outstanding loan or should we calculate each separately
If you want the overall idea of the total outstanding loan, then you can avg out. Else if the current loan is relatively small, you can consider just the long term loan.
First of all, thanks for bringing such complicated topics like Financial Modelling in such a simple structured way!
Can you explain why you averaged secured and unsecured loans together…Isn\’t total outstanding loan supposed to be a sum of secured + unsecured loans rather than their average?
Average of opening and closing loan is understandable but secured and unsecured loans should be added to get the total loan…right?
The idea is to get the rough interest or financial charges obligation to the company. Hence the avg out. Also, the company through the year would repay some loan, receive tranches of debt etc, so averaging helps us get a perspective.
Finding Debt of a company is a bit non-straightforward? There is no separate line item in balance sheet which is debt per se…
Also, not all companies mention debt as secured and non secured loans. Can you give a bit more clarity as to how to calculate the debt on a company? Are lease liabilities and Trade payables also debt?
Yeah, the debt is combined into single line item on balance sheet, which has both secured and unsecured. of course, the bifurcation of current and non-current still exists.
Only what is classified as debt is debt, rest are not. You should check the associated schedule as well for better clarity on the nature of borrowing.
Why have you ignored current liability here?
Debt schedule is mainly for non current liabilities. Current liabilities is considered in the assumption sheet.
I am very grateful to you sir for these hard works to educate us in finance.
Happy learning, Ujjal!
Sir, have u checked ITC…u said you will check that sir…
Whole conversation we had,
Sir, I have tried to calculate values of ITC…But I’m not getting the cash flow statement’s Net cash Balance = Cash balance stated in B.S… I have tried to identify the mistake it comes up that I had been doing mistake in debt schedule…so my question is ,” Secured and Unsecured Loans is on non-current liability side in Balance sheet you gave…weather we have to consider Non-Current Borrowings alone for secured and Unsecured or we have to also take up Current Borrowings for this matter ???”, Please do Clarify my doubt sir…Thanks in advance
Reply
Karthik Rangappa says:
July 7, 2023 at 10:44 am
Usually, non current is what you need to consider, Siva. Current items in BS is settled within a year and do not have a long-term impact on valuation.
Reply
Siva says:
July 9, 2023 at 8:03 am
Sir, is it must to balance the cash flow and cash equivalent in B.S
Reply
Karthik Rangappa says:
July 9, 2023 at 8:30 am
Ok. Checking.
Reply
Siva, in the case of ITC, these current borrowings might constitute a significant portion. Maybe consider it once and check if the numbers match?
Hi Karthik,
Any updates on the previous comment ?
Re-posting for your reference –
I had a question regarding the average debt,
The formula you used is doing the average of the opening and closing of both the secured and unsecured loans it is summing all the figures and dividing by 4 i.e.
((opening of secured + closing of secured + opening of unsecured + closing of secured) / 4 )
shouldn’t it be this though –
( ((opening of secured + closing of secured) / 2 ) + ((opening of unsecured + closing of secured) / 2) )
The average debt value is essentially coming half of the closing or opening in the formula you used, that’s why the interest rate is coming so high.
Thank you !!
Karan, but if you do this, you will get two separate interest rate. That might be an issue. But I do get your point, will look into this again.
Sir, is it must to balance the cash flow and cash equivalent in B.S
Ok. Checking.
Sir, I have tried to calculate values of ITC…But I\’m not getting the cash flow statement\’s Net cash Balance = Cash balance stated in B.S… I have tried to identify the mistake it comes up that I had been doing mistake in debt schedule…so my question is ,\” Secured and Unsecured Loans is on non-current liability side in Balance sheet you gave…weather we have to consider Non-Current Borrowings alone for secured and Unsecured or we have to also take up Current Borrowings for this matter ???\”, Please do Clarify my doubt sir…Thanks in advance
Usually, non current is what you need to consider, Siva. Current items in BS is settled within a year and do not have a long-term impact on valuation.
Hi Karthik,
I had a question regarding the average debt,
The formula you used is doing the average of the opening and closing of both the secured and unsecured loans it is summing all the figures and dividing by 4 i.e.
((opening of secured + closing of secured + opening of unsecured + closing of secured) / 4 )
shouldn\’t it be this though –
( ((opening of secured + closing of secured) / 2 ) + ((opening of unsecured + closing of secured) / 2) )
The average debt value is essentially coming half of the closing or opening in the formula you used, that\’s why the interest rate is coming so high.
Thank you for your hard work !!
Karan, that makes sense. Checking this again.
Hello Karthik sir,
In current liabilities, I know I can forecast Trade payables based of calculating no. of days of payables.
( I\’m working on Voltas ltd ) ( other than trade payables, provision & borrowings, I have considered everything as \”other current liabilities\”).
For, Short term provision & other current liabilities, I\’ll use % of gross block method. My question is How can I forecast short term borrowings?
Look at the associated notes of short-term borrowings and see if you can model (build a schedule) for this on a line-by-line basis. Simple growth assumption also works.
Sir, There is a minor mistake just above where you provided the Youtube video link. You accidentally typed CPAEX instead of CAPEX. Beside this stupid mistake, You are helping me a lot sir.😊
Ah, sorry about that. Let me check 🙂
Thanks Karthik…But if the interest rates are mentioned in the Annual Report,which one can be used-the one mentioned in AR or by dividing Interest and the average loan amount
If you go by whats stated in AR, your interest expense calculation on P&L gets messed up. Also, the interest rate mentioned in AR is the actual interest..but what if the interest payment is delayed by a day or two? That attracts additional interest in the form of penal interest?
Hi Karthik,
1. For the year 2017(Relaxo),the \”interest Expense\” is mentioned as \”14.55\” and the \”Average Loan Outstanding\” is calculated as \”85.33\”,the\” Interest Rate in % \” comes as 17.05% (which is against the interest Expense (8-10%) which is mentioned in Annual Report).
2. In the module ,it is stated as
\”If I were to estimate the company’s debt position, how can I do that? Should I consider the opening balance as on 31st March or the opening balance on 1st April?\”
Is there any possibility of mentioning both \”the opening balance as on 31st March\” and \”the opening balance on 1st April\”
1) I understand, but this method of calculating interest expense is an aggregate method across different borrowings
2) The base rule should give you this right?
Sir, should lease liability (current and non-current) be clubbed with borrowings? If yes, then while preparing the debt schedule is it correct to consider lease liability as a separate head? also while calculating the interest% should lease liability be included?
thanks
Yes, you can include the lease within the borrowing schedule.
is taking the rolling average a good approach i mean if the values have decent volatility isnt it just making a safe best of the range of the prediction? our prediction could be far away from the actual value in this case. is there a better method to apply?
Rolling avg works best when there is consistency. In fact, any method you choose should result in consistent output. You can try the percentage method as well.
Yes, correct, so the total borrowing which I got from the debt schedule, I have to plough back in both current and non – current liabilities borrowings, right?
No, that will be a double entry right? You only need go plough back to total borrowing.
No Sir, In my case short term borrowing and long term borrowing both has mention in my B/S.
So they would come under different headers – current and non-current liabilities.
Sir,
so after adding both secured and unsecured loans , I can plough the same total borrowing amt. in both long term borrowings and short term borrowing of my b/s, becoz i have both long term and short term loan in my b/s . please suggest.
That\’s right, in the Balance sheet, it is reported as a single line item, I guess, as total borrowing.
Hi Sir,
As stated in above explanation, in your b/s examples, secured loan and unsecured loan mention separately, so you could able to get the number plough from the debt schedule to b/s.
However, the b/s i am working on it has mention borrowings (which has not be define as secured or unsecured) in b/s , though with the help of the associated notes, i could able to get the details and make the schedule, but now my question is how can i plough the number for borrowings from schedule to b/s for future projection?
Yeah, so the balance sheet notes will give you the split up between secured and unsecured. YOu will have to use this to build schedule, and in the schedule, add up both secured and unsecured debt and link it back to borrowings in balance sheet.
Hi Sir,
So, as you mention that the company is debt free, so is it required to create a separate debt schedule?
No, if there is no debt, then there is no need to create a debt schedule.
Sir, then in this case , it is required to create a separate debt schedule , as you shown in your examples.
Yes, thats right.
Hi Sir,
Have some doubts, please suggest.
The example you have given for B/S – In Non current Liabilities it has only Secured and Unsecured Loan, So, you have showed us the projection for these two.
However, the company in which I am working on , in B/S – In Non current liabilities section it has other items also, along with borrowings like
Non Current Liabilities section
Deferred tax liabilities (net)
Other long-term liabilities
Long-term provisions
And for Current Liabilities section
Trade payables
Other current liabilities
Short-term provisions
Though, for Deferred tax liability we have created an assumption, so again we have to make a separate schedule to project in the balance sheet, If yes, then how we have to make a projection & Why?, or else can we simply plough the numbers from assumption sheet and project it over Deferred tax liability section.
Also, how we are going to treat separately \”Other long-term liabilities Long-term provisions, Trade payables, Other current liabilities, Short-term provisions\”, etc Can you please show some examples how we can do the projection of these line items in B/S.
Please suggest.
Sonal, no need to create a separate schedule for deferred tax. You can make assumptions for the rest as well. For trade payable, the assumption is similar to the inventory number of days.
Hi Sir,
The company I am working on there is no Interest expenses in the expenses side of P&L statement, It has other expenses.
So, can we consider other expenses as Interest expenses, to calculate the Interest rate %. Please suggest.
No, interest expense is against debt. So your company must be debt free.
Hi Sir,
In above, you have shared one example of B/S of \”Biocon Ltd\”, in that B/S it has both Long term and Short term loans and has the secured and unsecured loans for both, so while projecting loans we have to add secured/ unsecured loans of both long term and short term and then we have to project the new issues and repayments. This is how we have to project right?
Yeah, but add up long-term and short-term loans, and treat them separately in the debt schedule.
W.r.t. point 2, in the BS that you have taught us, liabilities & provisions (Current Liabilities) have been treated in assumptions. And Secured and Unsecured Loan (Non Current Liabilities) have been treated under schedule. The former is heavier than the latter. So is this an exception, or have you applied some other criteria?
Treating debt in a schedule is a norm, because, in most cases debt is a heavy line item and has an impact on the overall financial strength of the company. Hence I\’ve treated it separately to emphasis this point.
If the finance cost is an aggregate across all borrowing tenures, then can we include loans under Current Liabilities also to calculate average loan outstanding?
Nope, the finance charge is a P&L charge. If you look at the finance charge schedule, you will get the split up. Current and non current loans cant be clubbed under current.
(1.) Then I guess I will skip the raising debt schedule for this one. Since FY 19 onwards there\’s nothing on borrowings under non-current liabilities in the BS. Have checked notes too. Nothing there as well. As for whether the items are heavy or not, the BS that I am dealing with, is a 2,000+ cr BS (asset & liabilities each). Under Non-Current Liabilities, Lease Liabilities are 100+ cr. Provisions ~ 20 cr. And Other Financial Liabilities are much < 1 cr.
And the in the BS that you have taught us, liabilities & provisions under Current Liabilities have already been treated via assumptions, even though these are heavier than Secured and Unsecured Loan which have been treated under schedule.
So what would you suggest for the BS I am processing? Shall I go for schedule for Lease Liabilities & Provisions under Non-Current Liabilities?
(2.) Is there a thumb rule or convention for which item should be processed in schedule, and which should be processed under assumptions?
(3.) Just out of curiosity, does the finance cost mentioned in P&L cover the interest paid on borrowings only under non-current liabilities? Then where do businesses report finance cost for borrowings only under current liabilities?
1) Nitish, so on a 2K Cr book, 20Cr and 1Cr are small numbers and can be managed via assumptions. Btw, if the balance sheet reporting is not consistent, then that will be an issue while building a FM. Also, liabilities and provisions can be current and non-current, so treat them accordingly. Sometimes, the lease liabilities is not straightforward to deal with, so look for consistency in reporting and decide whether to build a schedule or not.
2) I usually look at how big the number is wrt to the overall balance sheet size and decide basis that. You can start with this approach and tweak it as you gain more experience.
3) The finance cost is an aggregate across all borrowing tenures.
So if in the BS, u/s Non-Current Liabilities, apart from Borrowings and Deferred Tax Liabilities there are other items – Lease Liabilities, Other Financial Liabilities & Provisions, then do these other items also find their way to Debt Schedule, or do we have to make another schedule for them?
In this particular case, as detailed in the notes, Other Financial Liabilities are only comprising of retention money, while Provisions are comprising of compensated absences and CSR.
Debt schedule deals with just the borrowings and gets finer insights into the borrowing terms. For all other things included in non-current liabilities, you can set up a new schedule, maybe call it a lease schedule or something, and build a similar one. Otherwise, if these are not heavy and do not warrant a schedule, then maybe deal with it in assumptions?
@varsity i have registered and paid for varsity test this Saturday i.e 10th dec 2022 but i did not receive any links or anything from where i should attempt test.
I got confirmation for payment also on mail.
PLease check your email (spam folder) once. Meanwhile, we will also check from our end.
No worries dear 🙂
Thank you Karthik. I shall certainly try what you suggested. Would it be ok if I mailed you the file to just check of my modeling is ok on this particular aspect?
That will be hard Nitish, sorry about that.
Hi Karthik,
First of all kindly accept my gratitude for writing this and other wonderful modules. This one especially because it connects a lot of what we learned in earlier modules. In fact when I started reading this module, I was happy that you started with Relaxo, since this is the company I started analysing right at the time I landed on this module. However chapter 4 onwards you have picked up a different company. That is alright. Here are some Qs, which if you can guide me on, will help very much.
Questions 1 to 3 stem from the fact that you have structured BS a little differently. And since I am studying financial statements for the first time, these questions :-).
1.) In your format Current Liabilities (CL) have only liabilities & provisions under them. Most BS have the following listed under CL:
a.) Financial Liabilities – FL
b.) Other Current Liabilities – OCL
c.) Provisions
d.) Current Tax Liabilities (Net) – CTL
Shall we club FL, OCL & CTL under Liabilities only?
2.) In your format Non-Current Liabilities (NCL) have Secured Loan, Unsecured Loan and Deferred Tax Liability. Most BS have the following
a.) Financial Liabilities – FL
b.) Provisions
d.) Deferred Tax Liabilities – DTL
Within FL, we have borrowings, lease liabilities (LL) and other financial liabilities (OFL). Borrowings have secured and unsecured loans. So how should we process LL and OFL? Should we list them as separate line items or club them with another item – which item would that be?
3.) In your format Fixed Assets have Net Block (GB-Depreciation), CWIP & Investments. Most BS have:
a.) Net Block items (CWIP is mentioned along with them).
b.) Financial Assets consisting of Investments, Loans and Other Financial Assets (OFA).
c.) Other Non-Current Assets (ONCA).
How do we treat Loans, OFA & ONCA?
4.) As far as Unsecured and Secured loans go, you have mentioned that we have to consider only of the non-current type. Curiously FY16 onwards Relaxo added no fresh Unsecured loan. It also did not add any secured loan FY20 onwards. How do we tackle this? Without a figure, you can imagine #DIV/0! in a lot of cells.
Nithin, for 1 to 3, if the BS you are studying is giving you the split up of line items consistently for the last 5 years, then do consider it. Having more line items gives you better control over the model as the model\’s granularity improves. So my suggestion don\’t club these items, use it as it.
For the #div/0! error, look for a better alternative, but ensure the results of the alternatives in consistent.
Hello Sir,
The average outstanding calculation formula should be average of secured opening ,secured closing plus average of unsecured opening, closing I guess . Because I was trying to workout debt schedule for Ganesha ecosphere interest rate is working out to 35% with the excel formula .Please correct me if I’m wrong.
Yes, have a made a mistake anywhere?
How can we treat the closing balance as an Opening balance in debt, if it is short-term borrowing which usually has the maturity of 6- 12 months? I\’m confused because the firm might have borrowed a completely new loan post repayment of the previous one.
Akshay, the repayments and new additions are treated separately right? That\’s also incorporated in the schedule.
Hi Karthik, firstly thanks for building this module. It has been a super awesome journey to learn from you these practical skills, which no book can teach.
Coming to my question, I don\’t understand the logic of averaging the debt of opening and closing balance for finding the debt position of company in a given period. Why don\’t we just take the average of the closing balance? It would be great if you can please elaborate on the same.
Thanks Sagar. FOr a company with a lot of debt, there will be an opening balance, they would have repaid a but, borrowed more (new addition during the year)..so it\’s very difficult to get a sense of the actual debt outstanding. Hence we average to get a sense of their debt position.
Excellent effort by Zerodha team but I like to read in pdf format, it is very difficult to stick to laptop for longer duration. Please make pdf of Chapter 12 and 13.
❤️ from Vivek.
We will make the PDF once the module is complete, Vivek.
Thank You Karthik,
I can understand the delay because of your other work commitments.
Also, you would do a great favour to all if you could consolidate all the chapters in one place for everyone to practice in one go.
Thanks and noted.
How long does it take for preparing one chapter and how many chapters are left? Is there anything else I should know(or I should read) apart from fundamental analysis and financial modelling to become a very good investor?
I\’m not sure how many more chapter, maybe another 6-8. Each of these chapters are written by me, sometimes I do get stuck with the flow and my inability to break through the rut causes a delay. Apologies, will try and put up the next chapter soon.
With all respect Sir,
There is rarely any video or blogs on internet that explains intermediate topics like Financial modeling (FREE)……but still everyone wants to publish same beginners level knowledge…and seeing in Varsity, 3 video lecture Module of ALREADY AVAILABLE Introduction, fundamental ,technical analysis topic given PRIORITY more than financial modeling Module makes me feel sad…..Ur content is GOLD but I feel like an idiot opening Varsity everyday for 4 months just to find when next FM chapter will be uploaded and Going Disappointed…..but seeing all other already available topics being further developed.
Hey Priyanka, I was a preoccupied with that project as there were many requests for videos. I will try and upload the next chapter on the Reserves schedule, very very soon.
Hi Karthik,
Can we expect more chapters on this course?
I would like to practice the full worksheet and complete the excel sheet I am currently working on.
Kindly Share your thoughts
Yes, was busy with a few other things. Back to this module now.
Sir, when will the new chapter be uploaded??
In the next 4 or 5 days max.
I got super happy today opening Varsity and seeing chapter 10 but then I saw it was Module no 14…..
Any reason Sir why this Module is taking soooooooo long to finish.
Pls give us all with a new year surprise by releasing all chapter on Jan 1,2022…(what a beautiful start of the year it would be)
Omkar, apologies for that. I\’m caught up with something else, but will try and upload the next chapter very soon.
Hi Sir,
When is the next part coming out ? waiting eagerly.
I know I\’m delaying this quite a bit, I\’m caught up with a few things. Will try and upload it soon.
I have no words to express myself – I am really thankful to team zerodha and specially karthik sir for bringing such valuable content for us, I think these is the best CSR which zerodha do. Once again Thankyou so much for enlightening us – keep the good work going.
Thanks so much for the kind words, Mahir. Happy reading 🙂
Okk, Thankyou sir for your response .
Sure, good luck, Yash!
Thanks for your response Sir,
But I am not able to understand how the Interest will not match in P&L?
Also we are keeping the same amount of debt in terms of secured and unsecured for projected 5 years, therefore may not the interest will remain same for next projected 5 Years.
Keeping the same amount of debt —> this is an assumption Yash. You can get the right inputs from the management, maybe by observing all the management interviews.
Thankyou sir for sharing such great content of Financial Modelling with us. Really helpful.
Here, Sir I am not able to understand the reason of calculating Average Loan amount to calculate Interest amount.. and Interest Rate..
May we not simply Add the secured and unsecured loan amount to get the Total loan amount and divide it with the Interest amount to know the Interest Rate and use this further for our projections?
The average loan gives us a sense of how the overall debt position of the company is. We can do the math you suggested, as long as the result matches the P&L. In some cases, it may not.
so what can be done in this case should I make a projection myself by analysing the past data like how they have been reducing their debt
Yes, there is no other option here.
so how to determine if the current maturities are of secured loan or unsecured loan as the current maturities are deducted after taking the net of secured and unsecured loan
Cant find out unless they specifically state that in the notes. In fact, this is what differentiates a good AR from an average one. Do check Infy\’s AR.
so should I consider current maturities amount for the cal. the secured and unsecured loan
It should be deducted because that amount will be repaid by the company.
and why deferred sales tax is considered under borrowings and if its considered under borrowings why its considered as unsecured loan
This could be an accounting entry, I\’m not sure about the accounting treatment here. Need to get an opinion from a CA.
if we look into the image 4 which you have provided in this ch as examples then in that case the company has taken secured loan and unsecured loan fig. before subtracting current maturities and from the net amount of secured and unsecured loan they have subtracted the current financial liabilities.
so my question is if we take the figures before subtracting the current liabilities then the amount of borrowings will not match the balance sheet and if we take the net amount then how to determine that what amount of current liability was paid for secured or unsecured loan
Shivansh, current maturities means these are debts are getting settled in the current year. So this is the repayment getting done for the year.
Dear Mr. Rangappa,
I\’ve been going through your modules diligently. Since I like to highlight important points while reading, I have downloaded the pdf files and studied them instead of reading them online. However, I recently observed that in many modules you have updated the old links and also included new chapters somewhere which are not updated in the PDF versions. Can you please ensure that the pdf versions are also updated as and when the online modules are also updated?
Thanks a lot in advance.
Soumya, it gets really tough to update PDFs. But will share this as a feedback.
and can debentures and deferred sales tax be considered as unsecured loan
If the loan is raised via debenture then yes.
should I consider subtracting current maturities for calculating secured and unsecured loans or should I take the no.s before subtracting the current maturities
Yes, you should. End of the day, the number should match the balance sheet.
the confusion here is that the company which you are seeing is (Mcdowell holdings) which I have taken is (UNITED SPIRITS- listed by the name MCDowell on NSE) the link to its AY2021 is – https://www.diageoindia.com/PR1346/aws/media/13129/usl-annual-report-2020-21.pdf
please check note 16 in this AY for consolidated balance sheet
Shivansh, its fairly straightforward. This company has repaid debt and now has 147Cr of borrowing on the non-current side. The split of 147 is also clear, you just need to tally the secured and unsecured side. Non-current side the company has a demand loan to the extent of 16K crs.
sometime again? until then what should I do
I\’m referring to this – https://www.mcdowellholdings.co.in/pdf/annual-report-pdf/Annual_Report_2021.pdf
Please check Note 12.
I think there is some confusion note 12 is about cash and cash equivalents the note for borrowings is note 16 in AR 2021
Ok, let me check this sometime again.
the company name is united spirits ltd. (MCDOWELL) and how should I share the pdf of annual report with you
I saw the AR, note 12 just gives the total, its a single line item without much details. YOu will have to add this in the assumption sheet and make projections, separate schedule may not work.
I looked at the notes again they haven\’t given secured and unsecured loan separately instead they have only shown how they arrived at long term borrowings so how should I interpret the details of secured and unsecured loan
Hmm, in that case, you take the total and work with it. If you give me the company name and the annual report, I\’ll try my best to see if I can use that as an example.
there is no such note like that
yes they have mentioned total non-current borrowings so how should I sub-divide it in secured and unsecured loan
Usually, the section below this particular note will have the secured and unsecured bit. Do look for that.
in the notes to borrowings for the company which I have taken the format is given like this
Unsecured loan
Secured loan
Less: Current maturities on non-current borrowings
Less: Current maturities of Deferred Sales tax liability
Less: Interest accrued but not due
Total non-current borrowings
and where the secured loan is written in front of it the total of unsecured which has been calculated above under the unsecured loan has been written
so how do I find that how much is unsecured and secured loan
Shivansh, I think they have mentioned the total non-current borrowings. That should do right?
Thank you for the very informative content on Financial modelling. Awaiting the balance chapters.
Will try and put up the next chapter soon.
Thank you for the reply sir
Good luck, Mayank. Happy learning.
Hi sir, really informative content, I wanted to know will you teach us DCF model for intrinsic calculation
Yes, Mayank. All of this will eventually lead to DCF.
Thanks for your response sir😊
Happy learning, Vishnu 🙂
Firstly,big thanks to you sir for this amazing module. Sir can you tell me how many chapters are remaining in this module?
I cant seem to estimate at this point, Vishnu. Maybe another 8 or so.
sir, I can\’t even express how thankful I am for these modules. I have been following varsity content for 3 years now and to this date and haven\’t found content more relevant and easy-to-understand than this. I really want to thank you for all your efforts and please keep publishing this fantastic work.
Thanks for the kind words, Puneet. I\’m glad you liked all the content here on Varsity 🙂
Why I can\’t download it sir
Thanx for valuable content. One request is to please bring chapter with shorter time gap as the longer gap breaks the flow
I understand Sourabh. I\’ll try my best to do this.