
2.1 – Selecting a company
I never expected such a tremendously positive response for the previous chapter. I’m a bit overwhelmed, and I also get a sense that there are many expectations from this module. I hope I won’t disappoint you all, and this module lives up to its expectation. I’ll give it my best shot to explain what I know about financial modelling.
At this point, I’d like to spend some time to help you understand the kind of companies to pick when building a financial model for the very first time.
A common mistake a newbie financial modeller makes is picking a complicated company to build the first financial model.
When I was trying to learn financial modelling, I picked a company called ‘Hanung Toys’, and as the name suggests, the company made toys!
The company had no other line of business apart from making toys; it had a simple P&L, simple balance sheet, no complicated company structure, no complicated financial structure. If you read the annual report once, you’d get a quick hang of what the company does and the factors that influenced its growth.
I’m so glad that I picked ‘Hanung Toys’ as my first company to model. It was easy to build a model due to the lack of complexities involved.
At the same time, a friend of mine picked Hindalco as his first company to model.

Everything about Hindalco was intimidating – the annual report ran into several pages. The company manufactured Copper and Aluminium, captive power units, complex debt structure, complex financial statements, cyclicality in earnings; commodity prices were dependent on international markets, and whatnot.
Eventually, my friend lost interest to learn financial modelling, and he never really got back to it. So don’t let this happen to you.
Here is a suggestion, please model the same company that we would model in this module. Replicate what we discuss here by yourself and post that you can try to model a company independently.
By the way, just to let you know, an experienced financial modeller would love to model a company like Hindalco for the same reasons I mentioned above😊
Please note that I may not be able to help each one of you with the model you’d build. I’ll attempt to teach you a framework in this module; you will have to build on it. I hope you understand the difficulty of looking at 100’s of different models by the many readers here. It would be impossible for me 😊
So if you are the first-timer, then keep these points in mind –
-
- Pick a company that is simple to understand. For example, don’t straight away pick Reliance Industries. It is complex to model for a first-timer (for an experienced person too)
- Between a manufacturing and service-oriented company, pick manufacturing. It is easier to understand manufacturing concepts, i.e. number of units produced, raw material, inventory, etc. Services can be a bit vague.
- The company should have 1 or 2 products that contribute to the revenue. The higher the number of products, the higher the complexity involved. Think of an FMCG company; they have 100s of products, which means 100s of dependencies, making it tough to model such companies.
- Pick a company that gives out as much information as possible in its annual report. Just to let you know, Infosys is one of the best companies in terms of information provided in the annual report. The more information the company provides, the fewer assumptions you have to make in your model, and that’s good news.
- Ensure the company you pick is consistent in its annual report. Let me explain this. Assume, I pick a company which manufactures and sells mobiles phone. The company operates in India and Sri Lanka. The company states how many units sold in India and Sri Lanka in its first-year annual report. The company also reports the revenue generated in both these countries. In the 2nd year annual report, the company chooses to disclose only the revenue generated from both the countries but decides not to give the data on the number of units sold. This is an inconsistency in reporting, and such inconsistencies make it difficult to move ahead with the model
- Avoid banks, financial services, and NBFCs. They are just too complex and have a ton of regulatory issues. The model we are about to learn may not work for the BFSI sector, so please be aware of that.
Keep these few points in perspective before you pick a company to model. However, as your first model, I hope you will consider my suggestion and replicate the model we use in this module on your own.
Throughout this module, we will have one ‘Main model’ running and few helper models. I want you to understand the context in which I will use these different models –
-
- The main model – In the main model, we will start with a blank excel workbook and build our model step by step. We will pick a company and stay with it throughout.
- Helper model – I’ll probably use 1 or 2 different companies to help different sections of the main model slightly more detailed. The objective of the helper model is to help you understand concepts better.
Think about it as learning how to become a master chef. While the end goal is to create magic with your cooking, but along the way, you also need to practise your knife silks to cut veggies efficiently.
By the way, I’d like to thank my ex-student and now a good friend Vishal Vindoorty, for helping me with this module. Many years ago, I taught him financial modelling and today; he teaches me.
So I guess life has come a full circle 😊
With that in place, let’s start by taking a baby step in this chapter.
2.2 – Reimagine data presentation
Like I mentioned in the previous chapter, the very first step in building a financial model is to refer to the annual report, extract the balance sheet and P&L data and input the same in the excel sheet.
Of course, this is a time-consuming task, but a super important task as the data that you copy from the annual report acts as the key input to the entire model. So please do this task with at most devotion. At any cost, resist your temptation to copy-paste numbers from 3rd party sources.
Different people have a different opinion on how many years of historical data to consider. A common preference is to either take the last seven years or the last five years of data. I belong to the five-year camp.
When I usually discuss the first step of financial modelling, i.e. copy the last five-year historical balance sheet and P&L data from the annual report to an excel sheet, people imagine something like this –

You see above is the usual way people copy the balance sheet data from the AR to their excel sheet. The image below shows how historical P&L gets copied –
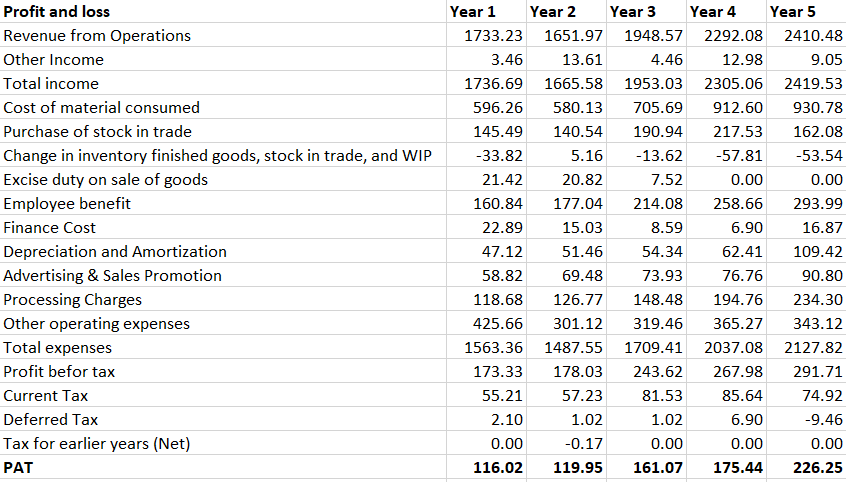
Well, yes, what you see above is technically correct. One has indeed copied the data from the annual report to an excel sheet, but if you do it this way, as shown above, it’s called a ‘model suicide.
The data is presented in a very unsystematic manner. So if you had imagined something like this, then it’s time to let go of that and reimagine how data is presented in a model friendly way.
2.3 – Set up your excel sheet
One has to set up the excel worksheet in a systematic way. The format should be consistent across all the other sheets within the workbook.
Here are a series of steps to follow, even before we start copying the historical data from the annual report. Think of this as a sub-step to step 1.
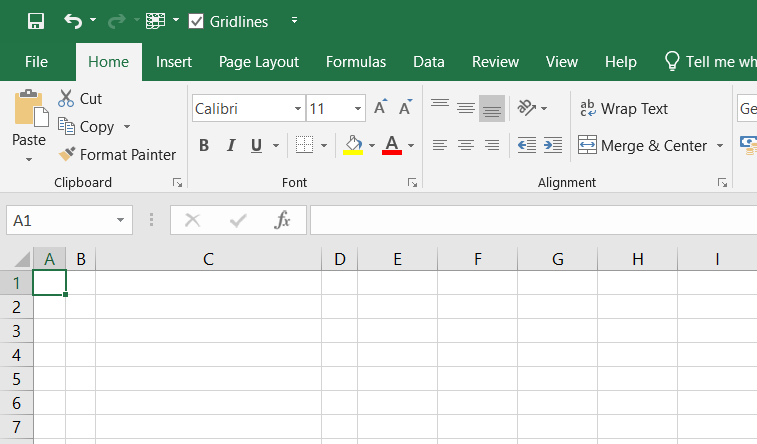
Open a blank excel sheet and save it with whatever name you’d like –
![]()
Index Column A and Columb B, expand Column C, and Index column D. ‘Index’ in this context means just to shrink the column. Here is how my excel looks after indexing the columns –
One of the things I like to do is to get rid of the gridlines in excel. The gridlines in a financial model can be pretty distracting, especially when you have so many numbers and formulas to manage.
So get rid of it if you can. After getting rid of the gridlines, I’d also like to freeze panes by keeping my cursor on cell D3.
Here is how my excel looks now –

I hope you are aware of how to get rid of gridlines and freeze panes. These are basic excel skills. If you are struggling at this point, please stop, maybe refresh your excel skills, and get back to this later.
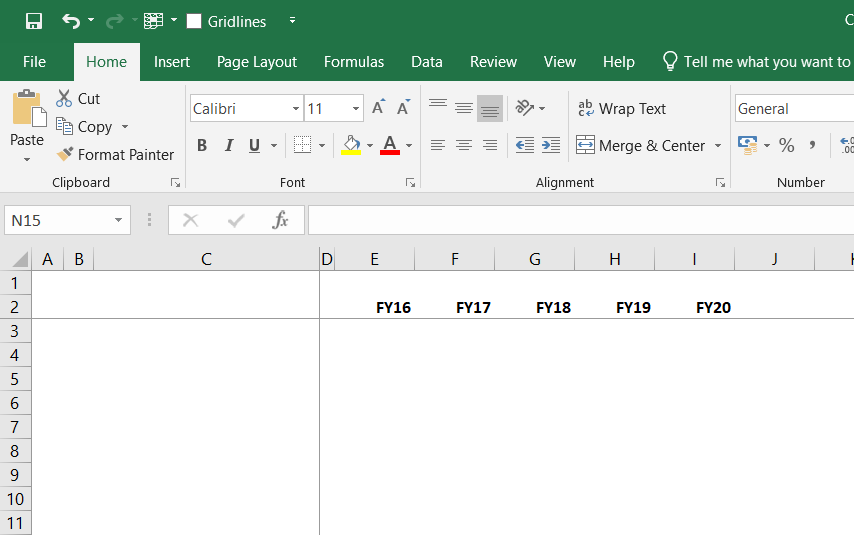
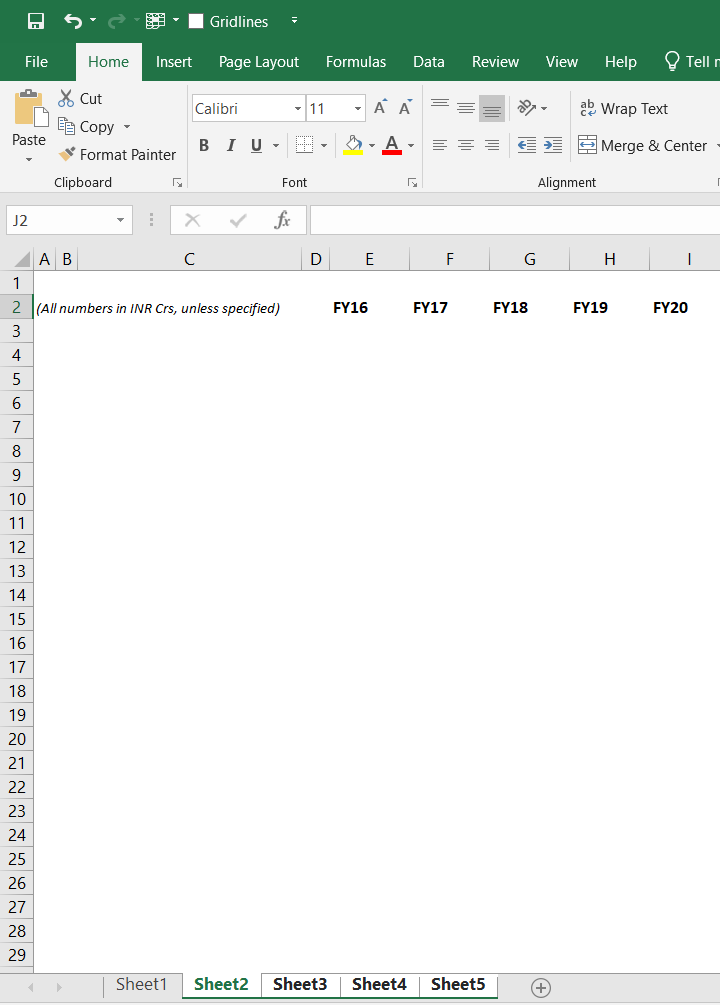
We now enter the years from E2 to I2 to indicate the year’s we are interested in. My excel now looks like this –
We now label this sheet as the P&L statement (in cell A1) as shown below –
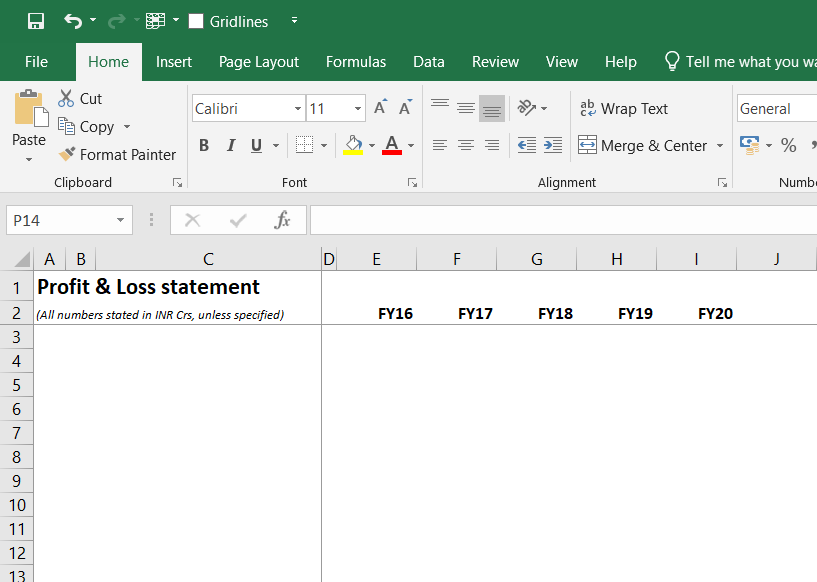
I like to keep ‘Profit and Loss statement’, in bold, font size 14. You can see below the line that I’ve added another line that says that all the numbers stated in this sheet are in INR Crores unless specified.
So if you see a number like 14.2, then it means that the number is 14.2 Crores Rupees and not just 14.2. I’ve italicized the line and reduced the font size to make it look better.
What you see above is a basic skeleton of the model. We need a few similar-looking sheets within the workbook. Remember, we will have other data sheets to include the Balance sheet, assumption sheet, cash flow sheet, etc. So it’s a good practice to set up multiple sheets with similar structure in one shot. You can do this in the following way.
Press the Control button in your system, and click on few sheets. By doing so, you’d be selecting a few sheets in 1 go. When you select multiple sheets, whatever changes you do in one sheet will replicate in the other sheets as well.
Here is how my sheet looks before I press control and select the other sheets.

As you can see, all the sheets except Sheet 1 are selected. I’ve not selected Sheet 1 since the sheet is already set up, and I don’t want to mess with it.
Now, in sheet 2, I do all the above steps that we discussed, except –
-
- Freezing panes, because freeze panes do not work when you have selected multiple steps (or at least I don’t know how to do it)
- Title the sheet (like Profit and Loss statement) because each sheet will be called something different.
After setting up sheet 2 –
Please note, all the sheets continue to be selected. I’ve executed all the steps, except for the ones I mentioned above. Now excel will deselect the selected sheets the moment you click on a different (non selected) sheet. So go ahead and click on Sheet 1 to deselect.
Now check sheet 3,4, and 5. These sheets should look precisely similar to Sheet2. In each sheet, go to cell D3 and free panes.
While at this point I don’t know what I’ll do with Sheet 3, 4, and 5, I do know that Sheet 2 is for the Balance sheet. So I’ll title it as ‘balance sheet’ (cell A1).
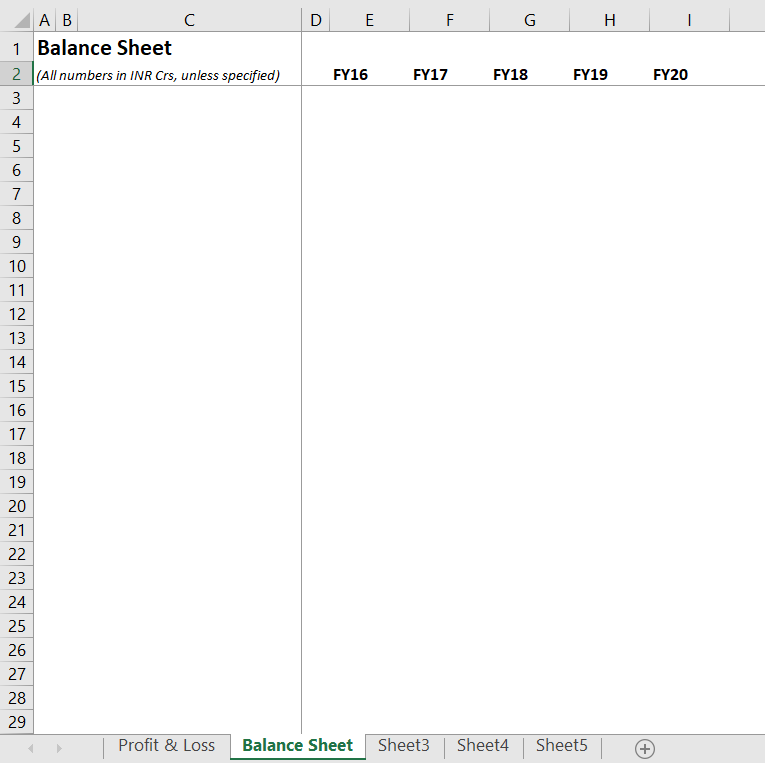
By the way, do notice that I’ve renamed Sheet 1 and 2 as Profit & Loss and Balance sheet, respectively. You can do this by keeping your cursor on the sheet and right-clicking your mouse.
I’d like you to take a minute to relook at what you’ve done so far.
In fact, this is a big step in your financial modelling journey. What you’ve done so far is to ensure that you set up your excel in a very systematic way. You have five sheets open, and all five sheets have a similar structure.
I now know that Column E represents FY16 data, F to FY17, E to FY18, and so forth across the entire model.
The structure won’t change, and it’s a huge deal. It’s called the ‘ Hygiene factor’ in a model, and that, in my view, is a super important aspect.
With this note, I’ll end this chapter. In the next chapter, we will copy the data from the annual report to our excel sheet.
You can download the excel sheet for this chapter from here, and by the way, congratulations for successfully executing (well, almost) the very first step of financial modelling.
PS: Are you curious to know what happened after I built the financial model for Hanung Toys? The model suggested that the company was way overvalued, and hence I never invested in it.

I’m so glad I dint.
Key takeaways from this chapter
-
- Pick a company that is easy to model (at least in your initial days of financial modelling)
- The manufacturing sector is slightly better to model compared to the services sector
- Look for reporting consistency in the annual report
- Do not blindly copy data from the annual report onto the excel sheet
- Set up your excel sheet before you can copy the data
- Ensure your excel sheet is consistent
Hello Sir, I am Unable to Download the Excel File. I did go through the comments to find how to download but wasn\’t able to. Please guide and help if possible.
Did you try changing your browser and downloading from a different one?
How to create multiple sheets through Mac Book commands. Control+ F is not working
You can just click on the \’+\’, icon right?
Hi Karthik, thanks for doing this for us. I couldn\’t find the excel sheet\’s link. Could you please share it? Thanks, Janes T
Can you please do \’Cntrl + F\’, and search for download. The link is there 🙂
Do check my previous comment.
When would be getting a pdf of this module ?
Pls hindi me bhi module provides kriye
Thanks a ton for Varsity, I wish I could have get this before. People like you are the (protagonist) factors which are significantly contributing for educating and developing India.
Thanks for the kind words, Sourav. Wishing you the best, happy learning 🙂
we need to know more about tax filing and steps to do it
There is an entire module on taxation that you can check here – https://zerodha.com/varsity/module/markets-and-taxation/
Can\’t find the excel sheet link.
Its there before the Key takeaways, Arin.
Is this content updated recently? It feel so, please confirm when this was updated.
Yes, this is. Also, the model discussed here is a template, you can use it as it whenever you want 🙂
Sir can we expect this module in PDF Format. Please make it available in pdf format. It really helps us. Thank you
Sir, isn`t BSE/NSE the better portals to get the annual reports of listed companies?
Yes, it is, maybe I should have specified in the chapter. You can choose either the exchanges or the company\’s website directly.
HaHa, I love the way you explain things in a personal friendly way. It makes it much more interesting to read everything and learn. This is something I\’m looking for in a mentor. I don\’t like all that bow-tied upskirt rigid professional mentors. people who I can connect with see my growth and understanding and believe me, friendliness is a major factor for me. So Kudos to you. As much as I like to learn from this, given a chance I\’d love to work as well. Hope future has that day.
Thanks for the kind words, Shubham. Glad you could connect to the content 🙂
Please translate to HINDI
I am very glad to go through the chapter.The way it is explained makes it easier for me to grab the concept.Thank you for educating us in such a rich way.
Glad you liked it Ujjal. Happy learning 🙂
I am very glad to see this module.Thanks a lot from the bottom of my heart
Sure, happy learning 🙂
Many thanks for educating us,
Can you post or email the pdf copy of chapters 13, 14 and 15 pls
We will do put up the PDF soon 🙂
Hey,Is it fine if I take historicals for past 5 years,even if an abnormality existed in 2019-2020(COVID)?
That is tricky to consider or not consider. I\’d suggest you do.
thank you so much sir for this…..after reading this it feels like you are sitting next to me and guide how to do it
Thanks for the kind words, Tripti. Happy learning 🙂
is this not available in pdf form?
Not yet, will try and upload soon.
Sir. There is a tiny typo in the last line. You\’ve written \”dint\” instead of \”didn\’t\”.
Ah, let me check that 🙂
Is there any way we can get printable format of the module chapters till now?
After the module is complete, we will post a PDF which you can download and print.
Is there an option to download the pdf version of this module?
Not yet.
Can anyone tell me why there is \”Other financial assets\” recorded two times int the P&L Statement?
Check the nature, it could be current and long term.
Its really astonishing work! Explaining the content in very simple and engaging way! You Just inject your passion towards Learning to your readers as well 🙂
Thanks for the kind words, Swathi. Hope you continue enjoying learning from Varsity 🙂
I was completed entire blog and Waiting for complete series.
Please provide blog in Hindi language for better understanding for non-financial background students.
We are working on it, Parth.
Sir, I have started reading Annual Report of BAL and to be very honest , at first , I was a bit reluctant to read it. But, now , it looks like that it\’s a good company to start building our model. Again, all credit goes to you…
Happy learning, and good luck Sumit 🙂
Sure Sir, let me check.
I guess Sir, Hanung toys does not have a recognized website, anymore. Neither it\’s traded on NSE. Request you to share any other company from which we can start our financial modelling.
Sumit, I\’ve taken up other examples, request you to continue reading.
Kite
i got the excel in the next chapter 🙂
why break you head and write this chapter simply you could have uploaded a sample excel and ask every one to download it and use it
Keshav, someone has to do this. Not everyone can simply download an excel sheet and figure out what\’s going on 🙂
Could you please enable the download function here and also video lectures would work wonders if thats available
Noted 🙂
Where can i download the sample Excel file ?
At the end of the chapter.
Many thanks for the delightful insights.
You can download the excel sheet for this chapter from here…
sir i think link is not accessible
Let me check, but just in case, you can always download from the next chapter.
Thing of beauty
Awesome and most simplified articles on financial modelling. Eagerly waiting for the complete module.
Glad you liked it, Jayesh. The entire module should be up over the next 2-3 months.
I am more than impressed at your work, I am stunned and whole-hardheartedly grateful.
Amazing. Great stuff.
That\’s all I can say.
Q: Do you do net-based seminars, tutorials, … ? I\’ll go looking shortly.
Pls make sure you e- me on any upcoming additional Rangappian works-of-art.
Not as of today, but will make sure to put this up on social media.
Any suggestions?
Hello Karthik,
Hope you\’re doing well!
Just curious to know when you mentioned that this will not work with banking. Is it not going to work for banking means? Or we need to make other sheet?
The module may not work very well with bank stocks. Yes, may have to develop another model for banks.
where can I find the excel sheet?
I must have missed uploading it, will do.
Very well written. Eagerly waiting for the next one.
Hopefully in the next 2 days.
I\’m 20 now, And Sir you have build a strong foundation in my life regarding business.
Thanks👍
By learning as much as you can 🙂
Hey, I had read all your modules so far specially fundamental analysis. They are amazing! I want to know more about fundamental analysis. Which books do you suggest me?
This module is like an extension to Fundamental Analysis.
Gain plathora of knowledge
Happy learning!
Waiting for the entire module.
Working on it, Seema. Will upload the next chapter this week.
Thank you so much sir for teaching such complex topics in a very simple and understandable manner. Amazing Work Sir!! Eagerly waiting for the next module.
Happy learning! Will be uploading the new chapter soon.
respected sir,
after this module please make an exclusive module on intraday trading, different types of traders and techniques and set ups in intraday trading.
Noted, will do.
Karthik Ji, your contribution to retail participants, Zerodha and our nation as whole is commendable.
I have learnt most of the nuances and subtleties of risk management and biases from you.
Guru Namaskaram.
Kumar
Thanks for the kind words, Kumar! Happy reading 🙂
Hey, I had read all your modules so far. They are amazing! I want to know about fundamental analysis. Which books do you refer for a beginner.
Did you read the module on FA itself? If not, check this – https://zerodha.com/varsity/module/fundamental-analysis/
Bumped into this module on google news feed. Eagerly waiting for the next modules.
Varsity initiative is one of the best by Zerodha and these modules on various finance aspects in it is so easy to read and understand. It brings the joy of able to learn and grow. Keep up the good work and innovations.
Thanks for the kind words, Divya! Happy learning 🙂
Thank you Karthik sir for teaching such important concept(s) in a very easy and organized manner.
Eagerly waiting for the upcoming chapters.
I\’m eager to put them as well 🙂
I guess wait is the toughest job to do so it is for upcoming chapter of this module….can\’t it all be posted in one go?
I\’m drafting these things along with other work, Sourabh, so, please bear with the delay and I apologise for it.
Just needed this kind of course..detailed and step wise.
But one request sir, please update next chapters as soon as possible.
And if possible, give us some kind of \”home-work\” to do in between two chapters.
I\’ll note that, Sanket.. will try and incorporate it.
Continuing with my above mentioned query, for instance, 5th year is the year of transition, then we have restated figures of balance sheet of three previous years. What presumotions and/or adjustments are required to be made for the first two years.
Yes, then in such cases you deal with just 3 yrs data, which kind of becomes hard to model, but not impossible.
Thankyou so much sir .. for providing such a wonderful content !! You are our hero ,we all love you 3000…..
Thanks for the kind words 🙂
It is really good reading all your books. I am curious about learning one thing and that thing is:
If during the 5 year period data fetching, there is a transition phase from following AS to Ind AS in financials of any company. How to deal with that.
Please incorporate this as well.
Once the transition happens, I guess they have to restate the last 3 years statement in Ind AS. So you can take that.
What an extraordinary effort you are making to understand the financials
Happy learning, Vikash!
Excellent module Karthik sir, can we use google sheets instead of excel here?
You can, it\’s just that I prefer excel. If you can do the same on Google sheet, then why not 🙂
Excellent work Karthik. Cant wait for the full release. It’s like I’m waiting for my favourite TV show to release the next episode
I\’ll try and put this up soon 🙂
A module on the backtesting of data and strategies would be really helpful.
Noted.
Karthik sir,please add three statement model, consolidation model and option pricing model…comman in everywhere…you made thinks very very easy for us
i want to binge on this like i binge on a kdrama :-)Waiting for you nxt chapter.
I\’ll hopefully upload this soon 🙂
Loved & Respect to you sir,
After completing this module if you can start a module on blockchain technology sir, that will be great
Thanks for the kind words. Unfortunately, I have zero knowledge about that 🙂
Hey Karthik!
Is there any way or any tool that let us extract data from annual reports?
Because I did it manually and it took me almost a week to collect data for a particular co. for last 5-7 years. And if we use screener or other websites the data is not as precise.
Not that I\’m aware of Shivam.
Great Content .
If possible try to incorporate Relative Multiples Valuation.
Thanks !!!!
Will try and do that.
reading varisty is more exciting than watching any web series…hats off karthik sir.. eagerly waiting for new chapter now.
Thanks for the kind Ankit. Will try and put up the next chapter soon 🙂
When will the third chapter uploaded?
Hopefully by next end of next week.
You\’re a legend, thanks for everything you put out. I hope I get to meet you one day a few years later, when I\’m proficient with all this for providing a wonderful base to start off from, to thank you 🙂
Thanks for the kind words, Karan! Happy reading 🙂
Thank you so much for the valuable content
Happy reading!
Excel ready for next step!!! No words to express my excitement!!!
Hopefully soon 🙂
Hi…. How do we see the prices getting completed. Caught this article on Google. How do i get to the remaining part
We are doing this one step at a time. Will discuss the next step soon.
Hello Sir,
Will you teach us how to read nbfc and banks financial statements in this module?
Not sure, Yitesh. I may not.
Dear sir in this module where to read/get catogory and sector and company wise case study ?
Please include in varsity
This is Varsity!
Eagerly waiting for next one..
Hopefully soon.
Eagerly waiting for next session. Thank you
Hopefully soon.
I love you guys
We love you too!
thank you sir
I request u after this module, an exclusive intraday set up module sir
Noted.
Short and crisp ! The way i like 🙂 ! Waiting for the whole module like 3000 times J
Hopefully soon, Sarthak 🙂
Thanks a lot for this chapter. Sir why you come to this field, rather you should be a movie director bcoz you always create a good suspense at every end of the chapter. Happily awaiting for the next chapter.
hahah, I\’m happy in this field 🙂
There are articles on internet on finance topics but reading that feels same as hindalco annual reports you mentioned here. Thank you for keeping this simple and neat for a beginner.
Happy reading, Nithin.
So far so good ! 🙂 Cannot say I am not jealous of Vishal Vindoorty. Lucky to have met you early in his life.
Well, all I can say is thank you 🙂
I am looking for various valuation method. Are you going to explain it in upcoming chapter or not?
I\’ll include DCF for sure here, not sure of other technique.
Thanks a ton for this module….just bump onto this accidentally, but it looks promising.
Hope you liked the content!
Thank you so much for the detailed explaination.
Happy reading!
Please also tell the screener we should place for identifying such simple and clean balance sheet companies
One after another, Sir 🙂
Eagerly waiting for the complete module…😊😊
So am\’I 🙂