7.1 – Recap and way forward
In the previous chapter, we looked at how a basic common sense approach can lead us to build a simple revenue model of a company. We made the revenue model using the helper model. In this chapter, we switch back to the primary model and continue to build our financial model.
To refresh your memory, so far in the primary model, we have –
-
- Set up the basic excel layout for the financial model (indexing, grids, pane freeze)
- Input the balance sheet and P&L data. The data source for the model input is the annual report of the company
- Colour coded the numbers to distinguish between assumptions and facts
- Built the P&L assumptions
- Built the Balance sheet assumption
Both P&L and balance sheet assumptions are in the same sheet, called the ‘assumption sheet’. So far, our model has only three sheets –
-
- Assumption sheet
- Balance sheet, sheet
- P&L Sheet
While we did make assumptions for line items where ever possible, we left out few line items to build a separate schedule for the same. I’d suggest you download the excel sheet to get a quick grasp of where we are in our journey of building a financial model.
Over the following few chapters, let us go ahead and build these schedules.
We will start with the asset schedule.
7.2 – Base rule
Before we build schedules, we need to understand the concept of the base rule. It is a simple concept, you’d probably already know this, but I might as well discuss it now 😊
As usual, let us take an example.
We all know electric vehicles are making a buzz in the market. Ola has plans to manufacture and sell electric bikes.

Consider for the sake of simplicity that Ola manufactures 4000 electric bikes in its first year of operation. Here are few data points that I’ve made up –
-
- Number of bikes manufactured in 1st-year operations = 4000
- Number of bikes sold = 3750
- Number of bikes unsold = 250
On excel –
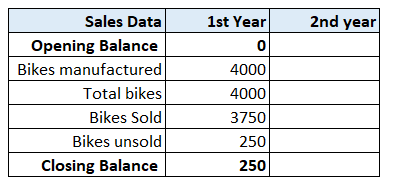
I’ve introduced opening balance, total bikes, and closing balance here. The opening balance in this context is the number of unsold bikes carried forward from the previous year. It is zero in this example since it’s Ola’s first year of operation.
Total bikes are the sum of opening balance and bikes manufactured. It is 4000 in this case as the opening balance is zero.
The closing balance is the number of unsold bikes for the given year.
Now, let us assume that Ola manufactures and sells the same number of bikes in the 2nd year.
Can you pause and tell me what the opening balance, total bikes, and closing balance for the 2nd year is?
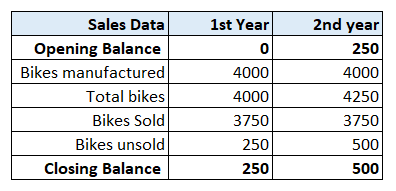
I hope you got that right. If not, let me quickly explain –
The opening balance for year 2 is the closing balance of year 1. So, in this case, the opening balance for Year 2 is 250.
They manufacture 4000 new bikes, so the total number of bikes is 4250, of which 3750 bikes are sold. Hence the closing balance for year 2 is 500.
The opening balance for Year 3 is the closing balance for year 2. So on and so forth.
The technique of linking the closing and opening balance is the ‘Base rule’. We use this pretty much in all the schedules that we build, including the asset schedule. For now, keep the base rule in the back of your mind. We will get back to it shortly.
7.3 – CAPEX
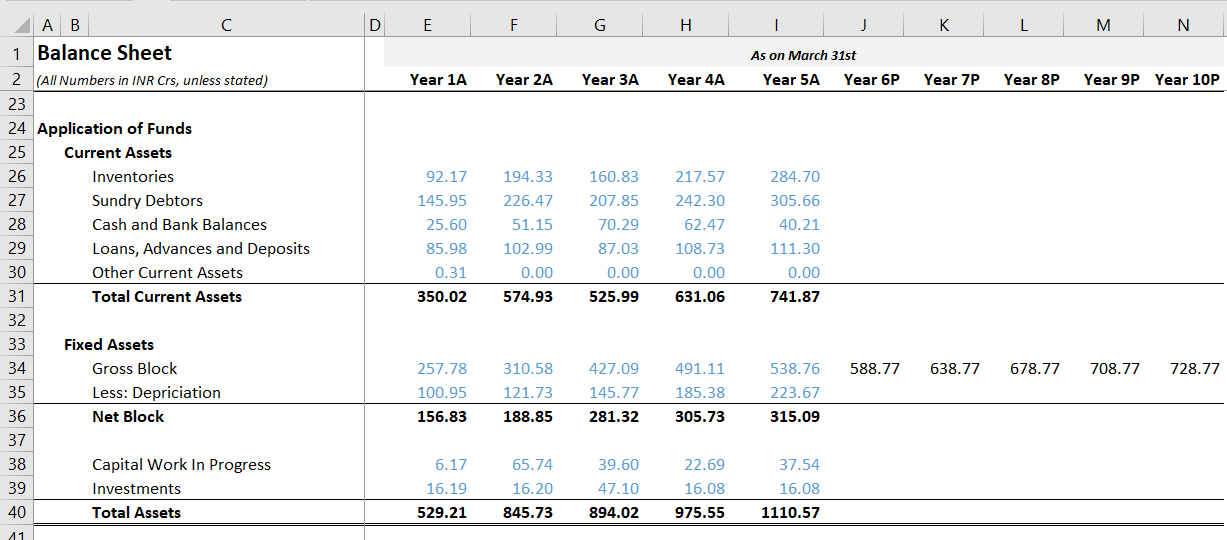
At this stage, let’s quickly understand what we are dealing with here. If you take a good look at the assets (or application of funds) side of the balance sheet –
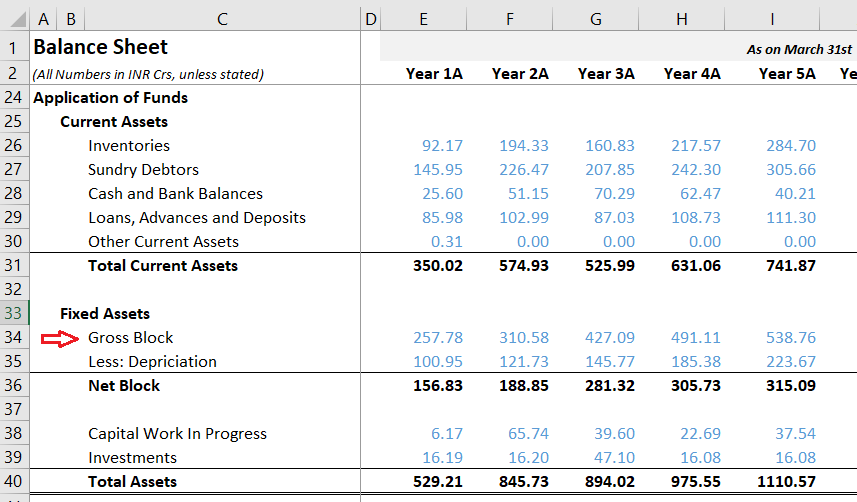
You will quickly understand that the Gross block is a large item. In fact, in most balance sheets (at least for manufacturing companies), the gross block is the most significant chunk on the asset side. More so, when it comes to the balance sheet assumptions, we have used gross block extensively –
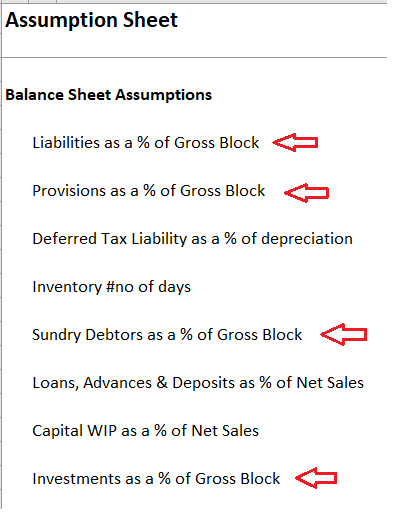
Given its heavyweight, it makes perfect sense to dig deeper into Gross block and strengthen our understanding. I would suggest you do this little exercise –
-
- Pick a company of your choice and open its annual report
- Open the balance sheet, check the asset side, and pay attention to the Gross block
- Notice the associated note number
- Look at the notes in detail
What do you observe? You are likely to notice the following –
-
- Gross block is also called ‘Property, plant, and equipment.’
- Gross block is (most likely) the heavyweight on the asset side
- Few companies may report gross block, deduct the depreciation, and report the netblock
- Few companies report the netblock directly
Further, the associated notes give you a detailed breakup of the gross block, so the notes give you a sense of the nature of this line item. Gross block invariably includes all the details related to the assets the company holds –
-
- Land (freehold and leasehold)
- Improvements for leasehold lands
- Buildings
- Plant and machinery
- Computer hardware
- Factory equipment’s
- Electric fittings
- Vehicles (including aircraft)
- Maintenance and repair works
The things listed here are ‘CAPEX’ in nature. Now, what is CAPEX?
Capital expenditure or just the CAPEX of a company are funds used by the company to invest, upgrade, and maintain physical assets such as the ones listed above. For example, if the office roof is leaky, money spent on fixing the roof gets reported as CAPEX.
Or if a manufacturing company wants to build a new manufacturing plant, then right from acquiring the land (or leasing), to setting up the plant with equipment and factory machinery is considered as ‘Capital expenditure’.
Some companies can take up projects so large that the capital expenditure can run across several consecutive years, draining the company of its financing avenues. Of course, companies do this with an expectation that the future payoff from the project far exceeds its current capital expenditure.
When such capital expenditure occurs across many years, it’s called ‘the CAPEX cycle’ of a company.
As an analyst, it is crucial to understand if the company is going through a CAPEX cycle (expansion) or running just the maintenance CAPEX. If the company is in an expansionary phase, you need to understand why, how, and will the payoff likely exceed the current cash burn.
If the company’s CAPEX is essentially maintenance CAPEX, then you need to figure if the maintenance CAPEX is something that the company can sustain through year on year.
Whenever I think of how maintenance CAPEX can be taxing, I remember my friend’s story.
A good friend of mine (a regular salaried person, like many of us in Bangalore) sold a plot in Bangalore and suddenly became cash-rich overnight. The first thing he did was reinvest the bulk of cash into another property. With the remaining money, he bought himself a fancy BMW, and with that, he expended all the cash he gained from the sale of the property.
The maintenance CAPEX on the BMW is quite heavy – its fuel-guzzling, hefty insurance premiums, and repairs are super expensive. His salary was not supportive of such a CAPEX in the first place. Eventually, he had to sell the car.
I detoured to give you this story to bring your attention to the maintenance CAPEX of the company.
Ensure the company earns enough to maintain its assets.
7.4 – Estimating CAPEX
We discussed Ola earlier in the chapter, so let me continue the same example here. Assume, Ola commenced its manufacturing operation with an initial CAPEX plan of 500Crs for year 1. Assume they invest 500Cr into acquiring land, machinery, equipment’s, assembly lines, etc. Remember, this is also Ola’s gross block.
What do you think is Ola’s opening and closing gross block?

We know that for year 2, the opening balance is the closing balance of year 1. Assume Ola does another 100Cr worth of CAPEX in year 2.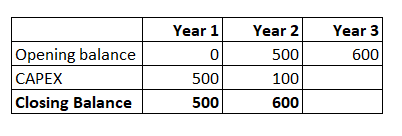
I hope it is clear so far. In year 3, assume Ola does not add any Capex but rather sells off machinery worth 50Crs. What do you think is the closing balance for Year 3? And what is and the opening balance for year 4?
Here is the table –

Again, the opening balance for Year 4 is the closing balance for Year 3. Hopefully, this example gives you a sense of calculating the opening and closing balance of the gross block.
When you look at the balance sheet of companies, they directly report the gross block (or property, plant, and equipment) number. Of course, they do not state the CAPEX number in the balance sheet. For example, in the model that we are working on, the gross block numbers are as follows –

These numbers are good enough starting point to develop the asset schedule.
7.5 – Asset schedule
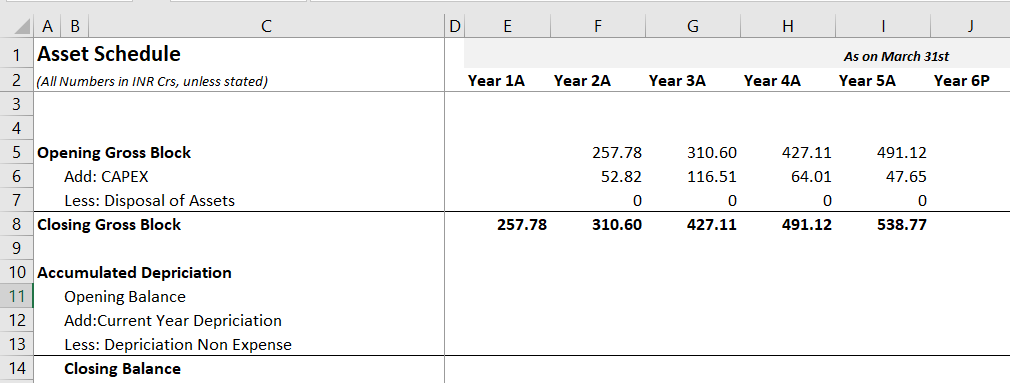
We will now start building the asset schedule for the model. As a first step, let’s set up our excel sheet. Setting up the excel is precisely the same as the other sheets in the model –
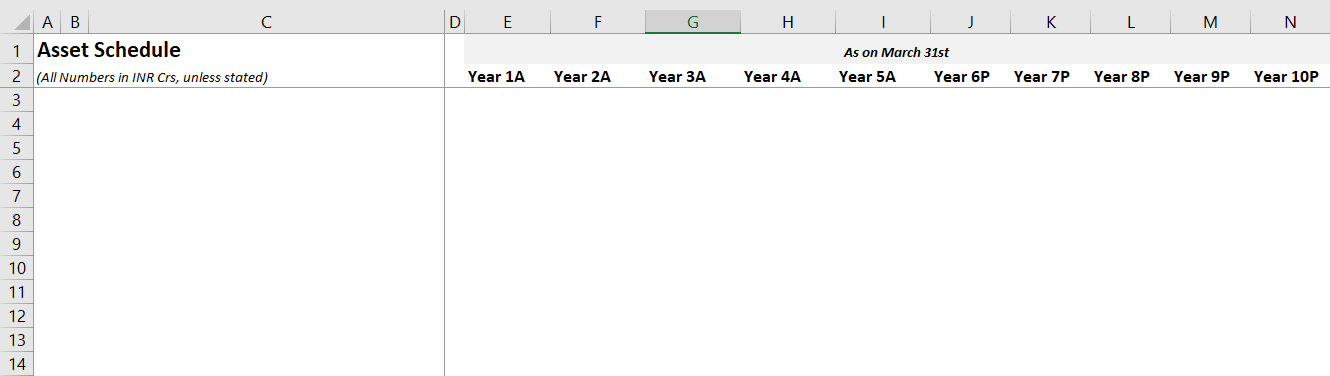
Let’s roll out the base rule in motion; hopefully, you get the drift here –
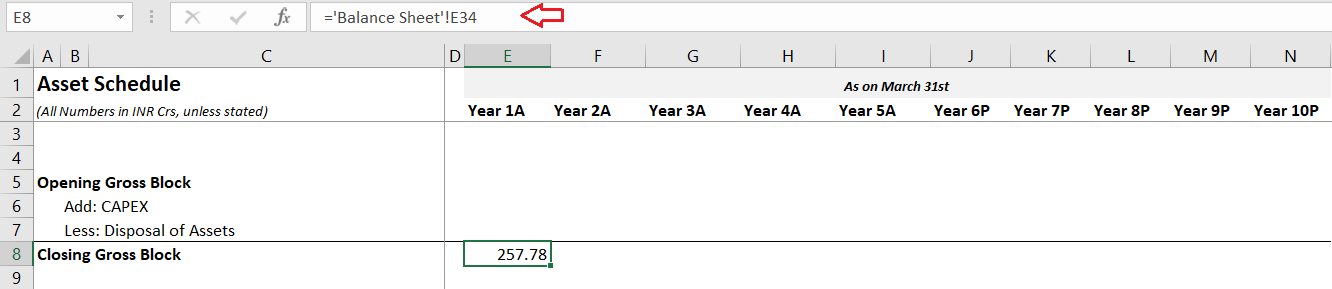
As you can imagine, I’ve linked the closing gross block for Year 1 as the opening gross block for Year 2.
The closing gross block for year 2 is 310.58, and this means the assets of the company has increased –
310.58 – 257.78
= 52.80
Hence the CAPEX for year two must be 52.80 Crs. Since the CAPEX has increased, there has been no disposal of assets. I can add this on excel –

I hope you found this easy to understand because it is 😊
I can continue the calculation the same way for the rest of the years.
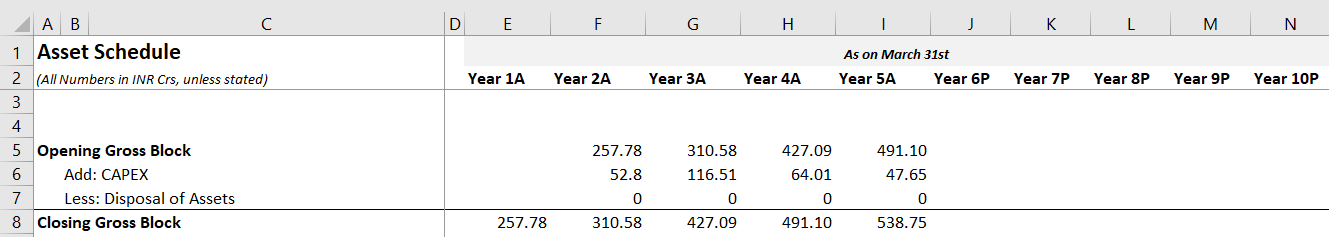
The numbers here will match the numbers stated in the balance sheet, but we have managed to extract the CAPEX numbers from gross block, which wasn’t explicitly available in the balance sheet.
Remember, the end objective is to arrive at the netblock of the company. Net block, as you know –
Gross Block – Depreciation = Net block.
Sounds straightforward, but here is a twist.
I want you to quickly take a look at the Y2 depreciation numbers stated in the Balance sheet and P&L. Tell me what you think?
Y2, depreciation in the Balance sheet is 121.73 Crs, and for the same year, Depreciation in P&L is 24.45 Crs. Which one will you consider here?
Well, you have to consider both.
Remember, depreciation is an expense. Hence it gets stated in P&L as an expense for that year. But this year’s depreciation gets carried over to the following year in the balance sheet; hence it’s called the accumulated depreciation.
Let us deal with it in excel. Here is how I’ve set up my sheet –
Yes, we will apply the base rule again. I’ll take the closing balance for year 1, set that as the opening balance for year 2. I’ll add to this the current year depreciation stated in the P&L. When I add the opening balance and closing balance, I should get the closing balance of the accumulated depreciation for year 2. The number I get here should match the depreciation number stated in the balance sheet.
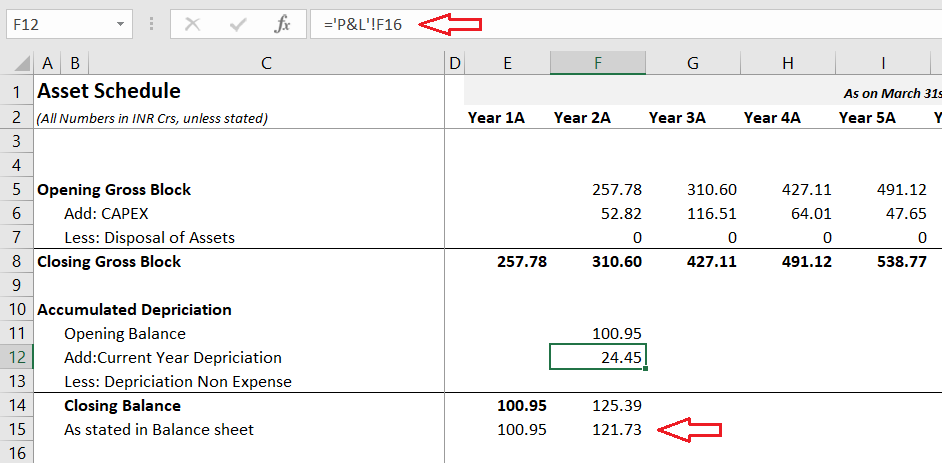
As per the base rule, the closing balance is 125.39Crs, but as stated in the Balance sheet is 121.73 Crs. A difference of nearly 3.66 Crs.
How and why is this difference?
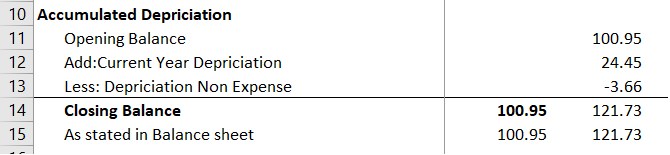
Well, the difference arises due to the small asset write-offs and adjustment that happens. We treat this as a depreciation non-expense. If you adjust for this, the numbers should match.
I hope you’ve been able to keep up with this. It is not too complicated, but as a person doing this for the first time, you may find it overwhelming.
Now that we have calculated the gross block and the accumulated depreciation getting the netblock is pretty straightforward.
Net block is the difference between the closing gross block and the closing balance of depreciation.

I’d suggest you match this with the netblock number in the balance sheet for your reference.
7.6 – Capex projections
Now that we have set up the asset schedule, we need to move ahead and make some projections here.
The most crucial projection here is the CAPEX projection. It is super important to understand how the company will be dealing with capital expenditure over the coming years. Now, because this is such an important figure, companies usually explicitly state their CAPEX plans. You can get this information by reading the management discussion analysis or the analyst reports (or even watching a business channel).
I’d suggest you take some time to watch this interview to the context into how you can project the CAPEX by considering management’s statements.
In this recent interview, the CFO of Bajaj Auto clearly states the CAPEX requirements for the coming years. In my view, this kind of information is more valuable than any projection we can do.
If you don’t have access to this kind of information, then you have two alternatives –
-
- Find out the average CAPEX and assume the averages hold for the coming years
- Variable method, here you look at the company’s historical CAPEX. If the company has been through an expansionary phase (high capex spend), you taper it down. Alternatively, if the company has had a low CAPEX cycle, you gradually increase the CAPEX spend.
Remember, both these techniques are your alternate. Your first option should be the management itself.
In this model, we will use the variable method. Historically, the CAPEX was high, so I will gradually taper it down with an assumption that the company is through with the bulk of its CAPEX cycle. I’ve also assumed that the company has zero disposal of assets.
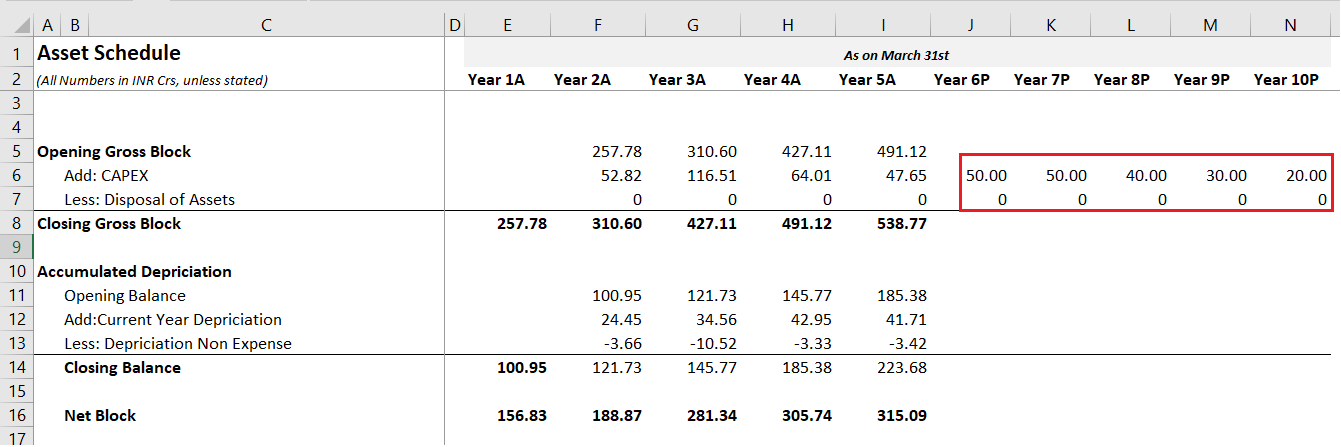
Now that you have the CAPEX number, isn’t it easy to figure the Closing gross block number? Of course, it is. Let us complete this –

Now that we have the closing gross block number, we can plough these numbers back to the balance sheet.
With this, we have made our first balance sheet projection, so congratulations on that 😊
But why did we plough this back into the Balance sheet right away? Why not complete the depreciation projections and then make the projections in the balance sheet? Well, there is a reason for that.
I’m tempted to continue that explanation here, but I guess this is a super long chapter already. I promise I’ll put up the next chapter quickly, which will have this explanation.
Stay tuned until then!
Download the excel used in this chapter here.
Key takeaways from this chapter
- As per the base rule, the closing balance for year 1 is the opening balance for year 2. We use base rule across many schedules in a financial model
- Gross block includes all the assets that the company owns; usually, the gross block number is a heavyweight on the asset side
- Capital expenditure or the CAPEX of a company includes all funds spent on acquiring new assets or maintaining assets
- Asset schedule helps us extract the CAPEX numbers from the gross block number
- To project the CAPEX, ideally, one should look at what the management has to say
- Other CAPEX projections techniques include the averages and the variable method.
Hi Karthik. I am currently building a financial Model on Mahindra and Mahindra. While I understood the depreciation part on the Income Statement Side, there is no mention of depreciation in the Balance sheet. In an earlier module you did mention that Deferred tax has something to do with depreciation so can that be considered as Depreciation which is there in the Balance sheet?
Do check under the schedule of the Gross block, there will be depreciation details mentioned.
Alright Sir, I will check on it and treat it in a tapered way.. (I am considering 5 Estimate Years ahead, but the capex plan is for approx. 7 years
Sure, best wishes 🙂
Sorry sir Zero me mistake ho gyi 1.25 lakh crores = 1,250,000 millions
1,250,000 – capex done 45390 and 230201 is = 9,74,490 millions
for 7 years is 9,74,490/7 = approx =1,39,000 annual
baaki sab same question
That is ok; please check my previous response.
1. I was gathering some Information about the Capex of Maruti Suzuki, and i found out in the news that maruti is going to do a heavy capex of 1.25 lakh crores which is 12,500,000 million (as my figure in model is in millions) for next nine years (2023-2031).. and i am forecasting from 2025-2029.
From My model i Got that in 2023 =230201 million capex and in 2024 = 45390 million capex is done.
which means approx 12000000 capex is more to be done in future years.(including Expansion of Product Lineup and Production Capacity).
So sir how can i forecast this in my model
Considering like 7-8 years of capex investment is left and i do 12000000/8 =1500000 million Capex every year constant or like in a growth phase like first increase then decrease / visa versa or there is other good way to do it.
your advice will be really helpful..
Once again thank you sir!
In your model, are you considering beyond 5 years? Do check what the management has to say about CAPEX, and its best to treat it tapered. Higher in the initial years, and lower in the further years.
Hello Karthik
Is a difference of 100-200 crores acceptable as write-offs in the depreciation segment,analysing TVS motors
Thank you for you time and answer.
100-200Crs is quite a bit to write off 🙂
Hello Karthik
Can you please tell why there is a need to create seperate schedule? Is it not possible to proceed in the same way like we did for the other line items of Balance sheet and P&L? (Taking avg or making an intelligent guess)
Of course it is possible, but a schedule is to give you more clarity and control on your financial model.
Sir how to calculate gross block, as in relaxo footware Annual report there is NO net block and gross block stated, only depreciation and amortisation expense is stated in Expenses
Please do check the associated notes, Ashay. The balance sheet will have the split b/w gross block, depreciation, and net block.
Hi sir
So the company im working on has not mentioned overall gross block instead of that in the notes they have divided it like 4a- PP&E
4b-intangible assets
4c- Cpaital work in progress and intanglible assets under development
4d- Right of use of assets
they have additions and disposls and accumualted depriciation/amortization separately for each section so should
i just add all the additions to get capex and do the same for disposals and gross block.
Yeah, looks like the company is giving granular details. Its good since you can model better.
Hi Karthik,
From where do we find accumulated depreciation? I was looking at Relaxo itself (FY19 & FY20 respectively). It is showing in the notes of \’Deferred Tax Liability\’ (Note 18).
But I found that the YoY difference in Accumulated depreciation (FY20 – FY19) does not match the Depreciation in P&L.
Accumulated Depreciation (FY18) – 46.82
Accumulated Depreciation (FY19) – 57.45
Accumulated Depreciation (FY20) – 79.56
Dep & Amort. Expense (FY19) – 62.41
Dep & Amort. Expense (FY20) – 109.42
In the Note 18 for FY20 report, it also mentions that the value recognized in profit and loss is 22.11 but that shows a gap in numbers.
You can find it under the Gross Block (or Net block) section of the balance sheet. Look for it under the assets side of balance sheet.
The way you are teaching us very easy to understand and apply.Thanks a lot.
Happy learning!
Hi Karthik,
Is depreciation an expense? There is no money going out of the pocket, right? Please clarify.
Yes, it is an accounting expense and not an actual cash expense.
Thanks for this wonderful resource, Karthik 🙂
Can you please create a PDF for this module? It will help with offline reading.
Thanks, Jigar. Yes, we will do that shortly.
When we tend to look at the bifurcation of individual assets we tend to find the information such as Acquisition,disposal,govt subsidy,however the term CapEx is not specifically specified.What should we do about this?
CAPEx needs to be inferred, Paras. I\’ve explained that in the chapter.
1)When we tend to see the annual report of the company we can see that instead of CapEx they have mentioned it as acquisition,so is it fair to say that both are the same its just that CapEx is a more generalized term used than acquisition.
2)Also as the way we calculated the CapEx by subtracting the closing balances of Gross Block,the amount which we get is inclusive of CapEx and Disposal ,so can we divide the two in proportionate basis?
3)I was checking out Tata Steel\’s Annual Report where adjustments were like this:-
Gross block of all the respective assets-Accumulated impairment of assets-accumulated depreciation.
Do we have to factor for accumulated impairment as well or it is adjusted in the difference which we calculated while doing the calculations of accumulated depreciation closing balance?
Please guide for the same.
Thanks in Advance.
1) No CAPEX spend and acquisition cannot be mixed. They are different.
2) Yes, you can do this for better clarity in your model
3) You can, especially if its a recurring line item in the balance sheet.
Karthik,
The company is a footwear company and does not tell about their capEx neither in the interviews nor in the annual reports.Can you pls tell what can be done in this scenario
Then assume that the CAPEX will taper off. So reduces the numbers each year.
Thanks Karthik…
The company that I have chosen has the previous year CapEx values 0.00 35.09 383.58 6.20….Can you clarify how the variable method can be implemented for CapEx projection as they are both high and low.Is it better to implement average method in these scenarios..
Neither variable or averages work here. You will have to take cues from management interviews to figure what the company is likely to do with its capex spend.
Hi Karthik,
For \”Add:Current Year Depreciation\”, the values of \”Depreciation and Amortization\” are taken from Profit/Loss statement.Do we need to subtract the amortisation value(by referring the associated notes).Pls clarify.
Not necessary, you can include that in your calculation.
Hi Karthik,
Here in the module,it is mentioned as \”Since the CAPEX has increased, there has been no disposal of assets.\”While calculating CapEX,for the company that I have chosen,the difference between the current and previous year gross block is negative,so the CapEx here is considered as Zero.So,then will that difference be considered as \”Disposal of assets\”.If so,how will \”Disposal of Assets\”get projected.Can you please clarify.
Disposal of assets is usually a one-time affair, and we do not expect the company to do that year after year. Hence no projection is required.
Excellent content but also the most complex module sir. I got lost somehere in the assumption chapter and then I started reading from first. Also indirectly learning excel from you as well. Please consider a certificate test for this module if you can. Can we expect something similar with analysing banking and NBFCs in the future?
Thanks Sathish. Glad you are putting in efforts to learn the topic 🙂
About the test, noted 🙂
Hi Karthik,
In that case,when there is no new capEx ,do we need to mention that as \”zero\”.
Yeah, if there is no CAPEX, then it will be zero.
Hi Karthik,
while calculating CapEX,for the company that I have chosen,the difference between the current and previous year gross block is negative,how to calculate CapEx in those scenarios
In that case, there is no new CAPEX, and most likely there is a sale of asset. Do check the management interview where they have indicated the capex spends and utilization.
Hi , I got confused with the the part where you introduce gross block. Is it quite possible for you to do a Video/s where you extract and integrate the model ?
It will be tough to do a video, as I\’ll have to do videos for the entire module and not just for this one sub-topic. Let me know where the confusion is, and I\’ll try to help with that.
Hi Karthik,
QQ-
1) How do we assume that the numbers in Year 1A-5A are high or low becz there might be a possibility that the Capex before Year 1A might have been much higher than what we are looking at as in Year 1A-5A and the company may require more capex for expanding? Shouldn\’t we also look at the Revenue Model to make capex projection for year6P-10P like in case our capacilty utilization is showing reaching peak in our projections from Year6P-10P?
2) In addition, how do we assume numbers while using Variable method for projection? Just any random number or there is a thinking behind it.
1) Yes, if you build a revenue model then that will be project to give us a sense of where the revenue stands right? Also, if the company has had a capex cycle before the 1st year, then the trend of shrinking capex spending will be evident, and we can make appropriate assumptions basis that.
2) You can look at past numbers and taper accordingly. Say 10% year on year..something like that. While one can argue it is random, try and put as much thought to it as possible. In fact, this holds true for the entire model.
it is really great learning,
Few Queries-
I see the firm I choose for the above practice shows values too over with the above method. Due to an unstable balance sheet, There is too much long-term borrowing happening in the latest FY which is been used in expansion, purchase of inventories, also increase in other income, and sale of old machines.
Can we take an average of the historic gross block to get a projection year Gross Block?
Even the average will be pulled too due to a sudden increase in value in recent years\’ results from double-digit to tripel digit.
What method should we use when AR is too volatile?
What will be the right way to keep the valuation model tight If there is a sudden increase in value due to borrowing, other income or unexpected increase in sales which will not be going to continue for certain reasons.
In P&L Assumption –
Can we take PBT & EBITA as % of Total Revenue?
Akshay, taking gross block averages is not a good idea. You need to build a schedule for this. If this is the first time you are building a financial model, I\’d suggest you stick to a simple company and try it out.
Thanks, Sir.
Good luck, Ajay!
Hey, there is no Depreciation line in my balance sheet. And I can notice that sizeable Depreciation amount has been expensed in P&L statement, as in this case can I directly take P&L depreciation numbers into my assumptions? your feedback will be really helpful.
Ajay, it will be present in the balance sheet, please see the gross block schedule.
okk sir..
Good luck!
Thankyou sir, for sharing such great material on Financial Modelling. Really helpful.
Sir, there is one doubt under Capex Section.
It\’s that as you mentioned here that capex increased by 52.8 crore, but may be here capex increased by net 0f 52.8 crore
as for eg( 100 crore capex is added and 47.2 crore disposal of asset is made), which may becomes a new point of analyzing the company.
From Reading mentioned above: –
The closing gross block for year 2 is 310.58, and this means the assets of the company has increased –
310.58 – 257.78
= 52.80
Hence the schedule, Yash. With a schedule, you get to break down the components of CAPEX and analyse it both on an overall and net basis.
Waiting for the next chapter
I\’m trying to complete this as quickly as possible 🙁
Hi Sir,
Thank you sir for this informative content.
Need to ask you a question unrelated to this topic..where can I find the Investible Weight Factors for Nifty 50 stocks?
You can search here – https://www.niftyindices.com/
Hi! Would you be starting a module about Crypto as well?
Thank you so much for this quality content.
No, unfortunately I don\’t know much about crypto at this stage.
when will the new ch come
This week or early next week, Shivansh.
I researched through company reports and investors presentations the company which I have chosen doesn\’t have any short to medium term CAPEX plans so should I use the variable method or the avg. method for future projections
Yes, in that case, they will have just a maintenance capex.
You are account Banane mein problem
thanks for helping by telling if all the things come in gross block or not but I asked that question because earlier in the module I told you that the company which I have take hasn\’t mentioned the gross block or net block columns they have written all the assets separately in their balance sheet
Ah, did I say that? Can you double-check please?
appreciate your good work sir. Continue the good work. Thank you
Happy reading!
will the gross block include:-
1. Capital work in progress
2. Right of use of assets
3. Investment property
4. Intangible assets under development
5. Other intangible assets
Yes, these are included, but I\’d suggest you look at the associated notes for this to know what\’s exactly included in the gross of the company you are dealing with.
Eagerly waiting for pdf copy of the Financial Modelling module.
The module has to be completed, PDF will be available only after that.
I gotta say, You are not only a badass investor but also a good fcuking writer.
Sir how many more chapters are there?
SIr if you could make this module in PDF at the end of all chapters it would be very helpful
Basil, lots more to go. Cant make PDF now only, have to wait till the entire module is done.
Very good and helpfull method for analysing the capex. Thank you
Yup, it is. Happy reading!