12.1 – Milestone
When building a financial model, there are two essential milestones. We will hit the first one in this chapter and the 2nd milestone in the next.

Before we proceed, I’d like to jog your memory and run you through the various steps we have performed in our financial modeling journey. If you are struggling with any of the following topics, I’d suggest you revisit the relevant chapter and read through it again. Don’t forget to ask your queries and get them answered.
-
- We started the module with a blank excel workbook and formatted a financial modeling-friendly sheet. We indexed the columns and froze the panes. We ensured each column refers to the same year across the model to maintain certain integrity.
- We reviewed the company’s annual report to ensure the statements were consistent; we copied the last five years’ P&L and Balance Sheet data onto the formatted excel sheet. The P&L and Balance Sheet data are the only hard-coded numbers in the financial model; the rest are assumed or calculated.
- We introduced an assumption sheet and dumped all the P&L and Balance Sheet assumptions. The assumptions are based on growth rate or calculated as a more prominent line item percentage.
- The first thing to build after the assumption sheet is the revenue model. The revenue model gives a granular view of all the variables which control the revenue.
- We introduced the concept of ‘schedules’ in our model. Schedules are essentially assumptions, but the assumption is broken down into several parts to gain more significant insights.
- Schedules follow the base rule concept, where the closing balance of year 1 is the opening balance of year 2.
- With the assumptions and schedules, we have managed to project the balance sheet and P&L to some extent.
As you may have noticed, the numbers criss-cross from one sheet to another, making the model wholly integrated.
This chapter will fully project the P&L and Balance sheet for the next five years, and that’s a mini-milestone in our financial modeling journey.
12.2 – P&L Projection
We are at an exciting phase in our financial modeling journey. One financial modeling enthusiast related this phase to a wedding kitchen scene.
In a typical wedding kitchen, usually, there is one person chopping veggies, one person grinding the masala, one person frying stuff, another mashing, another preparing the garnish, and whatnot. Finally, in the end, everything comes together and falls into one gigantic vessel for the final dish to take shape.
Likewise, so far in this financial model, we have done several things in isolation. But now, it’s time to tie things up and integrate our model.
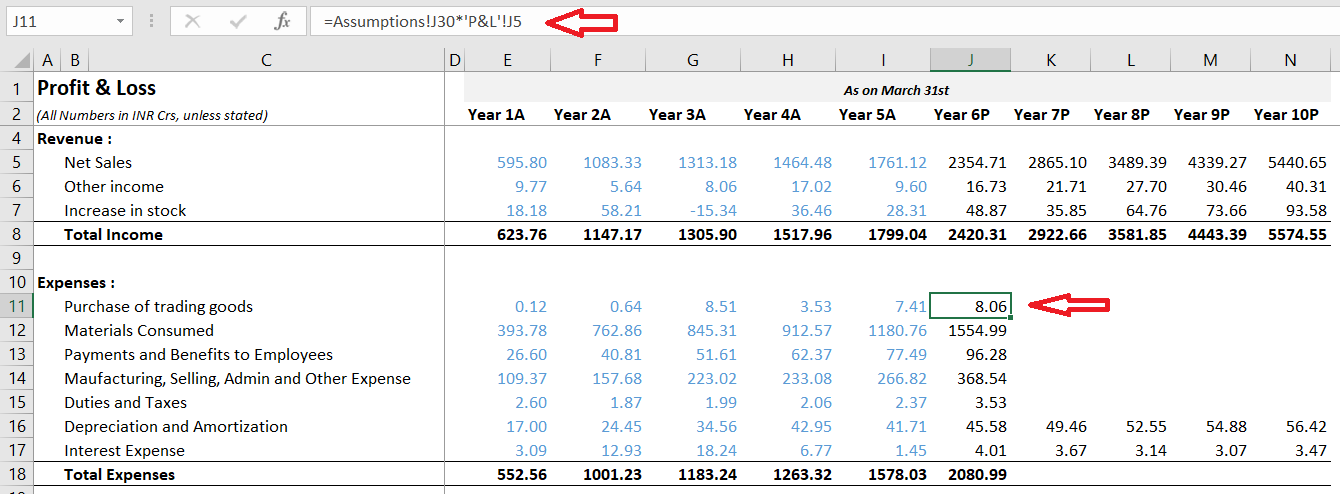
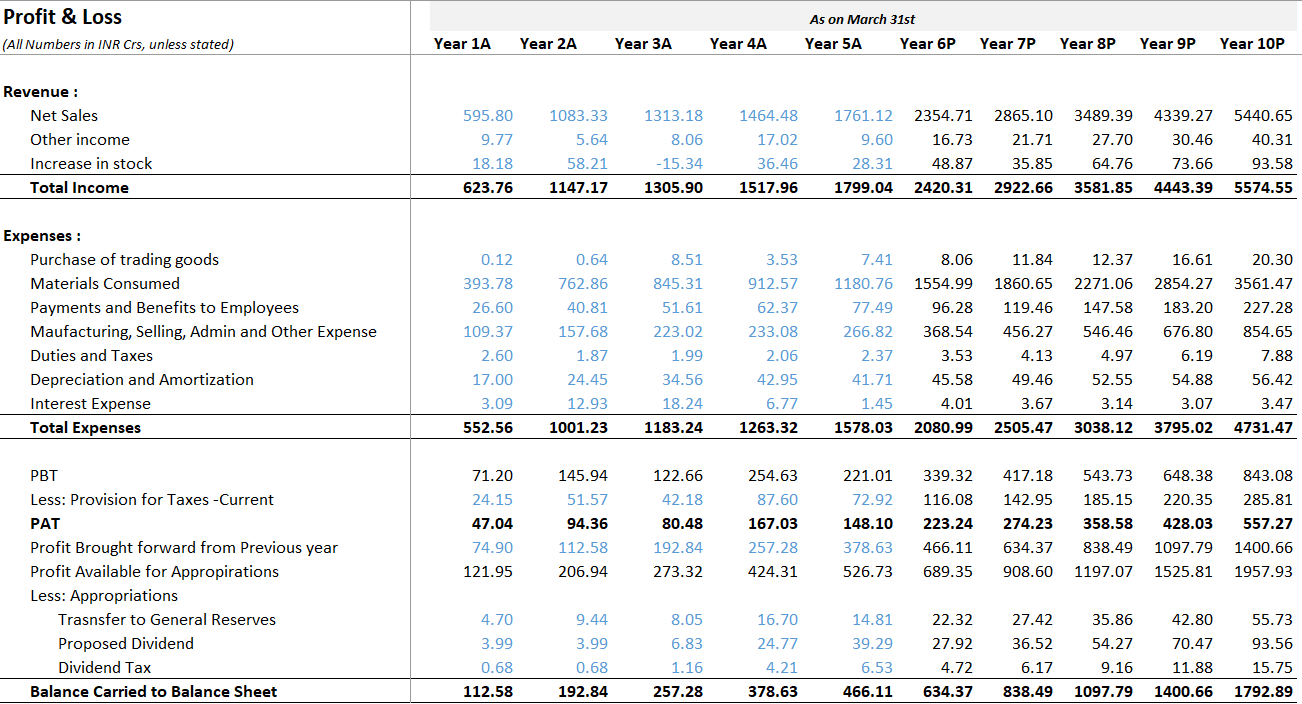
Let’s start by taking a look at the P&L snapshot –
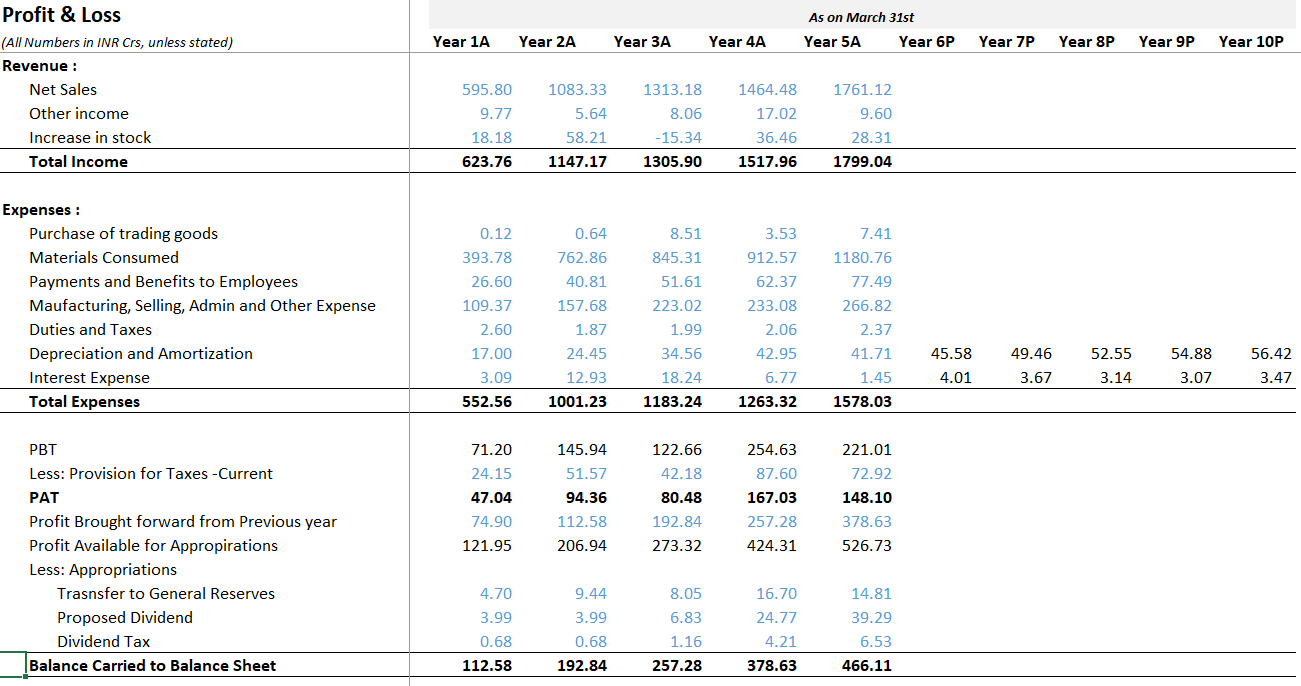
Except for the depreciation and interest expense, none of the other line items in the P&L statement are projected. We projected depreciation from the asset schedule and the interest expense from the debt schedule. We will now project the rest of the P&L, which is an easy task.
Starting with revenues, we look at our assumptions for net sales. Recollect, we calculated the year-on-year growth rate of net sales and then projected the average growth rate.

We know the net sales for the 5th year and the net sales growth for the 6th year (the projected year); we have to do the math to get the actual value. The math is quite straightforward –
The net sales growth rate for the 6th year = 33.71%
Net sales for 5th year = Rs.1761.12 Crs
Net sales for 6th year = 1761.12*(1+33.71%)
= 2354.71 Crs.
On excel, I’ve calculated using the same approach for all future years –
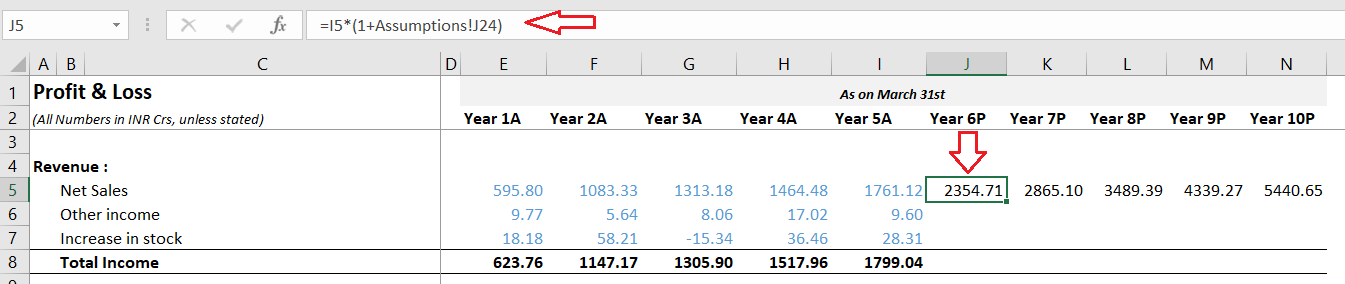
One thing that I always make a point to check is the cell linkages. I liked cell J in the P&L sheet and cell J in the assumption sheet. The association is correct, and I need not worry about inadvertent linkage errors.
Once the net sales numbers are in place, we can proceed with other projections since most projections are based on net sales. I’ll demonstrate one of the line items and assume you can do the rest 😊
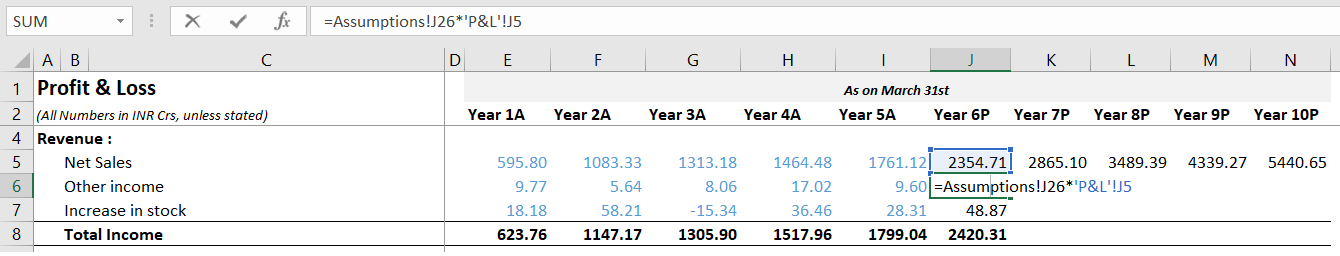
We need to multiply the percentage in the assumption sheet with the net sales and get the value. You can see from the screenshot above that I’ve done this for other income and ‘increase in stock.’ Here is how the fully projected Revenue numbers look –
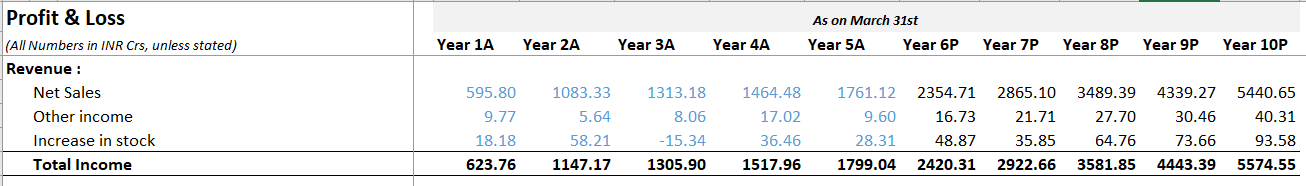
We can do the same thing for the expense as well –
Next is the calculation of Profit before tax (PBT), which is essentially the difference between the total income and the total expenses. After calculating the Profit before tax, we need to calculate the tax amount. The tax amount calculation is a very tricky job, and one would need the auditor’s help to arrive at the exact value. Since we must continue the model, we will depend on the averages.
To calculate the average, we have to calculate the tax paid with respect to the PBT in percentage terms. For example, in Y1, the tax paid is 24.15Cr against the PBT of 71.2Cr. In percentage terms,
= 24.15/71.2
= 34%
I can now do the same math across Y1 through Y5 and get the yearly percentages. Once the percentage is in place, I can find out the average across the last five years and treat that as the tax percentage for year 6. You can do this math in one shot in excel –
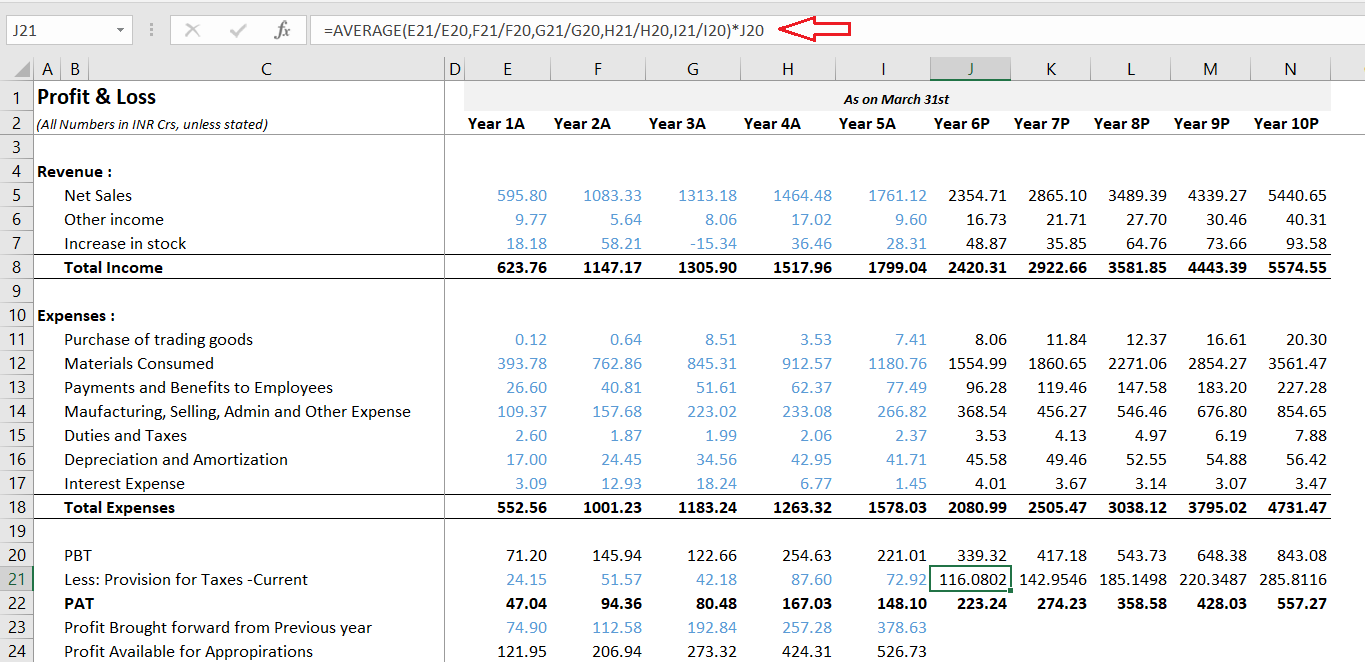
Please get comfortable with this technique; we will be using it again shortly. Anyway, we now have the PBT and the provision for current year taxes, PAT of the company is PBT-Taxes, which I’ve calculated.
We are now the last leg of P&L projections. I want you to take a look at this section of P&L –
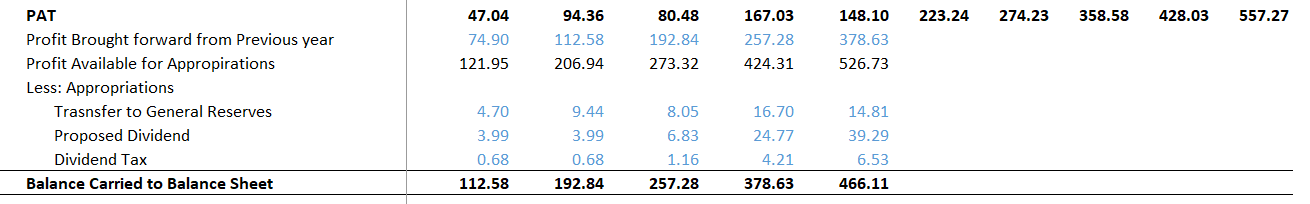
The previous year’s Profit is the last year’s closing balance, i.e., ‘balance carried to balance sheet.’ Yes, we apply the base rule again. We now add up the PAT and the Profit available for appropriation to get the total corpus available for allocation.
The transfer to the general reserves is based on the PAT. Here is a tricky part, we have to calculate the appropriation to general reserves, which from P&L goes back to the Reserves schedule. The dividend and dividend tax, too, are calculated. All these calculations are made exactly like how we calculated the tax provision.
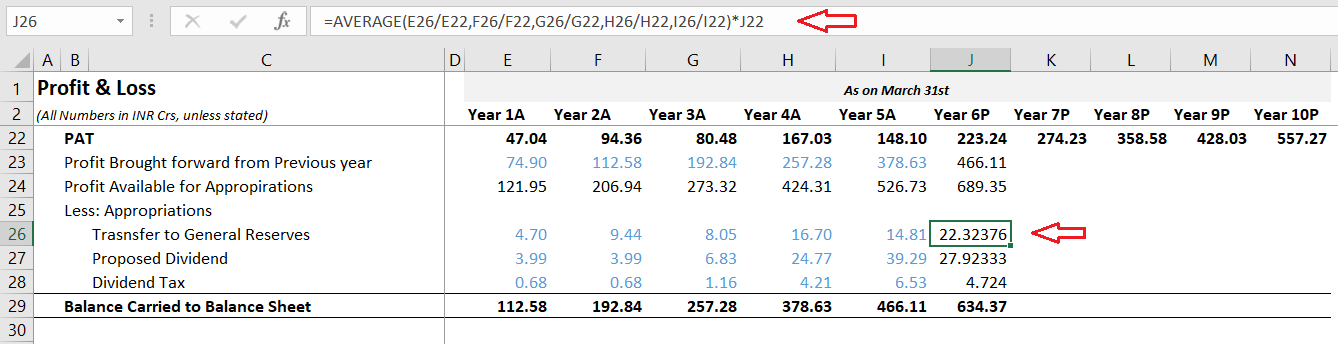
Now the closing balance of Rs.634.37Cr for Year 6 is the opening balance for Year 7 and so on. Here is the complete projected P&L for your reference.
We have an old task to complete before moving to the balance sheet projections.
12.3 – Reserves Schedule
We were stuck with the reserves schedule because we had no new yearly additions to the general reserves. We can now pull that data from the P&L and complete the reserves schedule.
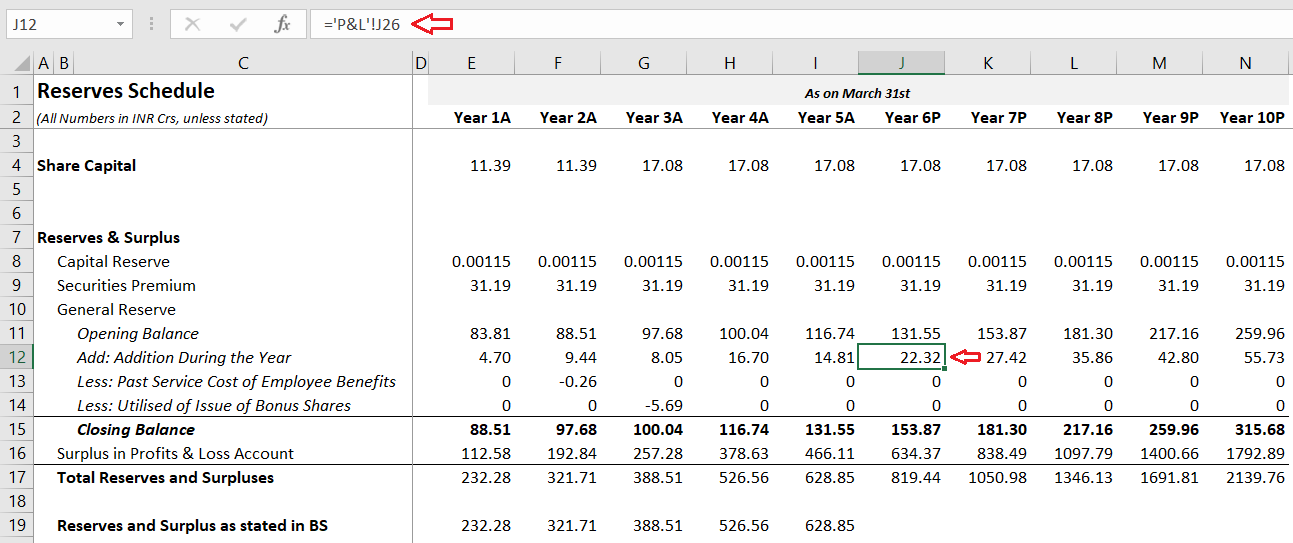
Of course, we will pull the reserves schedule data back to the balance sheet. I hope you appreciate how the model is integrated with numbers moving from one sheet to another. The model will only get tighter from here, and even after this many years, I get excited looking at these financial models slowly taking shape 😊
Over to the balance sheet.
12.4 – Balance sheet projections
The balance sheet projection is very similar to the P&L projection. Like the net sales in P&L, the gross block is the alpha line item in the balance sheet. Most of the balance sheet assumptions are based on gross block. I will skip through the few line items in the balance sheet that I think is straightforward and post the snapshot for your reference –
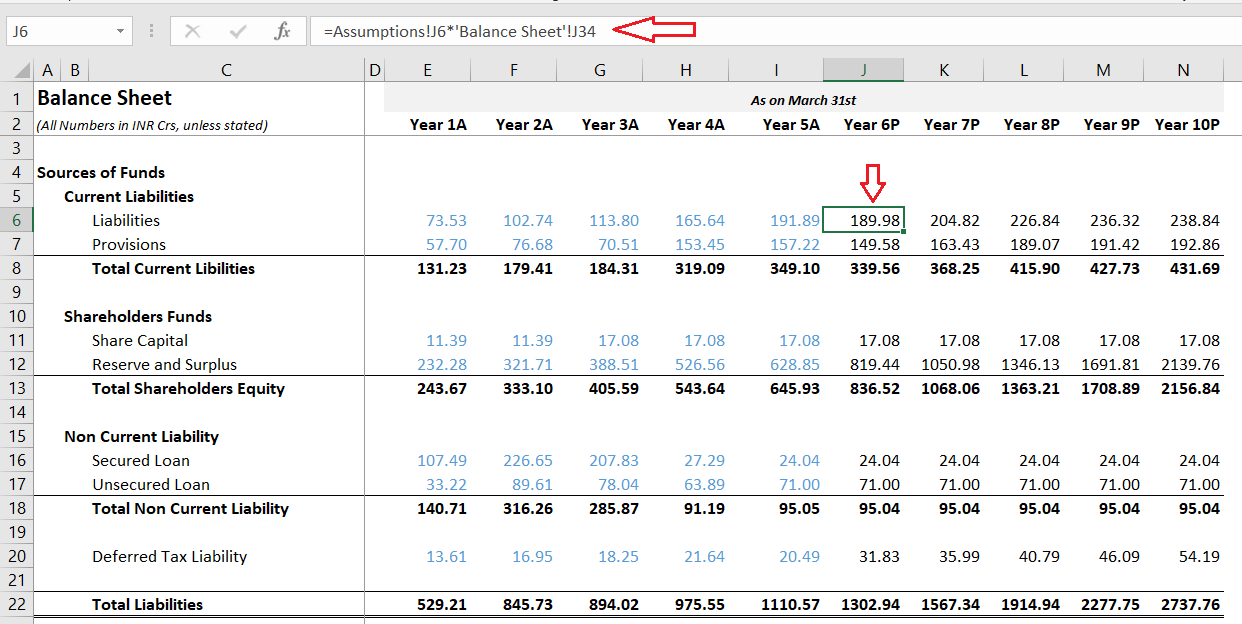
Here, current liabilities and current provisions are calculated as a percentage of the gross block. Shareholders’ funds and loans are calculated separately in their respective schedules. Deferred tax liability is calculated as a depreciation percentage (from asset schedule).
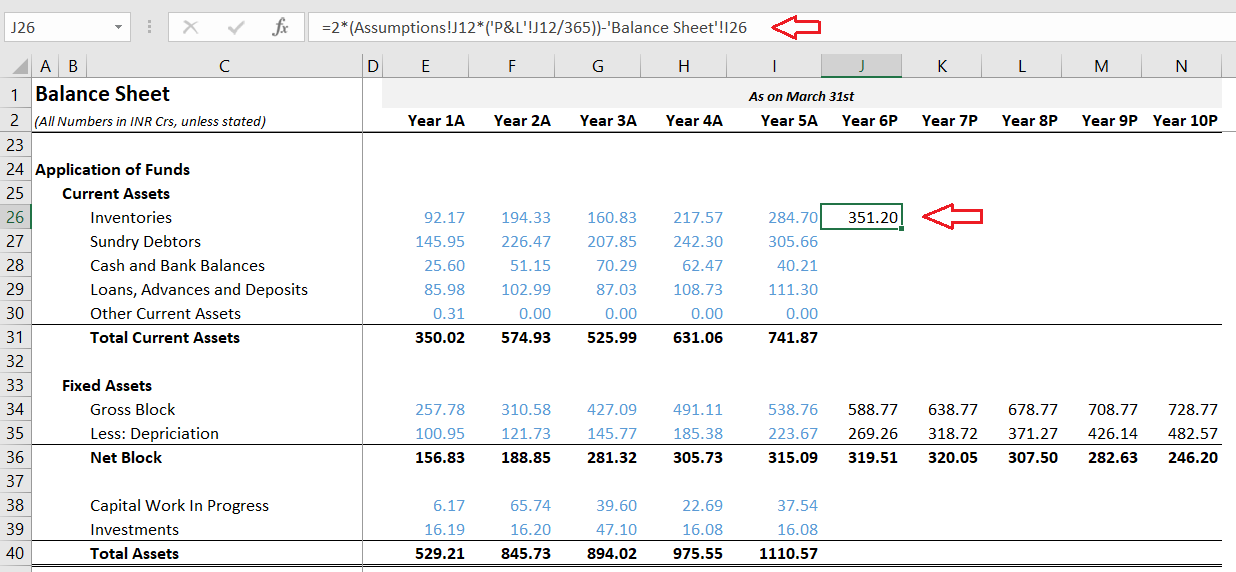
Moving ahead, we have the application of funds or the assets side of the balance sheet. The first line item we have to deal with is the inventory. We probably need to spend some time on the inventory.
The inventory value that we see in the balance sheet is the Rupee value of the inventory. We take the inventory data and calculate the ‘Inventory number of days, which is the number of days the company requires to covert the inventory to actual sales. The inventory number of days was calculated in the assumption sheet.
In a sense, the inventory number of days helps us develop an opinion on management’s efficiency, the product’s popularity, market acceptance, etc. For the future years, we take the average of the inventory number of days.
We have the inventory data in Rupee terms in the balance sheet; we have the inventory number of days in the assumption sheet. We also have the inventory number of days for the future years. We now have to convert the inventory number of days for the future years back to the inventory value in the balance sheet. To summarize –
Balance sheet inventory data >> convert to inventory number of day >> project using averages >> convert back inventory number of days back to Rupee value.
The formula to convert inventory number of days back to Rupee value is –
Two*(Inventory number of days * (Material consumed/365))-Previous year inventory.
I will not get into how this formula is derived as that would be a digression; maybe you can look it up online.
I’ve applied the above formula directly on excel (balance sheet), and here is how it looks –
The rest of the balance sheet projection is a breeze. I’ll make the projections as per the balance sheet –
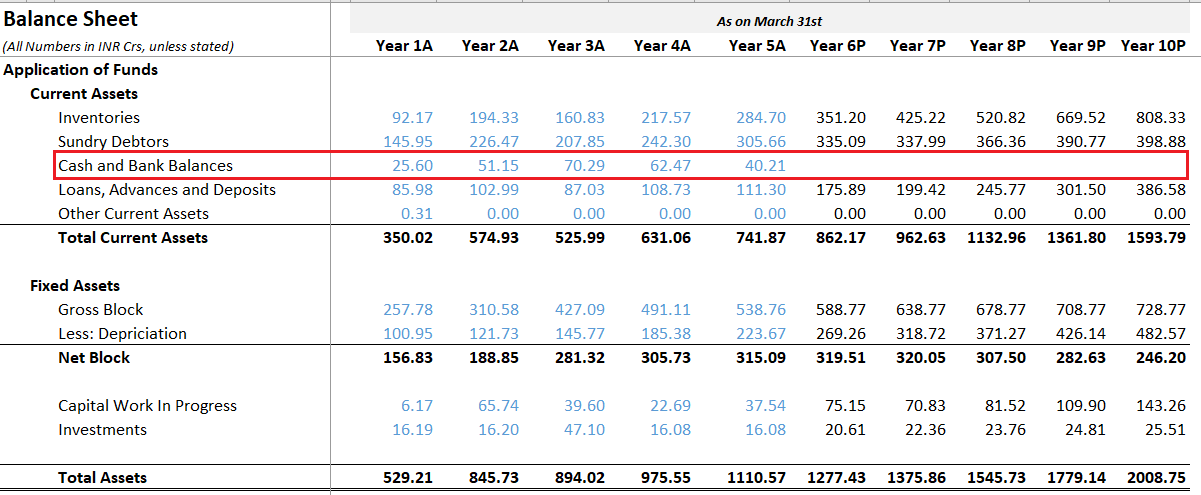
Well, congratulations on this mini-milestone. At this point, we have the complete P&L balance sheet projected, except for the cash and bank balance.
We will project the cash and bank balance in the next chapter by building the cash flow statement, which in my opinion, is a significant milestone in our financial model, and there is a reason for that. As you can imagine, the cash and bank balance numbers from the cash flow statement will flow back to the balance sheet. When the cash numbers hit the balance sheet, I’d expect the balance sheet to balance. So, let’s see if that happens in the next chapter 😊
One last thing before we conclude this chapter. We are dealing with so many numbers and projections we are bound to make mistakes. For example, two months after building this model, I may feel that the gross block number for Y6 is 700Cr instead of 588.77Cr; what should I do? Do I have to change the entire model?
No necessary. Since we are building the model in an integrated fashion, we only have to change in one place. The rest of the changes will reflect on their own. So don’t worry too much about the model’s accuracy just yet. We can play around with it as and when we want.
I hope you update your models and bring them up to this level. Do post your queries in the comment section.
Download the excel sheet used in this chapter here.
Key takeaways from this chapter
-
- Most of the P&L and balance sheet projections are straightforward. Take the cues from the assumption sheet.
- Taxes, general reserves, and dividends can be estimated directly in the P&L statement by taking historical ratios and then their average
- The appropriation to general reserves from the P&L statement flows back to the reserves schedule to complete the reserves schedule, which flows back to the balance sheet.
- Inventory is converted to inventory number of days and back to inventory in the balance sheet.
- All line items in the P&L and balance sheet are projected except for the cash and bank balances.
- To project the cash and bank balance, we need the cash flow statement
- The expectation is that the balance sheet gets balanced when the cash and bank balance number flows from the cash flow statement back to the balance sheet
- Since the model is fully integrated, we can change any number in the balance sheet without worrying about its impact on other parts of the financial model.
Hello Sir,
Actually, I have heard from my friend about some excel functions to forecast some it is like =forecast(x,known ys, known xs)
Something like that,
what my friend has done he has set year weight 1 to 10 from oldest to newest year (2020-29)
suppose we are forecasting EBITDA he has done like in (known x current year wight selected) , (then in known ys All previous 5 year EBITDA absolute figure f4 achoring) , (then in known ys he selected all Year weight previous 1 to 5 f4 achoring) in forecast formula and forecast the years ahead.
i want to know is to good function to forecast or rolling average is better, (can i forecast every material like this other then what forecasted in schedules). or this formula is for specific forecasting..
Ah, I cant really comment on this as I\’ve not used it myself Harsh.
Good Afternoon sir,
Sir I have projected My profit and loss and balance sheet, but I think there is some concerns which is balancing the balance sheet is there any chances that project balance sheet (Total liabilities will not be equal to total assets).
and If they are not equal is it my side problem or it happens..
2nd thing it for the P&L appropriations and retained earnings part (In the balance sheet of maruti suzuki in his income statement Net profit given 57670 and in retained earning notes to account it is 56760
and from the year 2022 to 2023 there are some mismatch while the closing Retained earnings of 2022 is different and the one given in 2023 in notes to account is different (which is causing a mismatch of like 271 millions..
Is it possible that there can be some mistakes like this Can happen in annual report? how can i correct it…
Harsh, no the balance sheet has to balance. Else there is something wrong, some linkages would be broken somewhere. So please double check. Yes, it\’s possible for such a mismatch to happen; that\’s one of the reasons why I prefer to take the previous year\’s financial data from this year\’s AR.
Hi
Respected sir,
Thank you for teaching us.
I have done financial modelling with amara raja batteries till 11th chapter.However, I am now faced with the challenge of making assumptions for the remaining line items, particularly under Non-current assets, Current assets, Equity, and Liabilities. Could you please provide guidance on how to approach and make assumptions for these specific line items?\”
Non-current assets:
Property, plant and equipment(Net block) : from asset schedule
Right-of-use assets
Capital work-in-progress : from assumptions with net sales
Other intangible assets
Intangible assets under development
Financial assets
Investments : from assumptions with gross block
Other financial assets
Deferred tax assets (net)
Income-tax assets (net)
Other non-current assets
Current assets
Inventories : from assumptions and formula
Financial assets
Investments : from assumptions gross block
Loans : from assumptions Net sales
Trade receivables : from assumptions gross block
Cash and cash equivalents : from cash flow
Bank balances other than (iv) above
Other financial assets
Other current assets
EQUITY AND LIABILITIES
Equity
Equity share capital : from Annual report
Other equity : from reserve shedule
Liabilities
Non-current liabilities
Financial liabilities
Borrowings : from debt shedule
Lease liabilities
Provisions
Deferred tax liabilities (net)
Other non-current liabilities
Total non – current liabilities
Current liabilities
Financial liabilities
Borrowings
Lease liabilities
Trade payables
-Total outstanding dues of Micro enterprises and small enterprises
Total outstanding dues of creditors other than Micro enterprises and small enterprises
Other financial liabilities
Provisions
Current tax liabilities (net)
Other current liabilities
Please guide me how to make assumptions for remaining line items so that balance sheet should match
I\’ve discussed the techniques of making assumption in detail in two parts – Part 1 – https://zerodha.com/varsity/chapter/assumptions-part-1/ and Part 2 – https://zerodha.com/varsity/chapter/assumptions-part-2/
Request you to kindly check the same.
Shouldn\’t the expense head \’Payment and Benefits to Employees\’ be cacluated in terms of growth rather than as a percentage of net sales because the assumption we made was in line with the growth. It should be Payment Benefit (Year 5A) * (1 + 4.09%) = 80.66 instead of 4.09% * Net Sales (Year 6P)
Like I mentioned, there is no hard and fast rules for these assumptions. The idea is to find consistency in trend.
Company has operation in foreign countries thus regular OCI due to currency exchange difference. So how should I project it ? Can I take average or I should consider the economic condition and consider a fixed number for projected year?
If the company has foreign income, then you need to look at currency risk in perspective. You can start with a fixed percentage to begin with and see how it goes. Hopefully that should give you a good trend.
How do you deal with Other comprehensive income? Should it be considered and then how should it be projected?
See the nature of the comprehensive income. If its one time, it can be ignored, but if its a regular year on year affair, then maybe you can model it based on how the nature of the comprehensive income.
Thanks karthik….But after projections of balance sheet of Relaxo,the balance sheet check is \”False\”.Also,for the balance sheet projected in this module,there is some difference between \”assets\” and \”Equity and Liabilities\”
Most likely it could be a small decimal difference?
Hi Karthik,
After completing the balance Sheet projection,should the balance sheet check(assets=Equity+liabilities) be done and checked whether it is \”true\” or \”false\”
Yes, True indicates that the balance sheet is balanced.
Hi Kartik,
First of all thank you for sharing insightful content regarding financial modelling i have a question regarding \”calculation of convert inventory number of days back to Rupee value\” as in the formula why are we taking the difference between the current year inventory value minus the previous year inventory value and also why we are multiply with 2 in the formula as i have search on the internet regarding how this formula is derive but i have unable to get the answer So, If possible can you tell how this formula is derive. It would be a great help.
Vishal, so there is a derivation for this, which I thought was not required in the context of this module, and I used the formula directly. Look up for inventory number of days formula and its derivation, you will get the explainer for this.
So, it means we have to make a rolling average to project for the future years. correct?
Yeah, thats right.
Hi Sir,
The co. I am working, in the P&L statement, there are some exceptional items which can be deducted form profit to get PBT.
So,my question is for initial 5 years I get the exceptional items amount from annual report, but how can we project it for future years or we have to assume it as \”Zero\”.
You can make a simple assumption and assume growth equivalent to the historical growth rate.
hello sir ,
The Other Financial Assets,Current Tax Asset (net),Other Current assets,ASSETS held for sale/disposal under both current and non current assets .with reference to what can i do assumptions(net sales ,gross block etc..).
You can try either gross block or net block.
Hello Sir, for projecting transfer to general reserves we have taken it as a % of PAT. Why haven\’t we taken it as a % of Profit available for appropriations as that is the final profit amount available with the company?
Ansh, as I\’ve mentioned in the chapter, you are free to make assumptions that you think make sense. There are no hard and fast rules here.
Wonderful Explainations KArthik, your work is greatly appreciated. Waiting for next chapter.
Happy reading, Saravanan!
Sir is the module on financial modelling complete?
No, uploading another chapter t\’row. At least 2 more after that.
How much time will it take to get the financial modelling in app so that I can get certificate.
Mansi, it will take some time because I\’m yet to complete the module on web first.
Can I get the certificate after the completion of financial modelling course.
Maybe once it is on the app, Mansi.
so should I keep it constant for the rest of the years
Yes, you can keep it constant for the first 2-3 years and reduce to zero eventually.
I dug deeper into the report of the company and found that as at the year 2021 there are total 16 subsidiaries out of it 14 are dormant and only 2 are active and one of the two active subsidiaries is the only manufacturer of the company at this time.
And the other subsidiary contributes towards a large part of revenue for the company.
and also one more thing that I found is that the company had a target of going debt free by the year end of 2022. And so here, can we assume maybe because of that they were selling their subsidiaries. and so from here we can keep the NCI constant for the rest of the years
Yes! Like I mentioned earlier, most answeres are found in the Annual Report and Management interviews 🙂
but if we look at the no.s of NCI it\’s continuously increasing as they are selling :- (all no.s in INR millions)
2017 – (25)
2018 – 136
2019 – (31)
2020 – (413)
2021 – (609)
But the thought is that if they are selling off rapidly, then eventually they should have fewer subsidiaries to sell, hence lesser inflow. Unless its a large company with heavy assets/subsidiaries.
no no no, that\’s not what I meant there is a note for non controlling interest and in that note they have given a summarised financial information of its subsidiaries, what I meant was that there is no information in the annual report about how the company is going to deal with it subsidiaries in the future are they gonna keep it or sell them.
P.S. – for the year 2017 & 2018 there are three companies given in the note related to NCI and for the rest of the years only two companies are mentioned in the note related to NCI
Sure, then in that case you can work on a tapering technique, wherein you assume that the company will continue to sell for the next few years and eventually it sells off everything towards year 5, hence NCI goes to zero.
as you advised on searching for disposal of subsidiaries for the non controlling interest, there is no such thing mentioned related to disposal of subsidiaries in future or anything like that
Thats strange, a line item in the balance sheet (that too with a significant amount), has no notes associated with it. Are you sure? If yes, you should reach out to the company (investor cell) for an explanation.
You have explained Fundamental Analysis series very well. Can we expect vedio series for Financial Modelling course as well? If yes, then expected time. Thank You.
Jeny, I\’m yet to complete the article series on this module, not sure if we will have video on this 🙂
Thank you so much for these much needed contents. It\’s a request if you could bring a module on crypto currency.
I dont know Crypto Shubham 🙂
the non controlling interest is changing YOY because they are disposing off their subsidiaries every year.
so how to project it
Please see if there is any guidance from the management about the disposal of subsidiaries. Else its difficult to model this.
What a great work you jave accomplished sir!! Thankyou very much for imparting this knowledge to us!! Sir how many sections are there in this module? And when is the next one releasing?
Thank you again!! And keep up the good work!!😊
Thanks, Devesh. We will be uploading the next one in 2 weeks max.
non controlling interest :-
year 2017 – (25)
year 2018 – 136
year 2019 – (31)
year 2020 – (413)
year 2021 – (609)
Please see the associated notes and get a sense of the nature of the line item.
my mistake again. sorry for that I wanted to ask for \”deferred tax assets\” and \”income tax assets\” how to deal with these two
Both these are similar…one comes on liabilities and the other on the asset side. You can deal with it in a similar way, Shivansh.
sorry my mistake, the deferred tax liabilities and income tax assets are not under financial assets they are written separately under non current assets
I guess we have discussed deferred tax liability bit already right?
under non current assets subheading financial assets its also written \”deferred tax assets\” and \”Income tax assets\” will that be also considered for loans advances and deposits
and for the non controlling interest it doesn\’t look like that it\’s a one time thing as the value of it is changing every year
Non-controlling interest is essentially an investment, right? Why would that change year on year?
and what to do with Investments accounted for using equity method
As I mentioned, you can consider this as a percent of gross block.
how to deal with investments
Consider that as a % of Gross block and make the projections.
and how to calculate the net sales for the future years
Thats what I\’ve explained in the projections.
how to deal with goodwill and Investments accounted for using equity method in the non- current assets
Goodwill is a function of a M&A of some other transaction. It maybe a one time affair, which means you can keep it as such.
in the balance sheet of the company which I have taken has no loans and advances and deposits instead it has financial assets in which it includes loans, trades receivables, investments is that the other name for loans, advances and deposits
Yeah, its the same thing.
in the inventory formula why have we multiplied it with 2
Its the formula, dint really want to get into the derivation of it.
the company which I have taken has one thing called \”non controlling interest\” in its liabilities side of balance sheet how to deal with it
Leave it as in if its a one time occurring thing in the balance sheet.
I got it, my bad I didn\’t look carefully
Sure, good luck!
for the deferred tax liability do we have to take the average for the past year and multiply it with the depreciation like we did for general reserves or is it something else
Finally sir , eagerly waiting for this ! THANK you sir for uploading this
when you will upload the next chapter ?
Thanks. Will be uploading in another 10 to 15 days.