12.1 – Open Interest and its calculation
Before we conclude this module on “Futures Trading”, we must address one of the questions that is often asked- “What is Open Interest (OI)?”, “How is it different from Volumes?”, and “How can we benefit from the Volumes and Open interest data?” Let me attempt to answer these questions and more in this chapter. After reading this, you will be able to interpret OI data in conjunction with the Volumes to make better decisions while trading. Also, I would suggest you refresh your understanding on Volumes from here.
Open Interest (OI) is a number that tells you how many futures (or Options) contracts are currently outstanding (open) in the market. Remember that there are always 2 sides to a trade – a buyer and a seller. Let us say the seller sells 1 contract to the buyer. The buyer is said to be long on the contract and the seller is said to be short on the same contract. The open interest in this case is said to be 1.
Let me illustrate OI with an example. Assume the market consists of 5 traders who trade NIFTY futures. We will name them Arjun, Neha, Varun, John, and Vikram. Let us go through their day to day trading activity and observe how open interest varies. Please note, you need to exercise some patience while understanding the flow of events below, else you can quite easily get frustrated!
Lets get started.
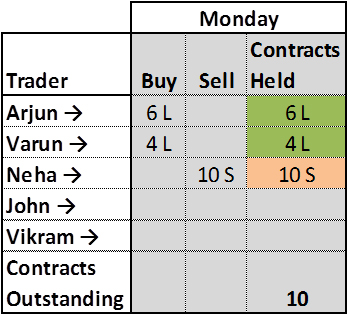
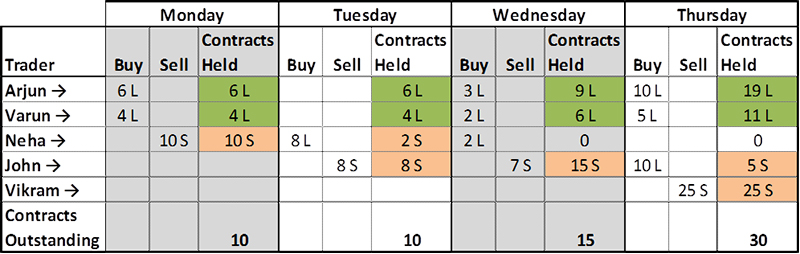
Monday: Arjun buys 6 futures contracts and Varun buys 4 futures contracts, while Neha sells all of those 10 contracts. After this transaction, there are 10 contracts in total with 10 on the long side (6 + 4) and another 10 on the short side; hence the open interest is 10. This is summarized in the table below.
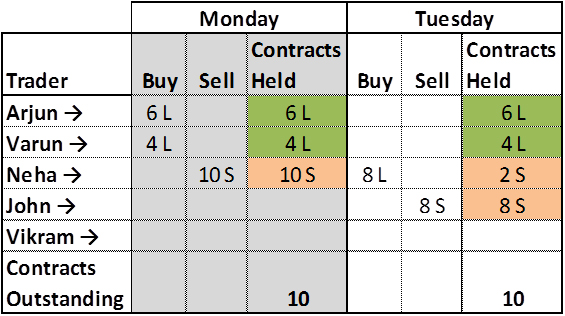
Tuesday: Neha wants to get rid of 8 contracts out of the 10 contracts she holds, which she does. John comes into the market and takes on the 8 shorts contracts from her. You must realize that this transaction did not create any new contracts in the market. It was a simple transfer from one person to another. Hence the OI will still stand at 10. Tuesday’s transaction is summarized in the table below.
Wednesday: To the existing 8 short contracts, John wants to add 7 more short positions, while at the same time both Arjun and Varun decide to increase their long position. Hence John sold 3 contracts to Arjun and 2 contracts to Varun. Note, these are 5 new contracts created. Neha decides to close out her open positions. By going long on 2 contracts, she effectively transferred 2 of her short contracts to John and hence Neha holds no more contracts. The table now looks like this:
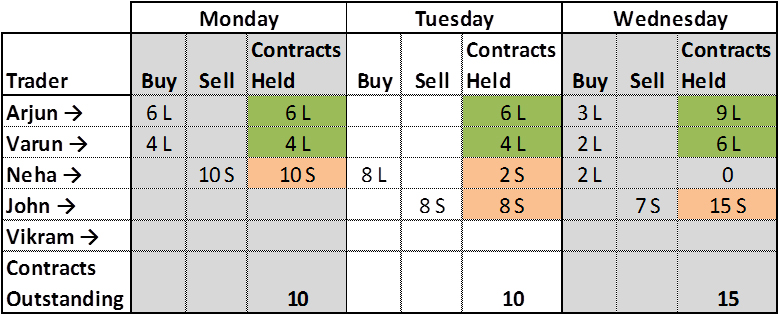
By the end of Wednesday, there are 15 long (9+6) and 15 short positions in the market, hence OI stands at 15!
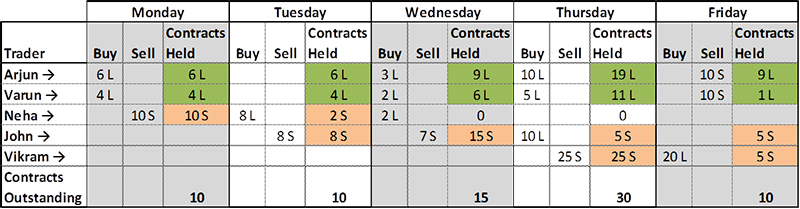
Thursday: A big guy named Vikram comes to the market and sells 25 contracts. John decides to liquidate 10 contracts, and hence buys 10 contracts from Vikram, effectively transferring his 10 contracts to Vikram. Arjun adds 10 more contracts from Vikram and finally Varun decides to buy the remaining 5 contracts from Vikram. In summary, 15 new contracts got added to the system. OI would now stands at 30.
Friday: Vikram decides to square off 20 of the 25 contracts he had sold previously. So he buys 10 contracts each from Arjun and Varun. This means, 20 contracts in system got squared off, hence OI reduces by 20 contracts. The new OI is 30-20 = 10. The final summary is listed in the table below.
So on and so forth; I hope the above discussion is giving you a fair sense of what Open Interest (OI) is all about. The OI information just indicates how many open positions are there in the market. Here is something you should have noticed by now. In the ‘contracts held’ column, if you assign a +ve sign to a long position and a –ve sign to a short position and add up the long and short positions, it always equates to zero. In other words, wealth is transferred from buyers and sellers (or vice versa) and no new wealth is created (like if you hold a stock and stock price appreciates, then everyone makes money). For this reason, derivatives are often termed as a zero-sum game!
Have a look at the following snapshot –
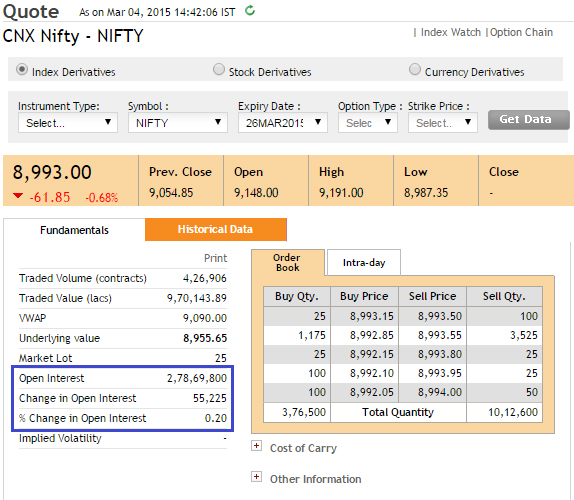
As of 4th March 2015, OI on Nifty futures is roughly 2.78 Crores. It means that there are 2.78 crore Long Nifty positions and 2.78 crore Short Nifty positions. Also, about 55,255 (or 0.2% over 2.78Crs) new contracts have been added today. OI is very useful in understanding how liquid the market is. Bigger the open interest, more liquid the market is. And hence it will be easier to enter or exit trades at competitive bid / ask rates.
12.2 – OI and Volume interpretation
Open interest information tells us how many contracts are open and live in the market. Volume on the other hand tells us how many trades were executed on the given day. For every 1 buy and 1 sell, volume adds up to 1. For instance, on a given day, 400 contracts were bought and 400 were sold, then the volume for the day is 400 and not 800. Clearly volumes and open interest are two different; buy seemingly similar set of information. The volume counter starts from zero at the start of the day and increments as and when new trades occur. Hence the volume data always increases on an intra-day basis. However, OI is not discrete like volumes, OI stacks up or reduces based on the entry and exit of traders. In fact for the example we have just discussed, let us summarize the OI and volume information.
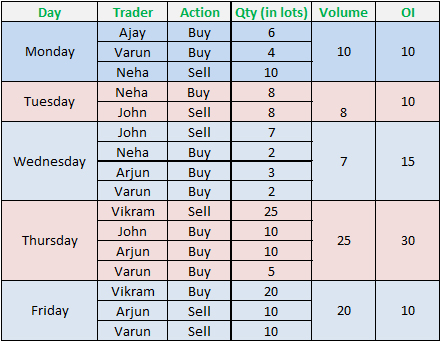
Notice how OI and volume change on a daily basis. Today’s volume has no implication on tomorrow’s volume. However, it is not true for OI. From a stand-alone perspective both OI and volume numbers are pretty useless. However traders generally associate these numbers with prices to draw an inference about the market.
The following tables summarizes the trader’s perspective with respect to changes in volume and prices –
| Price | Volume | Trader’s Perception |
|---|---|---|
| Increase | Increase | Bullish |
| Decrease | Decrease | Bearish trend could probably end, expect reversal |
| Decrease | Increase | Bearish |
| Increase | Decrease | Bullish trend could probably end, expect reversal |
Unlike volumes, the change in Open interest does not really convey any directional view on markets. However it does give a sense of strength between bullish and bearish positions. The following tables summarizes the trader’s perspective with respect to changes in the OI and prices –
| Price | OI | Trader’s Perception |
|---|---|---|
| Increase | Increase | More trades on the long side |
| Decrease | Decrease | Longs are covering their position, also called long unwinding |
| Decrease | Increase | More trades on the short side |
| Increase | Decrease | Shorts are covering their position, also called short covering |
Do note, if there is an abnormally high OI backed by a rapid increase or decrease in prices then be cautious. This situation simply means that there is a lot of euphoria and leverage being built up in the market. In situations like this, even a small trigger could lead to a lot of panic in the market.
And with this, I would like to conclude this module on Futures Trading. I hope you enjoyed reading through this module as much as I enjoyed writing it!
On wards to Option Theory now!
Key takeaways from this chapter
- Open Interest (OI) is a number that tells you how many contracts are currently outstanding (open) in the market
- OI increases when new contracts are added. OI decreases when contracts are squared off
- OI does not change when there is transfer of contracts from one party to another
- Unlike volumes, OI is continuous data
- On a stand along basis OI and Volume information does not convey information, hence it makes sense to always pair it with the price to understand the impact of their respective variation
- Abnormally high OI indicates high leverage, beware of such situations.
Updated : 24th Aug 2016 – If you use intra day OI information as a critical input for your trading strategy, then you should read this before you trade.
I was searching for stock market classes in Jaipur and came across JamaDhan. After completing my course from there, I can say it is one of the trading institutes in Jaipur.
Hi Karthik,
I see the OI is updated only every 3minutes.
When I query thru API, say for NIFTY Futures, I get the same value at 09:18, 09:19 and 09:20. It changes at 09:21, 09:24 etc.
As per definition, it is the number of Open Contracts at that point of time.
So, now if I get the value at 09:24, is it the OI at 09:24 OR OI of 09:21 updated at 09:24 (somewhere I saw comment that OI is delayed 3 minutes)?
Is my understanding correct ?
If at 09:24, OI is of of at 09:24, why can\’t exchange update at every minute ?
I think its best if you post this query in the API forum itself. That said, from a strategy perspective, I\’d be more comfortable using the EOD OI and not intrday OI.
Hi, I have question on OI We see OI and Price relation on CALL and PUT side. How to interpret market movement both at same time
This chapter has details on OI interpretation, request you to kindly check that.
This chapter explains Open Interest in a very clear and practical way. The step-by-step examples make it easy to understand how OI changes with new positions, exits, and transfers. The comparison between OI, volume, and price is especially useful for traders to judge market strength, liquidity, and possible trend behavior instead of relying on numbers alone.
Thanks Omesh. Glad you found the explanation useful. There has been some changes to how OI is interpreted recently, you should check the video here – https://youtu.be/I4EoHTw3SG0?si=ryPAdpujKkJZUng3
Date Expiry Date LTP SetPrice No.Contract turnover OI changeOI underlyingvalue
01-Oct-25 30-Dec-25 5676 5676 34 288.38 3750 3750 5606
03-Oct-25 30-Dec-25 5731 5731 44 377.95 7500 3750 5657
06-Oct-25 30-Dec-25 5764 5771.5 16 137.89 8100 600 5694.5
consider this is first 3 days of a Stock FO contract lot size 150.
I am not really sure how its possible for a stock fut to have 34 contract and OI 3750 on first day .
on the first day it should start from 0 correct ?can you please explain here . whats happening
Not really, there could be rollovers right?
Open Interest Calculation method is changed by SEBI.
SEBI vide circular NCL/CMPT/70194 issued on September 15, 2025.
How to calculate increase / decrease in Open Interest as per new formula suggested.
But the interpretation of OI still would remain the same, Pravin.
Calculation changes has made Open Interest calculation difficult during live mkt.
I feel if there is simple tool to auto generate the OI at combined stock level it will be great help.
If you have any tool which gives combined OI information based on new formula suggested by SEBI then please send.
Maybe check with Sesnibull for this?
Hi karthik,
How to interpret future and option oi for entering trade in intraday.. also suggest if there are other methods other than oi and price action.
Thank you.
We have discussed everything there is to OI here. Do check out the courses here, we do talk about options and OI – https://varsitylive.zerodha.com/home
Price: Decrease OI: Increase Inference: More trades on the short side
This inference is for a Stock or Futures Contract.
Largely yes, you can use for options too.
Hello Karthik,
When we say , for example, when price increases and OI increases , we say there is long buildup. The \”price increases \” we are referring to , is it increase in premium of particular option strike or the price of the underlying stock itself ?
No, it means the number of positions is increasing.
very well explained. I must say this thing is not available on internet
Happy learning!
Hello,
In your article, you have provided a link with information regarding Intraday OI information . This was the case back in 2016. Please let know if this is true even today ?
\” Updated : 24th Aug 2016 – If you use intra day OI information as a critical input for your trading strategy, then you should read this before you trade.\”
Thanks,
Gourish
Yes, it does. By the way, please keep a track of the sessions happening here – https://varsitylive.zerodha.com/home , we will do one options analysis and OI interpretation.
Thanks Karthik.
Happy learning!
Hii karthik sir,
Good evening.
I\’ve a doubt, since option sellers are considered as more powerful as compared to buyers. So, any change in OI is basically bought by the action of option writers.
In that scenario, If price & OI, both, are increasing, it means more Puts are being sold and if Price & OI, both, decreases then PE sellers are exiting their positions, similar for Call writers.
Am I right ?
Yes. So OI is indicative of both players. Only if both players participate OI changes. We often associate price with OI to draw up a narrative.
Hi Kartik,
Was going through the F&O FII data. Usually when a general index/stock call OI is interpreted, if there is high call OI on a certain strike, it is said that that price is the \”resistance\” and that sellers don\’t expect the price to breach that easily (usually, right?).
But when it comes to interpreting FII call OI, if its increasing, how do we say that FII are \”buying\”/long option and not selling at that price? It could be either right? Or is there specific data from NSE which says that they have actually BOUGHT calls instead of selling them?
Correct me if I\’m wrong. Thanks
Yes, usually resistance points attracts OI. But just because OI is there does not mean there is resistance. To interpret what is happening, you need to look at the price and volume.
So, if I put a short request of 500 options (sell order of 500 options) and the buyers buy only 400 of them, I suppose the open interest would be only 400 and not 500, right?
Thats right, OI will be only to the extent of whatever position is open.
sir mujhe ye Janna hai ki nifty ya kisi index ke mai max Kitne lots buy kar skta hu please sir reply mai apko follow karta hu please sir reply
Mohit, you can buy as many lots as possible. No restriction.
Hi sir As you said above Nse illustration your open interest interpretation As of 4th March 2015, OI on Nifty futures is roughly 2.78 Crores. It means that there are 2.78 crore Long Nifty positions and 2.78 crore Short Nifty positions. The old NSE website is clearly showing open interest in crore or lakh but our new NSE website open interest of indices and stock are given in open interest(contracts) – 26 or 50 or some numbers. so how to understand that exactly how to get open interest in crore or lakh in new NSE website
I\’d suggest you check the Sensibull option chain for this, OI is given in a much better way 🙂
What will be the difference in trading far month contract, i mean standing in july, if i trade in september contract, in the place of july contract, i will get the same profit/loss. i mean if i underlying asset change by 1 point, july contract will change 1 point and september also change by 1 point.
Now the question is why dont people trade with the far month contact, like i got the view that gold will touch 7200(g) from 7000, and i know that it will happen within a week or two. But if my assumption failed i incur a loss within 30 july, but if i trade in sep, i have the time till 30sep.
The liquidity is higher in current month contract Jeesu, which means you can buy and sell these contracts easily without having to deal with impact cost.
Oh if my understanding is right sellers will book losses and close their position and enter into option selling again at higher price with an assumption that they will get profits latter. but when the sellers book losses and close there position they are not forcing the buyers to close their positions right ?
if sellers once book losses and don\’t want to enter selling position again at higher value then how come the OI means Buyers= sellers?
There are always new sellers coming in, you dont have to thing of sellers as a whole. At any point there will be a batch of buyers and sellers in the market.
Hi Karthik,
Assume one day there was some good news and 100 buyers entered the market and market started going up and money started flowing from 100 sellers . So those sellers panicked and started booking losses and closing there contract, will buyers also be forced to close those contract(the 100 buyers don\’t want to close there contract as they are in profitable position) ? Assume there are only 100 buyers and 100 sellers.
But sellers will be happy to sell at higher and higher prices right?
when the very first time person A long 1 contract and person B sell a contract. open interest would be 0, 1 or 2?
That would be 1 contract.
If i combine hedging,OI and FII data then how i know FII is bullish or bearish? How i know FII is hedging or take a neked position?
Thats impossible to figure out 🙂
As per previous chapters the contracts ends on only at expiry. So how OI is down in the example? If some one sell his long position another one is buy that position.
Yes, the OI keeps changing as and when the positions are added and squared off in the market.
Thank you sir mr.karthik rangappa
Happy learning!
Greetings,
I fail to understand 1 thing, from what I know all long or short positions need to be squared off on the day of expiry, so in your example where you showed that at the end the OI was 10, can the OI be anything else than 0 and if so what does this indicate?
Thats right, all open positions are closed upon expiry. Hence OI becomes zero for all contracts upon expiry.
Hi Karthik,
Symbol Date Expiry Open High Low Close LTP Settle Price No. of contracts Turnover * in ₹ Lakhs Open Int Change in OI
NIFTY 20-Feb-24 28-Mar-24 22307 22372.75 22225.4 22359.15 22370 22359.15 14034 156547.42 1436550 77650
NIFTY 21-Feb-24 28-Mar-24 22397.95 22409 22175 22211.8 22185 22211.8 26912 300149.87 1705400 268850
NIFTY 22-Feb-24 28-Mar-24 22218.5 22410 22093.6 22383.2 22410 22383.2 45705 508152.16 2543200 837800
second row volume of 26912 but change in OI is 268850, my understanding is that volume is number of contracts eith bought/sold. oi is number contract yet open in the market. from 1436550 oi, if only 26912 contracts are traded how did oi increase by over 2L. can you please make me understand this
OI is cumulative…so today\’s OI = Y\’day OI plus change in today\’s OI. However, volume is reset to zero at the end of the day and it starts fresh the next day.
Good day, everyone. I observed an interesting scenario in the Nifty market today. Despite higher call open interest (OI) than put OI at the 22100 level, the futures price was holding above 22150. Strikes at 22k and 22050 exhibited more puts than calls. However, the spot price remained below 22100. When the spot price surged above 22100, there was a significant shift in the 22100 OI. How should we interpret this data? Does it yield better insights when analyzing spot or futures? Theoretically, it aligns with futures analysis, but practical observations might suggest otherwise. What\’s the most effective approach to interpret OI data?
Its just that at the start of the market, people continued with the bearishness of March 13th, hence more PUTS. As the markets held and put up some gains, the calls were in favor.
I am zerodha account holder.
Why some times in Option Chain , Change in OI column shows negative values.
Possible it happens when the OI decreases with respect to the previous day.
Hi sir,
I think if on a given day, 400 contracts were bought and 400 were sold, then the volume for the day is 800 and not 400 as you said here.
800, if you try and count it twice. But best to look at volumes only at the transacted level.
I Like introduction part of share and future market,
it very beneficial to me rest topic i feel only making fool to traders and generate breakage income of broker.
Happy learning 🙂
Well written article, lucid explanation with playable examples. If possible, pl guide where OI data are accessible and how can these be made handy for instant use. Thanks for taking pains in writing.
Thanks, Umed. Glad you liked the content. Maybe you can check Sensibull for the OI data.
More confused
You can ask your queries here, will be happy to answer and clear your confusion.
Hi sir,
I have a doubt – when a buyer sell its contract,before the expiry date of the contract, then in the real market this contract will close or rollover to any other ?
It will cease to exist upon the expiry of the contract.
Srikant ji
You rarely disappoint but you complicate a simple thing here you go in circles trying to complicate it as much as you can
If CE of nifty is 10000 for a particular strike what it denotes.
Very Very disappointed had to go through numerous videos to get it right.
If adani ent at 2500 price has 60,000 OI what to conclude ?
Rgds
Mukesh
Not sure whom this message is intend for 🙂
Thanks Karthik sir for your appreciation. it means a lot to me.
Happy learning!
Very very thanks to all the team of Zerodha varsity for providing such an excellent study material. Great job by you all. nice compilation, very nice examples, good study material, proper flow of topics and their details. You have created my interest in studying and understanding share market. Its wonderful to learn from Zerodha varsity.
This topic was so difficult to understand. Thanks for making it so simple and explainable with such a good excel chart. I would like to share the example which i used, to understand this topic.Lets take an example of playing cards. there are two types of cards B (buy) and S (sell) representing a contract and any number of players representing the traders. pick B and S both cards as a pair at a time from cards stock. the frequency with which cards are picked up from cards stock will be represented as volume(one number given for one B and S pair). these B and S cards will be shared by any two players, one each. the moment player makes the pair in his hands (B and S), he drops the pair from his hands and keep that pair cards aside (squared off contracts). so the remaining cards in the hands of players (that will be divided by two for a pair)will be Open Interest. I hope i am not making any mistake here in this example. Thanks again to zerodha team. Thanks to Karthik Sir.
Thanks for the kind words! I\’m glad you liked the content on Varsity.
Your analogy is roughly right. Its in the right direction and also very creative 🙂
Hi, Rangappa,
I have installed your kite app in my i pad. I find it difficult to plot cpr in trading view. Does this app provide this facility?
I\’d suggest you speak to the support desk once for this. They will probably help you with this over phone.
Query related to margin:
I want to Short option of current expiry (weekly/monthly). Of price 5-8rs quantity 1020 (68 lot).
With minimum margin with help of hedge/future.
Request to suggest a way to reduce margin.
Margins are stipulated by the exchanges, no one can change these margins.But you can reduce risk and margin by having counter positions.
Why is NRML order restricted in Currency trading to limited number of lots, even if I\’m doing any debit/ credit strategy.
As the no lots are limited. I cannot use my complete capital. This is very annoying.
How can I get to increase no of lots for my currency trading (Option Strategies) so that I could deploy my capital?
Broker’s have overall OI limits that they can have with the exchange, once we get close to these limits, we limit client wise open positions. Read more.
https://support.zerodha.com/category/trading-and-markets/margins/margin-leverage-and-product-and-order-types/articles/why-am-i-unable-to-place-fresh-nrml-orders-in-some-currency-contracts
So, OI only give the number of contracts but not the contract value right? Coz each contact will consist of various lots?
Price increase and OI increase indicates Trader’s Perception More trades on long side, but actually equal no of trades are created on short side also. Shall I assume market movers view only considered ( As higher probability of being them right).
Market perception is developed when we associate price movement with OI.
can you guide me on stock options where to put stop loss. for ex lets say i buy an SBI 500CE at 11.2 then what should be the criteria to put stop loss ?should this based on option chart or spot chart?
Ravi, do check this once – https://www.youtube.com/watch?v=1kQjXFL4Mfc&list=PLX2SHiKfualEyD05J9JsklEq1JFGbG6qJ&index=10
The explanation of what is OI is really confusing in this document. I saw another writeup on OI which is very clear.
Sure, does not matter where you read from, as long as you understand the concept 🙂
Happy learning.
in OI data if Price Decreses and Volume Decreses then \”Bearish trend could probably end, expect reversal\”
Explain above sentense in Simple Words please
Pratham, we have explained that in the chapter itself. Can you give it a quick read?
Hi Karthik, I have a question as I am still confused about OI data. As explained above, OI is no of open contracts. How is the same shown in the option chain. Correct me if I am wrong. This is what I understand till now.
As the option chain shows two OI for a Strike Price (41000) one at Call Option and other at Put Option.
Suppose, OI for 41000 CE is 15.4L and the same for 41000 PE is 14.0L. This means that the open contracts for 41000 CE is 15.4L whereas the open contracts for 41000 PE is 14.0L; and this has nothing to do with Long Position / Short Position etc., as the same is just a number which can be interpreted in conjunction with other numbers.
Thanks & regards.
Thats right. OI just tells you the number of open positions and nothing really about the directional bias.
Dear Mr. Rangappa,
Thank your for the valuable insight on OI. if i have understood correctly, does long unwinding mean that the trend is turning bearish and short covering mean the trend is turning bullish.
Yes, traders unwind long positions when the feel the trend changes.
What is COI by NT ?
And how to calculate it ?
Where did you find this?
Ok oi is all opened contact
Volume is count lot size/ quantity
I\’m confused becouse there shere data
10,000 volume but there lot ya quantity basied say
Volume like show in stock 100k thi 1 Lakh there shers , in stock
But in derivatives lik nifty and future stock ther what depend to say it quality ya lot side
What there pres in lot ya quantity
I\’m undstand of stock it ok volume is in 1 share
But option I\’m don\’t understand it\’s lot ya single equity
Its the same for both options and futures. Lot size only.
Thank You Sir , Got it
Watched the video , great help
Sure, happy learning 🙂
Ok Sir
Regarding Options generally we are speaking , if OI interest increases with price , then it is bullish
My doubt is which Open Interest is considered , CALL Open Interest or PUT Open interest ? Please advise
Price OI Trader’s Perception
Increase Increase More trades on the long side
Decrease Decrease Longs are covering their position, also called long unwinding
Decrease Increase More trades on the short side
Increase Decrease Shorts are covering their position, also called short covering
To make this analysis, you need to look at the ATM option of both CE and PE. Here is a video that will help you put this in perspective – https://www.youtube.com/watch?v=bCRw8YN-4QY&list=PLX2SHiKfualE4o4joBMXM_YHGBKnZSQbs
Sir , We are generally talking ,
If Price increases and Open interest increases it is long build up
If Price Increases and Open interest decreases it is Short Covering
If Price Decreases and Open Interest increases it is Short build up
If Price Decreases and Open Interest decreases it is long Unwinding
We have CALL Open Interest and PUT open Interest in NSE option Chain , actually which Open Interest is considered here ??
Everywhere it generally mentioning as Open Interest ,
Please help me
This is with respect to futures open interest 🙂
What does this means?
Long call OI is increased by 38%
short call OI is increased by 97%
Long put OI is increased by 33% and
Short put OI is increased by 24%
Does it mean 38% increase in long call OI included in 97% increase in short call?
It just means that the number of open positions in the market has either increased or decreased wrt to the previous day.
i have two questions,
1) in the chapter 12- open interest , price vs volume vs traders prediction and price vs OI vs traders predictions , do i have to check volume and OI data on PUT side or CALL side in the option chain data with sensibull.
2) Does this option chain OI or volume is also applicable for future contract (i mean this data is inclusive of future contract) or it is only for option contract, if so then where i can get the OI and volume information for future contract.
1) YOu can check strike-specific call and put OI. I think Sensibull gives this info
2) OI is applicable, there is no option chain of sorts for futures.
Karthik,
Quick question :- If i wanted to trade 480 lots ( 480*50) of Nifty which is 24,000. Should i look for volume or OI during the day ?
Thank you !
Regards,
Raj
Yes, better if you do. But Nifty is fairly liquid enough to absorb 500 lots.
@Karthik
No right ? without creating/changing volume is it possible to change the OI ?
No right ? so volume should be greater than equal to change in OI but not less than
Please provide in detail. Thanks
OI is on a cumulative basis, and gets carried across all trading sessions up until the expiry of the contract. Volume is not. Also, I need to double-check once on how the exchange is reporting volumes, someone mentioned there is a change, not sure though. Maybe you can as well and update here if you get info.
Hi
If you see the volume & OI at 12.10 and 12.11 on 11th Oct 2022, for ICICI Oct Future is as below.
At 12.10 Vol = 35750, OI = 83.3m
At 12.11 Vol = 78375, OI = 82.6m
So how is it possible to reduce the open interest by 833L – 826L = 7L with just 35750 volume.
Please let us know.
Volume and OI are two different things right?
Hi Karthik, one question I really need help with – In the first situation, Neha sells 10 contracts to Arjun and Varun. So the OI is 10. But I\’m wondering from where did Neha get those 10 contracts to sell. I mean from where do those 10 contracts actually initiate?
The exchanges introduce these contracts, Pradeep. Th easiest way to think about this like how a car manufacturer makes a brand-new car and out it up for display. Neha buys the car and immediately sell it to Arjun. The number of cars on road = 1.
Dont take the example in literal sense, its just to help you get the concept 🙂
In option chain of NSE on 28th sept
Oi is well explained.From this we understand that total nos of L and S will be equal. But I have noticed in the option Rain sep 205 PE the total no OI in L is 66 and in S is 9 on close of 27/09/2022. Will you please explain how this is possible and in my opinion both must be of same number.
Where did you see the long and short OI?
How can I got master in oi and become a perfect trader on option please help me for brightfull future .if u help then advance :-happy teacher day 🙏
Thanks, Tarun. We have a ton of content here. Please go through it and let us know if you have any queries.
Sir. Thanks a lot for the good work you are doing here. It helps a lot.
One request… can you please tell me from where can I get the Futures OI Contracts data.
You can check the market depth page of any futures contract you are interested in to get the OI info.
Dear Sir,
Kindly explain OI in value term\’s
I have a question on OI
If Call OI is in \”+\” sign, Is it \”buying Calls\” or \”Selling Calls\”
Example : @17450 Call side it is showing as Total Contract of 12,90,00,000 and underneath to this showing as negetive (2,99,050) and put side showing it total contract as 30,66,300 underneath to this showing as positive 23,17,250.
Siva, +ve indicates that the OI for today has increased compared to y\’day and -ve OI indicates that the OI has decreased wrt to y\’day. There is no buying call OI and selling call OI concept. 1 OI reflects 1 buy and 1 sell.
Sir position square off and position sell is same?
Square off is when you close out on an open position. For example, if you have a long trade, to square off you need to sell.
hai sir
volume vs no of contracts, which is the most important thing to see before to initiate future trade.
Both are equally important. But the main decision to buy or sell should come from either FA or TA.
Hi Karthik,
When an option, say CE, expires OTM without a buyer, you mention it will be settled by exchange. But where is exchange getting the money for settling it without a buyer in place?
It will be from the seller who would have sold that to you, remember if you have a open position not squared off, that means there is a seller who has an open position too.
How can I get data for Order FLow Analysis ?
Check this – https://zerodha.com/varsity/chapter/supplementary-note-the-20-market-depth/
How can we get data during live trading on:
No of new contracts bought or sold by buyers and Sellers?
No of Contracts which has been squared off ?
e.g. when for a particular strike price if OI is decreasing it implies traders are squaring off their positions. Then, how many of them were sellers and how many of them were buyers, from where we can get this data?
Do check Sensibull\’s platform for this, Anupam.
Thank you for the article. I am still new to F&O. Trying to learn how NSE option chain can help to buy or sell PE or CE and at what price. I have a question: Today 4/28/2022 Thursday weekly and monthly expiry day. I saw option data (Banknifty)and understood PCR is 0.69. It was kindly of similar thing last Thursday too. During last week and this week market was negative till Wednesday. Being high OI and PCR around 0.6 I was thinking people who were short would be covering their positions on Thursday and the index banknifty should be positive throughout. That was the case last week however today Banknifty there was gap up opening however later it was in negative and suddenly after midday it started moving positive and ended in green. Is my understanding correct did market ended in green because of short covering due to expiry combination of High OI and Low PCR. Reply would be greatly appreciated.
If it was any other day\’I\’d have debated but since it was an expiry day, then yes, short-covering rallies and long unwinding falls are common. I\’ve seen this happen across many expiries now 🙂
What is the relation between Volume and Open Interest in case of Options and Futures?
If OI is Increasing then volume should increase or decrease and
If OI is Decreasing then volume should increase or decrease
Have explained this in the chapter itself 🙂
OI and volume are two different things.
What signals do we get or what interpretation can be made when
1. Price Increases, Open Interest Increases while Volume Decrease
2. Price Decrease, Open Interest decrease and volume decrease
Hi sir,
Can you explain change in open interest.
Thats what I\’ve tried to explain in this chapter 🙂
Hi Karthik,
Please explain me what happens on weekly expiry day? Because I saw some open interest in nifty option chain in NSE site on a particular expiry day even after market closed. Ideally, on expiry day everyone should close their contracts and that should make the OI to 0. But I did not see that was happening. Am I missing anything here or is there any reason for that?
Thanks!!
Thats because NSE would not have updated the OI change in real-time. But yes, the OI for all contracts goto to 0 post expiry.
What is the meaning of munus (-) before change in open interest.. eg (-47.21%) or -5436.
It means OI has decreased compared to the previous day.
Whether OI indicates total number of effective contracts for a particular expiry month/week. In the given example total number contracts reduced to 10 on Friday from 30 on Thursday. How it is possible before expiry?
Its the total number of open contracts at any given point. The same can increase or decrease any time.
Sir, what is difference between transfer and square-off
cant u/s this 🙂
They are similar in this context. For example, you are long on a trade, when you square off, you are essentially transferring your position to someone else in the market.
Hello, I usually gauge PCR ratio by taking only 1000- 2000 points away from strike (1000/2000 points upside and 1000/200 lower side) depending on the volatility we are facing because market making more than 2000 points move is very short term I believe 99% not possible. In this current high volatile scenario, march 3rd PCR showing 0.7 ( which might make me believe market bottomed out) but 31st march PCR is 2.8 which is too bearish. So how do I interpret this scenario?
Sathvik, you can use PCR as a contrarian indicator as well. Do check the PCR chapter.
Hi Sir,
Total how many Contracts will be available for a single asset.Is this fixed.Like for a company there will be fixed no of shares fixed.Similarly how many contracts will be available based on asset.And who will decide this number.
This is decided by the exchanges, Hari.
Dear Karthik,
Also throw some light on Long unwinding and Short covering – These terms are not coined in the article.
When traders go long, to close their position, it is called long unwinding wherein the traders have to sell the futures. When traders are short, to close the position they have to buy back, and thas is called short covering.
Dear Karthik,
Thanks for the wonderful insights you have been providing.
Can you please clarify this below statement on OI. I got confued a bit.
\”Tuesday: Neha wants to get rid of 8 contracts out of the 10 contracts she holds, which she does\” – On Monday Neha only took a short position of 10 contracts and so she does not own any contracts – Then how on Tuesday, she can get rid of the 8 contracts ? Please throw some light on it.
Thanks
The 10 short were fresh positions which were carried to Tuesday. 8 out of the 10 were closed on Tuesday.
Thanks for making this whole varsity platform… a really helpful and amazing way to learn in-depth concepts of the market.
Loving it.
Happy learning, Ritvik!
Good
So what or how does OI really help as being a part of one\’s trading strategy 🙂?
YOu can look at OI and see where all the action is and take a call basis that. Its just empirical though 🙂
Hello Karthik,
Where can I find the data in regards to change in volumes or OI based on time frames. Let\’s say for 1 hour time frame, what could be the change of volumes or OI from the previous hour.
Thank you.
You can look at the volume indicator, but I don\’t think they give change of OI/Volume data. It gives you the overall number.
Pl guide, which indicator should i use to see Open interest?
No indicator as such. You can keep track of OI itself.
In above example on Wednesday when John sell 7 contracts, Arun buy 3, Varun buy 2 and Neha close her 2 short positions. Now let say market falls and John decides to book profit and at the same time Arun and Varun decides to book losses. So for 5 contracts John will book profit and for the same 5 contract Arun and Varun will book loss. But for the remaining 2 contracts John has to book profit but who will bear the loss. As per the example till Wednesday only 4 persons were in market so how this will be settled.
can it considered short buildup or long build up? like what inference can be drawn from such a scenario? recently i came across continuous strikes of which oi has increased but the price change is 0%.
OI alone does not give much information. You need to combine OI, price, and volume information to get an idea of where the market is heading.
hello karthik,
please explain what does it mean when the oi of a strike has changed but the price has not changed?
It just means the number of open contracts has changed, does not really mean the price should change.
Thanks for your response
Please let me know which one you do follow to select strike from Option chain…OI or Candlestick ..i will also follow same way.
Candlestick.
Hi Karthik,
I have some queries regards the Trend and apply a strategy
How we can identify the trend whether it is Bullish or Bearish or Netural to apply the Strategy, I have read Module 5 and Module 6 from this Zerodha varsity .
Some one says learn Candlestick Chart price action or Option Interest analysis from Option chain and etc .As I am completely new to Market and started Backtest and will continue for a upcoming 3 to 4 months. Please help me on this.
I was quite confusing on this.is it enough to learn the Option Greeks and Option Chain to anlyse the trend and take a decision. I didn\’t know anything apart from the Options.
Thanks
That\’s right, one of the good ways to identify trends is by looking at the candlestick pattern. YOu can overlay a simple moving average as well to figure how the market is moving. I\’d suggest you get comfortable with this before you move to options.
Hello Sir,
In below case, Neha short 10 contracts and out of those 10, she wants to sell 8.
But how will she purchased from John as john doesn\’t have any contracts to sell. Please advise.
—–
Tuesday: Neha wants to get rid of 8 contracts out of the 10 contracts she holds, which she does. John comes into the market and takes on the 8 shorts contracts from her. You must realize that this transaction did not create any new contracts in the market. It was a simple transfer from one person to another. Hence the OI will still stand at 10.
Madan, I guess the same query was asked by someone else in the comments. Can you please check for the explanation?
for eg. if bajfinance 7000 ce has 1,00,000 open contracts, and change in oi is 1,50,000 .
is this data bullish or bearish?
I am confused between that if ce has more open contacts so that data will be considered bullish or bearish
In 12.2 – OI and Volume interpretation, second tabulation about price and Volume show a two options of volume decreasing whereas just above the first tabulation, you\’ve mentioned that \”Hence the volume data always increases on an intra-day basis\”.
Isn\’t it contradictory.
Pankaj, think about it. Volume is 100 at 9:20 AM, as the day progresses and more trades come in, then the intraday volume will only become higher right?
Where is it better to trade intra day in stocks or stock futures ?
Which one is more liquid ?
I\’d suggest stocks because the list of liquid stocks is I guess higher than the list of liquid futures. Besides you have an option to choose no leverage with stocks.
Sir, whether NSE don\’t make it available deliberately,
can we have it from other sources?
Not sure, Roshan. Need to dig around.
Dear Sir,
Where do i get participant wise open interest data separately for Nifty, BankNifty, FinNifty?
I dont think combined data of Index Future (Long)/ Short is useful
Regards
Roshan
Dont think OI is available at the participant level.
Hi Karthik,
Thanks for taking time out and making such informative sessions & replying to the queries/doubts. I have one doubt i.e. what is the difference between Volume and Change in open Interest ?
Thanks
Volume is the number of transaction per day. So volume starts from 0 at the beginning of the day and increases as more trading picks up. Its reset back to zero at the end of the day. OI is the number of open position on any given day (during the expiry).
Hello Sir,
I hope you and your family are doing well.
1) Regarding OI,
If price decreases and OI increases of Call options wouldn\’t that mean Call writers are actively writing options?
If price increases and OI increases of put options wouldn\’t that mean Put writers are actively writing options?
2)
Is it easier to look at option chain from a buyers perspective or sellers perspective??
3) Can you use option interest as support + resistances. Like nifty has a large amount of OI at 16000CE which could mean lots of call writers have initiated positions there. Hence it acts like a resistance?
1) Price decrease and OI increases it implies that there are more open positions building up. So the price decline could be a short term retracement
Similarly for Put OI increase and price increases, could be a short term price pull back.
2) You need to look at it from the market participants perspective, as an indicator of activity
3) To some extent yes, gives you a sense of where the market activity lies and the probable areas which can act as S&R.
By the way, you need to be aware that OI, price, and volumes analysis are all suggestive, not necessary that the market will obey these factors at play.
If derivatives are zero sum game then how come OI tells us about the Traders perception in terms of number of trades on the long/short side because even if OI increases the number of long trades will equal number of short trades
OI is an indicator of the open position, not really the way funds move.
Hello Sir,
I hope you are doing well.
I have just subscribed to sensibull right now.
When I look at the Nifty option chain, the OI is shown in Lakh. For example 17 June Exp OI is 27.6 L for 15800 CE while 20.3 L for 15800 PE.
Are these 27.6 L contracts or 27.6 L shares? Do I need to divide by 75 to get the number of contracts??
I am very confused about this.
These are shares. But do contact Sensibull once to get clarity from them.
To get a clearer insight into the concept, could you please add a chapter to explain the interplay of volume and OI with respect to price change.
Clearly, volume and OI data doesn\’t convey much except maybe indication to liquidity. But in and of themselves, volume and OI don\’t give any conclusive cue. Increase in volume can lead to increase (when new positions are being created) as well as decrease (when old ones are being closed) in OI.
A chapter with illustrative examples will crystalize the understanding.
Sure Deepak. But I thought I\’ve already done that in this chapter 🙂
Hello Sir,
1) In the module you have written that an decrease in price along with decrease in OI results in Long unwinding.
For puts a decrease in price is beneficial. So a decrease in price did happen which in turn increased the atm puts price however its OI decreased. So how would long unwinding happen?
2)How did Delta influence the option premium positively? The spot fell so delta should also decrease the option price. assuming volatility to be constant.
Sapna, as I\’ve stated in the chapter, OI interpretation is empirical. Likely to happen, but there is no guarantee that it will happen, especially in a context where there are multiple factors affecting the option premiums.
So long unwinding means, that traders who held long positions squared off their positions and the number of long contracts open is lower in the market. This will have no impact on how puts move.
Fall in underlying is good for puts. I hope this explanation helps. Do let me know, else I\’ll try and put this in a better way. Thanks.
Hello Sir,
To follow up with my previous question.
In the module you have written that an decrease in price along with decrease in OI results in Long unwinding.
For puts a decrease in price is beneficial. So a decrease in price did happen which in turn increased the atm puts price however its OI decreased. So how would long unwinding happen?
Secondly,
Nifty CE options from 16250 onwards all showed an increase in price despite the spot and VIX falling. Why must this be the case?
Over here the volatility as well as the spot price was decreasing. Shouldn\’t the price reduce instead of increasing??
VIX or volatility is just one factor that influences the premium. There are other factors as well which has an impact on the premium. Delta for example, and the demand supply situation as well.
Hi Karthik
why CALL side OI buildup generally leads to price decrease and PUT side OI buildup generally leads to price increase….???
Maybe because of excess option selling?
Hello Sir,
On 09/06/21
Nifty closed at 15635
1) Nifty 15600 and 15650 PE options had a ~15% decrease in OI despite PE option prices increasing. How can One interpret this?
2) Nifty CE options from 16250 onwards all showed an increase in price despite the spot and VIX falling. Why must this be the case?
1) Increase in price and decrease in PE OI means, traders are closing their open positions in PE
2) While volatility decreased, the delta pulled the prices higher.
Hello Sir,
In your last part you gave a table of OI increase with respect to price.
Is this the price of option strike price/future price with respect to OI or the spot price with respect to OI?
This is the price of the underlying in the spot market.
Dear Sir,
I trust you are well.
I don\’t understand the last part of this chapter
\’If there is an abnormally high OI backed by a rapid increase or decrease in prices then be cautious. This situation simply means that there is a lot of euphoria and leverage being built up in the market. In situations like this, even a small trigger could lead to a lot of panic in the market.\’
Can you explain with an example or something
Think about it as a pressure cooker situation. A small trigger can release the accumulated pressure. In market terms this could be a crash of rapid increase in prices.
Your thoughts on MWPL and OI interaction. Especially when it goes into ban due to price rise/ fall and how it would then impact the cash market volumes ! Needless to say margining norms would also be an important variable in the outcome.
These are common activities occurrence in the market, Rajesh. It does not have any direct impact on the spot market.
I was looking at the bhavcopy on the day of expiry @ https://www1.nseindia.com/products/content/all_daily_reports.htm
There\’s one thing I could not understand. For Index futures (let\’s say NIFTY) the bhavcopy of monthly expiry day will show some Open Interest even in after the series has expired. While ideally it should go to zero, right?
It should, not sure if they update this.
Hi Karthik and team
Few fundamental doubts on Futures –
1. You said that after expiry, a new month’s contract is launched. Presumably this is done by exchange. Now for stocks we know there is a total limit to the free floating stocks in market at any time. Is there any such limit for F&Os ? For e.g say on 1st June 2021, RELIANCE AUG FUT are created by exchanges. Is there a limit on total number of contracts which can be traded ?
2. I am also not clear on the OI example given above. How are the transactions called out under Tuesday any different from transactions of Monday ? On Monday, Arjun and Varun purchased 6 and 4 contracts , while Neha sold 10 so OI became 10. Why wasn’t the Tuesday transaction between Neha and John treated in same way to make OI 18 ?
2.
1) There are restrictions in terms of member wide positions, check this – https://www1.nseindia.com/products/content/derivatives/equities/position_limits.htm
2) I guess someone else had the exact same query, have replied in the comments above. Request you to please check that.
Dear Karthik
As per my knowledge, OI data only reveals immediate support and resistance level.
We have to interpret OI data from the viewpoint of Option Sellers.
Now i want to ask you that, Does OI data clarifies the immediate trend in the market ??
How to place trade based on OI data analysis??
OI does not really indicate S&R in my opinion. Yes, OI is more of a trend indicator. Please check the chapter for more info.
Hi Karthik,
I am always confused by this Open interest.
Suppose Infy price decreases today by 2 percent and at the end of day, open interrest for June future increases. Why does it says , that it is bearish signal?
I mean it can be that , more people are now expecting that it is a good chance to buy the futures since the price will bounce back as may be it is due to downtrend trend of market and not stock specific?
Thanks
Nagendra
Thats right, the interpretation of OI + price and even volume is all empirical. These are expectations of the likely behaviour of prices, no guarantees.
SIR IWANT TO KNOW OI FIGURES
BUYERS,SHORT SELL
SEND ME PROVIDE DATA TO CHECK
Dear Karthik Sir,
Kindly tell me whether Am I right or Wrong in below mentioned chart
Price Volume OI Trader’s Perception
Increase Increase Increase Bullish & More trades on the long side
Increase Decrease Decrease Weak & Short covering
Decrease Increase Increase Bearish, More trades on the short side
Decrease Decrease Decrease Weak & Long unwinding
Increase Increase Decrease Short Covering with Loss
Increase Decrease Increase Case not possible
Decrease Increase Decrease Long Unwinding With Loss
Decrease Decrease Increase Case not Possible
Yes, Lokesh. This is the same that we have discussed in the chapter as well.
Brokers nse aur sebi sab mile hue hai nifty me kabhi bhi koi bada position mat banaiye ye teen teen patti khel rahe hai public ka paisa khaane ka dhandha hai inka
ओपन इंट्रेस्ट जो भी हो मगर क्लाएंट का सौदा एक्षिक्युट् करवाने के बाद मतलब एक लोट खरीद ने के बाद दूसरा लोट आप नहीं ले सकते। आज मैंने १७३ में एक लोट ख़रीदा तब आर्डर एक्षिक्युट् हो गया दुपहर १:३०बजे दलाल ने लिख दिया की सेबी के गाईड लाइन्स के अनुसार आप ये लोट नहीं खरीद सकते मतलब आप १२र् में नहीं खरीद सकते।3 बजे भाव 19 आया मैंने लॉस 3 पॉइंट निचे बुक कर लिया सब ओर्डर के स्क्रीन शॉट मेरे पास है।सेबी का नाम बताकर आप नीचे के भाव पर माल खरीद नहीं सकते मतलब लॉस बुक कर सकते हैं।मेरे साथ फ्रॉड किया गया है ।
Hi Sir,
First of all huge thanks to you for writing Varsity. Huge fan and I have learned a lot from you. So thanks.
I have a question regarding open Interest.
All that I have read, I have formed the opinion that open interest is nothing but the total number of outstanding contracts in the market. Now you said \”an increase in Open interest indicates bullish trends\” but if Open Interest is increasing, does is not mean that the sellers of the same contract is also increasing(because No. of sellers = No. of buyers). Hence an increase or decrease in open interest only indicates liquidity of a script and nothing else?
Thats right, Piyush. OI is simply an indicator of all the open position in the market. Yes, on its own OI does not convey much information hence the need to associate it with both price and volume.
Sir, once the current month expires and next month become current, we have only few data point to analyze OI. How can we connect expired months OI data with current month
Its the general trend that you observe and not the actual numbers itself, so it should not really matter.
Do we have OI charts on zerodha?
Yes, please check this – https://zerodha.com/z-connect/tradezerodha/kite/open-interest-on-kite-charts-and-more
Sir,
To trade in Nifty future, is it enough to analyze the OI data of current month\’s Nifty future? OR do I need to look for next month\’s and far month\’s OI also to get the idea of Nifty direction tomorrow.
Apart from this whether nifty option chain analysis would also be required?
The current month is good enough, Roshan.
Dear Sir,
Where can I find historical data of the option chain?
Warm Regards,
Ashish.
Not sure if this is available, but do check with Sensibull once.
Bank Nifty is below 35500. But the option chain of 35500 PE due for expiry on 08 april 2021 has stikr price as 0 with its open interest as 0 but depth can be seen as 5000. Today is 08 mar
Where are you seeing this, Naresh? As in which platform?
I m very confused that which basis I do trade.. when I trade with price action then it say to difficult that where it take support or resist and as well as OI. Pls give any suggestions and direction to trade in option.
Sunil, I\’d suggest you stick to the regular price action theory to trade. In my opinion, its one of the better techniques to trade.
I want to ask a question, that suppose nifty 14900 Put price is going up and its OI is also going up. But should we see it from seller perspective, that they are thinking nifty will not close below 14900 mark, so they are selling 14900 put options.
Think about it, the price of PUT goes up, so does OI, that means more ppl are buying PUTS (else price wont increase), which implies that traders are berish.
Hello Sir,
How do companies know that from 9:15-9:30 there is short covering/long buildup etc. and so on and so forth.
Aren\’t transactions all secret and not disclosed? For example HDFC pro terminal tells you the market snapshot for F/O every 15 mins whether it is long buildup/short buildup, short covering, long unwinding.
How is this possible?
Jone, these are interpretations drawn based on combining the price and OI data.
Dear Sir,
Thank you for your prompt reply.
How do I interpret the cost of carry? Is it the same as the future pricing as you have mentioned??
How do I know about MWPL?
Can you provide and example?
Josnson, please do check this on MWPL – https://www1.nseindia.com/products/content/derivatives/equities/position_limits.htm
Cost of carry, you can think of it as futures pricing.
Hello Sir,
Can you explain cost of carry and how do we go about it?
Also can you also explain MWPL and the basis of this? Can MWPL ban happen during intra day?
Do F/O stocks have circuit limits like cash/equity?
Think of the cost of carry as the financing cost which gets backed into Futures pricing. MWPL is a rule by the exchanges which talks about how the maximum position a trading member/client can take on. Yes, ban can happen intraday as well. No, there are no circuit limits for F&O.
i need a open interest book
Hi Karthik,
I have often observed that on various business news channels, before the trading day starts, news anchors provide nifty range levels, S&R levels etc with good precision based on the homework they do using previous day bhav copies. Could you please throw some light on what and how do they do these calculations? What exactly they use as data and how?
Best Regards.
PS: Thank you for the wonderful initiative and being regularly active to answer our queries since so many years now 🙂
Pravek, most of them just end up applying the classic support and resistance theory. Check this – https://zerodha.com/varsity/chapter/support-resistance/
I am not clear after searching through many websites, about what is the unit of open interest. the unit of volume is number of shares. but the unit of open interest is number of contracts, now, what is the term \”contract\” meaning here. is it the number of lots, the number of orders, the number of shares or something else? thanx in advance!
Its the number of contracts. 1 contract = 1 lot.
Any update on the OI function update?
Please tell me how to determine maximum number contracts available in nifty future in any expiry.
I\’m not sure how to go about that, Sarvesh.
Hi Karthikji,
I am trading option selling with hedging. For hedging a position I may have to buy a far off call or put option for adjustment of the trade. In such cases I find that Zerodha will not allow traders to buy PE/CE and restricts traders to trade within the allowed range. This has curtailed my selection of strike price for buying, affecting my trades adversly. I thought of moving to custodian – Orbis Financial to avoid this problem. But with that move I will be losing the benefit of investing in stocks. I am in dilemma. Is there any possibility of allowing all the strikes in future or revision of this decision by concerned?
While all other brokers do not have such restrictions as in zerodha or \’trading within a range\’, all other features of Zerodha are EXCELLENT which is the lone reason holding me back into Zerodha. I solicit ur helphul comment and advise. Thank You.
Suresh, unfortunately, this is an issue. Can you please create a ticket? I\’m sure my colleagues will suggest a possible solution to this. Do let me know if this is not sorted. Thanks. https://support.zerodha.com/category/trading-and-markets/kite-web-and-mobile/articles/trade-all-strikes
If we taken a 1 call or put position, after that if there is no OI until expiry. what will happen to invested money…
Upon expiry, the contract will be settled.
Hi,
May I assume that option writers control(all times or some times) the Stock prices or index levels by any chance bcz as they pump huge money at different Stike prices…Please clarify.
Thq
Rajasekhar
To a large extent yes, but not always. There are times when option writers lose a ton of money.
Hi Karthik ..
Please clarify the below ones…
1. BHARTI AIRTEL Spot price on 8th Jan\’21 was Rs540. Below are the put strikes and oi.
As i understand put side oi\’s are act as support points and we have 9.49L contracts exist at Rs540 strike but what are the oi\’s of 550, 560, 570 strikes. ? How to understand them? And how do we use them?
PUTS
480.00-810,738
490.00-625,638
500.00-1,823,235
510.00-888,480
520.00-1,384,548
530.00-992,136
540.00-949,563
550.00-962,520
560.00-283,203
570.00-79,593
580.00-66,636
2. Is OI data show CE & PE sell(write) Contracts? but not Call buy put buy contracts?
3. Is the oi data suitable for day-trading on stocks?
Thq
Rajasekhar
1) If the contracts exist, then traders trade and create an OI.
2) OI does not differentiate between buy and sell
3) You can use it for both intraday and overnight
I got stuck in Tuesday when Neha buys 8L from John. Not able to understand this.
Is it necessary to consider OI to trade in Futures or can I ignore this?
It may not be necessary to know how OI is calculated, as long as you know how to use it 🙂
Sir plz let me know all scenarios related to price and oi on put side .
Also I wud like to know what happens when on both side the OK and price are decreasing at the same time,what wud be inferred from it
What scenarios are you looking at, Nash?
I got confused in the price and OI table. Didn\’t get it clearly.
Cool, I hope all clear now 🙂
Thanks..I checked..the OI of older website matches the option chain on the older website…however for some reason..the new website shows a different option chain with different OI..( god knows why the two types of option chains on old and new website )
There is a footnote on new website that says OI is in number of contracts..whereas the old website is not clear on the same..
I tried to match the old and new with a lot of PnC but failed😅
I cannot understand why the two different data
I\’m really not sure either 🙂
Hi..i observed the same thing today also…just wanted to confirm are there two websites of NSE??
https://www.nseindia.com/ &
https://www1.nseindia.com/
they both are showing contradictory data…thanks
Both belong to NSE 🙂
Do check the time period, one of them maybe updated while the other may not be (for whatever reason).
Ok..thanks..but is the EOD Bhav copy net of intraday trades..like the OI that may have been created during the day which is settled at eod..is that excluded in Bhav copy?
That would not matter right, what matters is the EOD OI. Intraday will anyway change throughout.
Yes…its live for 10th…Im looking at put as a whole, not individual strikes..what i cannot understand is that the option chain has total put OI of just 4 lac contracts …whereas the data from NSE show a much higher OI ..why is that?
Live data from what I know is not very accurate, Alok. Its best to get this from the EOD Bhav copy.
Hi Karthik, I tried analyzing OI data for options today for 26Nov Expiry. The 9th Nov Bhav copy is showing total put OI as 2.8 cr contracts whereas the participant wise total OI for put is around 17 lacs…and whereas 10th Nov option chain is showing Put OI of only 4 lacs…can you please help me understand the why the difference in the OI ??
Are you taking this data live for 10th? I\’d suggest you take the bhav copy data. Also, are you looking at individual strikes or entire put OI?
Thank you sir.
Very well explained sir.Thank you so much
Good luck, Deepika!
Thank you sir. At any particular time in the market total number of sellers are equal to total number of buyers,irrespective of the direction of market.Then why it is said,bulls are dominant or bears are dominant and so on and we used to take position on that basis.Is price the main determining factor or something else?
True. The dominance depends on who is leading the price and who is a price taker. Suppose in a bullish market, bulls will expect higher and higher prices, and the market pays for it, hence price trends. Likewise in the bear market.
Thank you sir.Sir quantity of trade should be equal in both the directior to maintain equilibrium in OI.
Can u pls share more context?
Thank you sir.When there is price action
(Suppose up trend),shorts cover their position.Simultaneously someone is selling or reverse is also happening in the market.Then why we used to say price up,OI up ,more traders on long side.
Depends on the quantity of the trade right?
Query related to open interest.
Thanks sir for giving the vast knowledge especially on the future and options. Sir I want to know when price decreases and OI decreases resulting in covering of long position.But when the longs are covered,do the short positions are not automatically created.
No, these are positions getting closed or squared off. No new positions are created.
Any plan for adding change in OI (Increase or Decrease) on daily basis in zerodha kite for Future stock
Hi,
on expiry date end of the day, all the contracts should be closed and OI should be zero. Is that correct?
But I observed that, on the expiry date after trading hours also, still OI exists. what does that mean?
For example:- 24th Sept is Expiry date. After trading hours on 24th Sept also, ITC SEPT FUT has OI as 30 million. Can you explain it?
Yes, that\’s correct. The OI will be rest to zero, post markets since all trades would be settled.
If Neha sold all 10 contracts, \”while Neha sells all of those 10 contracts\”; how can Neha want to get rid of 8 contracts out of the 10 contracts she holds in the second instance.
You can choose to sell each contract individually right? So that\’s exactly what Neha has opted to do. Sell 8 out of 10.
If stock OTM put sold @50/- and on expiry day price become Re.2/-but, contract can\’t closed due to illiquidity whether I shall receive the difference of premium (50-2)=48/- ?
In such a case the option will expire worthlessly and hence you get to retain the entire premium of Rs.50.
I am a CA student and this entire module has been very helpful and one of the best available material on the net on futures.The practical connections were also very helpful in understanding the concept.Thanks for this
Happy reading!
Hi,
If OI interest reflect the lot size or lot size *contract quantity?
Lot size * Qty.
We can easily see open interest but how to know whether open interest contracts increase or decrease for particularly strike rate on ciurrent date.
YOu can see the change in OI for this, Sunil.
Hi,
I referred to your link below, where I read your response to Q3 and Q4. In that article, you mention that if OI on Nifty 5,600 calls went up significantly, then it implies a bearish trend/ resistance at 5,600.
https://zerodha.com/z-connect/queries/stock-and-fo-queries/open-interest-maxpain-put-call-ratiopcr
However, in this article, you mention that OI increase does not necessarily mean a bearish trend. Rather, it depends upon the movement in the price (assumed as premium in case of Options). So, if the price (premium) has increased with increase in OI for call option, it rather implies a bullish trend.
Your views in the two articles published by yourself are contradictory. Or, perhaps, I have failed to understand them properly. Pls can you clarify.
Thanks
Gaurav, dont associated the option premium with OI, that will not help. When you look at OI, you need to also look at the price movement in the underlying, without which the analysis would be incomplete. Increase in OI + Increase in price = Bullish. Increase in OI + decrease in price = bearish.
Thanks for replying Karthik. I\’m talking specifically in case of expiry only; and this month expiry to be specific 🙂
If OI increases with increase in volume and price, would that not cause max pain to the call sellers in the expiry? If in spite of increase in underlying and OI, the PCR increases with every day, i.e. there are still lots of call writing in that scrip, shouldn\’t it give an indication that the scrip might show some resistance at those levels?
P.S. I\’m not trying to confuse or mix PCR, Max pain, OI or the logics.. I\’m just trying to find a correlation between all the indicators 🙂
Thanks
Aditya, these 3 concepts i.e. OI, Max Pain, and PCR, these are all very empirical concepts. They are best looked up in silos. No point trying to correlate these theories because there is no underlying science which connects them. Look at the individually, know what they are trying to convey and at best add this is a supplementary study for your analysis.
Hi Karthik,
Thanks for always being regular and prompt with your replies. Really appreciate that.
My query is- generally, what can we say about the stock if there is high OI, especially a high PCR (>+0.5)? If people are rushing to get call options, should we interpret it as people are bullish about the share? Or using the Max Pain theory and PCR, it is the option sellers who are luring people to buy the calls, since we assume sellers are mostly big institutions and their logic is more sound than buyers?
I find the scenario a bit complicated and contradictory. What do you fell?
Yes, in general, if the OI increases along with the increase in volume and price then the expectation is that the stock has turned bullish. Hmm, max pain gives you a perspective of where the expiry is likely, dont use it beyond that 🙂
Sir, what is the equation, relation among these? Kindly let me know.Thank you.
Price increasing- oi decreasing -volume(+/-)-change in oi=?
Price increasing-oi increasing -volume(+/-)- change oi=?
Price decreasing-oi increasing-volume(+/-)-change in oi=?
Price decreasing-oi decreasing-volume(+/-)-change in oi=?
Monu, we have discussed this in the chapter itself right?
hi karthik you told there r two side one buyer and a seller , let us say the selller sells one contract to the buyer ,now the buyer is said to be long and seller said to be short then my question is that why pcr is different it should be same
What matters in PCR is the number of contracts.
Sir,
In NIFTY Option chain, Is 1 Contract is 1Lot (75 Units of Nifty units) ?
Please clarify.
Regards
Jose
Thats right.
Sir
How new contracts are being created and by whom?
I mean retail traders can buy or sell the existing contracts….right?
It is the job of the exchanges to create new contracts.
Thanks a lot for your reply.
But Sir I am not able to comprehend.
How can there be more longs or more shorts if for every trade on long side there is a short seller on other side.
I know I may be asking silly question but please have patience with me.
This question is bothering me from long time. I have read so many books but no clarity.
I need detailed information with example. Can I get your personal mail/ number.
Mine is [email protected]/9136491005
I will be very grateful if you make me understand this concept.
The number of longs and shorts does not matter. For example, let\’s say 10 traders short 1 lot each and 1 trader goes long on 10 lots. This means there are 10 short traders and 1 long trader.
Hello Sir,
I have a doubt .
You have written that future buying and selling is a zero sum game, meaning same number of longs and shorts on opposite side.
But in summary table you have written that if price decrease and open interest increase, then there are more trades on short side.
To me both statement are contradictory.
Can you please make me understand.
Thanks and regards
They are written in two different contexts. Zero-sum is more from a long term perspective, while OI thing is a short term/expiry phenomenon.
Hi Karthik ji … please accept my appreciation and BIG thank You!!! …you are replying everyone\’s query and helping them and guiding, almost without fail ! this is really really very helpful for learners!
We are very much thank full to you 🙂 Great Job ! keep it up ! 🙂
Thanks Atul, happy reading 🙂
Hi Karthik,
I have opened the NSE at 23:07 PM today on 16 July 2020 – the option expiry, i can still see OI on call side of 5,960 Contracts and on put side of 49,492 for the strike price of 10,600 on NIFTY. Why So ? Because ‘after’ the option expiry, everything should be settled/squared-off, and hence OI should come to zero.
Reply –
You can find it in bhav copy as well. Download bhav copy and check open interest of every Thursday option expiry after its expiry, you will not find it to be 0.
Sorry, I meant to say that it will be 0 🙂
why are OI increasing when price is increasing wont the short seller want to close the contracts thus reducing the OI. one party wants to go long in increasing trend but the other part will want to short. what will happen if price is increasing and more people want to go long at the same time less people want to go shirt how will OI be created then.
The thumb rule is that more open position are created, more OI will increase. New positions have to be created. Only then will OI increase.
Hi Karthik,
I have opened the NSE at 23:07 PM today on 16 July 2020 – the option expiry, i can still see OI on call side of 5,960 Contracts and on put side of 49,492 for the strike price of 10,600 on NIFTY. Why So ? Because \’after\’ the option expiry, everything should be settled/squared-off, and hence OI should come to zero.
Can you try looking at it today? I guess that they have not updated the data real-time.
Sir please guide me can I buy banknifty current month and also short same banknifty next month F&O at the same time
Yes, you can. These are two different expires.
HI Karthik,
I have a small doubt in option chain open interest,
1. Yesterday I was tracking Mothersumi CE 117.50 current expiry which was trading at 1.15 Rs but today i cant see anything in the option chain only in that particular strike.
The field those are blanks are Change in OI, volume, IV, LTP and net change but it has a community OI of 63000 (7000 Lot size)
Why is this appearing completely blank, if we might have initiated a position all things remaining equal atleast Theta might have eroded the premium by a meager amount, hence thought of clarifying with you
https://www1.nseindia.com/live_market/dynaContent/live_watch/option_chain/optionKeys.jsp?symbolCode=1385&symbol=MOTHERSUMI&symbol=MOTHERSUMI&instrument=-&date=-&segmentLink=17&symbolCount=2&segmentLink=17
Not sure by the time you see it may change
That means that there is no trading activity in the strike. The contract is illiquid.
Rollover: \’It is to square-off the current position & buying a similar position for next month contract\’. Now, to understand this further – a scenario when it has to be rolled-over then why it has to be done on the day of expiry and why not after a few days:
1. Is it necessary to BUY at the same time as squaring-off to gain any cost-benefit?
2. Can it also be bought it at a later stage (maybe after 2-3 days) when it would be presumed that price would fall within those 2-3 days?
3. Is there any cost-benefit in both stages?
4. In short, what is the difference of buying on the expiry day AND at a later stage except for underlying price?
1) No cost-benefit, it is about the continuity of position
2) Yes, but it is not really called a \’roll-over\’
3) Nope
4) No difference since there is no cost-benefit. Rollover is just about the continuity of holding the position.
Sir, whenever I read these modules for revision I just feel like you are talking to me(which is the quality of great authors)….people may have diff things in life but having a great guru is absolute bliss….I feel that I have gotten a great guru after reading your modules…somehow I landed up at zerodha varsity without going into a pit of other scrap sources….utmost respect from the bottom of my heart sir for writing these modules….have recommended to lots of my friends:-)
Hey Mahesh, thank you so much for the kind words. You made my weekend 🙂
Thanks for your reply sir….it means a lot to me….sir I have completed FA from zerodha written by you….but I want to learn more about valuation….can you please recommend some books?
I\’d suggest you look at the \’Little book on Valuations\’, by Ashwath Dhamodaran.
Sir,read the complete futures and options…thanks for the great knowledge sharing
Sir,iam interested in long term investment then is there a necessity to learn futures and options…just want to know your opinion or just TA and FA sufficient?….plz Ans in a straight forwrd way sir…ur big fan:)
For long term investment, you need to look at FA Mahesh. A bit of TA helps as well. You don\’t really need to know Futures and Options.
Hello,
Please help me in the understanding of below and how to interpret:
– During the morning till 15:20 pm, the future basis difference was -0.30 to -0.50 points between future price and underlying price. Future was trading at a discount… What does it mean?
– However, after 15:21pm, the difference came into positive n became +.30 points till the closing time.
Is any link available to read about this to understand?
1) It means the futures contract was trading at a discount to spot price. Meaning, if the spot price of Infy was 809 and its futures were trading at 806, then the futures is said to be trading at a discount of 3 points
2) Yes, demand-supply dynamics has its own impact on these prices, keeps fluctuating constantly.
Thanks for replying.
So on the NSE website, I checked the change in OI at 7.30 pm last evening for a particular stock and the difference was around 13%. But now when I check the same, for change in OI between yesterday and day before, the change in OI is only 4%.
Hence, wanted to be sure.
Ok. The best source is the bhavcopy, Prateek.
At what time in India, does the EOD OI data get updated on the NSE website?
Post-market, around 3:40 PM I guess.
Sir, I have listened about creating trading strategy using STREAK platform by different technical analysis tool. Is Streak platform free to use, for the person who has zerodha trading account ?
No, you will have to pay streak, it is not free.
Hey Karthik,
This is all terrific stuff. Thanks for sharing your insights and knowledge with us.
It would be great if you could please correct the typo in the below line.
\”Clearly volumes and open interest are two different; buy -> but seemingly similar set of information.\”
Thanks, will do that 🙂
Hi sir, I know it\’s a silly question. But I am unable to understand how OI decreases. I know the textbook version that OI decreases when contracts are squared off. But what does it actually means, does it means that those contracts cease to exist or the exchange take it back. Please explain.
It simply means that the OI has reduced, 1 position less in the market 🙂
Karthik Sir,
I have seen sometimes in the Zerodha OI charts
that
OI Change> Volumes
during sometimes.
You have taught us that Buy and selling leads to Open Interest.
Then how can OI change>Volumes????
OI is on a cumulative basis, the volume is on an EOD basis.
Hi karthik,
I wanted to know about no. Of trades
Suppose
One day :
Ram sells 10 contract or 10 share (cash mrkt)
Sohan buys five contracts from ram
Shalu buys five contracts from ram
So ,
No. Of trades = 1or 2
Thanks
Depends on the order size. If all 10 belong to one order then its 1 trade.
Sorry it\’s Future chapter, heading to Options!
Hi Karthik,
I have completed the options chapter, As usual your explanation & example helped me to understand easily. Sometimes comment has the answer for my query.
Ample amount of effort needed to review and respond to the comments and the way you are doing is brilliant. Sorry for asking out of context. May I know the motto behind the free education by Zerodha? Just curious to know by considering your effort, time and highly knowledgeable content.
Thanks a lot Karthik!
I\’m glad you liked the content. Please do read this post – https://zerodha.com/z-connect/queries/stock-and-fo-queries/introducing-varsity , you\’ll know why its free 🙂
Hello
First of all thanks for such a informative post, it was very helpful to understand the OI & Volume concept
I have a small querry on nifty futures data (sample below),
Traded Volume (contracts): 4,94,879
Market Lot: 75
Open Interest: 31,42,200
Change in Open Interest: 26,86,950
So change in OI was around 26.9 lakhs and volume was around 5 lakhs, should we read the above data like this or we should consider the lot size of 75 and read it as change in OI as 26.9 lakhs and volume as 5×75=375 lakhs
No, read it like the way you first mentioned.
Thank you for your response.
> A) What is MWPL in Margin Calculator page? Is it (O.I/MWPL) in percentage? If not, where I can find the value of O.I./MWPL? If yes, I assume when that value will become 95%, the contract will be banned?
> A) MWPL – Market wide position limits, basically a directive on how much a single member/client contribute to the overall positions in the market. More on that here – https://www1.nseindia.com/products/content/derivatives/equities/position_limits.htm
Ah. So there are individual as well as market-wide limits. Just want to confirm if these values show in Calculator are MWPL in percentage? https://i.imgur.com/eQ3qG02.jpg JUSTDIAL is currently 91.92% and 95% is the current limit, so I assume creating new positions for JUSTDIAL will stop after 3.08% increase in MWPL%.
> E) For NFO delivery settled contracts, in case of a short position, do I have to buy shares in advance or stockbroker (Zerodha) will buy them for me at expiry on margin price without any penalty?
> E) Based on your position you either need to have shares in advance in your DEMAT or enough cash to buy the shares
As long as I have enough funds, I assume there will be no penalty and stockbroker will buy them for me?
> H) If let say instead of squaring off oil contracts long position at negative price, if they had let the contract expire, would the exchange or stockbroker sue him/her to take delivery? Secondly considering negative prices were temporary, why can’t they just sell the oil it to someone else in the next few days while their order was processing?
> H) One cannot be flexible on the derivative contract, if you do, there is no sanctity based on which one can trade
I am not sure if I understand your explanation. We are accepting delivery which means we respected the original contract. While the order is being processed in real life (physical settlement takes time), we just made another contract with somebody to buy from us. So there are two contracts which are respected.
Even if we default and refuse to accept delivery and let the contract expire instead of squaring off, I have never heard anybody sued because they refused to accept free stuff (oil in this case).
Both of these options beats selling oil contracts for -37.63 USD/barrel at loss.
> M) Is “Near”, “Mid”, “Far” contract only NFO concept? I saw MCX and CDS and many more contracts with different duration and some even mention a day of the month. So it’s only an Indian thing applicable to NFO segment. The international stock market may not necessarily have 3 contracts like us for equities?
> M) it is applicable to NFO, CDS, and MCX contracts
https://i.imgur.com/VgoHXem.jpg But this screenshot from Kite shows 6 contracts for gold and 10+ contract for EURINR?
> N) I was looking at the rollover percent calculation formula. Is it calculated every day or once a month? If monthly, then on what date? I feel rollover percent calculated on the 1st of May will be much lower than that of 25th May.
> N) Applicable during the expiry. Where did you find this by the way? Can you share the link?
I found this article. https://www.motilaloswal.com/share-market-education/blogs.aspx/27/Translation-of-Derivative-Rollovers-in-Stock-Market It says Rollover Percentage = ((Next Month Open Interest + Far Month Open Interest) / (Near Month Open Interest + Next Month Open Interest + Far Month Open Interest)) %
If we calculate it at the end of the month, won\’t \”Near Month Open Interest\” be almost \”0\”? Does it mean rollover percentage is always 100% every month? How is it a useful statistic then?
While taking the screenshot earlier, I noticed there is a \”BCD\” segment for currency. May I ask what is it\’s full-form? I saw something called \”Bond-Currency-Derivative\”. Not sure if it\’s the same thing?
Please dont nest the queries, gets too difficult to figure 🙂
1) Yes
2) Yes
3) What I meant was that you will have to honour the contract within the time period specified, one cannot week that.
4) 3 for Equity, more than 3 for CDS and Commodities. But the point is that the contract is still called a far month if it is 3 months or more than that.
5) Thanks
6) Not sure about BCD, let me confirm 🙂
Hello Karthik,
I just finished the module. I was very fascinated with the concept and I read a lot and have many questions. I will just ask them. But if you feel they will take too much of your time and you rather not answer them, I will understand. No problem at all. Thanks in advance 🙂
A) What is MWPL in Margin Calculator page? Is it (O.I/MWPL) in percentage? If not, where I can find the value of O.I./MWPL? If yes, I assume when that value will become 95%, the contract will be banned?
B) Do all stocks and derivatives have a lower/upper circuit to protect investors or it is only for new IPO\’s?
C) Why there is \”Mis Margin\” for MCX in \”Margin Calculator\” but not for \”NFO\” and \”CDS\”. Just confirming it means only MCX futures are allowed to have intraday trading?
D) Suppose I don\’t settle my future contract?
For NFO, I think it will be delivery settled?
For CDS, I think it will be cash-settled?
For MCX, I saw it\’s mixed depending upon the commodity.
E) For NFO delivery settled contracts, in case of a short position, do I have to buy shares in advance or stockbroker (Zerodha) will buy them for me at expiry on margin price without any penalty?
F) I assume both rollover and buying/selling over calendar spread are two steps transaction (means you make two orders. one buy and one sell which may not execute/filled simultaneously). So the price can change between the first and second-order?
G) You said on the expiry date, future and spot price converge but I think it\’s not guaranteed 100% of the time since the oil price recently went negative?
H) If let say instead of squaring off oil contracts long position at negative price, if they had let the contract expire, would the exchange or stockbroker sue him/her to take delivery? Secondly considering negative prices were temporary, why can\’t they just sell the oil it to someone else in the next few days while their order was processing?
I) We can\’t really take \”Margin benefit\” if we buy in spot and sell in future. Same applies to buying stock in future and then hedging against NIFTY. No margin benefit here either.
J) Are these the correct full-form?
CDS = Currency Derivatives Segment
MCX = Multi Commodity Exchange
NFO = NSE Future & Options
K) Why Future Contracts have such large lot size and contract value. I think it can be a pretty big amount for small investors (who are just beginning) even with margins? Why not just keep it like 1 Lot = 1 Share? Although it\’s not likely to happen, theoretically 2 Lakh contract value means you can lose 2 Lakh in one contract.
L) You said we sign a contract in the future market. I think we also sign some form of contract in spot market too?
M) Is \”Near\”, \”Mid\”, \”Far\” contract only NFO concept? I saw MCX and CDS and many more contracts with different duration and some even mention a day of the month. So it\’s only an Indian thing applicable to NFO segment. The international stock market may not necessarily have 3 contracts like us for equities?
N) I was looking at the rollover percent calculation formula. Is it calculated every day or once a month? If monthly, then on what date? I feel rollover percent calculated on the 1st of May will be much lower than that of 25th May.
O) The Last question. Can you give me an example of a stock with 0 or negative beta? I am just curious if they exist in real life?
A) MWPL – Market wide position limits, basically a directive on how much a single member/client contribute to the overall positions in the market. More on that here – https://www1.nseindia.com/products/content/derivatives/equities/position_limits.htm
B) There is an execution range though, check this – https://support.zerodha.com/category/trading-and-markets/trading-faqs/articles/difference-between-execution-range-and-circuit-limit-fo
C) MIS is a product type which gives the trader additional leverage, its available across all segments and assets and not just MCX
D) Thats right, read the contract specs before trading
E) Based on your position you either need to have shares in advance in your DEMAT or enough cash to buy the shares
F) Absolutely, this is called \’execution risk\’
G) It does, always. Oil was a one-off case, even here, the settlement was done keeping the -ve prices in perspective
H) One cannot be flexible on the derivative contract, if you do, there is no sanctity based on which one can trade
I) Cross margin benefit is something that will be introduced soon
J) Yes sir
K) To some extent, this is to discourage retail/small traders from trading derivatives 🙂
L) Ah, sign is not in the literal sense, it is implied
M) it is applicable to NFO, CDS, and MCX contracts
N) Applicable during the expiry. Where did you find this by the way? Can you share the link?
O) Have not checked recently, but long ago, I remember AIRTEL had a -ve beta. Not sure of it still exists.
What does negative change in all OI for OTM and far OTM options suggest ? Doest it suggest a bearish market ahead ?
OI on its own is pointless, you will have to associate it with the price change to draw meaningful inferences.
Thanks, the two tables above are the basis for stock market trading. If someone can grasp these tables, then more that half the job is done, I think.
To some extent, but not fully 🙂
Thanks Karthik.
So, it means that whenever a option buyer wants to get rid of his 1 contract, he will initiate a \”Sell\” call and there must be a matching \”Buy\” call to complete this transaction. In this case, there are 2 possibility:
a) That buy call may be initiated by other option buyer to create his position – in that case OI will remain same, because its just transfer of contract.
b) or, that buy call may be initiated by an option seller to exit his position – in that case OI will reduce, because both buyer & seller exiting their position.
does my understanding is correct ?
Yes Sir.
Hi Karthik,
I have some confusion related to open interest. Please bear with me for this long list of questions.
1)
How can \”Change in open interest\” be negative on a specific day before exipry date.
For example:
A is Call Option Buyer of 1 Lot and
B is Call Option Seller of that 1 Lot
Now, if A wants to get rid off his 1 lot, then he has to \”sell\” it. To complete his \”Sell\” transaction, some other option buyer has to \”Buy\” that 1 lot. Suppose an Option buyer \”C\” has buy that lot.
In this case, it is just transfer of contract from Buyer \”A\” to Buyer \”C\”. So, there will not be any Change in OI.
In same way, all option buyers, who wants to get rid of their position will do a \”Sell\” transaction, which will ultimatily trasfers the contract to other option buyer.
Then how \”Change in open interest\” be negative on a specific day if Option byuers are unwinding their longs ? Because ultimatily contracts are not being closed, they are getting transfered.
2)
I do not agreed on below statement:
\”Friday: Vikram decides to square off 20 of the 25 contracts he had sold previously.\”
Here, Vikram is Option Seller. As per my understanding, an option seller cannot Decide to square off his position. Option seller has only 2 way:
1. Either he/she has to wait for auto squre-off on expiry date, or
2. Before the expiry, if he wants to get rid of this lot, then initiate a \”Buy\” transaction with some other option seller. This is just trasfer of contract and it will not change the OI.
So, again, the question comes how \”Change in open interest\” be negative on a specific day.
Please correct my understanding.
Thanks
Rana
1) Think of it this way, there are 3 open positions (OI) in the market, with 1 buyer and 1 seller. The buyer decides to reduce his risk and get rid of 1 contract, so does the seller. They both get rid of 1 contract each. The OI reduced to 2 right? Likewise in the market
2) Hopefully the above should help you clarify 🙂
i have one question regarding fii data . i would like to know ,is there any data which can show todays or yesterdays fii buying or selling stock wise
Stock wise, I\’m not sure. But the exchanges do report this number.
Hey Karthik,
I have a more conceptual doubt. Whenever I buy/long on a contract, there\’s no way to know whether I have created a new contract altogether(OI increases) OR someone who just transferred/sold his long contract to me thereby getting out of the market?
That would be tough, Robin 🙂
In option chain, if long build up is happening meaning oi is increasing and price are increasing from buyer perspective market is bullish but we analyse option chain from seller perspective it will go down so which one is correct?
OI is the same irrespective of buyer or seller.
very informative, thank you
Happy reading!
I think your answer is incorrect.!. This column should have value as 1 due to number of trade executed.
What do you say ?.
Yup
Could you please tell me what is the value in column \”VOLUME\” of Nifty option chain. For example I buy one Nifty lot so what will be the value in column \”VOLUME\” i.e., 1 or 75 ?
Option 1: The value will be 75.
Option 2: The value will be 1 due to lot size.
Option 3: The value will be 1 due to number of unique trades today.
It will be 75.
Dear Sir,
i am having one question connected to open interest.if i purchase one lot of nifty i.e 75 shares so in that case there is a contract of purchase of 75 shares and obviously there will be some seller who is selling so open interest will be1 or 75(1 means 1 lot or 75 which mean 75 shares in1 lot)
It will be 75.
HELLO Sir, In option chain does premium at a strike price is affected by change in open interest
Yes, demand-supply dynamics do affect option premiums.
Hi sir, I took this screenshot at 9:40 PM (after market has closed)
Is there is any specific time for expiry, since 26 mar is the expiry date for the contract and the OI is came down to zero.
On the expiry day, you need to see the settlement price of the futures contract. YOu will not get that on the chart.
Hi sir, since future is zero-sum, all the short position has to be covered within the expiry date and vice versa. Today is the expiry date for the march contract. But refer this image (https://imgur.com/a/39cZ8k8), OI doesn\’t comes to zero, why it is so?
Alike \”call & trade\” charge that incur when we don\’t square-off our position\’s for MIS equity orders, Is there is any charges for Future?
OI will go to zero when all positions are net off, which happens at expiry. Charges are applicable to all MIS equity and F&O positions
Hi, I need clarification on options, If i buy call option of SBI of strike price of 200 at Rs 5 and if i sell the same if it goes below Rs 5. Will i get the residual premium ?
Nope, you will make a loss here.
Can you please explain the latest decision of SEBI regarding open interest:
Quote \”Sebi has decided to revise MWPL from 95 per cent to 50 per cent of existing levels in a phased manner. The new restriction will also be applicable to those stocks which hit the market limit of 40 or more in last five days\” Unquote
How does this affect investors like me who buy call options with expiry of 30 to 50 days?
Still waiting for some clarity, but do check this – https://twitter.com/Nithin0dha/status/1241004842312597506
Can we know outstanding future buy Co tracts and sale contracts separately in particular stock
Separately is not possible. Btw, if the OI of a contract is 1, that means there is 1 lot long and 1 lot short.
Sir, this is cash segment..I am asking f&o position..
To hedge, you need to use F&O, Keshav.
sir where to find FII\’s F&O activities? And how to find Wheather they short or long?
You can find the buy sell value here – https://www1.nseindia.com/products/content/equities/equities/fii_dii_market_today.htm
Hi Karthik,
Can you let me know, how to determine \”Long Build Up\”, \”Short Build Up\” , \”Long Unwind\” and \”Short Cover\”?
On what basis are these determined?
Thanks
Srikrishna
There is no particular technique to determine these activities, it comes more from market observations. Here are few pointer which may help –
1) Long/Short build up – prolonged (at least 6-8 sessions) of price rally or decline respectively
2) Long unwinding / short cover – A sudden crash/spike in prices respective after a prolonged build up activity indicating that the positions are now being squared off.
Hi,
Is that possible get indexes option chain data (as per the NSE format) for various expires in PI so that i can link to excel for further strategy development
Hmm, I quite doubt this is possible. You can get OHLC on excel, I don\’t think option chain is possible.
I am fascinated by your GTT order facility, plan to open ac (I already have trading ac with M/s Ventura sec, they don\’t have this facility) I would like know more.
If GTT is used for sale of shares held in Demat ac whether margin is required to be given?
No, margins not required as on now.
I read futures, nice explanations. One query if on has long(bought) future contract which is carried forward next day and if price goes down drastically if suffers heavy loss but if one has future short(sold) and if that company is closed or banned overnight then what happens to that sold contract as there will be no buyer
Well, if you are short and the company shuts down, then you\’ll make a ton of money 🙂 However, if you are long and the company goes busts, then you\’ll have to take a hit.
Why is OI data not available before 9:25 am in the morning as soon as market opens ?
Hmm, not sure. Need to check.
Hi Karthik,
can you help me in understanding what happens on tuesday?
Neha has already sold 10 contracts on monday. How can she transfer 8 contracts to John? how does this happen? I am finding it difficult to comprehend.
If i buy a contract, i can get rid of it by selling/squaring it off. How does this work when I sell a contract first? can i transfer the contract to someone? does exchange permit that?
Aarya, can you run through the comments. I guess someone here had the exact same query.
Sorry to bother you, but please check this statement you have provided with an example above.
As of 4th March 2015, OI on Nifty futures is roughly 2.78 Crores. It means that there are 2.78 crore Long Nifty positions and 2.78 crore Short Nifty positions. Also, about 55,255 (or 0.2% over 2.78Crs) new contracts have been added today. OI is very useful in understanding how liquid the market is. Bigger the open interest, more liquid the market is. And hence it will be easier to enter or exit trades at the competitive bid / ask rates.
In this statement, you clearly say that 0.2% of CHANGE in OI is for that particular day and only OI data IS BEING CARRIED FORWARD.
So when there is 55255 new contracts had been added on that day, the minimum volume of that particular day should equal to 55255 as each new one contract will be counted as one volume. But when I check OI chain, I could see that at certain strikes, Change in OI much more than Volume traded.
Ah, I get your point Shubhash. I\’ll get back to you on this.
So you say that not only the OI but also the CHANGE IN OI DATA is for day 1 from to the expiry? I thought only OI data is carried forward to the next day and CHANGE IN OI is for each day session.
Hmm, by the way, check this – https://tradingqna.com/t/is-the-live-open-interest-oi-data-being-provided-by-exchanges-correct/7208/2
Change in OI as shown in the Option chain is for a particular day na.. so Volume should be equal to or more than a change in OI. isn\’t it?
Although for a particular day, OI itself is carried forward from day 1 to expiry.
Dear Karthik,
Sometimes we see that change in open interest is much more than volume. why is that happening?
for example
today, at the end of the day total change in open interest of nifty option for 12300 strike CE is -450650 and corresponding volume is just 148030.
OI gets carried forwarded whereas the volume is for the day.
The volume counter starts from zero at the start of the day and increments as and when new trades occur. Hence the volume data always increases on an intra-day basis.
if this the case then how we can compare price and volume for inference to make as shown in price and volume table
IE-THERE WILL BE NO CASE FOR INCREASE IN PRICE WITH DECREASE IN VOLUME SAME WITH DECREASE IN PRICE WITH DECREASE IN VOLUME
Maddy, the increase and decrease in volume is with respect to the previous day. So you should be comparing the present-day volume with the previous day.
How ?
Sir,
I want a proper guidance to learn Support Resistance, Candlestick patterns, generic dow pattern, overall sentiment in the market, overall sentiment in that particular stock, fundamental news scan, volumes, and moving averages.
Don\’t want only knowledge all above mentioned .But need to learn for application for intraday .
How to learn ???
where ??
Have you checked the technical analysis module? https://zerodha.com/varsity/module/technical-analysis/
Karthik Rangappa says:
June 1, 2015 at 4:19 am
In no particular order – Support Resistance, Candlestick patterns, generic dow pattern, overall sentiment in the market, overall sentiment in that particular stock, fundamental news scan, volumes, and moving averages.
Sir,
How v can learn for intraday ? Plz give to us a proper resources or institutions or any any trader , who is teaching
Thanks
You can actually use the entire resource here and use it for intraday.
Sir,
Where to get open interest live intraday stock data ?
Thanks
I guess Sensibull does, check this – https://sensibull.com/
Am I talking to a brick all? I just told you CM Markets!
Not a brick wall, but you are talking to a community which is glued into the Indian markets. CM = Cash markets in the Indian market context, which is a very generic term. \’CM Markets\’, is unregulated here in India, so I really dont know what you are looking at and assuming as \”Spot\” data.
CM Markets, there are many brokers that give true ecn accounts
Like?
if you are a spot trader in fx, i dont think open interest for futures or options data will benefit you but would love to see if i am wrong
Hey, I am a spot FX trader, I trade mainly on major FX pairs. How can futures data help me in trading spot fx. I don\’t quite understand your article, if this can be explained that will be massive help
Vijay, where do you get to trade spot FX?
Is open interest for futures or open interest for options any useful for someone who is trading intraday on spot forex and indices?
You can use the OI + volume data. Have explained this in the chapter.
Hi Karthik, is there anyway to see Future and Option OI separately also if there is a way to monitor OI change with Time Filter (eg. 15mins , 30mins change at what strike price ?
OI is different fro each instrument and strike, so it is separate anyway. For option, you should maybe check the Sensibull platform – https://sensibull.com/
Can we say that OI will always be greater than the volume?
Not necessary, Sweta.
the pdf version of this module should be checked for any error
The price and volume to be referred wrt to OI is for the derivative or the underlying, or both?
Makes sense to look at both.
Thanks Karthik. So change in OI not related to Volume.
Nope.
Hi Karthik,
I have a question on Volume with respect to Nifty 50 Option Chain. How do they calculate Volume in that? Is it 1 Volume means, one lot of sell and one lot of buy??
I have shown below one live data from Nifty 50 Option chain of 3 Oct 19 expiry for clarification.
OI Change in OI Vol Strike Vol Change in OI OI
2,17,500 1,18,425 49,065 11750 107 1,350 3,900
11,28,375 1,58,100 86,204 11900 100 2,325 5,700
Look at only Put side where Change in OI is 1350 while Volume is 107 for 11750 strike, whereas Change in OI is 2325 and Volume is 100 for 11900 strike. My question is Change in OI has almost doubled but volume has reduced. I was expecting volume to increase proportionately. Please clarify. Thanks in advance
Yes, every buy and sell adds up to one unit of volume. Also, remember OI is on a cumulative basis but the volume gets reset and starts from zero on a daily basis.
Hi
As per the above explanation, volume increases for every transaction and volume starts at 0 every day.
Then where is the situation like volume decreases come across. can you explain with some example?
Vazid, you\’ll have to compare today\’s volume versus y\’day\’s volume.
hi,
is that possible to provide the \’Chart\’ of open interest with Time for any particular strike price call or put.
like the price-time chart, can we have a open interest with time chart with continuous data( for any given strike price).
in many web-site they provide the Bar chart only. bar chart doesn\’t have the time axis.
i need to capture the change in OI wrt time to identify trend.
regards
debjit.
Debijit, you should check out https://sensibull.com/ for this.
Hi
Intraday trade in future.First buy and then sell will include as volume=2 or volume=1.
Also volume includes
1.Intraday trade
2. trades showing in OI
3 Trades in which one trader either buyer or seller is old one ie buyer or seller holding position square off his position to new seller or buyer
As I understand the volume gives the no. of contracts traded over a period of time and Open Interest gives the number of outstanding contracts. What I am unable to understand is that why the 2 numbers never tally up if u consider a given time frame.
For E.G
On 23/07/19 for for INFY AUG Futures
At 930 am
OI – 18068400
Vol – 1655
At 1030 am
OI – 21301200
Vol – 5047
So there is an increase of vol – 3392, however, the OI has increased by 32,32,800 contracts . As per the definition, for every trade the volume should increase and the OI may stay flat, increase or decrease. Hence, not able to understand how to tally these numbers. Any help will be useful.
Abhik, with every trade the volume is bound to increase…and it will do so till the end of the day. The next day the volume again starts from 0. However, the OI gets carried over from day to day basis, which changes overnight based on the number of open contracts.
hi Karthik
nice write up, here one question, is the volume you mention here is same as the volume showing in (for examble) bank nifty future chart volume (studies)?
Yes, Andrew. It is the same.
Hi Sir,
Answer to question no. 16 in certification exam of \’Futures Trading\’ is incorrect.
Q: Which of the payoff charts represents a long futures position ?
I have the screenshots but here we don\’t have any option to share them.
Thanks !
My 10 marks were deducted without reason 🙁
Let me recheck on this Jagdish.
I want purchased stock zerodha coin ? but can not purchased. not solve the problem by zerodha.
Vijaykumar, you cannot buy stocks on Coin. Coin if for transacting in Mutual funds. You can use Kite to buy stocks – https://kite.zerodha.com/
I agree with Andra comments. I have seen number of articles and videos (on youtube) people talking about accurate predictions. Mostly they talk about levels. They say nifty will take support at \’X\’ and if it breaks it will go to \’Ý\’ on the higher side and reverse if it is on the lower side. They will give you S1, S2, pivot, R1, R2 which is easy to calculate using the standard formulae.
This prediction is always true because this happens on any day. Next day video says that his prediction was correct. As you say it is easy to teach than to trade. Most advisory services test their predictions and knowledge on others. If something comes out positive they claim that they had predicted it, and if not they give you incomprehensible explanation. It is your judgement and your luck that works, nothing else. You can\’t fight with the market, go with the market.
The craze for intra-day trading has brought all this analyses all over. Stock market is not a place of earning because it is zero-sum game. If you earn today you will lose another day. If advice of people really work, they will never tell you. They are only testing their understanding with your money.
Have a fixed capital, buy Group A shares/Nifty 50 shares during dips. Take out profit as and when you need and repeat the same again and again.
Cannot agree more with you, Ramkrishna.
[…] to track when actively trading F&O contracts or their underlying stocks. You can check this chapter on OI on Varsity to learn more. Change in OI indicates the strength of the price move, as explained in […]
hi
Please clarify
When Neha sells 10 contracts on Monday who is buying it. Is it Arjun and Varun. if yes then the transaction is closed correct. if not then who is buying from neha?
Yes, the 10 contracts sold by Neha is bought by Arjun and Varun. The transaction is closed and in the process, 10 contracts are open in the market. Therefore the OI is 10.
[…] to track when actively trading F&O contracts or their underlying stocks. You can check this chapter on OI on Varsity to learn more. Change in OI indicates the strength of the price move, as explained in […]
Hi Karthik
can you detail more on OI, volume correlating to Cash market volume & delivery for trend confirmation, consolidation, reversal, breakout during Uptrend and down trend markets. As I come to know it is a vast subject with many permutations and combinations. Or else at least suggest some authentic books will be very helpful.
Everything there is to know about OI is already discussed here, Hemanth. At least the things that I know about this topic 🙂
Hi Karthik,
In any option chain what is unit of OI; Volume.
Somewhere i have read \”Go for Naked Long in PE/CE only when Volume at the Strike Price > Change in OI\”. Is it correct??
Pankaj, I\’m not sure if that theory or volume > OI makes sense. It probably does, but you need to backtest this before using.
Thanks Karthik, however can u clarify the unit of volume and open interest. My understanding is open interest is no. of shares i.e. [500 (lot size) x no of lot] whereas volume is no of LOTS.
Also, can u explain why volume is less when there is sudden huge change (addition/deletion) in OI.
Pankaj, OI and Volume for futures is the number of shares. Volume is on a daily basis (gets reset to 0) at the end of the day, whereas OI is on a cumulative basis.
I have a basic questions on open interest.
The OI which are shown on option chain, is total no of shares or no of lots opened.
For example, icicibank 30 may 420CE has around 20.6 OI.
Is this 20.6 lakh no of shares ie 20.6 /1375 = 1498 no of lots are there , or
total or 20.6 lac of lot available.
Rahul, it is the number of shares. So you need to divide that with the lot size.
Thanks sir for clarification
Cheers!
please also make moduel on \”HOW TO MAKE CAREER IN STOCK MAREKT\”?
Interesting will probably do that 🙂
how can i see crude oil option chain ?
its not available in system or what is the reason?
samaj nahi aya
Arun Ney pheley 6 lot buy kiey ok then phir varuin aya 4 lot buy kiey uske baad kya huva
Hi karthik,
I think in this module 12.2 OI and volume interpretation there is a typo error!!
Please look into the table price, volume and trader\’s perception table.
2nd row must be bullish trend could probably end, expect reversal
4th row must be bearish trend could probably end, expect reversal
Please correct me if I\’m wrong!!
Let me check, Harsha. But a cautious stance is what should be expected.
Hello,
Can we see OI option in Zerodha Kite platform?
As of now, NO!
Hi SIr,
I have 1 doubt.. When you say OI as 1 unit.. So in case of future it is easy to think as 1 unit but what about options? We have 2 option CALL and PUT.. So how does 1 unit defined in that.. Is it ok to consider 1 unit as someone sells it in CALL and buys in PUT or vice versa. Also, how do you relate it to strike price. Like a selling at 1 strike price and buying in on same or other strike price.. Is it also consider a single unit?
That\’s still ok, Tushar. Look at option OI at a strike specific interval. This will give you a better perspective on OI.
So if i consider an example for today option data..
CALL
OI change OI Net Change strike price
2,925,225 230,775 -52.80 11500
PUT
strike price Net Change change OI oi
11500.00 21.00 -304,650 2,328,900
On same strike price i see in call side Call writing (sell) is happening and on PUT side short covering is happening (buy)..
So can i consider this as 1 unit..?
No Tushar, these are two different option types. You cannot combine the OI.
oh Thanks.. Its cleared my doubt.. I need to see in same option type..
I have 1 more question related to Index Future/Option.. When we are saying that net position of FIIs are positive in Index Future so that means FII purchased Index Future or short Index future… and When there position is negative in Index Future that means they have square off their position… Or in case of short Index Future FII position would be negative..
Same on Index option.. When we say there position is positive than that means either they have buy the call or put or short it.. in case of negative net position than that means they have square off their position (long unwinding or short covering) ..
The net position is indicative of the total buys minus the total sells. If its positive that means they are net buyers, if negative it means they are net sellers. In options, its on a strike wise basis.
Dear Karthikji, Good evening
Where to find OI chart for Indices as well as stocks that\’s plotted in simpler way? I need for mobile only. Both In kite & some other apps or link ??
You can check the OI information on Pi, it is presented as a number.
Per definition above, Open Interest (OI) is a number that tells you how many futures (or Options) contracts are currently outstanding (open) in the market
It means, if i buy 10 lot in future march series and sell 10 lot of immediate OTM call option of march series, open interest should be 20 lot. I use nest trader wherein i see open interest of curr date, does it consist of both option and future.
Option is generally use for hedging/writing den why link option data with future? Why the strike price wherein OI in call side is maximum, is called resistance.
Pankaj, it would be 10 lots OI in Futures and 10 in options.
Option is generally use for hedging/writing den why link option data with future? —–> Options is also used for speculation and arbitrage.
Thanks karthik. It means OI for futures and option is measured separately.
I use nest trader software let\’s say for any particular stock my filter for long buildup (in future) is (+) 7% change in OI and (+) 1.5% change in price. Suppose at particular time, i link this filter with option chain for that particular stock then it is meaningless to retrieve some view/trend.
Yes, because the OI for futures is different from OI for options.
even though it is said that futures price mimics spot price, I have often found spikes in intraday futures price of stock futures which are not to be seen in the spot price? Why is it so and how can we avoid it?
This is because of the individual contract\’s demand and supply situation. Although these spikes occur, it does not really stay that way.
[…] does not always work, this is a great way to detect support and resistance levels. Do check this Varsity chapter on Open interest and this one on PCR/Maxpain. Also, make sure to check out https://sensibull.com, it has everything […]
Hi Karthik,
I wanted to know if something is needed to be done in order to roll over a futures contract (Long/Short) into subsequent Months/Series\’ or is it the system that rolls it over automatically if not squared off. Please let me know what is to be done in order to roll over a contract into subsequent months (if the system doesn\’t auto roll over) on Zerodha platform.
Thank you in Advance
Regards,
Kiran Raj C J
Kiran, you will have to do this manually by squaring off the current month contract and initiating the same position (same quantity) in the next month.
today placed order for buy BANK NIFTY OPTION 28000 PE AT 444 SAME WAS REJECTED WITH REASON
RMS RULE : OPTION STRIKE PRICE BASED ON LTP PERCENTAGE FOR BUY ORDER FOR ENTITY A/C
ACROSS EXCHANGE ACROSS SEGMENT ACROSS PRODUCT
ON 15.01.19 ALSO I PLACED ORDER FOR BUY BANK NIFTY OPTION 28000 PE AT 580 AND AT 581 BOTH ORDERS WERE
REJECTED WITH RMS RULE MENTIONED ABOVE PLEASE EXPLAIN THE REASON????
Starting with Thanking you Once again!!
I have few queries as below. Request if you can clear these doubts.
1. You told a concept of Spread and how we can utilise that to make profit. How often we can see those situations where the spread between the spot and future is significantly high?
2. Does the future expiry date remains same for all the future derivatives? e.g. TCSJanFuture and JETAIRWAYSJanFuture will end on the same day?
3. You talked about “rollover”, In case I want to rollover then do I need to sqroff my position on Expiry Date and Buy the Next Future or that happens automatically if I just don’t do anything?
4. Does the lot size changes for any future? E.g. If TCS has a lot size of 125 shares then will it ever change or will always remain same?
5. As future price moves with the spot price. So any buying or selling opportunity can be found using the TA of individual stock itself or do we have any other ways of TA for future please?
6. The beta of a stock generally will be daily with 30days, weekly with 90 days and many others. Which one should be considered while taking a trade?
Too many queries I believe. Sorry for that however request your help please.
Suvajit
1) Check this – https://zerodha.com/varsity/chapter/calendar-spreads/
2) Yes, all F&O contracts end on the same day
3) Roll over means you square off the current contract and buy the same thing in same quantity in the next month contract
4) Yes, this is subjected to change
5) TA is applicable to both Fut and Spot
6) 90 days is good.
Good luck and happy trading.
Thank you Karthik!!
Welcome!
Hi Sir.
I have read your modules on tech analysis and futures trading, and they are simply awesome. Thank you for your kind work sir. I just have one doubt. I am not able to understand as to how to trade in oil futures as in do i use the tech indicators like candlesticks, RSI, MACD, Bollinger Bands or do i use macroeconomic events and news to place my trade. Even if i use both then should i give more importance to the technical indicators or macro events or what should be the optimal trading strategy for it.
Thank You Sir!
Nakul, for commodities, I\’d suggest you stick to technicals. Getting a grip on the fundamentals of commodities is quite a task.
Your distributor Pivottrading.net has a tool in their website for option trading stratagies through Zerodha. Using this tool you are able to place multileg order on Zerodha by a single click. I do not understand why you have not provided this tool in Kites. Please include option trading strategy tool in Kites which will be a great help to your customers who trade in options
Thanks Sudheer, I\’ll pass the feedback.
why open interest is not zero on futures contract expiry day ?
You will have to check this end of day.
Hello Sir,
Please help me, I have one confusion that does price and change in OI co-relation to analyse market trend is same on call side and put side???? Like if
On call side Price decreases and OI increases the market has Bearish sentiment but if same thing happens on put side what would be the market sentiment??
Please guide.
Yes, thats right. You will have to look at the price, OI/volume in conjunction. Yes, the interpretation is the same for both calls/puts/futures.
Please add OI% change in PI
Ok.
Hi..How can OI decrease for European Options..squaring off is nothing but a transfer right…so on friday how can vikram square off his short position to arjun.. as he is already his counterparty..pls help me in understanding this!! Thanks
The square off results in the netting off the entire contract, Alok. Hence the OI reduction.
Ok…since both of them decided to square off..the OI decreased. Thanks.
Also, is there any way to know if OI increase is on account of a long initiation or short initiation.
No, that would be really hard. You can, however, check the OI of calls and puts to get a sense of this.
Thanks!!
Good luck, Alok.
Hi,
In the above example, since Neha already went short on 10 contracts she held on Monday, then how come she has any contract left for Tuesday?
Additionally, the below line confuses me as it seems she has already gotten rid off the contracts she held.
Tuesday: Neha wants to get rid of 8 contracts out of the 10 contracts she holds, which she does.
Please help me understand.
Thanks,
Amit
Amit, the example states that out of the 10 short, she bought back (squared off) 8 contracts. By doing so she just transferred 8 contracts to John, so no new contracts are initiated, it is just a transfer. Hence OI remains the same.
hello sir,
Happy diwali to you and team zerodha..
Sir i have noticed oi of lt in dec and jan contracts are up by 300-500% and price is also increasing..now how to intwrpret this..if traders are bullish why not buy the current months contracts?
Is it Indication of bullishness in long term??
Thanks, Shyam! Wishing you the same 🙂
Maybe the traders have a slightly long-term opinion on the stock. Btw, is it the Futures OI or Options?
sir it is futures…even jet airways oi futures up by 100% in jan 2019 contracts.
nov and dec jet airways contracts are up by 9-10 5
how to interpret this?
This explains. Perhaps, traders expect some sort of relief rally in Jet hence bought into 3rd-month futures. Evident with the increase in OI.
Ok sir.
But my que is why not buy current month contracts? is there any reason for buying far month contracts?
or are they used for hedging purpose?
Far month contracts have maturities 3 months later, so there is no need to roll over month on month.
Hi
Is it possible to check change in open interest in real time. Suppose at 10.00 AM, there are 2000 open contracts. At 11.00, these are changed to 2200. So there is change of 10% in OI. Now at 11.30, these contracts are changed to 2420. So again there is a change of 10% in between 11.00 -11.30. Is it possible to check open interest data this way.
Thanks.
Sandeep, yes, I\’d suggest you check Sensibull for this, they have OI graphs – https://trade.sensibull.com/home
Thanks for the reply. I have checked the link, however it shows OI data change from previous day.. not intra day..
Also it is OI data for options.. I need it for futures.. If I am not wrong, these two are different.. I need info on how many contracts are open in futures in a script and how these are changing every hour. Is it possible to get it?
Thanks again and have a nice day.
Check this, Sandeep – https://tradingqna.com/t/is-the-live-open-interest-oi-data-being-provided-by-exchanges-correct/7208/2
Hi,
Can you guys add greeks data points ( Delta, Theta, Gamma, vega) in the options scrip price by creating a tab along side. This would really help. if not all, delta is must.
Upstox has same features…
Sunny, Sensibull offers details beyond the option greeks. Check this – https://sensibull.com/
In above table (ie. Tuesday count) I think Neha\’s count should be 2S and in the Sell column. Not 8L. Correct my understanding that Neha is simply transfering her 8 position out 10 to John. So still she is short with 2 contracts.
Nino, I believe you misread the Buy/Sell column. It only denotes that the position initiated on Tuesday, which is 8 Buys, effectively to cover 8 out of the 10 short positions. The last column reads the contract held at the end of that day which is 2 Shorts.
Hi Karthik,
I have a couple of questions.
a. Is there an upper limit on the amount of OI that can build up on a derivative. Is this controlled by the regulator?
b. When you say increase in price in the tables above – Is it increase in premium price of the option?
c. If premium price increases with an increase in OI, does it mean the underlying stock price also increases? Are they directly proportional?
a. Check this – https://www.nseindia.com/products/content/derivatives/equities/position_limits.htm
b. Increase in the spot price, not the premiums
c. Again, this is not about the option premiums.
Thanks for all the help, Karthik. 🙂
Good luck, Binesh!
Sir,
Could you please explain how come value of change in open interest be higher than the volume in option chain of nifty.?
Thanks
I guess we had this discussion earlier in the comments. Can you please refer to that?
How change in OI calculated…pls explain me…
and how change in OI is important ?
With every new position getting added to the market, the OI changes. The change in OI on a standalone basis is not so meaningful, hence traders associated change in price to this and draw conclusions. I\’ve explained the same in the chapter.
Dear sir,
nifty 50 index=11008.30
nifty futures 25oct2018 =11061
nifty futures 29 nov2018=11103.7
is it possible to buy 1 lot of nifty
futures 25oct2018 and sell 1 lot of nifty futures 29 nov2018 at the same time tomorrow.is it possible to do two trades at the same time? what will be margin amt?
Yes, you certainly can. This is called a calendar spread. Since you are long and short on the same underlying (different expiries), the risk is mitigated, hence lower margin requirement. Check this – https://zerodha.com/varsity/chapter/calendar-spreads/
Hello Karthik and the whole team behind Zerodha.First of all I will like to take this opportunity to thank you guys for this wonderful initiative.Z Connect/Varsity etc are helping newbie traders/enthusiasts like me a lot.Actually I have a qs related to determining \”Support and Resistance Using Options Open Interest Data\”.I am stuck on this point.\”Max/heavy OI on a given Call option indicates a possible resistance and max/heavy OI on a given Put option indicates an immediate support\”for the underlying.Can you please decode it for me in simple terms why?What is the logic behind it.Different websites/forums have different angles to it.Please decode it for me.I am really stuck on this concept.Some websites are saying as option buyers are mostly retail traders and less experienced and proficient and option sellers/writers are more ex and proficient so if one has to bet,bet on the more ex and proficient side as odds of winning go up.Does it makes sense?Please decipher it for me.And please do explain in detail (if possible) why we take the given levels as resistance and support based on OI data.
Archit, the general logic is that if a specific strike has a huge OI built up, then the chances of that strike (corresponding spot level) working as a support or resistance is quite high. Remember, this is just a perception and there is no real logic as such (have also indicted this in the article).
Thanks a lot Karthik for that quick reply.Just one more very basic level query related to OI and Price analysis.If you have already answered this qs multiple times please provide me the link to it if possible.So my qs is when we say that,when the OI is going up and price is falling it is usually a bearish signal and when the OI is going up and price is also going up usually it is a bullish signal. What is the core logic behind it. As for every option/future seller there is a buyer as well.Is it due to the demand and supply rule or something.What am I missing here.How are we coming to this conclusion of more trades on the long/more trades on the short side scenario,when a seller equals a buyer.
Archit, increase in OI means more positions are getting added. So the increase in OI with a decrease in prices means that prices are falling and traders are adding to the position….this implies strength in selling. Likewise, decline in OI means fewer positions getting added hence whatever is the trend in price, may not sustain through.
Do note, these are empirical, so its advisable for you to backtest it once 🙂
Karthik,
yet another query: What should one do when current month futures is trading at slightly lower value than SPOT & its fair value? And also when the fair value is EQUAL to SPOT price? The Mid month contract also is trading at not such a great premium & CMP of mid-month contract is below its fair value?
In both case of current month & mid-month, OI has come down heavily (13% & 9 % respectively) but price has gone up slightly.
How does one read these & set up their trading?
Thanks
Srividya
All these variations gives scope for arbitrage trades, but you need to ensure the spreads are good enough to carry out the trade.
Karthik,
Thanks for detailed explanations on various aspects of Stock markets, the jargons & how to read indicators.
2) I am slightly confused on one aspect though. During the week of 10th Sep 2018, i was tracking quite a few stocks which as per the pattern of candlesticks for past 6 months & also the indicators like EMA, Alligator, should have fallen. However, mid-week, all of a sudden, they started moving up. That too quite dramatically. How should one understand or read this?
3) When buying / selling Futures, should one be reading charts of Futures or of underlying SPOT, to identify signals & trading opportunities? And when we do read these signals, should we look at indicators of a Day / Week chart or hourly chart?
Thanks
Srividya
1) Its best if you apply TA for short-term, Srividya.
2) Spot charts. I\’d suggest you look at day charts.
Thanks. That helps.
Guess the week of 10th & 17th (overall, the month of Sep 2018) will be one of high volatality 🙁
Volatility is the very nature of the market, keeps coming back every now and then 🙂
the effort is amazing Kartik sir……m a very beginner to stock market but this platform allows me to learn a lot from this…..huge respect to uh sir…but sir I want to know as a beginner that only technical is enough for day trading or else something I need to learn….and one more question sir…aapke sb modules enough hai ya or kuch b khi se gain kr sktee hai sir…..and on what I should
focus on fundamentals or technicals…because I want to trade in mcx so please guide me how do I start ……
Thanks for the kind words, Priyank. Yes, technical is good enough for day trading. I\’m quite confident that you will be in a much better place if you can read through these modules 🙂
In the futures pdf, Open interest section, it is mentioned.
Price OI Traders Perception
Increase ||| Increase ||| Bullish
Decrease ||| Decrease ||| Bearish trend could probably end, expect reversal
Decrease ||| Increase ||| Bearish
Increase ||| Decrease ||| Bullish trend could probably end, expect reversal.
Can you explain me the second and fourth point.
When Price decrease and OI decrease, How will bearish trend end and will become BULLISH? When all traders are selling how will it become bullish?
If it was indeed a real correction, then there should have been associated volumes. Hence, a decrease in price but without any increase in OI means the price decline is questionable. I\’d suggest you use the same logic for the other point as well.
Thanks a lot Karthik for a quick and fast reply. Appreciate your wisdom and your sound knowledge.
Happy learning, Sanjeev 🙂
Hi Sir,
1. Why a stock is banned when the OI crosses 95% MWPL. What is the reason for doing so?What would happen if it is not banned even after crossing 95% MWPL?
2.Why do F&O stocks don\’t have circuit limit?What is the reason for not setting a limit for then?
3.If a stock is banned in F&O since because it has crossed the 95% of MWPL, then will its underlying have a circuit limit?
4.I have read somewhere that only swing/position trading after a Ban of a stock will lead to a penalty of Rs.5000.But when a stock is ban period, you will be able to do Intraday trading without any penalty since it does not change the OI. Is it true?Or does it depend on brokers (Do some broker allow to do so and do some don\’t)?
I am wondering why didn\’t you mention anything regarding F&O stock ban in this OI chapter and in entire Future\’s module !!!
1) One of the reasons could be that the risk increases systemically for everyone, hence no new position could be allowed
2) These are the different mechanism to prevent a systemic meltdown
3) Nope
4) No broker allows, but if you manage to place a trade and that goes through, then there is a fine imposed.
Hi Karthik,
Yesterday, OI of OCT NIFTY 11500 PE has increased (..suddenly ) by more than 500% with hardly any change in the price of NIFTY ; How could we interpret this ?
SIR, THANKS
you explained it with much simple way..
Happy learning, Sandeep!
Hi kArthik,
Why the option call premium decays even after the spot price is more than strike price for some stocks….
This usually happens when the volatility is cooling off from elevated levels. Remember, when all else equal, when volatility increases, the premiums increase, when vol cools off, so would the premium.
What are the indicators for OI trending / tracking at Zerodha Kite?
Nothing specific to OI, Venkat.
there are instances in which OI change is say 4,00,000 but volume is 1,00,000. can it be that volume is lesser than OI change ? please explain with eample
Possible, Mitesh, since OI is cumulative, gets carried forward from previous day and volume is for the day.
Hi Karthik,
I have a question on commodity market.
I am actively participating intradaytrading in nickel and copper, since it quite volatile counter often i face sl hit. Could you please advise what sort analysis we should do for setting up SL. Also evening session would be better for commodity trading ( Considering US market and data)
Thanks in advance.
Check this, Swapnil – https://zerodha.com/varsity/chapter/volatility-applications/
Hello,
Can you provide some insight on Roll over option used in futures using an example?
Thanks,
Bala
Rollover is very straightforward – you close this month\’s position and initiate the same position in the next month\’s contract. For example, if you are long 2 lots of Nifty Futures July contract, you close this contract and buy the August contract….effectively, you are continuing on your view.
On NSE website there a link which also tells Stock wise OI
https://www.nseindia.com/products/content/equities/equities/oi_spurts.htm
Why they are different from Bhavcopy- Change in OI and what does these numbers signify.
What is the difference between By underlying and By Contracts?
They cannot be different, Sanchit. I\’d suggest you check with the exchange if you spot a major difference.
By underlying – is going by individual stocks
By Contracts – is going by the contracts (lot sizes)
In derivative Bhavcopy, there is a column : Contracts( column K). What is this and significance?
Sanchit, its best you check with NSE for this.
How to check with NSE directly?
Is there any email id where I can mail with query and they will reply with explanation?
Here you go, all the numbers and address of NSE – https://www.nseindia.com/global/content/contact_us/contact_us.htm
How to interpret change in open interest.
Its best you look at the change in OI with respect to change in prices. I\’ve discussed this in the chapter.
Hello Karthik,
What does it indicate when a stock shows an increase in Put Open Interest with a decrease in price and an increase in Call Open Interest with an increase in price? IMO, it means that people are going long on CE and short on PE which means a bullish trend. Please correct me if I am wrong?
Increase in Put OI + decrease in price = Bearish outlook
Increase in Call Open Interest + increase in price = Bullish
These are empirical observations in the market, Kanika. No concrete science backing this.
Thanks Karthik!
Hello Sir,
i want to give one suggestion to Zerodha that
i have read a book \”Alexander Elder – The New Trading For a Living 2014 \” where the the Trade Journals and Record keeping is explained in details so in zerodha is there any option to keep that things in app or any software so that we can keep each and every record of our trade and get to know about the self trading pattern.
Aslam, this is something we have been wanting to do. Its on the list of many things to do 😉
Hi Karthik/Kamat,
1. Can one buy 5% of open interest at a particular strike price say 10700 CE current month?
2. What is the position of expiry of in the money options now after some nse circular? Is the high STT thing of the past? Eg. 26500 BN CE I buy say 40000 (5% of open interest at this strike) at Re.1 and it expires at Rs.3.5. What is the position?
3. Is day\’s Options trading profits allowed as margin for intraday trading for the same day?
1) There is a restriction of 15% on a trading member. Check this – https://www.nseindia.com/products/content/derivatives/equities/position_limits.htm
2) Yes, no more STT trap, check this – https://tradingqna.com/t/no-more-stt-trap-on-exercised-in-the-money-options/18977
3) Options are not settled on a M2M basis, so this is not possible.
please see below link of nifty option chain
https://drive.google.com/file/d/1xpdNPO1ITMM7Lr8RYtieO5BM7gstRhwk/view?usp=drivesdk
Apologies there seems to be some issue in prnt screen button in my laptop.
After going through this chapter My analysis for Nifty tomm.
Please advice if my thought process for analysing the market is right or wrong.
CALL Strike prices( 10400,10450,10500) Premium and OI are down – > This means traders are covering their long positions. As and when this is done prices are under pressure and there will be further fall in premium
CALL Strike prices( 10550,600 and 650) – Premium falling and OI increases – which means short positions are buiding up and prices may fall further.
Like wise in puts ( Strike price 10400 to 10650) OI and price are increasing which means there will be increase in put prices
Looks to me the market will slide further tomm. Apart from this prices are below 4EMA , 18 EMA and 50 EMA.
Range of nifty:- ATR is 99 – Which means upper range is 10756 and lower range is 10558 .So nifty may trade in this band tomm.
Shyam, the premium reduces as your traverse from ATM to OTM. Likewise, when you traverse from OTM to ITM, the premium increases. This is true for both calls and puts.
About the range – yes, I would think so 🙂
i have one doubt..does oi data in lots or number of contracts. for eg,if oi for nifty is 1 does it mean qty is 1 or 1 lot i.e 75 shares
It means 1 Nifty. This is the reason why OI data always looks so large 🙂
Dear Karthik,
In the above chart of trader’s perspective with respect to changes in the OI and prices
Price OI Trader’s Perception
Decrease Decrease Longs are covering their position, also called long unwinding
Increase Decrease Shorts are covering their position, also called short covering
I understand when Price are Decreasing then the market is on Bearish side and Shorts must cover.
and when Price are Increasing market is on Long side and expecting reversal so Long covering.
Please correct me and thanks for clearing my doubt.
Yes, Ritesh. This is in line with what we have discussed in the chapter as well.
Hey Karthik,
So…just finished reading the module, a second time, just to be thorough with everything. Great write up as always! Planning to start trading futures ASAP after allocating sufficient funds. Would appreciate your advise on the following:
1. How much minimum capital do you think is required to start trading futures? This I am talking positional trades and not intraday.
2. I am sure you must have open positions in your Zerodha account. Since we don\’t have a GTC/GTD feature in Kite or Pi, how is it that you set your stop losses for your open positions? Do you log in every morning and set your SLs or is there a workaround to this?
3. And why doesn\’t Zerodha offer any GTC/GTD feature while many other brokers are? Imagine if you are positional short term trader and you have 10 open positions. You must log in everyday to set SLs for all your open positions? That\’s one huge shortcoming and not to mention pretty tedious for a trader. I know NSE doesn\’t allow this but then many brokers are providing automated workarounds for this.
4. Lastly, is it possible (with Zerodha) to get continuous chart data (let\’s say 6 months) of any future contract, without having to look at it\’s respective underlying?
Thanks for your help.
Regards,
~Abudhar al Hassan.
1) The minimum margin is about 65K for Nifty futures. Stock futures varies between 60K – 1.5L. Apart from the margins, its good to have some buffer capital to accommodate for daily M2M.
2) Yes, we have to log in every day and place the SL/target order. Unfortunately, no workaround for this, yet.
3) I understand this is one of the things on our to-do list
4) Yes, this is possible. Open the chart in Kite, click on Display, scroll to chart preference and click on continuous data
Thanks Karthik, desperately needed continuous data. Thanks for the help.
Regards,
Abudhar al Hassan.
Oh ok..so it\’s only available in the daily timeframe? 🙁
Yes, for now.
Cheers!
Hey Karthik,
Hope you are doing well.
I am trying to trade equity futures (positional trading on a daily time frame) with a capital of 1Lk (94k actually) taking a 1% calculated risk per trade. However, whenever I analyse the underlying stock to initiate a trade, the SL (usually near to a S&R) turns out to be way more than 1% of my capital, leaving me no option but to trade equity intraday (which I don\’t want to).
1. Could you please advise whether it would b wise to increase the risk percentage?
2. If not, then what else can I do to trade futures (other than increasing my capital)? Would it be correct to analyse intraday time frames (15mins or 1hr) for positional trades (asking because that would reduce my SL placement) ?
3. How do we draw S&R(s) with respect to price gaps? Should we consider the gap or ignore them?
4. Had requested this earlier, but requesting again…anyway you could setup a module on intraday trading (with live videos perhaps)?
5. Please provide GTC/GTD orders in Kite or Pi? Pretty please… 🙂
And finally, thank you very much. I know..lot of questions…I am sorry (please don\’t be mad) 😀 .
~Abudhar al Hassan
1) If you are increasing the risk percentage by force, then you are already adding an element of stress, which you dont want 🙂
2) Have you checked MIS option?
3) Consider them but go about plotting the S&R in the same way as you would
4) Will try to so that
5) This has few tech constraints, we are on it 🙂
Please feel free to ask as many questions as you want. Anyway, sincere advice – start with small quantities of equity, build capital, and then move to futures.
Karthik ji first of all I am very thankful for this world class material for stock market.
Que-1
How SGX nifty futures can be trading before underlying start trading i.e. Nifty 50
Que-2
Also recently SEBI has announced that derivative market can be kept open at the discretion of stock exchange till 11.55 pm.
My question is how derivatives can be traded while market is closed.
Thank and regards
Pramod
1) That is just a derivative of Nifty, so no problem with that
2) Well, derivative can continue to trade but will get adjusted when the normal spot opens up.
sorry sir for repeatative questions but i have doubt as follows.
Q-1 Then how the price can change without change in underlying..(nifty india)
Q2- Means you are saying that there won\’t be any movement in premiun after 3.30 pm. as spot market is close but the premium may change due to other option greeks.
thanks and regards
pramod
1) Becuase the underlying has 50 shares, shares move, so would the index
2) Yes.
Thank You Zreodha. I gain something.
Good luck!
where can i check change in OI intraday? ( graphically)
I\’m not sure where this is available graphically, but NSE publishes the change in OI on a contract to contract basis.
Hallo sir , thanks for providing us such a valuable content ,
sir may you plz tell me that from where i can get the historical data of daily script wise change in O.I. , like its given in o.i. spurts on nse website for the privious day , so where could we gate it historical data
Check this – https://www.nseindia.com/products/content/equities/equities/eq_security.htm
Sir ,once a futures contracts comes into market, that is, someone sells it and someone buys it, then until the expiry the contract cannot vanish from the market, right? I mean both the seller and the buyer can transfer their risks but until the expiry the contract will exist in the market. Am I right ?
Yes, the contract will continue to exist in the market till expiry. Only the ownership of these contracts changes hands.
Thnx sir ?
Welcome!
Hi,
If you can please explain the recent changes in the rules made by sebi regarding Futures market like
1) MWPl
2) Physical settlement of some stock futures. And how physical settlement will be done.(sebi has recently released a circular that had 46 stock futures that will be physically settled)
3) I also read that sebi wants to limit retail traders from derivative market. What are the rules who will be eligible?
1) Market Wide Position Limit (MWPL) basically imposes limits on how many contracts a broker or his clients (collectively) hold. More on it here – https://www.nseindia.com/products/content/derivatives/equities/position_limits.htm
2) We will explain this shortly
3) That has been their intention for a while, nothing has changed yet.
Varsity is absolutely amazing work by Zerodha. But I want this work should ceaseless.Zerodha community should update Varsity portal on regular basis.So that Zerodha clients get benefited by some new knowledge everyday.
Sougata, the comments are updated everyday plus new chapter is updated once in 10 days. So it is quite active.
Hi,
Mr Karthik Rangappa,
What is meant by Short/Long Covering in Futur/option market and why if OI decrease the price will Increase/decrease and visaversa, on what condition it will happen. Kindly explain.
Is there any website that tells about the live market Change in OI / Chage In Volume / Chage in Prise in one screen of all F&O stocks.
Thanks in advance
Manjunath S
Its explained in this chapter, Manjunath.
suppose today market close and hindalco price up by 4rs and open interest up by 22% then what is activity for next day should i
buy hindalco call or put. please suggest
If both OI and price has increased, then it suggests that the price is likely to go higher over the next few trading sessions. Please note, this is just empirical, there are no guarantees in the markets.
Dear kartik,
How does one find out stocks where there is heavy call writing??
You have to look the Open interest on an EOD basis to evaluate this.
Hello sir,
can i buy 1 lot of nifty futures in preopen session???
Pre-open session is only for Equity markets. Futures & Options trade only between 9.15 AM and 3.30 PM
Hi,
Where can I get real time data on open interest for Intraday trading? I searched both kite and Pi but could not find it. Please help.
Shankar, I\’d suggest you read this – https://tradingqna.com/t/is-the-live-open-interest-oi-data-being-provided-by-exchanges-correct/7208
Hello Sir,
The last lines in the above chapter -\” Updated : 24th Aug 2016 – If you use intra day OI information as a critical input for your trading strategy, then you should read this before you trade.\”
Unable to open the file \”read this\”. It says under maintenance. Can I access it in some other way sir???
Thank u sir
Aishwarya
The hyperlink has been updated. Can you check now?
Thank u sir. Its working now
Sir,
Does OI give a clear idea of short interest of F&O?
Not really, its only empirical.
Hello sir
I have recently opened an account with Zerodha with an intention of trading, i have been transacting in equity market for quite some time,i am planning to start trading in derivatives hence i have few doubts can you please clarify??
1.Can i trade in Futures by referring to spot market charts or should i refer to future contract charts to take a decision for trading future contract??
2.Suppose if i have to look for future contract charts being a position trader what is the chart period i have to look for??
3.And while referring to indicators in future contract chart what is the period should i consider??since the chart data available will be for one month or two month based on the contract type
Eg: Should i consider 14 periods for RSI or less than that.
4.Which contract to trade for should i consider the near month,mid month or the far month??what would you suggest for a beginner like me??
Welcome to the Zerodha Family, Chethan 🙂
1) Yes, you can. In fact, this is the right approach to trade futures.
2) If its intraday, look at 10 or 15 mins charts. If its overnight, look at EOD chart
3) Apply indicators on spot, not futures
4) Near month has maximum liquidity, so I\’d advise near month.
What is meant by call/put writing and call/put unwinding.
Shorting an option is also called writing an option.
Sir I have one quarry….as m new in derivatives so just wanted to know few thing….1) Most of the time we see negative sign (-) / minus sign (-) in option chain specifically in OI Column….can u please tell what does it mean…? 2) Another thing I want to know….are there any limit of contracts that can be traded against each strike price…? I mean how many contracts can be traded against each strike price..? Is thr any limit..?
The algebraic sign indicates an increase (+) or decreases (-) in OI. There are limits imposed at a broker level, but this quite large. Check this – https://www.nseindia.com/products/content/derivatives/equities/fo.htm
Hello sir,
I see that there are 211 company which are trading in futures. Can u plz tell when the NSE update its list…?? I mean yearly or half yearly?
They run a quarterly review on this and update the list.
sir/madam
how can we calculate net to net position of a future contract like there are long to unwind or shot will cover remain by the end of the series …??????
Hard to calculate this, comes mainly from experience. However, indicators such as RSI (overbought/over sold) gives us a hint of such likely activity.
Sir, how to know whether shorts are covering or shorts are building up? I have heard, especially on expiry (thursday for bank nifty) when shorts gets covered price goes up or vice versa. But i dont know how to find such data. Please tell me where i can get data regarding shorts covered or build up..! Is it available on kite?
These are empirical data, Pratik. Does not get reported as such.
Ok, But how i\’ll get knowledge of same?
Like I said, this is empirical, you will have to observe and draw conclusions.
Oh.. Ok sir.. Thank you 🙂
Regards!
Is there a metric which indicates the number of parties that are involved on either side for each strike price in options?
No, there are no metrics as such.
Is there a metric that shows the number of parties involved on the long or short side?
Nope.
sir u r doing excellent work thanks for that
my question is, what is the right option for bullish trend (a) whether to buy call option or (b) to sell put option. what generally people do.
Always, option buying will be a better deal – this is assuming you are very sure about the directional movement of the stock.
Hi sir
I makes lots of spelling mistakes while writing sorry for inconvenience
Ah, don\’t worry, that\’s fine 🙂
Hello sir,
Sir, I have an question about open interest in option market. Today at 18th January Nifty underlying is at 10880.
I generally play open interest from perspective
Today I am watching Nifty option chain for February expiry and for a particular otm option the open interest iS at 1 2 5 7 6 0 0 that lot of sellers expecting that market will not cross that otm and that otm never be turned itm option and option will expire worthless this is justified its ok
But for 10800ce ITM option 10800 Strike open interest stood at 2500k
Now I want to ask you that why sellers agree to enter into this strike option.i know that they received premium.but are they don\’t know that there\’s a high amount of volatility involved right now and premium received by them can be wiped out easily and their positions can be turned into loss making
I want to know that if someone enters into an contract whether he is buyer or seller what he is thinks about market in ITM,ATM or otm
Right now I am just able to understand the open interest from buyers perspective and my thing process is simple as this:-
If market is increasing so but should be interested to enter into the contract specially ITM OPTION
BUT WHY SELLERS AGREED TO
ENTER INTO ITM OPTION CONTRACT
I request you Karthik sir please focus of your answer on seller\’s perspective for an ITM option, why he entered so
Thank you sir
Ankit, different opinions is what makes up the market. By the way you should read this – https://tradingqna.com/t/is-the-live-open-interest-oi-data-being-provided-by-exchanges-correct/7208
Does Open Interest affects cash stock?
No.
Sir,
As I have mentioned earlier, I am a newbie in stock market dealings . At the age of 65, after retiring from a small scale industry , I contacted and got registered at Zerodha.
I feel quite put back to raise my doubts. After making continuous LOSS for the last 2-3 months of trading, I got the guts to put forward my DOUBTS.
When I click on market watch, some important data is opened. BID , OFFER columns Bid volume & offer volume Out of this which is Buy volume , Sell volume ?
Total traded volume is also given . For selecting trading option Which volume I have to consider ?
When I open NIFTO 50 option chain showing CALL & PUT options , what are the helpful data I can collect from it to short list my INTRADAY / SWING trading stocks ?
Please clear my above doubts. I am REALLY SORRY if my above doubts are found SILLY. Kindly answer my doubts.
Regards,
RAJAN A. T.
Sir, firstly welcome to Zerodha!
This forum is meant to ask questions and learn from each other, so please don\’t hesitate to ask questions.
1) Have explained the Bid-Ask and other details here – https://zerodha.com/varsity/chapter/the-trading-terminal/
2) You should consider the volume of the spot or the underlying
3) If you are doing intraday trading with options, I\’d suggest you blindly stick to trading the ATM option as it has maximum liquidity. I\’ve explained what ATM option is here – https://zerodha.com/varsity/chapter/moneyness-of-an-option-contract/
Sir,
Referring your above reply regarding my query \”If you are doing intraday trading with options, I’d suggest you blindly stick to trading the ATM option as it has maximum liquidity. I’ve explained what ATM option is here – \”
For ATM strike option normally the premium amount is high . As I am new I can only trade on premium less than Rs 15/- X a lot of 75 = 1125/-
Should I trade Other OTM option in intraday trading ? As of today 18-01-2018 Nifty option chart shows 10800CE as ATM and the corresponding premium is Rs 61. 20/-
Here I could not afford a trade like this .
Is it because that I have not understand the trading method properly?
Where & how I went wrong?
kindly reply sir.
Regards
Rajan A. T.
You should not select the option strike based on the Rupee value it is trading at. The trade should be backed by reasoning. I\’d suggest you avoid trading till you get comfortable with the logic.
How to add open interest line in chart showing the effect increase and decrease in open interest like OBV does with volume?
Sarthak, both Kite and Pi don\’t have an OI indicator.
One of the reasons we don\’t have it is because of the issues with live calculations of OI, read this post on TradingQnA which has more info
When particular shares are in ban period, it is in futures or option or both. And if it is in option only then it is for particular price or at any price new order can\’t be placed ?
All derivative contracts get banned.
Thanks for clear explanation
Please clear my doubt
Is technical analysis and fundamental analysis are less important in futures?
No, both are very important.
Hi Karthik,Kindly help me to resolve fallowing doubt..
1. HOW TO CHECK &WHERE TO CHECK LONG SIDE POSITIONS ARE BUILDING UP FOR A STOCK(IN FUTURE CONTRACTS)
2.HOW TO CHECK BID&OFFER DIFFERENCE IS BUILDING UP?
1) You cannot check only for long or short side position built up. You need to combine the OI and price and make an inference
2) If you want the regular bid and ask, then you can invoke this using the regular market watch.
Sir,
If I\’m hedging my portfolio by going short on nifty futures and market move upwards then I\’ll be losing on opportunity cost (my profit is capped). If yes then can it be avoided?
Yes, the only loss when you hedge is the opportunity loss.
Hi, can I know which website can I refer to get breakup of OI in Futures. or can I know all the break of OI for Future Stock in PI.
The breakup of OI as in you\’d like to know the number of buys and sells? This will be equal, remember for every buy there has to be a sell, and that will create 1 OI position.
Hello,
Do you think entering a trade which has Increase Open Interest & Increase in Price (weekly basis) \’could potentially\’ be a profitable trade?
Reference is from SmallCase Screener \’Fut: Long Build Up\’
All these factors only increase the probability of the trade to get profitable. No guarantees in markets 🙂
It would really great if you add an article based on the difference between Futures and options.
Lot of people have this query including me . Thanks in advance 🙂
Which difference are you referring to, Sayan?
sir in kite zerodha how we add open interest to the future cotracts????
Not possible for now I guess.
Hi,
I have few doubts with regard to OI, will go one by one.
If change in OI is positive(today\’s OI – Yesterday\’s OI) then volume should be at least equal to count of change in OI plus it could be even more than that.
Isn\’t it?
If yes but alot of time I have seen less volume than change in OI(when change in OI is positive).
Are you comparing the EOD OI? Because intraday OI is not too reliable.
Yes, comparing EOD OI.
How would intraday OI make difference?
Hmm, I need to check this Prateek. Meanwhile, do check this – https://tradingqna.com/t/is-the-live-open-interest-oi-data-being-provided-by-exchanges-correct/7208
Is there any possibility to view intraday OI data…an OI chart for scripts/contracts either in kites / PI?
Nope, not possible.
This is case of NMDC – December 2017 contract
21st Dec End of day –
CONTRACTS OPEN_INT CHG_IN_OI STRIKE OPTION TYPE
1 12000 6000 120 CE
1 54000 -6000 127.5 CE
3 6000 -18000 117.5 PE
3 348000 0 120 PE
120PE Change in OI is 0 but 3 Contracts were traded – would those been intraday positions ?
Yes, as per bhavcopy there is no change in OI.
Should be intraday trades
sorry Karthik sir but first time i don\’t like these cheerleaders in cricket !!
sir my question is that Nifty 10500 strike has open interest = 5641275 what does this mean?
1) 1 lot = 75 Nifty shares so total there is 5641275*75 shares or
2) 5641275 shares means ( 5641275 / 75 )= 75217 lots
>>> what is unit for OI= 5641275 (shares or lots) <<<
It means there are 5641275 open Nifty positions in the market or 5641275/75 = 75,217 contracts.
Sir
Pls explain me that what is realision between
price vs volume vs open interest ….
Pls explain it in triangle realisionship… Every possibility… As early as possible..
Everything is explained in this chapter itself. Please look at the table.
You have not answered why change in spot price is different than future price ?
This is because the futures price is defined as F=Se^(rt), where S represents the spot price. Suggest you read this for more details – https://zerodha.com/varsity/chapter/futures-pricing/
Dear sir,I am askimg why CHANGE in spot price is different then CHANGE in future price ?
Because futures price is dependent on Spot price and under normal circumstances, futures is always higher than spot.
Does 400 contract means 400 lots of particular future ? Pleae clear me..
Yes, 1 contract = 1 lot.
thanks sir
Hi Karthik,
I have been following your series on this zerodha varsity portal, and I must say you are phenomenal in explaining concepts with apt illustrations and anecdotes. You are n inspiration, keep inspiring!!
Thanks
Jay
Thanks for the kind words, Jay! Happy learning 🙂
sir, if i hold options of a security and the next day it comes under ban, then will i be able to exit & book my profits in ban or i have to wait for the ban to be lifted ? how to handle that situation ?
You can only square off the position, Vicky.
Hi Kartik,
If there are 100 Open Interest\’s in an Equity PE Options( OTM). If I am selling one that Options(OTM) and volume being trade is just 5-6 per day. What if I keep my position till last day(30th Nov,Thursday). If there is no voulmes being traded, will i still get to keep my premium or not?
Since OTM diverges to 0. Can u elaborate what will happen on the last day.
Thanks,
If the OTM continues to be an OTM even on the expiry day, then the option will be worthless and close at 0.
ok, so if i am selling OTM which is worthless on last day, i get to keep my premium. I got scared and bought and settled my OTM this month..:) I suppose this is what being panic means. I remember you mentioning in your option class…:)
Can we trade options from smallcase\’s zerodha login?
Yes, you can keep the premiums as long as the option has expired worthless 🙂
No, you cannot trade options via smallcase.
Yes, if you hold to expiry then you will get settled automatically by the exchanges.
i want to know is there any web site where we can get increase in price and increase in open interest of our watch list , pl. clarify
Nothing that I know about.
Hi Karthik
I am new to future trading. It will be a great help if you could answer following.
If a stock in down trend and price are falling slowly but surely & volumes (no. of contract traded) declining heavily but open interest is rising marginally than what the trend suggest ? Does it suggest that bottom has formed and prices are likely to go up or any other trend ?
Also suggest if any other precaution to be taken.
I would be inclined to say yes, had it not been to rising OI. Rising OI suggests the bears are adding more positions – please note all OI related inferences are just empirical. Take this with a pinch of salt.
Hi Karthik,
Thanks for your answer. Yesterday on 14/11/2017 evening I analysed following data and decided to sell \’NCC\’ Today on 14/11/2017.
However \’NCC\’ future rose to 5.68% from the close of 13/11/2017.
Can you please let me know where I was wrong ?
14/11/2017 : NCC CLOSE PRICE : 95.95 (PRICE FALL BY 7.83% FROM THE CLOSE OF 13/11/2017)
Sell only @ 96
Reason for NCC :
On 14/11/2017 end,
Rise in O.I. by 5.83% (13,84,000) TOTAL O.I. 2,51,36,000
Rise in Volume by 299.78% (From 1 Crore to 4 Crore)
PCR : 0.42 (More Calls are sold (Written) than the Put
RESULT : POOR RESULT DECLARED ON 13/11/2017
% of Deliverable Quantity to Traded Quantity : 24.77%
I was convinced that NCC is going to fall but it was other way around. Your detail answer will help me a lot.
Please read second line as
\”However ‘NCC’ future rose to 5.68% from the close of 14/11/2017.\”
Replied earlier.
Reena, all your analysis about volume, OI, PCR, price action etc works alright in the absence of fundamental news. When there is a fundamental news, which is the case here, you need to look at only the Fundamentals. You should be in a position to analyze the fundamentals and make sense of the numbers. Remember in situations like these – fundamentals supersedes technicals and everything else.
Thank you sir.
Cheers!
Thank you so much sir. Indeed great explanation for newbies.
Please help me to understand on following.
1) When a person wants to buy futures contract will it form a new future contract or existing contract will be transferred ? (assuming in both cases sellers are available)
2) What will happen if I bought a futures contract for current month during first week of the month, and I wanted to square it off (sell it) after 3 days but there is no one willing to buy it?
1) It can either create a new contract or it could just be a transfer of risk
2) You can square it off anytime you want, not necessary that you hold it to expiry.
for second answer,
Does that mean we can always square off our position in futures before expiry irrespective of any situation?
Thanks for reply.
for second answer,
Does that mean we can always square off our position in futures before expiry irrespective of any situation? I understand that we can square off before expiry but what if there is no one available to square off before expiry. As per the contract it is always possible to square off on expiry. But there is no guarantee about square off before expiry. Is my understanding correct?
{
my understanding on square off in futures – let\’s say i bought a futures contract, if I want to square off my position before expiry I need to sell it (transfer of risk to someone who is ready to buy it) what if there is no one to buy it before expiry?
square off – doing opposite of buy or sell
}
Thanks for reply.
You can square off the position anytime you wish, however, as you rightly pointed out, if there is no liquidity, then you can not square off….btw, your understanding is correct.
Yes, you can.
I just wanted to know that the Open Interest that is shown in Zerodha Terminal is different from that on NSE website (https://nseindia.com/live_market/dynaContent/live_watch/option_chain/optionKeys.jsp?symbolCode=-10006&symbol=NIFTY&symbol=NIFTY&instrument=-&date=-&segmentLink=17&symbolCount=2&segmentLink=17) though the volume shown matches with nse website. I justed wanted to know which Open Interest should be referred to, the one on the NSE website or zerodha NEST Terminal, and why there is discrepancy in the numbers.
Please check this – https://tradingqna.com/t/is-the-live-open-interest-oi-data-being-provided-by-exchanges-correct/7208
sir,
could you write about future trading strategies. like you have a whole module of option strategies. just one chapter.
Module 10 will be on trading strategies, Abhishek. Guess its gonna have a mix of all.
Hi Karthik,
I was trying to analyse FII statistics report published by NSE. I can’t understand if the report really can be true. I am putting here real data for “Index Futures” for 16 Oct’17 which baffled me for couple of days, finally forcing me to raise it here.
Buy Contracts 47451. Sell Contracts 15748. Also I calculated the “Change in OI” (contracts), using previous day’s data. So Net OI addition was 27925. I did all math, but just can’t understand, how above numbers can be possible. It won’t matter if we say there are so many FIIs buying selling simultaneously. NO, that’s not a proper reasoning.
OI addition need to come from an unclosed Buy or Sell contract. So maximum “change in OI” can be Buy Contracts + Sell Contracts (assuming no intra day sq off btw Buy & Sell) and Minimum “Change in OI” can be difference btw Buy & Sell (assuming complete intra day sq off for the Buy or Sell (which ever has lower volume)). As per this for 16 Oct’17, minimum OI change should be 31703 contracts & it can’t be 27925. Infact I found lots of such days.
Could you please explain elaborately.
Regards
OI calculation is a little tricky as the live data (and I suspect the EOD data) may not be accurate. Read this – https://tradingqna.com/t/is-the-live-open-interest-oi-data-being-provided-by-exchanges-correct/7208
I\’d suggest you avoid building any strategies which rely on OI information.
Karthik, I have read this article before also, but it don\’t solve my puzzle. The article gives a reasoning for why OI can be wrong during intraday trading hours (due to settlement issue), but do not raise question on EOD reports. I am precisely talking about EOD report (FII statistics).
Now if you say that you question even EOD reports also (as you stated above), then there is no sancticy for any EOD report or any other report by NSE. Else, how can you be sure of any other report?? I doubt if this is the case as there would be cases filed against NSE for \”misrepresentation of information\”. The catch here is something else & I really want to know what is that.
Could I request you discuss this with your knowledgeable peers/superiors to find a relevant reasoning. This clarity would be of big help to me as I doing some analysis for which this information would be critical.
Regards
From my experience, all reports from NSE are accurate, except for the intraday OI information. Let me check, I\’ll get back as soon as I can.
Hi Karthik, Were you able to find out. Any update please?
Thanks.
Dear sir,
I have already gone thru your Margin M2M topic and the example given by u is very easy to understand.
I have exactly the same table made to know daily margin shortfall due to M2M. But littlebit getting difficult to understand. I feel I have to take up the matter with my Broker Company as how they are calculating Margin pay in.
Any way thanks for your guidance.
Again I may come with some qyerry in this regard. Pl help.
Thanks & Regards.
Sure, please do feel free to ask!
Good luck.
IN FUTURE WHO DECIDES MARGIN. WHETHER IT IS DECIDED BY NSE AS WAS TOLD TO ME .
I OBSERVED MARGIN AND PROFIT/LOSS IS BEING DEDUCTED SIMLTANEOUSLY.
ALSO I OBSERVED OPEN PRICE IS CHANGING DAILY.
PL LET ME KNOW ABOUT THIS.
Margins are set by exchanges and brokers based on the volatility of the stock/index. Check this for more info on Margins – https://zerodha.com/varsity/chapter/margin-m2m/
hi Karthik Rangappa
one more question what should be the standard no. of open interest and volume for the futures script to be considered liquid?
I\’d suggest you stick to accessing the bid-ask spread, the is a good indicator of liquidity.
hi, Karthik Rangappa,
just completed your module on futures trading explanation was really awesome. material u wrote was great as well. I had a question how can a futures trader evaluate whether futures script is liquid to trade personally I see the how smooth the price action on the chart is.what u do to evaluate whether the futures script is having moderate to good liquidity to take a trade so there is not much slippage even if we get stopped out .it has happened to me a couple of time when risk on the trade was 10000rs but lost 12500or so on the trade due to slippage.
The best assessment of liquidity is the difference between the bid and offer. The smaller the difference, the higher the liquidity. If the difference is high, then less liquidity and best to avoid placing a market order in such contracts.
Where can i see the Open interest plotted in a chart.,I would like to see OI as I would see the Volume in Kite. Any place where I can find this
Nothing available for now, Kabilan.
Is there \’candle volume\’ – chart on Kite
pls suggest
Yes, open any chart > click on display > select the Volume Candle option from the drop-down.
If supply is higher than demand in futures, then futures would trade at a discount. But the confusing part is OI shooting up & price going up in spot & futures from previous day close.
These are 3 different (and independent) moving parts…so it is quite possible.
I traded on Nifty twice (1 lot) after reading your material & made small money. I want to know if Bank Nifty (11th Sep 17) is trading at a discount (lower than spot around Rs 20.75) but closed higher than the previous day (up by 1.14%) & OI addition is abnormally high (25%) on that day, what do you conclude. HDFC Bank gained on this day in a big way(1.56%) but HDFC Bank Futures is trading at a discount of Rs 12/- but OI addition is 3.96%. PSU Banks & ICICI Bank were down.
Frankly, its very hard to comment on such situations, Vishwanathan. To make any sort of conclusions, one has to backtest for these scenarios and check the historical behavior and further looks for consistency in patterns.
Hi Karthik,
Today saw this msg on Kite.
\”Deep out of the money BANKNIFTY options are blocked due to OI restriction by the exchange. If your order is rejected, try a closer strike price.\”
Can you please elaborate the meaning
Check this Ravi – https://tradingqna.com/t/banknifty-bracket-and-cover-order-blocked/14152
If % change in open interest is increasing does it means that trend is positive? can we enter the trade ?
Traders generally associate the price with OI information to make sense of the direction. OI on its own may not help much!
Thank you sir
Hello sir,
What price to refer to get a view of upcoming movement? Spot price or Future price? In general also u have mentioned everywhere to correlate volume and OI with price… So VOLUME and PRICE of SPOT or FUTURES?? pls help sir
I\’d suggest you stick to the spot price, Dinesh.
open interest change in -15% it means what happen in the market?
It means the number of open positions reduced by 15% since yesterday.
Change the name Ajay to Arjun in table in subparagraph 12.2 OI and vol. interpretation. It is adding more confusion in understanding OI and volume.
Sure, let me look through it. Thanks for pointing.
why is vol always less than change in OI in options?
Not true as these not really related.
Hi Karthik,
Is there any tool available ( or can we do it through PiZT) to collect open interest for a particular time frame to analyze the trend ? There is an option in Nest Trader to collect VWAP statistics for the different timeframe, but the problem is everytime we need to manually collect this data.
I\’d suggest you don\’t depend on OI, especially during intraday. Check this – https://tradingqna.com/t/is-the-live-open-interest-oi-data-being-provided-by-exchanges-correct/7208
Hi Karthik,
I was just curious to know that, is it possible to get exact data, of number of long & short contracts traded in Futures segment of any underlying(stocks/indices/currency) on daily basis!? eg ( 50,000 longs vs 35,000 shorts out of 85,000 contracts traded) keeping aside the OI, price action & existing longs/shorts being opened or closed !! Just concerned with no. of long/short contracts(vol) traded on daily basis!!! (If No, then any suggestions to estimate the same)
Thanks,
Keep up the good work
Cheers tc 🙂
The number of long position should match the number of shorts. It\’s best to get this information from NSE on an EOD basis.
Good, I dont see any of this open interest column in zerodha
It is available on Pi.
It\’s Nifty future.
Hi Karthik..
First of all thank you very much for the way you explained everything..
My queries are as below,pls reply.
1. I have back tested my execution strategy (entry and exit) in nifty fit. mostly are positional (from few hours to 5days). It gives 89% profitable percentage for 45 day while 79% for 120 days(consistent over other day period also). But risk to reward ratio show as 0.98
What is your opinion, is there anything I am missing here?
2. Is there any way in PI or anywhere where I can backrest more than 120days.
Thanks in advance.
Good luck for finding a great strategy.
1) Maybe you want to reduce the accuracy to increase the RRR. It always helps to have an RRR of over 1.5
2) I guess so. Please contact our support for this.
Thanks for your reply.. Also pls guide how can I plot in chart Nifty 50 volume(accumulated volume of 50 stock).
Is there any way to put stop-loss and execute buy sell of nifty option from Nifty 50 chart.
Pls reply.
Nifty 50, the index, is not traded on the exchange. You can trade the futures though. The volumes of Nifty 50 represents the collective volume of all the Nifty 50 stock.
Thanks for answering.. I know Nifty 50 is index and can not be traded. My question is-
I can chart Nifty 50 in kite and pi, but volume(traded volume of 50 stock of Nifty50) is missing. Can I get that Nifty50 volume at bottom of the chart like Nifty Future.
I know it seems silly… Pls reply.
Unfortunately volumes are not available for this 🙂
Hello Sir,
My question is
— Since all calls and puts are derivatives of the underlying asset, then why do experts say that there is high amount of call writing or put writing at particular strike and it won\’t allow the underlying asset to cross that.
Suppose a stock is trading at 205. And there is high amount of call writing at 210 and put writing at 200. So the stock won\’t find it easy to cross 210 or 200.
How can a derivative dictate the underlying asset?
Nobody controls anything in the market. When they say \’they will not allow\’, then it means that they don\’t know what they are talking about.
If there is a high amount of call writing, it only means just that. The writing could be done by 1 participant with a large appetite for risk or by many who believe that the stock may not go up.
Hi,
I have been study future trading.
I want to know suppose I buy one lot of any particular stock say TCS. And I don\’t sell till the expiry. What will be the consequences. Exchange will sell my one lot of TCS and credit my account with whatever was the price at the date of expiry or all shares will be credited to my Demat Account??
Yes, you can choose to hold the futures position to expiry. Exchanges will do the needful in settling the contract for you. However, if you are holding a profitable options position, you are better off selling it before expiry due to the reasons stated here – https://zerodha.com/z-connect/queries/stock-and-fo-queries/stt-options-nse-bse-mcx-sx
Thank you sir,
Suppose TCS price is Rs.2,500 in cash market and Rs.,2300 in Future, then can I sell in cash market and buy in Future market and take the delivery? I will be benefiting Rs.200 per share. Is it possible?
Yes, but the problem is that you cannot carry forward the short position in cash. Short positions in cash have to be covered on an intraday basis.
Thank you very much…..
Hi,
Today I started digging deep into OI and I found that OI in options chain seems to act perfectly as support and resistance. I checked for index and stocks. It exactly shows the exact reversal. From monday I am planning to use Nifty options OI to trade nifty futures. Any suggestions or comments about this startegy?
Thank you
Ah, thats an interesting perspective. I\’ve never really used this….so you will have to enlighten us with what you observe 🙂
OK. I will test this on Monday.
Good luck!
Hi,
Hedging option with future… Does this work?
Lets say i see a strong bull signal (Intra day trading). I bought 1 lot of bank nifty. But as soon as i bought market starts moving down, so i bought 2 lot of ATM Put. If market reach back to my original price, i will exit PUT, else, i will exit future.
Is this good?
Thank you
Do remember, any sort of hedging is an expense. It works well as long as your timing is good.
Hi,
Is it possible that once I short sell the contract and at lower level when I want to buy the contract, but there are no seller in the Market?
Highly unlikely…but yes, possible.
Hi Karthik !
Is the market maker or the exchange responsible for change in OI ?
Because at the end of every month the exchange only rolls out new contracts as mentioned in a previous chapter
No, OI is a direct function of the trader\’s participation in the market.
So every future contract comes into existence when someone short sells one contract and someone else buys that contract ?
True…a contract originates when a trade matches on the exchange.
Hi. Can I see the graph of OI for a Futures Contract in Pi / Kite. I could not find this, and if it is not available, I think it would be a really cool and useful feature. Since, the OI can be seen at any time, it should be relatively easy to just store the values and show a time graph.
Cheers.
I\’d agree. Will get pass the feedback to my tech colleagues.
Hi Karthik,
This is regarding arbitrage trade in futures market. I understand from today\’s session that screener (smallcase ) provides arbitrage opportunities on the basis of end of day. Request you to suggest right time to enter positions. Would entering after market order be fine or you suggest some other timeline.
Also is there a free paper trading platform for futures and options. I see that in moneybhai you can only paper trade in stocks.
If you are required to short cash, then you are better off trading cash and carry on an intraday basis.
Thank You Karthik. Request to confirm my understanding for below two scenarios. Also request to provide if there will be any other risks in addition to the below risks when we enter into Arbitrage trade.
Scenario 1 :
a. Short in Cash Market
b. Long in Futures Market
c. Close the trade on the same day assuming price difference in cash and future market will decrease.
Risk 1 : Price difference increases instead of decreasing by EOD.
Risk 2 : Future price decreases exhausting margins before closing both the positions.
Scenario 2:
a. Long in Cash Market
b. Short in Futures Market
c. Close the trade on the same day if price difference in cash and future market will decrease. If the price difference does not decrease hold it till expiry assuming the price difference decreases by expiry.
Risk 1 : Future price decreases exhausting margins before closing both the positions.
Please ignore risk in the above scenario 2, as i think that would not be a risk. However as already mentioned, please do highlight if there are any other risks for above scenarios.
Scenario 1 & 2 –
Apart from what you\’ve mentioned, you may also consider execution risk – you initiate the position thinking that the spread between the two are at a good level…but by the time you execute you may not get filled at same price, this is particularly true when you place market orders
Sir,How can we say if OI increases More trades on long side as for increase in OI there is equal no. of long and short?
tks
OI on its own does not convey much information, hence we need to associate OI data with price information.
i went through the comments already but it was not clear .. can you please explain with an example…. please sir…
i saw this on EOD data? how is that possible…
Guess, someone had asked the same query earlier, there was a discussion around this. Request you to look through all the comments. Thanks.
on what circumstances volume will be lesser than the \”change in open interest\” ?
\”For example, if the open interest of a call option is 1000 contracts on day 1. The next day, bulls buy 11,000 contracts and bears sell 10,000. The open interest will be (1,000 + {11,000-10,000}) = 2,000 contracts.\”… i found this in quora .. i think this eg is a wrong one… i think oi suppossed to be 11000 on the 2nd day
Yup, should be 11K.
Dear Karthik.
What I am asking in NSE Site there are two pages oi showing
One is in > Home > Live Market >Live Watch >Get Quote and
Other is in >Home > Live Market >Live Analysis > OI Spurts
Both are different % of io change . In equity derivatives page % of oi change is 17 %
at same time in OI Spurts page % of oi 43% . I am still confusing ????
I understand, but as i mentioned earlier, it may not be a good idea to depend on any sort of live OI data. Please check this – https://tradingqna.com/t/is-the-live-open-interest-oi-data-being-provided-by-exchanges-correct/7208
Hi Karthik ,
In nse site Equity open interest change Home > Live Market >Live Watch >Get Quote
Traded Volume (contracts)9,337
Traded Value * (lacs) 65,411.29
VWAP 87.57
Underlying value 87.85
Market Lot 8000
Open Interest 3,18,24,000
Change in Open Interest 46,80,000
% Change in Open Interest 17.24
And in OI Spurts page % Chg in OI is different
Whats the different open interest spurt change and equity derivatives oi change.
Plz clarify .
Ah, you will have to check with NSE for this.
Hi karthik.
I want to share today\’s experience. I usually trade banknifty options. Today I wanted to take position for short strangle strategy. Banknifty was trading around 23500. I sold 5 lots of call option strike price 23600 and I wanted to sell 5 lots of strike price 23500 but whenever I placed the order, it was rejected and message shown \”RMS RULE -options strike price based on LTP………………….. across product \”
I contact customer care they told something about open interest , I could not understand however I know what open interest is, but I don\’t know how due to this order can be cancelled.
This is my first time experience, I contacted my one friend who is client of another broker and he was able to place the order , how is this possible?
Order rejection was at broker level?
Please explain
Thanks
Rohit, exchanges impose open interest restrictions at trading member level. A trading member cannot have more than 15% of the total OI. Zerodha is probably the only broker hitting this 15% OI limit on weekly bank nifty positions. This is probably because, clients recklessly buy OTM options, hoping there would be a sudden movement on expiry day….you can think of this as a lottery instinct…and hence we are hitting the OI limit consistently on weekly bank nifty contracts. One of the ways to prevent this is by restricting clients to trade OTM strikes. What you experienced was the same.
1. Suppose i have to go long/short & i want to enter a contract, what will happen when i will enter a contract ,will the new contract generated or i will get the transfered contract(position of another person who has sqaredoff his position)?
Hi Karthik
How can we interprete any trend reversal based on current, mid, far months contract prices?
Its hard to identify trend reversals, but maybe you can identify few arbitrage opportunities.
exchange create unlimited number of future contracts on buy/sell demand and match the order with best bid/offer right?And any other generally unknown thing abt this process? pls in detail…
Exchanges do not create unlimited future contracts. There is a certain formula based on which contracts are created. All the details worth knowing are discussed in this module.
Dear kartik,
How to interpret the OI data? I mean Where can I get the data of OI ? I have recently opened Zerodha a/c . Can we add seperate window for OI.
As I am a positional trader this is entirely a new topic for me . I want to start trading in futures and options. I want to know how to begin analysing OI and volumes. How Oi affects futures and options?
Firstly, welcome to Zerodha family, we are happy to have you on board 🙂
OI data is available on a EOD basis on PI and even NSE website. I have explained OI in good detail in this chapter, I\’d suggest you give it a read.
what does negative volume percentage means ?
It means the volume is lower than the previous reference point.
Can the change in OI be greater than the volume of traded options on that day?
Yes, it can.
But how?
Please explain Sir
Volume is the number of contracts traded for the day. OI is a carry forward number and keeps changing till the expiry.
Yes Sir, that\’s true.
But I\’m not speaking of OI
I was referring to the \”change in OI\” for a day.
Can that be greater than the traded volume at any point of the day.
And I\’m assuming the change in OI is only for the day and not carried forward.Am I correct, Sir?
Yes, change in OI is only for the day. Imagine a situation where there were 2 trades for a day, but the order size was large enough, creating a huge change in OI.
If the order size is large enough that would be reflected in the volume as well, isn\’t it?
If the order gets executed, then it will.
Sorry Sir, but it\’s still unclear how the change in open interest be greater than the volume as Volume comes first and then the change in Open Interest.
Sir an elaborated explanation would do a lot better. I have seen the change in Nifty futures OI be greater than the Volume a few days back but couldn\’t digest as how.
You may have a point here, Akash. Apologies for misleading you. NSE\’s intraday OI data is not too accurate, do read this – https://tradingqna.com/t/is-the-live-open-interest-oi-data-being-provided-by-exchanges-correct/7208 .
You need to think about these two as independent variables. Volume represents the total number of shares/contracts traded for the day. Today\’s volume will not impact tomorrow\’s volume. They are unrelated. However, OI comes to life moment a contract is introduced and continues to exist till the contract expires. Its a cumulative number, meaning today;s OI is carried forward to tomorrow.
Given this, OI can be lesser than or equal to volume.
Hello sir,
1) when call IO decrease but call volume increase or vice versa..what its interpretation???
2) there is any way to figure it out whether call option writing or call option buying if call OI increased???? i read article in which its mentioned that option writing on some specific strike price…how they analysised ????
Thanks in advance
The table in the OI chapter suggests the possible interpretation for change in price, volume, and OI.
When OI increasese, both buying and selling increases.
Hi Karthik,
I just want to ask as OI data is for future & options contracts, is it relevant to study it for taking trading decision in cash segment. As I know prices of any stock in spot/cash market fluctuates based on demand & supply of shares and not its derivative contracts. I also know that derivative price are dependent on spot/cash mkt prices of underlying security and not viveversa. So Why we should look for OI data before trading in cash segment.
No, it does not make sense to look at OI info for making investing decisions. OI data is short term in nature, and bears no influence on long term performance of a stock.
hi KARTHIK can you tell me what cause difference between gold and gold mini. some time 100 rs sometime 300 ?
Simple \’demand – supply\’ disruption can lead to this.
Am a newbie in market.Was midway in the futures module( hadn\’t reached the OI segment). Was actively following a particular stock JSWSTEEL. Was doing Paper trading and also occasional token trading to test my strategy.Since I have started trading, this particular stock was trading in the range of 1500-1700. but on 3 and 4 Jan 2017 something bizarre happened( atleast for a newbie like me) Please see the description below:-
3Jan closing price:-1644.55
4 Jan open price:- 166.75.
Thinking that it was some mistake on part of nseindia website, I refreshed the webpage to find the same figures. I scanned all the possibilities to find what happened to the stock in top 50 losers, top volume gainers, 52 week low, low price band hitters, but couldn\’t find this stock in any of the headings.Then upon clicking OI spurt tab, Voilaaa….. it was on top of the list.After that I went through the OI segment of but couldn\’t understand what happened with this particular stock.
underlying stock:
52 wek high- 188.60(18 Sept 2016)( I booked a profit at 1640 the very previous day, how could this be the 188.60 be 52 week high ?)
52 week low :- 95(12 Feb 2016)
Upper price band:- 180.85
Lower price band :-148.05
Stock futures data(Expiry 25 Jan):-
Previous Close( 3rd Jan 2017):-1649.65
Open (4th Jan) :-164.20 (that was a whopping slide of 1486 points….down by 90%)
Change in open Interest:-Whopping 883.50% Jump (4,61,10,900).
Please explain what all went through the night b/w 3rd and 4th Jan that led to sudden fall of this stock.
What would have happened to the traders who were holding this stock or the futures ? Are they on the street with a begging bowl ?Please present a detailed analysis of this real life phenomenon especially in light of OI.
Regards and Thanks.
PS:- previous to 4 Jan , the average volumes trading was in thousands (50-70K) and also the bid-ask spread was also large (50paise to about 100paise)but today the volumes trading were in lakhs and .bid ask spread was 5-15 paise.
Srikanth – its quite natural to feel aghast when you see such drastic price movements, especially if you are new to stock markets. JSW Steel underwent a stock split. When the stock splits, the price is slashed down but the number of shares increase. I\’d suggest you read about this here – http://zerodha.com/varsity/chapter/five-corporate-actions-and-its-impact-on-stock-prices/
hi KARTHIK when commodity expire in near and open interest in decreasing in goldm ? wht will be in gold to goldmini?
Same. As a derivative contract approaches expiry, its natural to expect a decline in OI.
but when both contract expiry is near normally diference of gold and gold mini difference will be spread ya sink what cause?
There should not be any difference as its the same underlying. If there is a difference, then the same will not last long as arbitragers would set up trades to exploit it.
hi KARTHIK can you tell me when demand is increase in gold which gold script is increase like gold goldmini gold petal
Increase in price should reflect across all contracts, else you have an arbitrage opportunity.
no sir when demand increased on gold then its not applicable on every gold contract its create price gap in goldmini with gold
I\’m not sure Amit, can you point to a recent example?
hi KARTHIK RANGAPPA
can you tell me trading arbitrage i gold to gold mini in mcx
Check section 12.4 – http://zerodha.com/varsity/chapter/crude-oil-part-3-the-crude-oil-contract/ this should give you an idea of how this can be done.
i have an open order, now lets say i place a limit order to square off the open position. the order has been placed(not executed). now due to some problem like network connection or current failure i am disconnected form kite or pi. So will that order still get executed when the price is triggered??
Once the order is placed, it will lay dormant with the exchange till the price matches. You will have to modify the order if you wish to cancel it.
from where can i calculate the exposure margin for the MIS product type? For NRML product type Zerodha margin calculator gives the value but what about MIS?
Check this – http://bo.zerodha.com/XDK_Files/Downloads/SpanMargin/SpanMargin.pdf
First of all a great module, i read it completely. 3 questions
1. How increase in price and increase in OI tells you there are more longs. For each long there is someone shorting it as well. To me change in OI is just an addition / removal of contracts which has both sides. My whole confusion is how can i be sure whether longs are more than shorts when they are equal in number.
2. Is there any indicator or information that tells me a future had more buyers than sellers or vice versa who could not complete the transaction.
3. I am eagerly looking for trading strategy module. When is it coming up? Any other reliable study material for trading strategies.
Thanks Vikas.
1) As I\’ve stated earlier, OI analysis is empirical. On its own merit it conveys nothing. One has to associate the price movement and derive some meaning.
2) No
3) Hopefully, soon :). I\’m not sure of any reliable source for this.
F&O margin calculator show total margin = 62134(nifty fut) where as equity futures give the value as 49026???(i could not attach the screen shot)
Also how to know the exposure margin for intra day nifty fut, as the margin calculator give the span and exposure of the normal trade.
Its 49K in both the places. Can you please recheck?
from where can i calculate the exposure margin for the MIS product type? For NRML product type Zerodha margin calculator gives the value but what about MIS?
Check this – http://bo.zerodha.com/XDK_Files/Downloads/SpanMargin/SpanMargin.pdf
How to get past few days data for Open interest and Change in open interest for an underlying? Also, would that be different from the relevant data for different contracts for same underlying?
You can get the daily EOD OI data from the Bhav copy report from NSE. Yes, technically it should be different for each contract of the same underlying.
Thank You so much. Help me a bit more with this. I have observed that open interest falls tremendously during the last week of expiry since the positions are getting closed . So, how can it indicate anything meaningful as we know when OI falls its either short covering or long unwinding depending upon price movements.
Correct me if I am wrong. Change in OI is used to establish possible top/bottom or trend confirmation. Change in OI for the underlying rather than contract wise data should be used for such analysis. What do you think?
While I can find the underlying wise data for last two days here https://www.nseindia.com/products/content/equities/equities/oi_spurts.htm but I can\’t find the data for more than last two days 🙁
Kumar, OI on a stand alone basis does not convey much. It has to associated with the underlying price movement to make some sense of it. Yes, last week to expiry the OI data tends to get skewed….you got to match this with the next month OI build up to understand how things are shaping.
Have a look at this – https://www.nseindia.com/products/content/derivatives/equities/fo_underlying_home.htm
Karthik, if a chart looks bullish with OI and price increase and the deliverable to traded quantity around 60%, can one with all the data above trade on the long side with absolute conviction? is there an other dimension you would advice? i am trying to be comprehensive and follow a trading strategy through the above.do advice. thanks.
I\’d give the chart more weight age and build my position based on it. OI and deliverable qty is good to know, but I\’d not depend on it entirely.
ok, but referring to your answer to Madhu above one would know it\’s a bull trap only because the traded quantity in the above case of arvind ltd was 10%. the chart would have looked positive by itself. so knowing the data points of OI, price and deliverable% would help. isn\’t it?
Well, if you ask a \’OI purist\’, he would consider only the futures price and OI data. The % deliverable is good to know but I would not rely too much on it.
Hello Sir, Thanks for your neat explanation. I have few queries. I am pretty new to Futures. I would like to understand; what should I do to close the futures trade? Am I obliged to buy the lot at agreed price by Thursday of the month? As you said futures happen through cash settlement should we really buy the shares or settle only the cash difference which i hope is already done through M2M? Will our margins be erased if we do not buy those shares? Can you explain please..
You will find all the answers for your queries in the module, its explained in detail. I\’d request you to read from the start of the module 🙂
Karthik. Arvind ltd is at a life time high of 418. when one looks at the data for today th OI has shrunk by 23% and the price has increased by 2.5%.this means there is short covering. the deliverable to traded quantity is 10%. which means FII\’s haven\’t brought huge quantities for the price to shoot up and hence speculators r unwinding. my question is, do you think speculators would have shorted merely because the price is at an all time high? if so, should there have been a build up of shorts earlier?
From the data points you give me, I get a sense this is bull trap…and yes, many traders short hoping for a quick reversal in prices when stocks hit all time/52 week high.
I have acount in Zerodah. My take one option in nifty 8800 call but it currently trading 8630 can i change my contract next month november 16
You can rollover by squaring off the current contract and taking a similar position in the next month\’s contract.
Hi in nse market pulse September 2016 in page 7 there is participant wise oi for future index long and future index short. The data is mentioned in percentage. How to find numerical data for each index (nifty, bank nifty etc.)and on daily basis. The document is monthly publish.
Check the scrip wise, end of day data on Pi.
Hi I checked for the data and found it has long unwinding short covering etc. I would like to know only the long or short open interest for each script at the Eod. Can you please let me know how to find the data.
Where to find the requested data in nse website.
You cannot differentiate between long and short OI. You will need to associate price with it and make an inference.
Thanks for reply. But in market pulse report nse has differentiated between long and short oi. Can you please look into pulse report .
Will do, thanks.
http://www.moneycontrol.com/india/fnoquote/axisbank/UTI10/2016-10-27/FUTSTK/XX/0.00/true
there are no filters available, when u click on a particular script you get the data as it is under the heads such as\”increase in oi & increase in price \” etc. do go through the link i have attached and let us know how you read them. thanks karthik.
Ah, this is the same thing explained in the chapter 🙂
going through OI analysis on money control i found only PUTS listed under \”increase in OI & increase in price\” when , this is where the sentiment is long.shouldn\’t there be CALLS too? similarly only CALLS listed under\”increase in OI & decrease in price\” when, the sentiment here is bearish. shouldn\’t there be PUTS too? i know when you buy CALL or PUT it\’s long and when you sell CALL or PUT it\’s short. am i missing something?
Can you please recheck the filter settings on MC once?
Hi Karthik,
I didnot get this. So between these 5 traders OI finally became 10. But in the over all market wouldnot the number of contracts remain same.
Every trade will create buy or sell.So where will the contract vanish.
The existence of the contracts depends on how many people hold then (either long or short). So in the case explained, there were totally 10 that were created…if you go in to buy a new contract (and it should match with a seller wanting to sell the same to you) then a new contract opens up.
What is the Minimum OI change will affect stock movement..I mean in percentage or OI.
Not really sure if there is any reliable number here.
what percentage of delivery based buying is considered high and what is low?also, when OI decreases with an increase in price it is said that this could be when the institutions are taking delivery of the stock and hence price go up which leads to speculators unwinding. how can one look at the charts and look up OI data to come up with a trade? where do the short and long build up of data that we hear published?
Usually, the norm is anything above 60% is considered high. The easiest way is to look at the OI information side by side with price and volume information. In fact in a typical chart set up, you stack it one below the other. The OI information is available at the end of day basis, I\’d suggest you read this as well – http://tradingqna.com/46352/the-live-open-interest-data-being-provided-exchanges-correct?show=46352#q46352
That was informative.thanks karthik.but, can u tell us where the EOD data of long and short build up is published?
It should be available contract wise on NSE, check for the bhav copy.
Hi Nithin, What do we need to infer when delivery volume or delivery % is decreased compared to yesterday along with increase in price and decrease in futures OI. Thanks.
You could think that the weak hands are booking profits 🙂
Hello Sir,
Can i BUY and SELL at same price of future stock.is it possible,mean i want to BUY and SELL at one price@315
You can, but not at the same moment.
Is the OI mentioned in nse india website is number of lots or number of shares? (i.e 1 lot = x no of shares.)
Number of shares, that\’s why the OI numbers always look scary 🙂
Ok. How to identify the direction (long/short) the big players are betting?
You need to associate the price movements along with the OI/Volumes information and then interpret the results.
Is it possible to identify the long and short OI. Since most of the website gives only OI. It doesn\’t say whether traders are bullish or bearish
1 long + 1 short trade = 1 OI. So the OI tells you how many longs and how many shorts :). To infer bullish/bearish bias you need to associate the OI number with prices.
Actually i am trying to infer the roll overs from near to mid or far month contracts. Is it possible to get the individual roll overs (long and short) from contract month to another.
Maybe, but I\’m not sure of a reliable source which can provide you this information.
Thanks Karthik. your knowledge sharing is beyond thanks.
Is it possible to identify the no of long and short OI in a future derivative (for example if there is 100000 OI is it possible to identify how many is long and how many is short?)
Praveen – 1 long + 1 short = 1 OI. Likewise 100000 OI means, 1000000 long and short.
Hi Team Zerodha,
i got lill bit confused with the Details Shared with you here on Varsity. Plz Clear my Doubts Definitely there is some Issue with Typing related error but i m not able to figure out which one is Correct..
plz have a look on these Screen shots …
1. There is Difference in Module 4 Chapter 12 OPEN INTEREST…
PDF downloaded version has one additional data for Price Vs Volume . Screen Shot(http://prntscr.com/cbqeo5)
2. And there is also conflict with the theory between Module 2 Volume Analysis Interpretation and with Module 4 Chapter 12
Plz have a look on Screen shot.(http://prntscr.com/cbqfby)
as in PDF module you will find the different Interpretation for the Volumes mentioned in the Screen shot.
Plz sir Clear the issue, and tell me which one is correct…
Thanks..
Aurn….thanks for pointing this out, I guess this is a typo error in the PDF. Consider the online version as the accurate one.
Sure sir…. and thanks alot for your reply
Welcome!
Really appreciate your effort and Thank you so much.:)
I know learning myself about trading would make me successful trader instead of blindly following expert advises. I am not expert in this domain for now so for the time being Could you suggest some websites which could be followed for stocks recommendation(and know about stocks to buy/sell,target value,stoploss,time duration to hold position) ???????
I do not recommend any 🙂
You got to be your own analyst…only then you can trade the market.
Hi,
In the NSE OI Spurts data page, OI of a particular stock falls rapidly at 3:30 PM. Why is that so? For example on Aug 23rd, OI % Change for JUBLFOOD is at 36.09% at 3:29 PM and at 3:30PM it is at 5.99%. For HDFC at 3:29PM is 17.13% and at 3:30 it is 0.49%. Can this happen?If yes, what can be explained. Or the data is wrong in NSE. I am a bit confused.
Sudeep, check this – http://tradingqna.com/46352/the-live-open-interest-data-being-provided-exchanges-correct
Hi.if a security is in ban what will be the effect on price in it.eg ceat.its in ban and the price is only falling.wen can it go up.
There is no direct relation to the security getting banned and prices.
Thank u Ji,
But still i am in confusion . OI Spurt refers change in OI o.k. My question is which ones OI change ?? In that row in NSE site there is a colum of Options (Premium). I am asking in that particular options OI change ??
OI refers to the position wise change and not really premiums. So for each Futures/option contract there will be an OI change on a daily basis.
Why dont you come up with a module on intraday day trading strategies.
Sometime soon maybe 🙂
Thank u KARTHIK Ji,
Plz clarify it . In nse site OI spurts means change of OI. Which OI change ???
Option OI or Future OI or any specific call or put OI Or all together ???
You can select to check the change in OI for each instrument.
Dear Sir,
Please clarify below doubt. How can change in open interest be negative before expiry in case of call and put options in Indian stock market? As per my understanding, all the options traded are European in nature, thus all the square-off is done only at the expiry. Negative change in open interest essentially means that some contracts were squared off thus reducing the number of open contracts in the market. Since we are trading in European options, how can change in open interest be negative before expiry? I have seen this behaviour for both ITM and OTM callput options. Please correct my understanding.
Thanks
Punit
Change in OI alone is not negative, it has to be associated with the price change as well.
Thanks for he revert sir. But my original query is still unanswered. How can change in OI be negative in between the month? Doesn\’t that mean square-off of options which is not possible in case of European options?
Thanks in advance.
Change in OI can certainly be -ve when there are more contracts closed than being created.
Thanks for the reply. So contracts closed means squared-off right? So is it possible that contracts can be squared-off before expiry date in case of European options? As per my understanding, European options can be squared-off only on the expiry date.
Thanks in advance.
Closed can mean squared off or let to expire. Yes, it is possible to square off anytime before expiry. However, the settlement will happen only upon expiry.
So negative change in OI in case of European options is possible?
Yup.
If we buy a script in ban period and sell it on the same day, will it cause penalty, As I am not creating new position?
If I carry the position it is entitled for Penalty, what about Intraday?
Please clarify
You cannot buy a script which is under the ban period!
I have already traded in Wockpharma on Friday when it was in Ban period… so bit worried about Penalty..its minimum 5000… broker also dont know exact penalty amount …
Suggest you look at this – http://tradingqna.com/527/rollover-position-month-contract-period-should-situation
Thanks for the link Karthik,
However nothing is mentioned in that link about Penalty.
I want to know if there is any penalty if I do intraday trading in Banned Scripts. I have googled and checked many other links also but not much info about penalty
No penalty as the exchange will not allow you to initiate fresh position. You can only unwind the existing position but cant initiate new one!
Exchange allowed me to initiate new position… and I have already traded in Wockpharma when it was in Ban period… so bit worried about Penalty..its minimum 5000… broker also dont know exact penalty amount …Broker(angel broking) is telling penalty will be from 5000-8000… not sure exact amount
Yup, the penalty is around 5-8K per lot…not sure about the exact formula which is used to calculate this.
Hai ji,
What it mean in NSE site OI Spurts ??
It just refers to changes in OI.
Hi!
Please let me know if Zerodha does not allow buying/selling call or put of a company whose results are due next day. I tried buying calls of adani power and tata power at about 3:17p.m today but it disallowed with the following message “rms:blocked for optstk mkt nse_fo broker- zerodha remarks: option stock market orders are not allowed block type: all”
You must have tried placing a market order. We do not allow market orders for stock options, check this – http://zerodha.com/z-connect/tradezerodha/zerodha-trader-software-version/orders-place-modify-cancel-view
I\’ve extracted the details for you here –
Because of illiquidity of stock option contracts, market orders have been disabled on stock options. Only limit orders are allowed. Place a limit buying order higher than the current price or selling order below the current price, this will act as good as market order but will also protect from any impact cost due to illiquidity
Thanks a lot Karthik! Much appreciated and also was able to place orders today. You guys are doing a great job!!
Good to know that, thank you very much 🙂
Hi
Greetings to all.
Would like to know how to get LIVE Change in Open Interest for options in Zerodha PI platform? Or other than NSE site where can i get this?
Thanks and Regards
I\’d suggest you email my colleague Srini for queries related to Pi – [email protected]
Amazing content. Been reading. I\’m a new trader with two losses, but learning a lot. Thank you.
Just a small error which i found – But is typed as buy.
— this line — Clearly volumes and open interest are two different; ** buy** seemingly similar set of information.
Thanking you
Thanks Govind, will make the change!
Hi Karthik,
1) In the last table of Open Interest, you mentioned that if price and volume increase then it means trade is more on long side. But long & short sides are always equal so how can one side be more than other.
2) In case of futures, at the time of squaring off the position should we compare the price with spot price at that time or future price only.
1) As I\’ve mentioned this earlier, this is an empirical study
2) You should ideally be comparing this to the profitability of your position.
How to calculate Rollover percentage? It would be very helpful if you share formula with real time example.
Thanks in advance.
Not sure if there is a formula as such, at least I\’m not aware of this.
Very informative website and tutorials. Enjoy learning from you although I\’m not from the India continent. Thanks a lot for the efforts and keep up good works!
Glad to know that Kelvin!
Hi Karthik,
Nice article. Can you explain in detail about Positiion Unwinding wrt Derivatives?
I find it quite difficult to understand this particular topic.
A detailed explanation like this one would help me and others a lot
Again thanks for the nice article…
Anand – position unwinding is basically referred to when you close an exciting position. For example if market has a many long positions and participants start to close them, then its referred to as long unwinding. Like wise closing out short position is called short covering.
So a typical move from an OI perspective will be……As prices increase, OI increases then at some point (tops) prices become stagnant and may even start falling. At this inflection point, shouldnt OI show stagnation…..or maybe a little reduction…..Since the longs will be liquidating and fresh shorts may be getting added…..because along with fresh shorts, the long will also reduce…..then maybe after a few days, OI will again increase due to short buildup? I am just trying to determine how do we see the churning of OI…..Is there a way?
This would be tricky, as the entire OI theory is empirical.
When prices fall (assuming at tops) the OI should decrease — this would indicate unwinding of positions. If fresh shorts are added, then OI should indeed increase.
Hi Karthik,
This is with respect to chapter 12.2 OI and volume interpretation. As mentioned above, when OI and prices increase more trades on long side, when OI and Price decrease it is long unwinding etc.
I have this doubt since long :- If the price increases and correspondingly OI increases how can it be interpreted as increase in contracts on long side. As there will be equal sell contracts for the long contracts and so on for other situation. Correct me if I am wrong
Its just an empirical inference based on the fact that the price has increased along with increase in OI. Likewise with increase in OI and a decline with price.
Hi karthik,
Greetings for the day.
In today\’s derivative bhav copy there is net increase in stock futures open interest by 1.57 cr shares where as in participant data there is overall decrease in open interest of stock futures by 5499 contracts. Can you kindly explain how it\’s possible as I am unabletounderstand.
Thanks and regards
Kunal vakharia
Bhav copy of 22-6-2016.
I\’ve noticed similar conflicts in OI data, I\’d suggest you stick to the bhav copy data.
Very Nice n Very Helpfull, Previously we try too much to understand but result is poor, after this we r satisfy. Thank\’s Karthik…
Thanks Somesh 🙂
There is a module option trading strategy.. is there any for futures trading ?
Here you go – http://zerodha.com/varsity/module/futures-trading/
during the day there is NRML and MIS component in futures trading which together form part of OI of nifty futures as well as nifty futures volume. By the end of the day, the MIS part is squared off leading to increase in volumes but reduction of OI. So if you look at EOD, I guess that volume part which contains both MIS and NRML part will much higher than OI. I also assume that during the day the OI increases because of MIS effect and then reduces by EOD. Your comments will be helpful. Also, how to look at the above data ie. where to look for MIS and NRML futures data during the day. Thank you in advance
This is exactly why you need to look at EOD data 🙂 Real time OI information can be a bit misleading at times.
Thanks Karthik for the reinforcement. Please consider that I am a newbie and hence your answer\’s language should be simple. The next question is how do news channels etc. provide longs and shorts of index futures for FII. Both EOD as well as on Net basis ? Thanks again
Most of them provide based on EOD Technical Analysis basis….but some of them provide based on simple quantitative analysis as well.
Thanks but I have not understood
Please correct me if I am wrong — it is said that derivatives behavior leads the stock price movement. This is particularly important during settlement thursdays and otherwise. can you explain or provide a link or provide a book reference where the linkage between future prices and stock prices can be explained .. Thanks again
Try this – http://zerodha.com/varsity/chapter/futures-pricing/ 🙂
Dear Karthik, What is the significance of OI and OI change on the last thursday ie. the day of settlement. I am assuming that on the last day the change in OI should make the OI close to zero !! In other words,, OI change value should be very close to OI value ! Regards
Yes it gets reset to zero on the day of expiry, but the zero OI is not displayed anywhere as it is implied.
Hi Karthik , Managed to discover the number of nifty contracts bought and sold by FII on NSE website. I also concluded that the number of contracts dealt by FII on nifty futures is a very tiny percentage of the overall change in OI for nifty futures on daily basis. Could not understand why the impact of FII is considered so important by channels when their percentage impact is small ?
FIIs play a huge role in spot market, you should consider that as well.
For a beginner like me, this is really a great document. It gave me a good understanding on Future Trading (In fact all previous modules I red so far are good). I convey my sincere thanks to the author(s). Also I appreciate entire Zerodha team for providing a good trading platform.
I have one doubt on Futures (This question applicable to Intraday trades in SPOT market as well). Since the future market is cash settled, does that mean there is no restriction in number of open interest at any point of time? To be more clear, Say there are only 1 lakh shares of a company available for (or held by) public. However, it looks like there could be more than 1 lakh open interest in Futures market as no one is expected to take delivery and all are squared off on expiry date. Is there no restriction in number of open interest?(Though sum of Long and short is zero). Which mean Bulls (or Bears) can manipulate the quantity to pull the price to their direction without any restriction? Apologies if my question is not making sense, May be I misunderstood something.
Hi Ramesh – I\’m glad you liked Varsity 🙂
There are restrictions at both client level and the broker level on upto how much positions can be built up..so naturally this would limit the number OI. Once this limit hits, the security gets into a Ban period where no new positions can be initiated…however you can close your exisiting position. I\’m unable to find the link on NSE website which has this information, maybe I\’ll share the link as soon as I get it…else you could also search for the same here – https://www1.nseindia.com/products/content/derivatives/equities/sec_ban.htm
Thanks Karthik. This information is sufficient.
Yes, I think so!
Hello Sir,
When can we expect currency and risk management & trading psychology modules to be available?
Regards.
Cant really commit a timeline Shafeeq, but we will certainly put up the content as soon as we can. Thanks for your patience.
Hi Karthik, can you please provide me a source or website where I can check put call ratio chart or data?
Not sure of any reliable source Ali.
Team Zerodha.. you are doing fantastic work. today i am able to make some good profit in option trading.
thanks . special thanks to Karthik sir.
Excellent! Keep learning and earning 🙂
Hi Karthik, I want to check live or EOD put call ratio? Can you please confirm, if put call ratio analysis helps in analyzing the market trend
It gives a general sense, will be writing about this in more detail in Module 6.
Hello Karthik,
In options data what would this mean: Number of contracts – 0 / Open Interest -25
Thanks,
Yugesh
Ah, not sure, this appears a bit confusing – can you please share the context?
Hi Karthick sir,
Thank you for the above thorough content. was able to make some good profit today as a beginner in nifty.
thanks again.
Super happy for you, good luck and all the very best 🙂
Hi Karthik, The initiative of zerodha is just amazing and the knowledge you are spreading is a wonderful gesture. I would like to know more about currency contracts, fx spots and forwards, swaps, corporate actions etc. Is there any chance that you would go for the subjects in future??
We will soon we writing a module on Currency, Commodities, and Interest Rate futures. Request you to stay tuned 🙂
Hi Karthik,
How Put Call Ratio is related to Nifty and how Nifty reacts with the increasing or decreasing of Put Call Ratio in the market hours and at the EOD chart, do we have any reading material on this in Varsity. And how it could help in interpreting the nifty trend whether it is bullish or bearish. Please advise. Thanks in advance.
We do not have any material on Put Call ratio on Varsity yet, but will soon put up a chapter on this. Request you to kindly wait for a little longer. Thanks.
Hi Karthik,
The below highlighted with red box content repeat and table also misplace repeated. Please change the correct content.
Thanks in advance.
Thanks for highlighting this, will look into it.
Hi Karthik,
I really appreciate your and entire Zerodha team efforts …….. these VARSITY module is really helping us to understand share market ………..
I have a question ……. I have checked Marico futures
for this ( Jan month expiry) open interest is in red with 3.53% ( which means open interest is getting decreased )
For Next month ( feb month expiry attached in sreenshot ) open interest is shown in green with 400% (( which means open interest is getting increased ) …… please correct me I am wrong.
Now If how I should check if open interest is on positive side ( stock price is expected to increase ) or on negative side ( stock market is expected to decrease ) , how to understand if I should go long or go short as I can see just increase or decrease in open interest ?
I have sold nifty call option 11000 june 2016 at the rate of 2 rs (150 qty or 2 lots)in MIS and it also executed. There is no seller in this call option, so it is still reflecting in my position and margin amt is also blocked.
if MIS is selected position has be settled at the end of the day but it is still open.
How to close the contract position? Kindly help
Well, if there are no buyers then the position will be forced to carry forward and your margins will be blocked till the position is squared off. Also, please do remember – its always dangerous to place intraday orders in contracts which do not have liquidity. This is also called \’liquidity risk\’.
Karthik,
Please guide me on day-trading.
1.How do I select stocks for it?
2. What should be the look back period for finding S&R levels?
3. Should I stick to top gainers & losers?
4. Do midcap-50 stocks prove out to be better than nifty-50 stocks as they show more percentage movement?
5. What time frame would be better for me? I never scalp.
I don\’t know what\’s wrong with my strategy, I trade equity using 5 min – 10 min charts with 21-7 period crossover system. I don\’t use technical indicators, I only study price action, volume and candlestick patterns. I never trade before 10AM, if I do however I feel like gambling and pushing myself out of my comfort zone. Should I start using indicators like RSI, MACD and Directional Movement System?
1) I would suggest you concentrate only on Nifty 50 stocks for day trading. Has sufficient liquidity
2) 6 months and 3 months at least
3) Not necessary – as I said stick to Nifty 50
4) Maybe, you can even choose to trade the biggest 5 stocks from Midcap 50. But you will have enough and more opportunities in Nifty 50 itself
5) My suggestion – try and hold the trades for longer period. Even if it means doing overnight trades.
are only delivery based futures trade possible in any segment ?
what if i wish to capture calender spread buy 1 lot of nifty at 8000 in current month and sell it the next month at 8080?
now i am invested in 1 lot & have locked profit of 80 points per lot which i will earn when i deliver the same lot next month (as per my short contract)
is doing this alone possible (without being bothered about intraday movements or squaring-off positions) ?
Yes, you can carry forward futures positions overnight.
When you create a spread like this, the full realization of profits happen upon expiry. This means to say that the position will have to be open throughout the series and therefore you will have to buffer for M2M P&L.
kindly explain more:-
1) this can be done in futures itself without bothering about any kind delivery on demat side ?
2) lets say i wish to do this in CRUDEMINI FUTURES . ( JAN-FEB)
CRUDEMINI JAN is 2383 & CRUDEMINI FEB is 2455 .
i wish to capture the spread of 72 points by buy jan & selling feb . (as per calculator i only block 1091 as margin ) , how to execute this i am aware .
on 19th jan only crude miniJAN will expire ,not the FEB ….. so how should i close or it will be done automatically to gain my 72 point profit and release the initial margin ?
3) what is perfect time-frame / time-gap before expiry to execute this strategy ?
thanks
1) Yes, if you are long and short on futures then DEMAT does not come into play
2) By virtue of cost of carry, the mid month contract will always be priced higher than the current month. This should not be confused for a \’spread\’. However if the spread is more than what should be, then yes you do have an opportunity. For example in case of Crude, if 72 points is what is more than its supposed to be be then you initiate the trade and capture the convergence…which can happen at or before Jan expiry. This also means you will not get full 72 points but a large chunk of it
3) There is nothing like a perfect time frame for this.
continuing point 2.
1) the mid month is going going cheaper than current month in many currency – equity futures …. so in this case can i simply short the expensive one even though is near one and long the cheap one (even though it is far) ?
2) my idea is to simply lock this \”COST OF CARRY\” as my profit and keep doing it again & again at the end of every month …. isn\’t this a good strategy ?
3) once again i am aware how to enter an arbitrage , but how to exit it with profit ? you said i will get a chunk of this 72 points not the whole 72 points .
theoretically i am buying something at 2383 and selling it at 2455 ( with a contract ) so i expect to get full 72 points .
practically this will not happen , kindly explain why ?
4) what factors determine the size of spread i will earn & how ?
5) i am aware about entering an arbitrage and do not know how to exit it ?
with respect to this case itself , i simply short feb and buy jan ( this is my entry with a margin of 1099) , now when jan contract expires what will happen ? PI will square-off the whole position or i have to do (FULL SQUARE-OFF) myself ?
if PI just squares-off JAN contract and keeps FEB open then what happens ?
6) what are the risks involved in this type of strategy ?
1) Yes, you can
2) Yes, it certainly is
3) If 72 is the number of points you are expected to get, then this full payoff of 72 is expected on the expiry day. So in the event you square off the position before this, then you will not get full pay off, you will only get a part of it.
4) Liquidity and execution risk are the prime concerns
5) Exit is simple – just reverse the positions and you are through :). Once you have reversed you will not have any open positions, so no question of Pi squaring it off on your behalf.
6) Liquidity and execution risk
i will hold this position till expiry ( by is it called arbitrage or hedge ? ) & will not square-off on my own .
generally it would need me 4000 margin to trade 2 lots . but as i have this hedge position i only allocate 1000 margin .
1) now on expiry PI closes the position my query is will it close just the near month or the whole position ?
2) if it closes simply current month & i don\’t have any extra margin on my account , what will it do for extra required margin ?
3) kindly explain \” execution risk \” ?
4) suppose the short month appreciates in price and long month depreciates ( well i take loss in this case , but once again when i entered this position both my buying & selling price are set …… so i should not have any concern about what happens to the script after the orders are filled ) …. kindly comment on this point of view ?
The holding period does not guide the strategy name. For instance you can hold the arbitrage trade till expiry!
1) Just the near month contract will be closed and you will have to manually close the mid month contract.
2) If you dont have the stipulated margins, the the position will be closed
3) If you want to buy something at say 100, but end up buying the same at 101, then the 1% increase in cost of execution is called execution risk. This is important to keep execution risk to minimum in arbitrage strategies since the profits are limited
4) Yes, the spread expanding in the other way is also a risk (besides execution and liquidity)
Hi Karthik, as I could understand from above article, derivatives are zero sum game. So on start of a new future contract after expiry, how can a first buyer of contract initiate long if no sellers are on other side and viceversa. Pl explain.
Its like going to the vegetable market the first thing in the morning…as soon as markets are open ppl will come to buy/sell something or the other…and hence a transaction takes place.
i bit confused with oi, if a stock has 100 oi, then 4 traders enter to the market and create one short position each. so now oi is 104 right? , and after some time these traders exit from their current position so now oi is 100 right ? please correct me if i am wrong?
Yes, as long as the 4 new sellers match with 4 new buys, the OI will goto 104. Once they square off the OI will drop back to 100. OI always captures the net open position in the market.
Hi if in the option chain …. call OI data shows 55 lacs and same strike price put shows 75 lacs what is happening call writing or put writing and which way will the market move uptrend or downtrend
Difficult to call the market direction just by looking at this info!
Sir, What is Roll Over. Stocks has different % of roll overs. What does it means. Kindly explain. Thanks
If you are long on Nov Nifty futures…then closing the position on expiry and buying the Dec series is called rollover. The % depends on the current sentiment of the stock.
Iam a nifty futures full time scalper from Tamilnadu.
For Eg: If iam buying 75Lot of nifty futures @8000 and selling @8010, my profit will be 539rupees.The costs shown below for the reference
Brokerage-40
SEBI Charges-2.44
STT-Only on sell side-61
Turnover Charges-25.61
Service Tax-9.19
Stamp Duty-73.17(0.006%)
Total Cost-211.41
If iam declaring as the Non-speculative Business with proper balance sheet & the FY15-16 gross profit crosses above 2.5Lakhs
If so, can I rebate this paid 211.41 rupees/Lot.. Which mean if I done 75000Lots for the entire FY & the tax can be claimed max upto the level of 2.11Lakhs.
Kindly clarify.
Vasanth, little confused with ur question, can u look at this section, everything you need to know about taxation when trading.
In trading, all costs can be shown as expense so that you pay taxes only on net profits. So if I am guessing ur question right, the answer is yes.
Vasanth – its best if you post this comment here – http://zerodha.com/varsity/chapter/classifying-your-market-activity/
Nithin Kamath is our resident tax expert 🙂
Hi Karthik, will u please explain one thing
Eicher motor Fut 28 Jan showing open interest 0 and vol 25
What does this mean.?
Means no trades in this contract!
Sorry, but I think the above stats mean that whatever number of contracts were there, they are al now squared off. And the trades in which they squared off, counted towards 25 volume.
OI basically represents the open contracts. The ones that are not squared off.
In this situation what happend is, suppose 25 long contracts were squared off then 25 short contracts were added. Making the total 25-25=0. Hence no change in open interest. But volumes went up by 25 contracts.
Yup, the way volume, and OI is calculated are different.
Hi Karthik
Pardon my numerous questions in every module. But I can\’t settle unless my mind has grasped everything you have taught. So…
1) Going through the modules and the queries from the readers I have found mention of Pivot every now and then. Could you please explain what is that.
2) \”Do note, if there is an abnormally high OI backed by a rapid increase or decrease in prices then be cautious. This situation simply means that there is a lot of euphoria and leverage being built up in the market. In situations like this, even a small trigger could lead to a lot of panic in the market.\”
What does leveraging mean in Trading context?
Vivek – please do not hesitate asking questions…this is the only way to enrich this forum!
1) Pivot levels are techniques used to calculate the Support and resistance level by employing a mathematical formula. Plenty of site give you this formula.
2) Leverage in this context means very high numbers of futures and options positions. This can be a bit dangerous since all F&O trades are leveraged.
hey karthik, the price of a stock increases on a day, along with that if we go through the percentage of deliverable trades to the traded volume, we may find it hinges at 30 to 40 %. now, the OI and the price would have increased at the same time. which means it was a trading counter. is that fair? then at times the price is up and the deliverable quantity is 100% but he OI has decreased and the price is up. this indicates short covering. since there is 100 % delivery , most would look to buy as is the norm but, there is short covering too and that means the sentiment is weak at that counter. is that a paradox?
Not sure if we can mix the % deliverable figure with OI…while the former is wrt to spot market, the latter is wrt to Derivatives mkt.
Hi karthik, an increase in OI with an increase in price indicates bullishness. However, doesn’t it also mean that an increase in OI of a particular strike signals the option sellers view that the price might not reach that strike ( since the option seller is more aware.) isn’t this a paradox?
OI is formed only when a new position is created. This means number of contracts bought equals the number of contracts sold. Hence on a stand alone basis OI conveys very little info…therefor we associate price to derive some meaning.
With respect to options there is a slightly different perspective…like I mentioned earlier this will be discussed in next module in Options Pain chapter.
Hi Karthik,
Can you please tell specifically where Madhu\’s question has been addressed in options chapter?
Question was \”Hi karthik, an increase in OI with an increase in price indicates bullishness. However, doesn’t it also mean that an increase in OI of a particular strike signals the option sellers view that the price might not reach that strike ( since the option seller is more aware.) isn’t this a paradox?\”
Well, the interpretation of \’OI + Price\’ is based on empirical study. You can add in a layer here and check how the OI of ATM options behave as ATM strike reflects the current sentiment in the market.
Thanks for the response. You wrote \”Well, the interpretation of ‘OI + Price’ is based on empirical study. You can add in a layer here and check how the OI of ATM options behave as ATM strike reflects the current sentiment in the market.\”
Can you please let me know the results of the empirical study? If the OI gets added or subtracted from put chain , what does it mean?
Abashlal – Unfortunately I do not have any leads to this. However you can backtest this easily and arrive at a conclusion. Perhaps you could be kind enough to share the results with the rest of us 🙂
Data providers will give out the historical price, volume , and OI data.
hi Karthik, decrease in OI with a decrease in price is an indication of longs selling which is why the price falls. the interpretation commonly voiced is that, this is bullish. or, a bounce upwards is expected. the longs exit because the r booking profits as they feel the stock might not ride up any further. why bullish then? thanks.
Not sure Madhu. Generally, decrease in OI + decrease in price indicates long positions are being unwound.
Sir, iam a pivot high/low breakout trader in Futures only, till today I face big lose but top trader earn from same strategy in zerodha 60 day challenge only but I can\’t, so I have doubt about entry and exit by using pivot high/low, suppose in intraday 10 minutes time frame, previous pivot high is broken after 12 o\’clock then how can I use open interest and volume to confirm uptrend.
my doubt is in 10 min pivot breaked candle,
1. can we have to consider previous day open interest and volume breakout in 10 minutes break candle
2.else how can I use open interest and volume at 10 min breaked candle,
3.else how to use pivot H/L breakout efficiently
please explain with clear picture because I have faced huge loss due to lack of entry and exit criteria
Thanks in advance
Dilip – please do ensure that the volume bar for the pivot high/low candle is higher than the last 30 mins average. Honestly, this is the only thing I can think of at this point, hopefully this should help.
Pivot high/low candle means, is it 10min braked candles
Yes, you can even use 10 mins candles as well.
hi karthik
Regarding security ban, correct me if im wrong, sebi sets ban when open positions go above 95% and only allowed back when it reverts to 80.During ban period is it allowed to take fresh entry(buy/sell)
Regards,
pavan
Pavan – everything is correct expect that during the BAN period you cannot initiate a new position…you can only close out the existing position.
hi Karthik,
Can you please suggest me a good book or source to learn about intraday trading strategies and concepts.
thanks in advance.
No reliable book that I know of.
The trading quantity can also be disclosed while placing an order. So, if I buy 2500 lots of nifty but don\’t disclose any quantity at all (and similarly, the person who sells those 2500 lots also does not disclose any quantity), will either the volume or the OI change?
Nope, the disclosed quantity is only to mask the trade for that particular order….end of day the exchange will take all orders in consideration irrespective of it being disclosed or not.
Honestly I have never seen this kind of write up anywhere. Hats off to u guys!!
Karthik, Now i have covered the first four modules of varsity by finishing the futures module.
1. Am I good to go for trading in futures using TA checklist?.
2. Or Do I need to wait for other related modules such as Trading Psychology and Risk Management, Trading Strategies and System to be completed?
3. Do I need to complete Options module to select a good trade(to select either futures or options trade based on the conditions)?
Nope, you should be good to go. If you have read all the 4 modules then please do not hesitate…its time to validate all that you have learnt. Initiate small and well planned trades…dont rush to put in big trades. Remember every trade has a lesson bundled within…make sure you recognize that lesson and learn from it. The key is to make sure you sustain your capital…dont burn it up by initiating large and reckless trades. If you are new, avoid day trading…try taking positions for 2 -3 days. We have interviewed some of the most successful traders here – http://zerodha.com/z-connect/category/zerodha-60-day-challenge . I would suggest you read this for some great inspiration. Good luck!
Kathik,
As a intraday trader what are the charts or data that u watch closely before placing an order .Eg. I used to watch RSI , volumes and Total bid and ask quantity.
In no particular order – Support Resistance, Candlestick patterns, generic dow pattern, overall sentiment in the market, overall sentiment in that particular stock, fundamental news scan, volumes, and moving averages.
I am wondering how can u scan those many things for intraday:)
It requires a little bit of practice and technology to get into the groove 🙂
sir,
how to trace sell or buy open interest and volume in a future contract ,what is future price discount ,why does it happen?
The same is explained here – http://zerodha.com/varsity/chapter/futures-pricing/
Great Work and Fantastic write up. You have taken so much time in explaining all the possibilities that I have understood on FUTURES trading much better than anyone who has tried to explain the same to be.
Great Work Once Again
Thanks Arun, maybe after I\’m all done writing and explaining I could take a vacation to EU through Christe 🙂
sir,whats diff between IV of nifty,b.nif,stock optioons &india vix explain detail
IV of an individual instrument is just that – the instrument\’s IV or the implied volatility. Will talk about volatility in detail in the options theory module.
sir, when is option module is uploaded. thanks
The first chapter on options should be out today, request you to kindly stay tuned. Thanks.
Brilliant work Karthik…its really very helpful..when can we see your impressive work in options module…waiting for it…
Thank so much for the kind words. We have already started work on Options module, in fact the first chapter should be uploaded sometime today. Thanks.
Great explanation…really nice explanation
Thanks Rupesh.
such a very good website with the easy language to understand for non finance background ppl!!!! please add up more budget forcast and the process of variance how to preapare with live examples
Thanks Shubha! We will probably have something for macro economic activities soon.
pls explain the cost of carry in details
Cost of carry is simply the interest rate component in the futures pricing formula….expressed as Rf * (X/365).
how can this be possible? i mean, don\’t you think traded quantity (volume) must be at least change in open interest ?????
Pravin – From my observation the real time OI data on NSE is not accurate, its best to check for end of day OI data. Having said that, remember the OI data is a carry forward number and changes each day of the series. Where as the volume is for the day (it only increases as the day progresses, where as OI can change). I have illustrated this in section 12.2 of this chapter.
dear sir,, first of all this snap is taken at the END OF THE DAY (13th march 2015). and what i am trying to say is, on that day 65,60,000 contracts have been squared off.. so, logically that day\’s trading volume must be atleast 65,60,000. please explain your opinion. thankyou.
Yes, in fact if you see the traded volumes (expressed in number of contracts) is 7975, which is basically 7975 * 8000 = 6.38Cr shares…which is clearly way higher than the 65,60,0000 shares which were squared off.
65,60,000 are shares or contract?? now, it\’s all going over my head.. 🙂
Number of shares 🙂
PLEASE EXPLAIN THESE TERMS HIGHLIGHTED IN BLUE COLOUR. WHAT DOES THIS MEAN?
THANK YOU.
Raju, all the terms related to volatility will be explained in the Options module…and honestly I really dont understand that cost of carry bit on NSE wbebsite, we even spoke to NSE about it, but I\’m yet to understand it clearly. Will keep you posted as soon as I get an answer myself. Thanks.
I want to clarify, you say Increase in price and Increase in OI mean More trades on the long side. How is this possible if there is a seller for every buyer?
As I\’ve mentioned on a standalone basis OI information is pretty much useless…it is a perception that when OI increases and the price increases it is considered bullish.
If not on standalone basis can we combine OI analysis with Indicators, charts for trading decision?
OI is best when you look at it from the price perspective. But yeah, you also combine it with elements such as support and resistance.
Yes,
No. of long & shorts is same. However when both price and OI is increasing it means that the market is dominated by bulls.
Is there any way to find option selling from option chain .
No really.
Can you provide the mail id to clarify the trading strategy related queries?
Request you to kindly post your queries here, so that others too can benefit. Thanks.
Query related to Options:
Today DLF15MAR140CE traded @ 9.25 & DLF15MAR140PE traded @ 3.30 at around 10:30Hours and the spot price is 145. At the EOD Spot moved to 149.2, CE from 9.2 to 11.6 but put down from 3.3 to 2.25rupees. Eventhough the option is far away from the expiry but why the depreciation in PUT price? Suppose if i used the long straddle strategy chance of profit in both call & puts. Can you clarify?
This depends on the sensitivity of the option\’s premium to the directional move in the spot. The 140CE is deep ITM option, whose delta is close to 1, hence the option behaves very similar to spot. We will talk about this and more shortly in options. All these queries will be sorted for you. Request you to kindly stay tuned till then. Thanks.
Most s/w including Pi offers something called as \’Candle volume\’ chart which combines candlestick and volumes. I will try and include a chapter based on this sometime soon.
Sir Plz provide a lecture on volume candle and its effects
Will try and do that sometime soon, Vivek.
Hi Karthik! Do you know of any good analysis software that offers the option of candles based on volumes (stocks/contracts) traded…as opposed to the usual time-based candles (weekly, daily, hourly)? Are there any plans to offer this on Pi?
Dear Karthik,
I had bought Nifty 8600 PE 20 lots @ 64, I found that it hit 74 @ 2:36PM when Nifty spot went to 8680.45 and Fut was 8716.25, I waited for another dip as Ididn\’t get chance to square off there and I kept sell @ 72.2,but @ 2:54PM Nifty spot was @ 8677 and Fut @ 8714 still 8600PE went down only to 69.90!!!,why? finally I had to take loss @ 52.80.
I guess you are mixing up futures data with options and complicating the whole thing 🙂 8600 is an OTM option, it is relatively less sensitive to prime movements in the spot (because of lower delta value). Suggest you read this – http://zerodha.com/z-connect/queries/stock-and-fo-queries/application-of-option-greeks
You might have hit a low vol scenario. Option prices drop will fall in volatility. This is a thing that amazes lot of option buyers who are new to the trading world. Check how nifty vix index moved during that time.
Hi Sir,
Please correct me if I am wrong. I am a price action day trader. I never used OI data till now. As per me, the trend changes when a valid pivot is broken. Suppose, a trend changing pivot is triggered with a decrease in OI. Does that mean, people are losing confidence in the trend and that makes the trend change more trustworthy?? Or, as the OI is decreasing which means people are not taking any positions in the new trend , hence its better to wait for the confirmation??
You can treat it that way…however another way to look at it is when OI increases it simply means there are too people betting on the same outcome. In fact I personally dont use OI much.
Sir
Do we have any chart to monitor OI.
We plan to add OI charts on Kite soon 🙂
Sir by what time we can expect this much needed service of open interest chart along with price in Kite ??
Eagerly waiting for your response.
Regards!
Its on the agenda, Prakash. We will do this sometime soon.
Now I know, soon means 10 months :p
I want you to check the topic\”OI and Volume interpretation\” from last chapter -\’open interest\’ in the current (futures trading) module .
There are some typing mistakes in the pdf document please correct it , as it is not convenient for everyone to read it online..please do it fast.
Can you point them out, Pravin? Thanks.
Hi All,
Forget about Charts, OI will give perfect price action any situation, your chart tells lie, but not OI data. Learn and trade with only OI. Gives good profits. Just learn only how to read and trade with OI. Don\’t spend any money for learning charts and don\’t make trade teachers to become rich. Need minimum 1 year to understand the OI chain completely to trade on, later you will become a master. Yes, patience is required to understand OI data, later no one can beat you.
How may trader teachers work?
If charts works, they will trade and earn. They know they only 50 – 50, that\’s why they will earn by teaching. Yes, you can earn more and more money by teaching than trading. This is a consistent profit. By trading you may loss, but not by teaching. Many teachers will show only historical charts and explain all charts. Coming live charts no one ready to predict.
This is my open challenge.
I have a slightly different opinion on OI. I think on a standalone basis, OI is just a data point. One needs to associate this with prices to arrive at the right conclusion. End of the day, these are all based on assumptions and empirical studies 🙂