
10.1 – The Leverage Ratios
We touched upon the topic of financial leverage while discussing Return on Equity and the DuPont analysis. The use of leverage (debt) is like a double edged sword.
Well managed companies seek debt if they foresee a situation where, they can deploy the debt funds in an environment which generates a higher return in contrast to the interest payments the company has to makes to service its debt. Do recollect a judicious use of debt to finance assets also increases the return on equity.
However if a company takes on too much debt, then the interest paid to service the debt eats into the profit share of the shareholders. Hence there is a very thin line that separates the good and the bad debt. Leverage ratios mainly deal with the overall extent of the company’s debt, and help us understand the company’s financial leverage better.
We will be looking into the following leverage ratios:
- Interest Coverage Ratio
- Debt to Equity Ratio
- Debt to Asset Ratio
- Financial Leverage Ratio
So far we have been using Amara Raja Batteries Limited (ARBL) as an example, however to understand leverage ratios, we will look into a company that has a sizable debt on its balance sheet. I have chosen Jain Irrigation Systems Limited (JISL), I would encourage you calculate the ratios for a company of your choice.
Interest Coverage Ratio:
The interest coverage ratio is also referred to as debt service ratio or the debt service coverage ratio. The interest coverage ratio helps us understand how much the company is earning relative to the interest burden of the company. This ratio helps us interpret how easily a company can pay its interest payments. For example, if the company has an interest burden of Rs.100 versus an income of Rs.400, then we clearly know that the company has sufficient funds to service its debt. However a low interest coverage ratio could mean a higher debt burden and a greater possibility of bankruptcy or default.
The formula to calculate the interest coverage ratio:
[Earnings before Interest and Tax / Interest Payment]
The ‘Earnings before Interest and Tax’ (EBIT) is:
EBITDA – Depreciation & Amortization
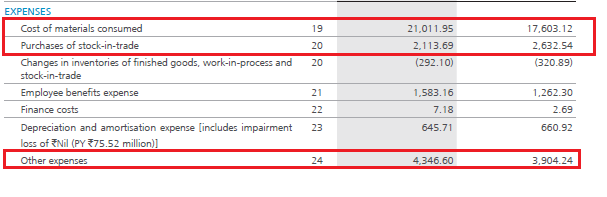
Let us apply this ratio on Jain Irrigation Limited. Here is the snapshot of Jain Irrigation’s P&L statement for the FY 14, I have highlighted the Finance costs in red:
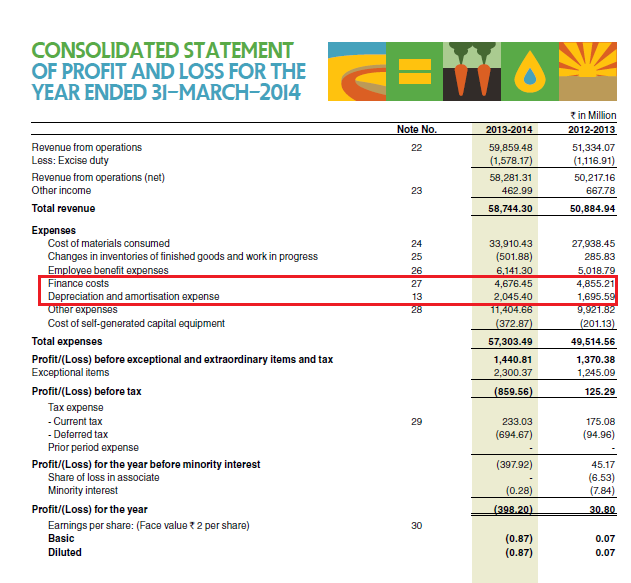
We know EBITDA = [Revenue – Expenses]
To calculate the expenses, we exclude the Finance cost (Rs.467.64Crs) and Depreciation & Amortization cost (Rs.204.54) from the total expenses of Rs.5730.34 Crs.
Therefore EBITDA = Rs.5828.13 – 5058.15 Crs
EBITDA = Rs. 769.98 Crs
We know EBIT = EBITDA – [Depreciation & Amortization]
= Rs.769.98 – 204.54
= Rs. 565.44
We know Finance Cost = Rs.467.64,
Hence Interest coverage is:
= 565.44/ 467.64
= 1.209x
The ‘x’ in the above number represents a multiple. Hence 1.209x should be read as 1.209 ‘times’.
Interest coverage ratio of 1.209x suggests that for every Rupee of interest payment due, Jain Irrigation Limited is generating an EBIT of 1.209 times.
Debt to Equity Ratio:
This is a fairly straightforward ratio. Both the variables required for this computation can be found in the Balance Sheet. It measures the amount of the total debt capital with respect to the total equity capital. A value of 1 on this ratio indicates an equal amount of debt and equity capital. Higher debt to equity (more than 1) indicates higher leverage and hence one needs to be careful. Lower than 1 indicates a relatively bigger equity base with respect to the debt.
The formula to calculate Debt to Equity ratio is:
[Total Debt/Total Equity]
Please note, the total debt here includes both the short term debt and the long term debt.
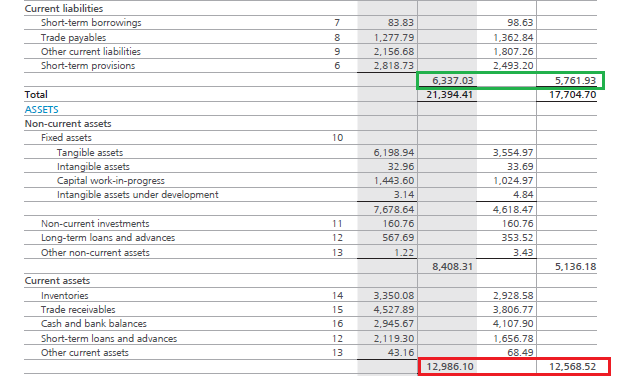
Here is JSIL’s Balance Sheet, I have highlighted total equity, long term, and short term debt:
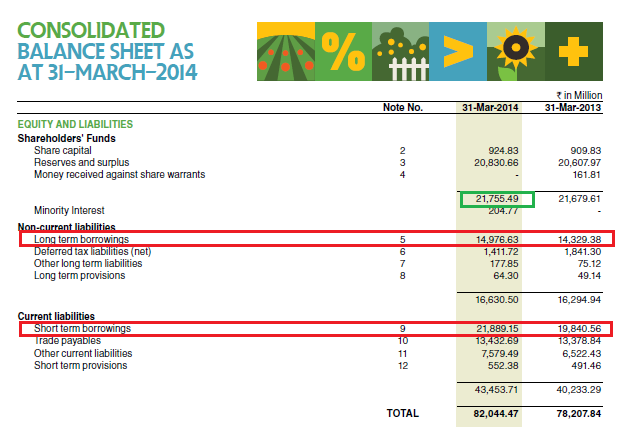
Total debt = Long term borrowings + Short term borrowings
= 1497.663 + 2188.915
= Rs.3686.578Crs
Total Equity is Rs.2175.549 Crs
Thus, Debt to Equity ratio will be computed as follows:
= 3686.578 / 2175.549
= 1.69
Debt to Asset Ratio:
This ratio helps us understand the asset financing pattern of the company. It conveys to us how much of the total assets are financed through debt capital.
The formula to calculate the same is:
Total Debt / Total Assets
For JSIL, we know the total debt is Rs.3686.578Crs.
From the Balance Sheet, we know the total assets as Rs.8204.447 Crs:
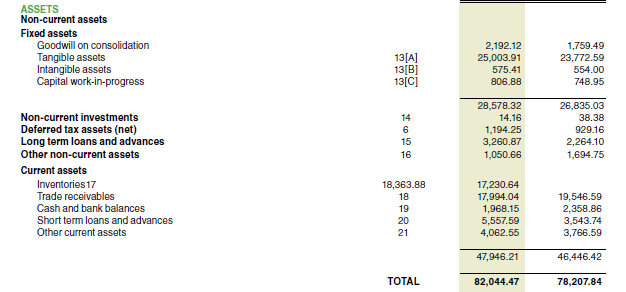
Hence the Debt to Asset ratio is:
=3686.578 / 8204.44
= 0.449 or ~45%.
This means roughly about 45% of the assets held by JSIL is financed through debt capital or creditors (and therefore 55% is financed by the owners). Needless to say, higher the percentage the more concerned the investor would be as it indicates higher leverage and risk.
Financial Leverage Ratio
We briefly looked at the financial leverage ratio in the previous chapter, when we discussed about Return on Equity. The financial leverage ratio gives us an indication, to what extent the assets are supported by equity.
The formula to calculate the Financial Leverage Ratio is:
Average Total Asset / Average Total Equity
From JSIL’s FY14 balance sheet, I know the average total assets is Rs.8012.615.The average total equity is Rs.2171.755. Hence the financial leverage ratio or simply the leverage ratio is:
8012.615 / 2171.755
= 3.68
This means JSIL supports Rs.3.68 units of assets for every unit of equity. Do remember higher the number, higher is the company’s leverage.
10.2 – Operating Ratios
Operating Ratios also called ‘Activity ratios’ or the ‘Management ratios’ indicate the efficiency of the company’s operational activity. To some degree, the operating ratios reveal the management’s efficiency as well. These ratios are called the Asset Management Ratios, as these ratios indicate the efficiency with which the assets of the company are utilized.

Some of the popular Operating Ratios are:
- Fixed Assets Turnover Ratio
- Working Capital Turnover Ratio
- Total Assets Turnover Ratio
- Inventory Turnover Ratio
- Inventory Number of Days
- Receivable Turnover Ratio
- Days Sales Outstanding (DSO)
The above ratios combine data from both the P&L statement and Balance sheet. We will understand these ratios by calculating them for Amara Raja Batteries Limited.
To get a true sense of how good or bad the operating ratios of a company are, one must compare the ratios with the company’s peers /competitors or these ratios should be compared over the years for the same company.
Fixed Assets Turnover
The ratio measures the extent of the revenue generated in comparison to its investment in fixed assets. It tells us how effectively the company uses its plant and equipment. Fixed assets include the property, plant and equipment. Higher the ratio, it means the company is effectively and efficiently managing its fixed assets.
Fixed Assets Turnover = Operating Revenues / Total Average Asset
The assets considered while calculating the fixed assets turnover should be net of accumulated depreciation, which is nothing but the net block of the company. It should also include the capital work in progress. Also, we take the average assets for reasons discussed in the previous chapter.
From ARBL’s FY14 Balance Sheet:
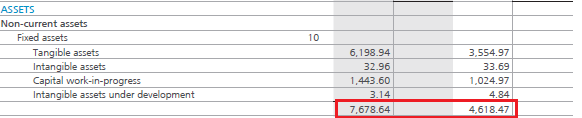
= (767.864 + 461.847)/2
= Rs.614.855 Crs
We know the operating revenue for FY14 is Rs.3436.7 Crs, hence the Fixed Asset Turnover ratio is:
= 3436.7 / 614.85
=5.59
While evaluating this ratio, do keep in mind the stage the company is in. For a very well established company, the company may not be utilizing its cash to invest in fixed assets. However for a growing company, the company may invest in fixed assets and hence the fixed assets value may increase year on year. You can notice this in case of ARBL as well, for the FY13 the Fixed assets value is at Rs.461.8 Crs and for the FY14 the fixed asset value is at Rs.767.8 Crs.
This ratio is mostly used by capital intensive industries to analyze how effectively the fixed assets of the company are used.
Working Capital Turnover
Working capital refers to the capital required by the firm to run its day to day operations. To run the day to day operations, the company needs certain type of assets. Typically such assets are – inventories, receivables, cash etc. If you realize these are current assets. A well managed company finances the current assets by current liabilities. The difference between the current assets and current liabilities gives us the working capital of the company.
Working Capital = Current Assets – Current Liabilities
If the working capital is a positive number, it implies that the company has working capital surplus and can easily manage its day to day operations. However if the working capital is negative, it means the company has a working capital deficit. Usually if the company has a working capital deficit, they seek a working capital loan from their bankers.
The concept of ‘Working Capital Management’ in itself is a huge topic in Corporate Finance. It includes inventory management, cash management, debtor’s management etc. The company’s CFO (Chief Financial Officer) strives to manage the company’s working capital efficiently. Of course, we will not get into this topic as we will digress from our main topic.
The working capital turnover ratio is also referred to as Net sales to working capital. The working capital turnover indicates how much revenue the company generates for every unit of working capital. Suppose the ratio is 4, then it indicates that the company generates Rs.4 in revenue for every Rs.1 of working capital. Needless to say, higher the number, better it is. Also, do remember all ratios should be compared with its peers/competitors in the same industry and with the company’s past and planned ratio to get a deeper insight of its performance.
The formula to calculate the Working Capital Turnover:
Working Capital Turnover = [Revenue / Average Working Capital]
Let us implement the same for Amara Raja Batteries Limited. To begin with, we need to calculate the working capital for the FY13 and the FY14 and then find out the average. Here is the snapshot of ARBL’s Balance sheet, I have highlighted the current assets (red) and current liabilities (green) for both the years:
The average working capital for the two financial years can be calculated as follows:
| Current Assets for the FY13 | Rs.1256.85 |
| Current Liabilities for the FY13 | Rs.576.19 |
| Working Capital for the FY13 | Rs.680.66 |
| Current Asset for the FY14 | Rs.1298.61 |
| Current Liability for the FY14 | Rs.633.70 |
| Working Capital for the FY14 | Rs.664.91 |
| Average Working Capital | Rs.672.78 |
We know the revenue from operations for ARBL is Rs.3437 Crs. Hence the working capital turnover ratio is:
= 3437 / 672.78
= 5.11 times
The number indicates that for every Rs.1 of working capital, the company is generating Rs.5.11 in terms of revenue. Higher the working capital turnover ratio the better it is, as it indicates the company is generating better sales in comparison with the money it uses to fund the sales.
Total Assets Turnover
This is a very straight forward ratio. It indicates the company’s capability to generate revenues with the given amount of assets. Here the assets include both the fixed assets as well as current assets. A higher total asset turnover ratio compared to its historical data and competitor data means the company is using its assets well to generate more sales.
Total Asset Turnover = Operating Revenue / Average Total Assets
The average total assets for ARBL is as follws –
Total Assets for FY 13 – Rs.1770.5 Crs and Total Assets for FY 14 – 2139.4 Crs. Hence the average assets would be Rs. 1954.95 Crs.
Operating revenue (FY 14) is Rs. 3437 Crs. Hence Total Asset Turnover is:
= 3437 / 1954.95
= 1.75 times
Inventory Turnover Ratio
Inventory refers to the finished goods that a company maintains in its store or showroom with an expectation of selling the finished goods to prospective clients. Typically, the company besides keeping the goods in the store would also keep some additional units of finished goods in its warehouse.
If a company is selling popular products, then the goods in the inventory gets cleared rapidly, and the company has to replenish the inventory time and again. This is called the ‘Inventory turnover’.
For example think about a bakery selling hot bread. If the bakery is popular, the baker probably knows how many pounds of bread he is likely to sell on any given day. For example, he could sell 200 pounds of bread daily. This means he has to maintain an inventory of 200 pounds of bread every day. So, in this case the rate of replenishing the inventory and the inventory turnover is quite high.
This may not be true for every business. For instance, think of a car manufacturer. Obviously selling cars is not as easy as selling bread. If the manufacturer produces 50 cars, he may have to wait for sometime before he sells these cars. Assume, to sell 50 cars (his inventory capacity) he will need 3 months. This means, every 3 months he turns over his inventory. Hence in a year he turns over his inventory 4 times.
Finally, if the product is really popular the inventory turnover would be high. This is exactly what the ‘Inventory Turnover Ratio’ indicates.
The formula to calculate the ratio is:
Inventory Turnover = [Cost of Goods Sold / Average Inventory]
Cost of goods sold is the cost involved in making the finished good. We can find this in the P&L Statement of the company. Let us implement this for ARBL.
To evaluate the cost of goods sold, I need to look into the expense of the company, here is the extract of the same:
Cost of materials consumed is Rs.2101.19 Crs and purchases of stock-in-trade is Rs.211.36 Crs. These line items are directly related to the cost of goods sold. Along with this I would also like to inspect ‘Other Expenses’ to identify any costs that are related to the cost of goods sold. Here is the extract of Note 24, which details ‘Other Expenses’.
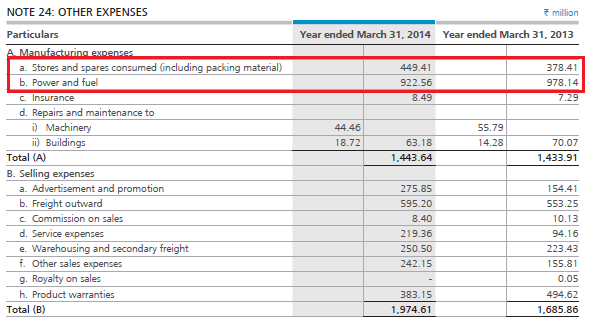
There are two expenses that are directly related to manufacturing i.e. Stores & spares consumed which is at Rs.44.94 Crs and the Power & Fuel cost which is at Rs.92.25Crs.
Hence the Cost of Goods Sold = Cost of materials consumed + Purchase of stock in trade + Stores & spares consumed + Power & Fuel
= 2101.19 + 211.36 + 44.94 + 92.25
COGS= Rs.2449.74 Crs
This takes care of the numerator. For the denominator, we just take the average inventory for the FY13 and FY14. From the balance sheet – Inventory for the FY13 is Rs.292.85 Crs and for the FY14 is Rs.335.00 Crs. The average works out to Rs.313.92 Crs
The Inventory turnover ratio is:
= 2449.74 / 313.92
= 7.8 times
~ 8.0 times a year
This means Amara Raja Batteries Limited turns over its inventory 8 times in a year or once in every 1.5 months. Needless to say, to get a true sense of how good or bad this number is, one should compare it with its competitor’s numbers.
Inventory Number of days
While the Inventory turnover ratio gives a sense of how many times the company ‘replenishes’ their inventory, the ‘Inventory number of Days’ gives a sense of how much time the company takes to convert its inventory into cash. Lesser the number of days, the better it is. A short inventory number of day’s number implies, the company’s products are fast moving. The formula to calculate the inventory number of days is:
Inventory Number of Days = 365 / Inventory Turnover
The inventory number of days is usually calculated on a yearly basis. Hence in the formula above, 365 indicates the number of days in a year.
Calculating this for ARBL:
= 365 / 7.8
= 46.79 days
~ 47.0 days
This means ARBL roughly takes about 47 days to convert its inventory into cash. Needless to say, the inventory number of days of a company should be compared with its competitors, to get a sense of how the company’s products are moving.
Now here is something for you to think about – What would you think about the following situation?
- A certain company under consideration has a high inventory turnover ratio
- Because of a high inventory turnover ratio, the inventory number of days is very low
On the face of it, the inventory management of this company looks good. A high inventory turnover ratio signifies that the company is replenishing its inventory quickly, which is excellent. Along with the high inventory turnover, a low inventory number of days indicate that the company is quickly able to convert its goods into cash. Again, this is a sign of great inventory management.
However, what if the company has a great product (hence they are able to sell quickly) but a low production capacity? Even in this case the inventory turnover will be high and inventory days will be low. But a low production capacity can be a bit worrisome as it raises many questions about the company’s production:
- Why is the company not able to increase their production?
- Are they not able to increase production because they are short of funds?
- If they are short of funds, why can’t they seek a bank loan?
- Have they approached a bank and are not been able to raise a loan successfully?
- If they are not able to raise a loan, why?
- What if the management does not have a great track record, hence the banks hesitation to give a loan?
- If funds are not a problem, why can’t the company increase production?
- Is sourcing raw materials difficult? Is the raw material required regulated by government (like Coal, power, Oil etc).
- Difficult access to raw material – does that mean the business is not scalable?
As you can see, if any of the points above is true, then a red flag is raised, hence investing in the company may not be advisable. To fully understand the production issues (if any), the fundamental analyst should read through the annual report (especially the management discussion & analysis report) from the beginning to the end.
This means whenever you see impressive inventory numbers, always ensure to double check the production details as well.
Accounts Receivable Turnover Ratio
Having understood the inventory turnover ratio, understanding the receivable turnover ratio should be quite easy. The receivable turnover ratio indicates how many times in a given period the company receives money/cash from its debtors and customers. Naturally a high number indicates that the company collects cash more frequently.
The formula to calculate the same is:
Accounts Receivable Turnover Ratio = Revenue / Average Receivables
From the balance sheet we know,
Trade Receivable for the FY13 : Rs.380.67 Crs
Trade Receivable for the FY14 : Rs. 452.78 Crs
Average Receivable for the FY13 : Rs.416.72
Operating Revenue for the FY14 : Rs.3437 Crs
Hence the Receivable Turnover Ratio is:
= 3437 / 416.72
= 8.24 times a year
~ 8.0 times
This means ARBL receives cash from its customers roughly about 8.24 times a year or once every month and a half.
Days Sales Outstanding (DSO) )/ Average Collection Period/ Day Sales in Receivables
The days sales outstanding ratio illustrates the average cash collection period i.e the time lag between billing and collection. This calculation shows the efficiency of the company’s collection department. Quicker/faster the cash is collected from the creditors, faster the cash can be used for other activities. The formula to calculate the same is:
Days Sales outstanding = 365 / Receivable Turnover Ratio
Solving this for ARBL,
= 365 / 8.24
= 44.29 days
This means ARBL takes about 45 days from the time it raises an invoice to the time it can collect its money against the invoice.
Both Receivables Turnover and the DSO indicate the credit policy of the firm. A efficiently run company, should strike the right balance between the credit policy and the credit it extends to its customers.
Key takeaways from this chapter
- Leverage ratios include Interest Coverage, Debt to Equity, Debt to Assets and the Financial Leverage ratios
- The Leverage ratios mainly study the company’s debt with respect to the company’s ability to service the long term debt
- Interest coverage ratio inspects the company’s earnings ability (at the EBIT level) as a multiple of its finance costs
- Debt to equity ratio measures the amount of equity capital with respect to the debt capital. Debt to equity of 1 implies equal amount of debt and equity
- Debt to Asset ratio helps us understand the asset financing structure of the company (especially with respect to the debt)
- The Financial Leverage ratio helps us understand the extent to which the assets are financed by the owner’s equity
- The Operating Ratios also referred to as the Activity ratios include – Fixed Assets Turnover, Working Capital turnover, Total Assets turnover, Inventory turnover, Inventory number of days, Receivable turnover and Day Sales Outstanding ratios
- The Fixed asset turnover ratio measures the extent of the revenue generated in comparison to its investment in fixed assets
- Working capital turnover ratio indicates how much revenue the company generates for every unit of working capital
- Total assets turnover indicates the company’s ability to generate revenues with the given amount of assets
- Inventory turnover ratio indicates how many times the company replenishes its inventory during the year
- Inventory number of days represents the number of days the company takes to convert its inventory to cash
- A high inventory turnover and therefore a low inventory number of days is a great combination
- However make sure this does not come at the cost of low production capacity
- The Receivable turnover ratio indicates how many times in a given period the company receives money from its debtors and customers
- The Days sales outstanding (DSO) ratio indicates the Average cash collection period i.e the time lag between the Billing and Collection
This comment only belongs to who have doubt in Interest Coverage Ratio.
EBITDA (Earnings Before Interest Tax Depreciation and Amortization) means
Theoretically – For sake of understanding the concept, think you are just passed out from college and landed in job and you had tax of Rs 0 so you Earnings will look like
Income Job 100
Expenses Home rent 20
Education Loan Interest 10
Bike Depreciation 10
Net Earnings 60
Here you are calculating the Net Earnings or Net Income (What amount will remains after necessary expenditure)
Since we are calculating Interest Coverage Ratio we will deduct only Bike Depreciation value as expenses and the education loan interest amount will remains with me only. Bcz i want to know (How much rupees i am paying the interest on education loan with respect to my net earnings).
So my Net Earnings looks like
Income Job 100
Expenses Home rent 20
Bike Depreciation 10
Net Earnings 70
Now it is EBIT (Earnings Before Paying Education loan Interest and Tax) = 70
Interest Coverage Ratio = EBITEducation Loan Interest
= 7010
= 7
Hence for every Rs 1 interest i am paying for education loan , i am earning Rs 7.
Problematically
EBITDA = Revenue – [Total Expenses -Interest – Depreciation & Amortization]
EBITDA = Revenue – Total Expenses + Interest + Depreciation & Amortization
Similarly
EBIT = Revenue – [Total Expense – Interest]
EBIT = Revenue – Total Expenses + Interest
EBITDA (What ever your net earnings you are considering before paying your interest , tax and depreciation & amortization amount)
EBIT (What ever your net earnings you are considering before paying your interest and tax only)
(So if you not pay any interest ,tax and D&A that amount will remains with you only hence it will be not considered in expense will calculating EBITDA)
Correct me i am having the wrong perceptionunderstanding on this.
Simple way to look at this is to as yourself –
What is the interest you have to pay every year?
What is the cash you earn every year?
If your interest obligation for every yer is 100 and the cash you earn is 1000, then that means your interest coverage is 10.
1000/100
=10
That means you are earning 10 times the interest obligation, so you are in good financial state.
Sir, in the Inventory Turnover Ratio example, you mentioned 50 cars taking 3 months to replenish. In Scenario 1, if another company has 100 cars with the same 3 months to replenish, and in Scenario 2, if the company has 100 cars but takes 3½ months to replenish, then how can we say which company is better and why?
Sir, I have one more doubt. Why do we have to take the average value in most operating ratios and leverage ratios? Why can’t we use the value of a particular period or year?
Both have similar ITR right? Averages help us understand the year on year variations if any.
Sir, compare scenario-1 and 2 with the 50 cars.
Hi Karthik sir and team varsity,
EBITDA = Revenue – (Total Expenses – Finance Cost – D&A)— instead of this formula
we can change this formula into simple way.. just basic math but I\’m also get confused in the first place 😂
EBITDA = Revenue – Total Expenses + Finance Cost +D&A
No changes?
This is what Karthik sir mean by D&A not deducted twice in comments…it\’s hidden inside the formula
If it\’s correct please let me know sir
And thankyou so much for giving this wonderful lessons sir
In EBITDA we add D&A but it hidden inside the total expenses,
just removing the bracket we can see the D&A added and EBITDA value remains same(check yourself)
Then ,
EBIT = EBITDA -D&A
We deducted D&A once as Karthik sir Said in comments
Thats right, Nandesh 🙂
I want to share my gratitude to you sir and team varsity,
Thank you for your valuable lessons sir and I\’m looking forward to complete all remaining modules…
Keep teaching sir
Hello kartik sir adiyta here , sir for the jain irrigation system intrest coverage ratio was 1.209 times sir how do we knwo if it is a good or bad number
The ratio tells us if the company is making enough to cover for the interest payments. Higher the number, better it is.
thank you sir
Most welcome! Happy learning 🙂
In the previous chapter, the formula for the financial leverage ratio was average total assets divided by shareholder\’s equity. However, in this chapter, it is average total assets divided by average shareholder\’s equity. Please verify which one is correct.
Hmm, let me check that again. Something seems amiss 🙂
Hi Karthik,
Just a quick question, why haven\’t you included \”Operating Leverage Ratio\” in Leverage Ratios.
Sorry to ask you if you have already answered this question.
I have included a bunch of leverage ratios, some of them are operations related.
sir as you have noticed that there is a lot of enquiry about Interest Coverage Ratio regarding calculation of EBIT in the comment section. Almost evry 4th comment is regarding this. can you please give a detailed final explaination regading EBIT calculation…………………………….
i ANKIT SINGH on the behalf of whole COMMENT SECTION(doubts related to ICR) asks you to please explain a single universal doubt that {[(why you have deducted the depreciation and amortization TWICE)]}
I think I had explained this earlier. Maybe its lost in the comments. If its twice, then that is a typo 🙁
Hi sir, I was trying to calculate the accounts receivable turnover ratio
Accounts Receivable Turnover Ratio = Revenue / Average Receivables
Net Revenue or Net Credit Sales: This should ideally include only credit sales (not cash sales) because the ratio measures how efficiently a company collects receivables. If data on credit sales is unavailable, total revenue is sometimes used as an approximation.
Please do correct me if I am wrong.
Taking total revenue as an approximation could be a stretch. But in the absence of data maybe you can by eliminating other income.
EBITDA = [Revenue – Expenses]
To calculate the expenses, we exclude the Finance cost (Rs.467.64Crs) and Depreciation & Amortization cost (Rs.204.54) from the total expenses of Rs.5730.34 Crs.
Therefore EBITDA = Rs.5828.13 – 5058.15 Crs
EBITDA = Rs. 769.98 Crs
We know EBIT = EBITDA – [Depreciation & Amortization]
Why Depreciation & Amortization subtracted twice in the formula
yeah, have addressed this in the older comments Vijay.
In interest coverage ratio, you took Revenue as revenue from operations but when it came to Expense you took total expense(you included other expense also ) why is that ?
Operating revenues are predictable while other income is not. Expenses are more or less fixed. Thats why.
Hello Karthik
These modules are really helpful in understanding all the concepts. But I had one suggestion – If you could mention the ideal range of the the financial ratios where applicable it would really be helpful in analyzing (I understand we need to compare these ratios with the past performances or with the peers but still an ideal range for the important ratios would be great!!)
For exact same reasons that you mentioned, suggesting a range is difficult 🙂
Its always a good idea to check with the peers in the industry and get a sense of what the industry average is.
for calculating accounts receivable turnover ratio, some websites reveal the formula as
Net credit sales/Average Accounts receivable which differs from your formula of Sales/Average Accounts Receivable
Hmm, not sure. Maybe you should check this once with context of explanation?
Hi Karthik,
Why we are removing the Finance cost and Depreciation & Amortization cost while calculating the EBITDA under the interest coverage ratio? Because in the last chapter while calc the profitability ratio the EBITDA formula is [Operating Revenues – Operating Expense]. Pls do clarify.
Since these are accounting entries, we exclude them to find out the true operating expenses and the margins.
Hey Karthik! Can you please explain how to find the outstanding shares of a company?
Thanks
Divide the marketcap by the stock price, and you will get the o/s shares.
first of all thanks for wonderful education series and special thanks for answering to almost every comment.
here i have a doubt. i am getting confused with EBIT and EBITDA,
EBITDA = EBIT+ DA,
EBIT = operating revenue – operating expense;
operating revenue = total revenue – other income and
operating expense= total expense – finance cost – Depriciation and Amortization.
hope i am right. please correct me if wrong. Thanks again.
Thats correct, happy learning 🙂
Thank you, Sir. for such an great explanation, But I didn\’t understand the method used in calculating the \”EBIT\”. Because we already deducted Depreciation & Amortization while calculating \”EBITDA\” & why substracting Depreciation & Amortization again in calculating \”EBIT\” it is 2nd time we are substracting Depreciation & Amortization expenses.
Ah, that could be a typo Darshan. We have discussed this in the comments above, request you to please check again. Thanks.
Hello Kartik. Thank you for all these modules. I have a query. Depreciation and amortization is subtracted from total expense while calculating \”EBIDTA,\” in calculation of \”Operating expense.\” Why is it subtracted from EBIDTA, while calculating \”Earning before interest and tax\” in calculation of \”Interest coverage ratio?\”
Because D&A charges are accounting charges and not actual charges.
ok sir I understand waiting for an update. Thankyou sir you are giving so much for free. Thankyou zerodha varsity and special thanks to karthik Rangappa sir.
Happy learning, Kris!
sir sorry I am not spamming but the values are not changed. I came here to read second time. please correct as soon as possible thankyou.
Lots of things are due for an update, Kris. It will happen in 1 shot, we are a bit tight on bandwidth.
We know EBITDA = [Revenue – Expenses]
To calculate the expenses, we exclude the Finance cost (Rs.467.64Crs) and Depreciation & Amortization cost (Rs.204.54) from the total expenses of Rs.5730.34 Crs.
Therefore EBITDA = Rs.5828.13 – 5058.15 Crs
EBITDA = Rs. 769.98 Crs
We know EBIT = EBITDA – [Depreciation & Amortization]
= Rs.769.98 – 204.54
= Rs. 565.44
We know Finance Cost = Rs.467.64,
Hence Interest coverage is:
= 565.44/ 467.64
= 1.209x
we already excluded depreciation and amortization in ebitda then why should we again exclude depreciation and amortization in EBIT. please explain sir. This query sir
Kris, like others, have pointed out, this is a mix. I need to make a minor edit here.
sir still waiting for your answer. please reply
Which query, Kris?
Hope you answer my question sir
please check and explain me sir
We know EBITDA = [Revenue – Expenses]
To calculate the expenses, we exclude the Finance cost (Rs.467.64Crs) and Depreciation & Amortization cost (Rs.204.54) from the total expenses of Rs.5730.34 Crs.
Therefore EBITDA = Rs.5828.13 – 5058.15 Crs
EBITDA = Rs. 769.98 Crs
We know EBIT = EBITDA – [Depreciation & Amortization]
= Rs.769.98 – 204.54
= Rs. 565.44
We know Finance Cost = Rs.467.64,
Hence Interest coverage is:
= 565.44/ 467.64
= 1.209x
we already excluded depreciation and amortization in ebitda then why should we again exclude depreciation and amortization in EBIT. please explain sir
Kris, must be an oversight. Checking this.
Hi Karthik,
Although you have shown what all component you considered while calculating cost of goods sold for inventory turnover ratio but still looking for how to identify the component. While trying from a thirdparty side they only considered cost of material consumed.
You have taken Power and Fuel as well in your calculation then in that case shouldn\’t We take Rent as well in consideration ?
Regards
I dont think Rent is required for inventory. Rent for an office space serves a larger purpose for an organization and not just for managing inventory.
Hi,
These content are really helpful. Thanks a lot.
How inventory turnover ratio can be compare b/w two companies if one company is maintaining the inventory of 50 cars and another maintains inventory of 40 cars. In this case obviously 2nd company\’s ratio will look better on paper.
You need to compare how quickly the inventory is getting sold, and revenue is being recognized. For this, you need to look at the inventory turnover ratio.
Really but which one sir???
Sir how is calculate ROIC with help of any annual report
Return of Capital? I\’ve explained this in the chapter Aswanth.
Why is \”changes in inventories of finished goods work-in-progress and stock-in-trade\” not a part of COGS?
Sahil, some investors prefer to take the direct cost for considering the cost of goods sold. Work in progress implies that the conversion of raw material to finished goods is due, hence the final costs are likely to go up.
Therefore EBITDA = Rs.5828.13 – 5058.15 Crs
EBITDA = Rs. 769.98 Crs
We know EBIT = EBITDA – [Depreciation & Amortization]
In the ICR calculation above – we already subtract Depreciation and Amortization cost from Expenses to arrive at EBITDA.
and again we subtract the Depreciation and Amortization cost from the EBITDA, essentially subtracting D&A twice ? Am i understanding this wrong ?
Ah no, you should not be doing that. I don\’t know if I\’ve made a mistake unknowingly. Let me check from my end.
Hello Sir,
I am watching your youtube videos and simultaneously checking this blog too as you haven\’t covered most of the things in Youtube video which you have covered here.
First of all thank you so much for your great effort.!!
In Interest coverage Ration section.
My confusion is In youtube video you directly took the amount from P&L and here you calculated separately. Ok i moved on following steps from this blog. But here to calculate EBITDA you already didnt took FInance cost & D&A amount whereas in Youtube video you calculated EBITDA by Total Income – Total Expense.
Here after deducting the Finance cost & D&A cost again (Which in itself became EBIT i guess, Correct me if am wrong) you are deducting the D&A cost from the balance total to calculate EBITDA to calculate EBIT. How come?
Please refer below steps you mentioned above.
We know EBITDA = [Revenue – Expenses]
To calculate the expenses, we exclude the Finance cost (Rs.467.64Crs) and Depreciation & Amortization cost (Rs.204.54) from the total expenses of Rs.5730.34 Crs.
Therefore EBITDA = Rs.5828.13 – 5058.15 Crs
EBITDA = Rs. 769.98 Crs
We know EBIT = EBITDA – [Depreciation & Amortization]
= Rs.769.98 – 204.54
= Rs. 565.44
We know Finance Cost = Rs.467.64,
Hence Interest coverage is:
= 565.44/ 467.64
= 1.209x
Ganesh, I\’d suggest you go with the video approach.
Hi Kartik
Can manufacturing expense be considered in the cost of goods sold?
I suppose yes as this is also one expense that the company incurs related to COGS
Please clarify if i am wrong
Yes, that can be considered.
Hi Kartik
When the Average working capital of FY 19-20 is say -2800 Cr and for year 21-22, it is 2400 Cr then the average working capital is -ve as -400/2=-200
So apart from interpreting that Company has a cash crunch in its day to day operations,how do we calculate the Working capital Turnover ratio as it will also be negative
You really need to inspect the reason why the WC is negative. WC is current asset – current liability. If the product the company is really good, and the company receives advance from clients, that sits as a liability…and can lead to a -WC. But this is not necessarily a bad situation for the company.
Sir, ek doubt tha
Interest coverage ratio mein aapne EBIT 1.209x bataya hai. Yaani ki har ₹1 pe company ko 1.209 ₹ chukana hai. Right?
Hi,
In interest coverage ratio. Why depreciation and amortization is subtracted two times?
Depreciation and amortization is subtracted from the expense while calculating EBITDA
Depreciation and amortization is again subtracted to get earning before interest and tax?
EBITDA -Earnings before interest tax depreciation and Amortization right ?
So that means depreciation and amortization are not included in EBITDA
Then while calculating interest coverage ratio , EBIT is calculated as EBITDA-(Depreciation and amortization)
how can we subtract depreciation and amortization from EBITDA when it is not included in the first place ?
Ah, need to go through the chapter details again. Meanwhile, please do keep track of the financial modeling module, will be covering all these ratios again – https://zerodha.com/varsity/module/financial-modelling/
in calculation of fixed asset turnover ratio why is intangible assets & intangible assets under development included?
It should not, let me check if there is an error.
does account receivables include loans receivable too apart from trade receivables? if yes, are non-current loan receivables also included?
Yes, all sorts of receivables are included. Check the associated notes for more details on the nature of receivable.
I just wanted to ask why are we calculating the ratios manually? Like is there any advantages? Because all the ratios are present on various websites
To understand how the ratios are calculated. Once you are comfortable, you can look at 3rd party sites. When you do, if you find it not convincing, you will always know how to calculate yourself.
Respected Sir,
I most humbly asseverate that COGS calculation as suggested by you is logically inconsistent, because it conspicuously misses the cardinal aspect of inclusion of the line item \”CHANGES IN INVENTORIES OF FINISHED GOODS, WORK-IN-PROCESS AND STOCK-IN-TRADE\”. Accordingly COGS should be the aggregate of the 1) COST OF MATERIALS CONSUMED 2) PURCHASE OF STOCK-IN-TRADE 3) CHANGES IN INVENTORIES OF FINISHED GOODS, WORK-IN-PROCESS AND STOCK-IN-TRADE. In the instant case of ARBL FY14 as per the hitherto alluded proposition the COGS is 2,283.354 Cr. Furthermore i cautiously opine that overhead manufacturing expenses like packaging materials, power etc should not be included in COGS.
Thanks
Hi my doubt is where did u get inventory for FY13=292.85Cr
Can you please check the annual report/associated notes, please?
Hi Kartik,
Which line item u used for
below statement ,it is used in calculating inventory turnover ratio
\”\”From the balance sheet – Inventory for the FY13 is Rs.292.85 Crs and for the FY14 is Rs.335.00 Crs. The average works out to Rs.313.92 Crs\”\”
The ratio should be calculated Sarvesh, it won\’t be stated in the financial statements.
I think that in account receivable turnover ratio numberator should be the credit sales and not total revenue cause debtors arise due to credit sales and we can get credit sales by doing total revenue- cash sales and cash sales can be derived from cash flow statement?
Yup, let me check this again.
Got it pradeep sir,Thanks😊
Response to Mayur – Absolutely right to think in that direction. However, when doing a comparison, be sure to exclude the WIP item from the balance sheet of both companies. Based on accounting norms, this amount is shown under the fixed assets, so in case one chooses to include it in the ratio calculation, we need to be careful to include it even in the calculation of the company we\’re comparing it to so that there is consistency. Again, it depends case to case.
I think in fixed asset turnover Capital wip shouldn\’t be included reason capital wip yet not ready for company use it is still under construction so it won\’t be generating any revenue for company so the operating revenue won\’t include figure of revenue generated from capital wip so it will be wrong to include the capital wip into fixed asset…
Accounts Receivable Turnover Ratio is calculated as Revenue/Avg Receivables. Revenue would include both Cash sales and credit sales, wouldn\’t it ? Should the formula for this ratio then be: Net Credit Sales/Avg receivables since considering cash revenues might not give an entirely accurate ratio ?
Depends on a case to case basis. If a company has a large credit sales but its comparable peers do not, I\’d be concerned and eager to know more.
Response to Ajit Kumar (regarding COGS) – I am late by 7 years but here it is anyway (in case it helps other readers) – Absolutely right in saying that the formula for COGS is Opening Stock+Stock Purchases-Closing Stock. If you try to understand this formula, you will see that the difference (Opening+Purchases-Closing) is nothing but the cost of stock that was sold during the year. Now, what does this cost include? It includes all \’inventory specific costs\’ – such as purchase cost, storing & handling costs, transportation costs, production costs, etc. to name a few. Now, going by the way Karthik had shown the calculation, it pretty much conveys a similar idea. Karthik essentially added up all the direct costs. Now these directs costs may or may not be \’inventory specific\’. For example, Karthik included Power and Fuel into the COGS calculation. This \’power\’ item can include lighting costs which in accounting sense may or may not be a direct cost (by direct cost I mean \’inventory specific\’). So if a particular expense is not attributable directly to the production, it won\’t be a direct cost and thus won\’t be included in the COGS. This is the reason why we see a difference between Ajit\’s and Karthik\’s idea of COGS. Honestly, to get a fundamental sense of the COGS, I would go by what Karthik had shown as that\’s easier. But if you\’re somebody who prefers more specific calculations, the COGS formula can be used. But again, when you use the formula, be very careful when you calculate the purchases as one needs t be sure what and what not to consider in purchases.
Happy learning!
Thanks for articulating this so well, Pradeep 🙂
Btw, 7 years is not too late considering this content will continue to stay here for years to come and many people who will benefit from your explanation.
i am from non- accounts background, that\’s why so much confusion for me
1)is there a difference between EBIT and PBIT calculation?
2) why r we subtracting FCost and D&A from Texpenses and den subtracting it from T revenue,, wouldn\’t it make it profit calculation whereas we just want earnings i.e. Revenue – (FC & DA)
also why r we not deducting tax from EBITDA and PBIT when its mentioned in dere name?
3)i noticed that in FRA 1 while calc. PBIT(ROCE) u have directly used PBEIT from P&L ,, shouldn\’t it be TR-TE(where from TE u have deducted F.Cost )
and even after this how to deducted taxes from it?
1) Yes, they are.
2) We have discussed this in the comments, request you to check the same
3) Please keep a tab on the Financial Modelling module, we will discuss these things with calculations.
I need to find total no of shares from balance sheet, Which formula is correct from the below mentioned equations? Pls reply
1). SH EQ/ FV
2). (SH EQUITY + RESERVES )/ FV
Stick to the first one.
What is the good debt equity ratio of NBFC?
Very hard to call this, depends on how effectively the NBFC is using the funds for lending.
in screener.in we have the below ratios but I couldn\’t find in our varsity financial ratio segments. please explain karthik.
1. Days Payable
2.Working Capital Days
3.Debtor Days
I\’d suggest you keep a tab on the new module which is work in progress, will cover these ratios here – https://zerodha.com/varsity/module/financial-modelling/
Thanks Sir for clarifying the doubt.
So, Accounts Receivable= Trade Receivables + Short Term Loans And Advances , which means account receivables are current assets . Right Sir?
Thats right, TR is current asset.
Sir, if receivables turnover ratio include money received from debtors and customers, so, should we include loans and advances(both current and non-current)under the scope of accounts receivable for calculation or shall they be excluded from the same? Because, usually what I have seen is that people exclude \”loans and advances\” while calculating receivable turnover ratio, which creates ambiguity. Plz clarify this doubt.
You can include only the current part, Sumit.
Hello Kartik, Thanks a lot for these financial lessons. I am really learning a lot from them.
I have a query related to the inventories in Inventory Turnover ratio. You mentioned that \”inventory\” refers to the finished goods that are yet to be sold. In your module, you have taken inventory for FY13 as Rs.292.85 Crs and for the FY14 as Rs.335.00 Crs. However, on looking at the balance sheet\’s Note 14 in the annual report, I can see that inventory sum includes Raw materials, Work-in-process, Finished goods, Stock-in-trade, Stores and spares and Loose tools. Hence the sum of Rs.292.85 Crs and Rs.335.00 Crs seems to include raw material and other things also along with the finished goods. Please guide me if I am missing something here.
Mukul, companies also take into consideration the resources consumed to manufacture these finished goods.
Hello Sir,
To follow up,
If a company states the revenue recognized.
Then for Q 1 a company has a cost of manufacturing x product and has sold the product but not disclosed the sold revenue.
Wouldn\’t this lead to discrepancies as it increases operational cost but does not adjust operational revenue?
Balance sheet happens at the year end.
Not really, Karthik. For finished goods, and then it will reflect in the inventory. But of course, inventory data will be available by year end.
Hello Sir,
I hope you are doing well.
For example, if a company has 1000 cr revenue for Q1. They have received 500 cr worth of their sales for that quarter.
From that 500 cr they got 50 cr Pat resulting in a margin of 10%. If they use the total revenue the margin reduces to 5%.
1) Now, what exactly does the company report in their quarterly result. Revenue of 1000 cr or revenue of 500 cr.
2) If they report revenue of 1000 cr, when do they show the profits from the balance payment? In the next subsequent quarter?
3) If they report revenue of 500 cr, do they add the other 500 cr revenue to the quarter they received the payment in?
1) Depends on their revenue recognition policy, but ideally, they should state the revenue recognised. The rest should goto receivables on the balance sheet
2) As and when they receive.
3) That\’s right, again depends on their revenue recognition policy.
Hello Sir,
So out of those sales are all those payments received? Do they only show revenue that has been received in the quarterly statement?
Thats right. By the way, if there is any major balance sheet items change, the company will report it and bring it to shareholders attention.
Hello Sir,
I am just giving random numbers.
What I am asking is how much of the total revenue is received in profits during that quarter. What about goods sold whose payment has not been received. That would show in the balance sheet at the end of the year. But what about it in the current quarter?
Companies usually release P&L numbers and not the BS numbers during the quarter. BS data is only by year end.
Hi Sir,
A company releases its quarterly results. It has an operating revenue of 1000cr.
PBIT of 200, PAT of 170 cr.
Did the 1000 cr translate to 170 cr or are some of the amounts receivable?
Has the company fully realized the 1000 cr of goods they have sold?
Somehow it does not seem to make sense…1000Cr post expense cant result to 170Cr PAT. Something seems missing here.
Hello Sir,
I have seen a company having 0 long-term and short-term borrowings.
But yet in their quarterly results, they are having to deduct the interest.
What does this mean?
Hmm, I\’m not sure how that would happen. There is no interest charge if there are no borrowings.
Hello Sir,
But how do I know if the company has increased its borrowings.
Only way I could find out if the company is paying more interest, but that could be due to an increase in interest rate not increase in borrowings.
If the company is borrowing a significant amount of money, they will state it to the public. You will have to keep track of it via news.
Hello Sir,
Most companies have already released their Q4 results and soon will release Q1 results but still have not released their balance sheet or cash flow statements from 2020-21.
Why is this the case?
Also, lets I want to invest in a company in Q 4 how reliable is their balance sheet of 2019-2020.
I would not know what kind of borrowing the company has done in the past year and what is happening regarding the company.
Usually, companies release this by year-end. Some companies may delay, but it should not be for more than 45 days. By Q4, things should be fairly clear given that Q1 – Q3 data is already out.
what is a good financial leverage ratio?
Depends on the company and the sector you are looking at.
Sir why infosys debt to asset ratio is so bad less than 15% in promoters holding and still why its so trustable sir? And can you give some names of company like infosys sir ?
Babu, Infosys is a zero debt company.
Hi sir! I am totally new here,So I want to ask you that these all ratio would be available in ANNUAL REPORT or we have to calculate it by our own?
Few basic ratios will be available, but the rest needs to calculated.
Hi Karthik, Am really enjoying your blog. I have been able to understand some basic concepts which i used to struggle with for many years.
One question on calculation of COGS, shouldn\’t we subtract the \”Change in Inventory, WIP and stock in trade\” from COGS as these costs were related to goods not sold in the current year?
Not really, this won\’t be required for COGS. I\’m glad you liked the content 🙂
If Financial Leverage Ratio is high, how can we say it is highly leveraged?
Yup, do verify by looking at the debt level of the company as well.
Hi Karthik, thank you for all the chapters on Varsity. I was going through the fundamental analysis chapters again when I found this discussion on Cost of Goods sold.
Could you please explain which formula will be better to calculate COGS. As even I saw the formula as Total expense- last year inventory +Current inventory.
I am a bit confused as to which one to use.
Cost of goods sold should involve all the costs associated with the manufacturing and sale of products. It usually includes Raw material cost + other expenses.
Thoughts on \’Current Ratio\” and \’Quick/acid test ratio\’?
Gives a sense of liquidity.
Thanks
Good luck.
In that context, should we call the numerator in interest coverage ratio as EBIT or Operational Income?
Operational Income.
In interest coverage ratio, you have excluded other income. Is there any reason?
To figure if the company can generate enough profits from operations to pay for its interest obligation.
Should we include other income in EBIT?
You can.
Thanks for the prompt reply. I did really got that part. In the last chapter, for calculating ROCE,
we use EBIT as PAT+Tax+Finance cost. This means, we\’ve included other incomes as PAT includes other income.
In this chapter, while calculating interest coverage ratio we use EBIT , but here we calculate EBIT from EBITDA, which doesn\’t include the other income. This is where I\’m stuck.
when we calculate EBIT, the ine in last chapter includes other income and the one in this chapter doesn\’t.
As I have only covered till this chapter hopefully it\’ll get clear in the subsequent chapters as you have suggested
Hopefully, Rahul.
Karthik ji, first of all let me appreciate the effort you and your team has taken to curate this brilliant modules and making it available for free. I was able to lear a lot and still is.
Im here with a doubt. In yhe last chapter, we calculated EBITDA by removing othwr incomes. And in the end , calculated EBIT from PBT+ Finance costs , which includes other income.
Here in this chapter, we calculate EBIT = EBITDA -D&A. This automatically removes other income right?
Could please explain as to when we can deduct other income? In short, does EBIT has to include other income always?
I got the idea that EBIDTA is purely from operational point of view, but is confused with EBIT. Appreciate your reply
The logic is this Rahul – Other income is not core to business operations. It is an incidental income to the company. You can exclude it fully to get an estimate of how the operational efficiency of the company. So EBITDA will be Revenue – Other income – expenses.
The next module is on Financial modelling, hopefully, you will a lot more clarity on this.
Hi Karthik, Working capital going negative is not a good thing ? I have read before like if the working capital is negative then the suppliers are funding company to run the daily operation of a company to produce the goods.
Yes, its considered positive in few cases. You need to look at it from a holistic perspective and not just the working capital number in isolation.
I was trying to calculate the inventory turnover and interest coverage ratio for bharat forge however neither matches with what is shown on other sites. can you please explain the calculation for this.
Can you double-check that both you and the sites you are looking at are considering consolidated numbers?
is the EBIT caln in the document not double counting Dep& ammot.
in EBITDA – you have considered 5058.15 which is 5730-204-467 = 5058.
again when you calculate EBIT you consider EBITDA – Dep
EBITDA = 5828 – (5730-204-467)
EBIT = EBITDA – Dep i.e. (5828-(5730-204-467) – 204) so are we supposed to reduce dep again since it is already reduced once.
or am i understanding it incorrectly.
Please do check the query section, have discussed this.
Can you explain why was Change in Inventories not taken for the calculation of COGS
Have discussed in the comments of this and previous chapter, request you to kindly look through that. Thanks.
Hello sir,
When calculating debt to asset or debt to equity, I have seen multiple places that use Net Debt(Total Debt – Cash on hand) instead of just Total Debt.
Which is better one to use?
I guess net debt is better.
Dear Karthik Sir,
I am very happy that you have summarized a lot of topics into individual Modules and by going through them you brought a lot of people into their school or college days. The material here you are providing are very plain and easy to understand. I am learning a lot and thank you very much.
I want to bring to your notice that there is an error to calculate EBIT where from the part \”The Financial Ratio Analysis (part 2)\” under interest coverage ratio calculation. The formula mentioned is EBIT = EBITDA – D&A EXPENSE. Where to calculate EBITDA, there formula is EBITDA = Total Expenses – Financial cost – D&A Expense. The correct formula for EBIT must be EBIT = EBITDA + D&A Expense.
Correct me If I am wrong.
Thank you,
Raja
I\’m glad you liked the content Raja. Yes, that makes sense. I must have made an inadvertent error.
Hello Karthik,
I trust you are well.
I have a couple of questions.
What does a negative debt to equity ratio signify?
So I was looking at Alembic Ltd Financial Data, They currently have 0 long term borrowing, 0 short term borrowing.
It\’s debt to equity ratio is -ve 0.05.
How is this possible?
Marksans Pharma has 0 long term borrowing, 18 cr short term borrowing and has a Debt to Equity Ratio of -ve 0.18.
Could you please assist me
Not sure how this can turn -ve. Btw, I\’d suggest you ignore the short term debt for Debt to Equity ratio.
Hi,
In the first topic of this page, while calculating the EBIT, the depreciation & Amortization cost are removed twice from Expenses. Kindly check if this is correct.
Will do. Thanks for pointing.
Sir wherever will I check production details
In the annual report.
Sir while calculating one company I got fixed asset turnover of 3.97
What does 3.97 means
It is the same as the asset turnover ratio right?
The content below the line copied from above document, while calculating EBITDA we have exclude Depreciation & Amortization cost but again while calculating EBIT we are deducting Depreciation & Amortization cost.
EBIT = EBITDA – [Depreciation & Amortization]
——
We know EBITDA = [Revenue – Expenses]
To calculate the expenses, we exclude the Finance cost (Rs.467.64Crs) and Depreciation & Amortization cost (Rs.204.54) from the total expenses of Rs.5730.34 Crs.
Therefore EBITDA = Rs.5828.13 – 5058.15 Crs
EBITDA = Rs. 769.98 Crs
We know EBIT = EBITDA – [Depreciation & Amortization]
Receivable means that the company is selling products on credits and is yet to receive the payment.
So a company with high revenue and low receivables means the company does most of its sales on cash. So a high revenue and a low receivable is a good sign.
Then how can accounts receivable ratio measure how many times a year the company receives cash ? Because operating revenue is not all receivables and if it is then it is not a good sign.
Neel, like any other financial ratio, you need to exercise due diligence before using it. If you know that the receivable is low and sales are high, then it is clear that the company has a high cash sales business. In such a scenario, ARR gives your very little information.
Sir i got debt to asset ratio has 0.047 what does it mean
Sir debt to equity I got 0.068 while company does not have any long term borrowing and short term it as 55.92 crs with equity of 813.54,I got 0.068
My thought process is 1:0.068 is debt to equity ratio
Is it correct, by the way am I going right
This implies that the company is not leveregd.
Sir I was calculating IOL CP, interest coverage ratio I got 1.150x for every rupee of interest payment due IOL is generating a EBIT of 1.150 time, is it a good sign
Yup.
Sir in Debt to asset ratio 0.449 how we got 45%
Let me check that again.
thank you so much for such elaborate explanation. you are doing a great job sir. every topic is so finely churned and things which are necessary while evaluating balance sheet and P&L only that has been put here. thank you once again sir. RESPECT.
Happy reading, Harshit!
valuable lessons
Cool.
Sir, do you source these ratios from any external provider like moneycontrol, etc while making any investment decision and how much reliability can we place on such platforms ?
or do you carry out the calculation personally on Excel ? What will you recommend ?
Prefer to run my own calculations on excel.
Why company promoter pledge shares, insted of raising debt from Bank?
If it\’s a short term requirement, then the promoter may as well pledge. Faster and easier.
hi sir, thank you for the article.
my query: why use only selective expenses for calculating \” Cost of Goods Sold \”. can i use the overall expenses rather than using selective expenses? Please advice. Thanks.
We pretty much use everything under expenses right?
Days Sales Outstanding
Quicker/faster the cash is collected from the creditors, faster the cash can be used for other activities.
Here mention creditors
actually creditor or debtor?
i think debtor is correct.
These are actually ppl who use the company\’s inventory, like the distributors. Most of these guys operate on credit, hence creditors.
Hi Karthik, I\’m following the same formulas and calculating ratio for Amara Raja Batteries Ltd 2020 annual report. i calculated ratios for 2019,2020 based on AR data and i rechecked it with moneycontrol values. while for 2019 values are almost same. But for 2020 values differ by greater magnitude. mainly ratios related to assets. might be because of change in auditing system. How to modify formulae according to new system?
The formulas dont change, they remain the same. Are you sure MC and you are both using consolidated numbers?
Sir, any platform through which we can calculate these ratios easily?
There are few sites which gives out this info. Check screener.in or Tijori finance.
Sir, higher the financial leverage ratio, higher the leverage. It may also mean that the company is holding more assets and the equity and debt both are low. Can we think through this perspective?
Higher leverage means more debt. If assets are more then probably it implies that the assets are financed by debt and not equity.
Okay i got this, EBITDA= Operating revenue- operating expenses, so Operating expenses= Total Expenses- D&A- Finance Cost.
Then EBIT= EBITDA- D&A.
Correct?
Yup, thats correct.
Sir in interest coverage ratio while calculating the EBITDA(Revenue- expenses) why did you deduct D&A and Finance Cost, and again you deducted D&A from EBITDA to calculate EBIT.
D&A should be subtracted twice to calculate EBIT?
1) is debt to asset and debt to capital ratio same ?
2) if no whats the difference between them ?
3) why sites like moneycontrol etc dont show debt to capital ratio ?
4) is debt to capital ratio imp or we can get our work done through debt to asset ratio.
very much confused sir
hoping for ur answer
thank u sir
1) No, assets are different from capital. So they are different.
2) Assets are fixed assets of a company like building, land etc. Capital refers to the share capital
3) I\’m not sure, but I think it should be there, these are basic details
4) Both serve different purposes. Do check both, no harm with it.
Hi Karthik, Could you please explain why we are not considering labour cost, Depreciation and Amortization etc. for calculating Cost of goods sold.
Cost of goods sold is material cost, D&A are accounting entries and does not add up when calculating the actual cost.
Thank you Sir…
Good afternoon sir, In the valuation ratio topic under P/E ratio, you have mentioned that one should be aware that the company does not changes its accounting policy too often which might potentially manipulate the earnings and thereby the P/E ratio. Can you shed some light on what are some common accounting policies and how it impacts the company\’s earnings? If possible can you explain with an example?
Sahil, that point is actually not so valid anymore as companies are mandated to follow the standard Indian accounting policies.
Thank you so much sir, I mean for everything and the way you have explained the Fundamental analysis is something that people like me from Non commerce background can inherently connect with, your team\’s prompt replies on different queries is indeed applaudable.
Thanks, Sahil. Happy reading 🙂
Hello Sir, can you suggest any web portal that gives one, a close to accurate data for financial ratios? I\’ve heard many analysts suggesting screener.in. What is your opinion? Thank you
Yes, that is a good portal. You can also look into Tijori finance.
So my basic question is that if we are calculating Debt to Equity ratio, rather than only considering \”borrowings\” ( Long and Short term) can we say that \” financial obligations (as stated in liabilities) in long and short term needs to be summed\”?
No, liabilities also contains other things, like the reserves and surplus of the company. You can\’t generalise this. Consider just the borrowings.
So should we consider trade receivables and other dues (of Micro and small enterprises) to the company in our current debt?
Nope, short term and long term borrowing only.
While calculating Debt to Equity ratio, why do we consider only short & long term borrowing and not the entire liabilities ( Current and non current)? Because Investopedia shows that all the liabilities should be added, Please clarify…
Because the entire liabilities has other things besides debt. You don\’t want to consider all that, right?
I never seem to understand what is face value. Will you please elaborate it? Thanks 🙂
It is a nominal value assigned to a share at time of creating the shares. FV is used to calculate all corporate actions.
Hello
I didn\’t quite understand the difference between calculating EBITDA…why do we not include other income? Same is the case when calculating EBT…but PAT or PBT includes other income. Why is there a difference?
In my opinion, EBITDA should reflect operating margins, hence its best to consider only the operating income.
hie, i had a small question here
to calculate the debt to come out with the debt to equity ratio and debt to asset ratio, do we need to take all liabilities for the debt or only the short term and long term borrowings?
and what if there is a possibility of some company not having either of the one ( short term borrowing OR long term borrowing ) then how to we calculate the debt ?
Longe term debt is what you need. Then in that case, debt ratios are not applicable.
Also this is nowhere related to this topic but,
Where can I find total derivative turnover and Cash segment turnover daily?
In an article somewhere it mentioned one should keep track of this record in order to prevent from entering into fake bull trend
You can check for this information on NSE website, start from here – https://www.nseindia.com/all-reports
Hi,
Can you please explain whats the difference between Debt / Asset ratio and Financial leverage ratio?
Since both of them state how much asset is bought through debt OR am I missing something?
I was analyzing dabur
I)Non-Current Liabilities
a) Financial liabilities
(i) Borrowings 26.05
(ii) Other financial liabilities4.56
b) Provisions 59.52
c) Deferred tax liabilities 23.14
ii)Current Liabilities
a) Financial liabilities
(i) Borrowings498.23
(ii) Trade payables
Due to micro and small enterprises 54.61 Due to others1,400.82
(iii) Other financial liabilities 327.62
b) Other current liabilities 198.14
c) Provisions130.24
d) Current tax liabilities 50.65
FINANCE COST 59.58
Iam getting Cost of debt / interest rate.
for dcf calcuation is
=59.58/26.05=228.71%
Is this right ?
I think there is something wrong with this. Finance cost cannot be more than the borrowing itself.
So it is better to be less
You need to compare this with the industry average to conclude if its good or bad.
This means JSIL supports Rs.3.68 units of assets for every unit of equity. Do remember higher the number, higher is the company’s leverage.
Can u plz explain little bit more??
Jsil supports 3.6 units of assets for every unit of equity means??
Means there for every 1 Rupee of Equity, there are assets worth 3.6. This means the 2.6 units of assets are bought using borrowed funds, which is basically leverage.
But in your example
you have considered both current and non current borrowings
I\’ll check the example and get back.
Correction
CURRENT LIABILITIES
(a) Financial liabilities 3,617.72
(i) Borrowings
(ii) Trade payables
(a) Total outstanding dues of micro and small enterprises 126.96
(b) Total outstanding dues of creditors other than micro and small enterprises 10,281.87
(iii) Acceptances 3,093.28
(iv) Other financial liabilities 2,237.98
What should be the recommended Financial ratio number?
No standard numbers really depend on the industry.
As you said in leverage ratio to compare on your own.
I was analyzing Tata Motors
They have in liabilities side
NON-CURRENT LIABILITIES
(a) Financial liabilities
(i) Borrowings 13,919.81
(ii) Other financial liabilities 180.80
CURRENT LIABILITIES
(a) Financial liabilities
(i) Borrowings 3,617.72
(ii) Trade payables
(a) Total outstanding dues of micro and small enterprises 126.96
(b) Total outstanding dues of creditors other than micro and small enterprises 10,281.87
(iii) Acceptances 3,093.28
(iv) Other financial liabilities 2,237.98
So while Calculating Debt to Equity Ratio, do I have to only consider Borrowings or all of this?
You will have to consider the borrowings under the non-current liability.
Hi Karthik,
Just to confirm while calculating operating expenses we would just deduct finance costs from Operating expenses to calculate EBIDTA. D&A will be deducted while calculating EBIT .i.e. EBIDTA – D&A.
Please advice
Thanks,
Yup, that\’s right.
Hi Karthik,
I was confused with EBIT as we are deducting D&A twice from it, Once from EBITDA and then again in EBIT. Should we add it back to EBIT to calculate it correctly.
Please advice.
We should deduct it only once i.e. while calculating EBIT.
Can you help me in finding cogs of tata motors of 2019.As they have not mentioned any associated notes regarding it.
Look for the expense right below the revenue in P&L, you will get it.
Should work in process and raw material and components ,should be added in finding COGS.I\’m so confused in calculation of cogs. could you ellaborate me the concept .
The easiest way is to consider all expenses listed in the expenses part of P&L, consider all of it except D&A, as D&A is an accounting expense.
I was working on the Working capital turnover ratio for Godrej Industries for 2019 and 2018. Their WC is negative as their CL>CA. What to do in this case. Please advice.
-Ve WC is a common thing. It can mean both good and bad, you really have to look at it from the company\’s business perspective. The more you understand the business, the better you will figure this out.
Okay. I checked and it says
\”Material cost includes cost of material consumed, purchase of stock-in trade, and changes in inventories.\”
Any reason why you didn\’t take it?
Need to review it myself, but if it is stated, you need to consider.
Hi Sir,
Can you please tell me why \”Changes in inventories\” is not considered in COGS calculation?
If it is already included in Cost of material consumed, how to verify it?
Usually, the associated notes should give you this split up.
Hi Sir,
About your above reply regarding the inventory turnover ratio, i would like to disagree that balance sheet inventory relates to only finished goods.
If we refer to the inventory note no 14 then we see that out of 335cr inventory , FG is 94cr and stock for trade is 7.4cr whereas RM is about 94.7cr and WIP is 105cr.
Hence i wanted to get clarification as to which set of numbers to use here ?
Thanks
Ah, the associated notes have the split up. I could be wrong here. Perhaps you should double-check with a few other balance sheets and see the inventory treatment.
Hi Sir,
While explaining the Inventory T/o ratio you mentioned that it means the turnover of the \”Finished goods\” in the inventory.
But while doing the calculation, you have taken into consideration the overall inventory which would include RM, WIP, FG and some spares as well.
What does an analyst really do in this case ?
Thank you.
The inventory mentioned in the Balance sheet implies that its the finished goods, available for sale.
Hi Sir,
If Debt to Asset Ratio is 45% meaning 55% of the assets are financed by equity.
How is it different from Financial Leverage Ratio ? Wont both ratios mean the same ?
Please explain.
Yeah, they are similar in the sense that Debt to asset is one of the financial leverage ratios.
sir,
the formula you mentioned to calculate Cost of Goods Sold = Cost of materials consumed + Purchase of stock in
trade + Stores & spares consumed + Power & Fuel
but in other sources the formula is completely different,
COGS = Beginning Inventory + Purchases during the period − Ending Inventory
which one is correct?
I\’m not sure about the other formula, Kumar. It somehow does not make sense for me.
Hi Karthik,
Thank you very much for the content that you have provided. I had a query:
\’Cost of materials consumed\’ = Cost of material used for production during the year right? This however does not reflect the cost of goods SOLD during the year. In my understanding, that is adjusted using \’changes in inventories of finished goods work-in-progress and stock-in-trade\’ to match the current year revenue with the cost. I am not understanding why we do not make the same adjustment to arrive at our COGS figure.
In my opinion the COGS that we have calculated is only reflecting the cost of production and purchase and not the cost of goods that the company has sold.
Again, cannot thank you enough for the well structured and super simple course that you have designed.
Best Regards,
Rushabh Modi
Cost of materials consumed = Raw material used
Cost of goods sold = Includes other expenses (check the notes)
Hello Sir,
While Calculating the Interest Coverage Ratio we have deducted Depreciation & Amortization Twice. i.e Initially while calculating EBITDA and again while calculating EBIT. Sir, Could you please explain why we need to deduct twice.
Is it? I need to check this, Kumar. But Int Coverage is simply the ratio of net profits over the applicable finance charges.
hello sir,
Is there anyother formula to calculate Inventory Turnover Ratio? because I find different formula in books
Hmm, not that I know off.
Sir,thanks for the great knowledge sharing.i have a doubt……in interest coverage ratio if we use earnings after tax instead of earning before tax…..it would give more sense isn\’t it sir?…..but why do many ratios involves earnings before tax?
The idea is to figure how many times the earning wrt to interest liability. Hence its better to take earnings after tax.
Thanks sir…
Welcome!
Thanks, I want to calculate
1. How much company retain from profit
I have one concern it\’s ok to have high profit but if company is not able to retain profit as it has to high expenditure in Repair and maintenance and replenishing old machinery
How to calculate
1) The retained earnings go to the reserves. The change in reserves from this year to the previous one should indicate the net profit for the year.
The situation you are talking about is quite common with asset-heavy companies. No ready ratios as such, but you will have to derive this from P&L, Balance Sheet, and cash flow statements.
Hello sir, which ratio is used to calculate
Repair and maintenance expenses per year relative to earning per year.
No ration as such, but you can divide this and get a historical trend for this particular ratio.
Okay and how about the finance cost? why is it not counted aswell?
Hi Karthik,
Under interest coverage ratio, u have mentioned,
\”To calculate the expenses, we exclude the Finance cost (Rs.467.64Crs) and Depreciation & Amortization cost (Rs.204.54) from the total expenses of Rs.5730.34 Crs.\”
So here, why are excluding the finance cost and Depreciation & Amortization cost when they both are mentioned under the \”Expenses\” part?????
We do this to get a sense of the operating expense. Remember, D&A is just an accounting adjustment and not a real expense.
hello sir,
I want to say thank you for sharing knowledge in such a simple way and my query is regarding \”working capital turnover ratio\”
1). sir if any stock have negative working capita then we should consider this negative sign value while calculating ratio?
2). if we shouldn\’t consider -ve sign and get good value then what we can conclude about the stock?
1) -ve working capital is not necessarily bad. Cross-check with the inventory and sales number to see if the sales are improving (ideally should be trending up)
2) Like I said, you can consider -ve WC, but you need to validate other parameters
While calculating interest coverage you first subtracted D&A charges from ecpenses. Then after finding the EBIT you again subtracted D&A charges to find EBITDA. But it will be equally good if you don\’t subtract D&A charges in the first place. The sum will be same and you can save a step
Have I done that? Let me recheck, thanks for pointing out.
Sir
First of all thanks for such excellent work.
I want to know why trade payables are not included in debt?…..Wont total debt will be equal to total liabilities?
Trade payable is a current item and is expected to get settled within a year. Whereas debt (long term debt) gets settled over the years, hence they are two different line items.
Sir give me correct suggestion your cost of goods sold is calculations correct or wrong the common formula is cogs = opening inventory +purchase during year-closing inventory your formula is different your formula correct or wrong sir?
JK, check this – https://www.caclubindia.com/forum/cost-of-goods-sold-41073.asp
Sir correct answer cost of goods sold solutions tell me sir
I\’m sorry, I must have missed your query, can you please post it again? Thanks.
Good morning sir…
A) What is the differnce between DEBT/EQUITY and TOTAL/DEBT to equity (it is mentioned in ratestar).
Sir when i calculate for emami paper mills my calculation is coming 2.12 but in ratestar and MC its 5.12
B) how to calculate long term Debt/equity ?
1) Not sure, but maybe in total debt they may consider even the current liabilities. YOu maybe taking standalone numbers
2) Exclude current liabilities from the formula
Hey Karthik,
Are ROA (Return on Asset) and Total Assets Turnover ratios the same?
It differs. ROA has net profits in the numerator, which TAT has net sales. ROA measures on an overall profitability basis, while TAT measures on the churn or the sales.
Hi Karthik,
As the formula for EBITDA is [Operating revenue- Operating expenses]
and Operating expenses is [Total expense-Finance cost-Depreciation and amortization]
then EBIT should be EBIT+Depreciation and amortization as we have already subtracted Depreciation and amortization from Total expenses
Please correct me if I am wrong.
Thats right, Ram. We have discussed this in the comments above.
Hi Sir,
Could you please to the below Question:
Stock:Zee Entertainment Enterprises Limited Fully Paid Ord. Shrs
Annual Report :2017-18
Expenses: Section Contains below elements:
Operational cost
Employee benefits expense
Finance costs
Depreciation and amortisation expense
Fair value loss on financial instruments at fair value through profit and loss
Other expenses
Total expenses
Then What we can consider for Cost of Goods Sold in this case? Generally we take Cost of Goods Sold = Cost of materials consumed + Purchase of stock in trade + Stores & spares consumed + Power & Fuel .
Can you please let me know which one should i consider for Cost Of Good Sold in Case of ZEE Entertainment.
Thanks in Advance.
You will have to consider the \’Operational Cost\’, this includes the COGS.
Thank You Sir
Welcome!
Should Excise duty be included in tax?
Nope.
Hello sir ! I have a questions regarding debt to equity ratio. While taking long term and short term debt why you have not included other long term liabilities and other current liabilities. While analysing other company I saw that term loan and vehicle loan was included in other current liablities. How should we approach that ? We should include this in total debt or not ?
Thanks for all the knowlege the content is amazing. Kudos to zerodha.
Current liabilities are short-term in nature. For other liabilities, you need to inspect from the notes to see what\’s included before considering it as a part of the debt to equity ratio.
Hello,
For Calculating EBIT formula is :- EBITDA – Depreciation & Amortization. And to calculate EBITDA formula is :- [Revenue(Total Income – other Income) – Expense( Total expense-finance cost – dep & Amrtz Cost)]
So my question is while calculating EBIT we have minus Depreciation and amortization twice. So, what is the logic behind, ?
No, its not deducting twice. EBITDA is the total operating revenue minus operating expenses. D&A, as you know is an accounting entry. In EBIT, we deduct D&A from EBITDA.
Karthik,
The way I understand EBITDA is earnings before interest tax depreciation and amortization. Formulas are supposed to be math representation of definitions. Correct? That said, EBIT should be earnings before interest and tax. It doesn\’t make sense to subtract DA from EBITDA and by definition should we be adding DA, instead?
Formulas are supposed to be math representation of definitions. Correct? —- > This is a personal take Hari. Over the years, I have started treating EBITDA as a representation of Operating Profits. In the sense, I prefer to exclude other income from the revenue and deduct operating expenses from the revenues to help me understand the operating profitability. I keep aside D&A from this. This according to me is EBITDA.
I subtract D&A from EBITDA to give me EBIT.
So in a sense, I rearrange the P&L. I guess we are on the same page here right?
Karthik, I do agree the whole idea of EBITDA is to capture operating profitability. Like the original poster\’s query I\’m also not getting the logic why do we have to deduct D&A again if we have already put aside D&A (excluded/deducted to get our operating profits)?
As cited in this chapter, say, the operating profit/income is Rs 400 and debt is Rs 100 wouldn\’t this already convey the company has sufficient funds to service its debt? I guess we are both on the same page that EBITDA represent operating profit/income (not to mention we kept aside amount from operating revenue to cover our D&A) and why can\’t we simply use the EBITDA then. Unless we want to double ensure (deduct again DA) that company had sufficient funds to service its debts 🙂
I\’m a bit confused with your comment, Hari. Maybe I need to re-read what\’ve written to plug the gap 🙂
Btw, considering that D&A is an accounting value, it can be excluded from expenses and deducted later to get EBIT.
Hi Hari,
Earnings = Revenue – Expenses
EBIT = Revenue – (Total Expense – Interest(Financial Cost)), you can also tell this statement EBIT = Revenue – Total Expense + Financial Cost
EBITDA = Revenue – (TotalExpense – Financial Cost – DA) = Revenue – TotalExpense + Financial Cost + DA
Now, if u derive EBIT from EBITDA
EBIT = EBITDA – DA
Even i got confused, i am more comfortable calculating EBIT from balance sheet than EBITDA. Math is always fun!!! 🙂
Thanks for pitching in, Gowtham.
Hi Sir,
As u mentioned the ratios which ever we calculate should be compared with the peers of the sector. Can you please suggest in which website we can find out the particular industry sectors PE, PB, Div yield etc.. so that it would be helpful to compare the ratios with peers and also in sector wise PE,PB etc..
Thank you,
Sandesh, we recently started Stockreport+, this has relative valuations – https://zerodha.com/z-connect/zerodha/bulletin-latest-at-zerodha/introducing-stockreport-by-tr
Thank you sir, will go through it.
Good luck, Sandesh.
Karthik, I think that the EBITDA in intrest coverage ratio will be 7699.8 instead of 769.8
oops sorry my bad i didnt pay attention to the decimal point
Got it.
Hi Sir,
I was trying to calculate the interest coverage of Infosys along with you. But their profit and loss statement doesn\’t mention the finance cost. What can we do if a company doesn\’t mention this number.
That\’s because Infy does not have any debt, hence finance charge is zero.
sir,
what should be the ideal interest coverage ratio for a good company.
There is nothing like an ideal ratio, however, I\’d be comfortable if the company earns at least 3-5 times the interest obligation.
Hello Karthik Sir I have doubt regarding Inventory turnover ratio.
Doesn\’t the size of inventory also not important while comparing inventory turnover ratio of 2 companies?
Because if one company\’s inventory size is small then it will sell of items in inventory more quickly.
Absolutely, not just the size that you also need to pay attention to the sales. Raising inventory plus swift sales is a great combination.
Hey Karthik,
First of all my compliments for the amazing hard work you have put into creating this piece of work. Its really helpful for beginners like to me to get all info at one place.
I have a question, I was analysing balance sheet of Dominos for study purpose and found that it has -ve working capital and surprisingly no/minimal debt, I understand thats because company buys on credit and sells on cash. But how does such a company pay its trade payables, couldnt find any relevant entry in cash flow stmt, also their profit is much lower than the trade payables.
I am looking at FY17 Annual Report.
Regds,
Anshul
Thanks for the kind words, Anshul!
With respect to working capital, check this –
1) Low receivables
2) Low inventory
3) Higher payables
If the WC is -ve with the above things panning out, then its a desirable situation. Higher payables mean the vendors supplying to the company have very little bargaining power and also the customers have low bargaining power. Regardless of +ve/-ve WC, the WC should be stable and consistent.
Thanks Karthik, trying to be specific, what I am trying to understand looking at the financial stmts is that how is the company honouring its trade payables, they mention in Annual Report that payments to suppliers are made every 30-60 days but unable to find how this is getting reflected in the stmts, for eg – Jubilant has 311 Cr as trade payables for FY17 but the profit is 67 Cr so how will they pay their trade payables in next 1 yr. Also there is no mention of outflow related to trade payables in cash flow stmt and the cash with company at end of the FY is mere 32 Cr. Would it be asking too much to request you to have a quick peek into the financials and guide me on this mystery.
Second unrelated question is on ROE, is it possible or does it makes sense to calculate ROE at end of each quarter. Since companies don\’t post balance sheet\’s quarterly (hence don\’t have latest equity figure) so not sure how to calculate it.
Trade payable is a current liability, meaning it will be settled within the year. Look at the revenues, I suspect their revenues should cover the payables. Profit is whats left after all the current obligations, so is cash. To service payables, the sales or revenue should be strong. Look at these revenue numbers on the quarterly statement as well.
No, I\’d suggest you look at ROE at the end of the year or maybe the end of 6 months.
Hello,
I have doubt regarding Debt/Equity Ratio. Example – For Company Yes Bank (year 2013-2014), Total debt = 21,314.29 and Share holders funds = 7,121.74. So,
D/E = 21,314.29/7,121.74
= 2.99
But, I have found this number different on different website . For example – The D/E ratio on this website https://bit.ly/2MOK3cP for year 2013-14 is 0.06. Which one is correct and how did they arrived at result 0.06?
—
Thanks
Aparna, as I have mentioned, the computation of ratios are a little different for banks. I maybe not the right person to explain this.
Hello Karthik ,
Okay. Actually I did not got straight answer for this question from anyone.
—
Thanks
Hi Karthik,
First of all thank you for such amazing content. Much appreciated 🙂
1) What is your opinion on calculating financial metrics on my own vs leveraging metrics available on finance websites like monecontrol/morningstar ?
2) Can you recommend any websites which I can trust with financial ratio calculations ? My major concerns are data being skewed by influential malpracticing businesses or calculation errors in data.
1) I\’d always prefer to calculate this on my own as opposed to relying upon 3rd part sources. Having said so, I end up using few 3rd party sources at times.
2) Smallcase Screener or screener.in are two decent places to check the numbers.
Greetings,
In debt to asset ratio. The balance sheet shows Rs. 82,044.47, but in calculation 8204.447 is used ?
Why is this?
Converted to Rs.Crores.
I am not in hurry! Take your time.
Cheers!
Hi Karthik! I just did an analysis of the leveraged ratio of ARBL 2014 and I am not sure whether these are correct or not. Ratios are as follows: Interest Coverage Ratio – 690.470752089 {I DOUBT THAT} Debt to equity – 0.061884 – Debt to Asset -0.039417
Financial Leverage ratio – 1.766297422
For interest Coverage Ratio I calculated as follows –
(((Net operating revenue)-(Total Expense-Finance Cost-Depreciation))-(Depreciation))/(Finance Cost) and when we put numbers
(((34,366.59)-( 29,416.19- 645.71- 7.18))-(645.71))/(7.18) and I get 690.470752089
With the Same formula if I do with Jain irrigation numbers I get the correct answer.
(((58281.31)-(-57303.49-4676.45-2045.40))-(2045.40))/(4676.45) = 1.209095
Help me out Karthik.
Proof of my Calculation for Arbl – https://www.cymath.com/answer?q=(((34%2C366.59)-(%2029%2C416.19-%207.18-645.71%20))-(645.71%20))%2F7.18
for Jain irrigation – https://www.cymath.com/answer?q=(((58281.31)-(57303.49-4676.45-2045.40))-(2045.40))%2F(4676.45)
Adishwar, I think 690 is not correct. If I remember right, ARBL\’s PAT is ard 175Cr and Interest payout is about 1.5Cr. So ICR is roughly 140x. Btw, Finance cost is not 7.18, please double check that.
Its 7.18 million. All figures in arbl analysis have been taken in lakh. My Pat margin ratio and ebitda margin ratio are same as yours its only interest coverage ratio which is coming different. I have calculated for jain irrigation and it\’s correct.
Can you double check on Screener.in once? Thanks.
In screener.in Interest is showing 0.72CR. While seeing ARBL annual report Finance cost in million is 7.18 million. So if convert Screener.in finance cost into million it is 7.2 million. Finance cost in annual report and screener.in are pretty close. Also, I just checked interest coverage ratio in Edelweiss website it\’s showing around 140X on the standalone basis. what am I doing wrong? I have also gone through the comments and no one posted the Leveraged analysis of ARBL.
I think screener reports in Crs right? Can you please double check?
Yes they report in Crs.
Hmmm, need to check the numbers again. Can you please post the PAT and Fincnace cost numbers in Crores here again? Thanks.
Here you go!
As per the annual report of ARBL (in crores)
Net revenue from operations = 3436.659 crore
Finance costs = 0.718 crore
Depreciation and amortisation expense = 64.571 crore
As per Screener.in (in crs)
Net revenue from operations = 556.43
Finance costs = 0.72
Depreciation and amortisation expense = 64.57
Net revenue from operation is probably wrong in the screener.in
Do you need Profit after Tax numbers?
Total expense (From annual report) = 2941.619 crore
Which financial year is this?
Will look through, thanks for sharing.
2014, the same year which you have used in Fundamental analysis Module.
No problem! You have helped me a lot in learning new things. ☺️
Let me check, Adishwar. Just swamped with too many things at work 🙂
Hi. There\’s one question I had; when some companies are referred to as zero debt, does that mean they issue no preference share either, for preference share are in reality a debt and not equity? For personal research and analysis, how do we find out the amount of preference share capital a company has, do companies put it all under the equity heading or under debt/liabilities? Thanks.
Yes, I\’d suggest you look at the notes under the share capital section of the annual report.
Sir,
In Interest Coverage Ratio why we have subtracted Depreciation & Amortization cost (Rs.204.54) two times from total expenses. Please clarify
No, we have excluded the D&A from the expense and then deducted the D&A.
Sir u have mention,
EBITDA = Rs 5828.13 – 5058.13 =769.98 cr sir in this 5058.13 this figure is come from subtracting fiance cost 467.64 crs and D&A 204.54 from total expense (5730.349-467.64-204.54=5058.15
Now EBIT =EBITDA – D&A
=769.98 – 204.54=565.44
So we are subtracting D&A value 204.54 two times …..
Ah, Pravin…you may have a point. Let me check this again. But you only have to deduct it once 🙂
Financial leverage ratio (=Avg total asset/Avg total equity) of JSIL is 3.68 as per your presentation above.
Company with Higher financial leverage ratio is a good place to invest, right?
Since the company is able to produce more asset for a given equity, I guess higher this number, investors can invest more.
Your statement as above \”This means JSIL supports Rs.3.68 units of assets for every unit of equity. Do remember higher the number, higher is the company’s leverage and the more careful the investor needs to be.\” is quite misleading.
Hmm, let me again look into this, Vivek. I guess you are right. I need to change the wordings.
Sir, Please clarify if I am right
Is it like we should first check the costs associated with inventory in the Balance sheet to include the corresponding costs in COGS when we are calculating the inventory turnover ratio?
Above mentioned formula is
Cost of Goods Sold = Cost of materials consumed + Purchase of stock in trade + Stores & spares consumed + Power & Fuel
So all of these costs should go into inventory line item in balance sheet
No, all these details are available in the balance sheet itself, under the expenses section. No need to look at the inventory data.
I have a query regarding Debt to asset ratio & financial leverage ratio. So if debt to asset ratio is 0.17, it means that company is creating Re. 1 asset by using only external debt worth 17 paise. The rest 73 paise comes from shareholder\’s fund which is great (as it shows that the company is relying less on external debt). Again, in financial leverage ratio(total average asset/shareholder\’s fund), you mentioned that if its high, then investors need to be alert about it. But if a company is using less of external debt, it will have to use more of shareholder\’s fund to create the same asset. So, this ratio would be high. So, if the first ratio is .17, then for the same company I get a financial leverage ratio of 1.74.
So, isnt your comment contradictory?
I hope I have been able to pen down my query clearly. Kindly throw some light on it.
Regards
I get your point, Neena. If the debt is low, and the company owns a lot of assets (like say MRF), then the Avg Assets/Avg Equity will be high (like you pointed out). Its best you take this on a case to case basis. End of the day, you need to evaluate – how much assets the company owns, how are they financing these assets, and how effectively they are using these assets to generate revenue. Its best if the company can manage to do this very less external money.
in debt to equity ratio as mentioned
Total debt = Long term borrowings + Short term borrowings
= 1497.663 + 2188.915
= Rs.3686.578Crs
but in balance sheet its showing
759.47 and 83.83 … how come both have 2 different figures……
i think it should be 759.47 + 83.83 because in – chapter 15 – equity research part 2 – while calculating NET DEBT , you took
CURRENT YEAR TOTAL DEBT AS 75.94 which is again a Long Term Borrowing which should be 843.3 or …… we only need to consider long term borrowing for calculating net debt.
please explain.
Let me check the numbers again, Uday.
Sir, I have one question.. Please make it clear..
When we going to calculate EBITDA why don\’t you include the \’other income\’ of the company ? Please explain..
Thank you..
Ideally, EBITDA should report operational efficiency, for which we need operational income. Other income is not from operations. Hence we ignore it.
COGS(cost involved in producing goods) is =2449.74
Average Inventory is= 313.92
-If avg inventory is 313.92 where does the inventory of worth 2135.82 (2449.74-313.92) is gone,
-why inventory is shown of 313.92 instead of 2449.74, while inventory should be equal to Cost involved in producing inventories.
COGS is raw material cost….you consume this to produce products. Inventory represents part of finished goods which are not yet converted to cash (revenue). Whatever has been converted to cash is shown as revenues.
Hello,
Can you please demonstrate how to find out credit sales and credit purchase from the annual report of a company to calculate debtors and creditors turnover ratios,
Thank-you
This is usually reflected in the trade payable and trade receivable part in the balance sheet.
Financial Leverage Ratio – \”Do remember higher the number, higher is the company’s leverage and the more careful the investor needs to be.\” That\’s what your comment is. But, higher this number, the safer the company is. If more assets are fund by equity, less debt is required. Also, it shows shareholders trust the company and so put more money into it.
Equity is not leverage, Anand. Debt is. I was referring to the debt bit here.
Sorry, my bad. I got confused there.
BTW nice presentation. Easy to understand.
Happy learning!
Hi Karthik,
You said EBIT is EBITDA – Depreciation & Amortization,
Shouldn\’t it be EBITDA + Depreciation & Amortization?
O wait. You are right!!
Cheers!
No, D&A falls under expenses, hence you deduct it.
I think you typed the mistake in Account receivables turnover ratio . You typed this
Trade Receivable for the FY13 : Rs.380.67 Crs
Trade Receivable for the FY14 : Rs. 452.78 Crs
Average Receivable for the FY13 : Rs.416.72
For calculating acc. receviables ratio FY14=(Oper Revenue FY 14)/(Avg receivables FY14) right .But you typed Avg. Receivables for FY13
Thanks for pointing this out, let me check through this.
\’\’Interest coverage ratio of 1.209x suggests that for every Rupee of interest payment due, Jain Irrigation Limited is generating an EBIT of 1.209 times\’\’
Does it mean for each rs(1 rs) of interset payment due company is generating 1.209% of Rs 1?
It means for 1/- interest, they are generating Rs.2 in revenue.
Why do we divide interest(finance cost) from the EBIT?
&
Why to subtract Dep&Amortization double time in interest coverage ratio?
Have you read through this chapter?
Hi Karthik,
First of all I would like thank you for these wonderful modules. I am using Jamna Auto Industries AR 2016 to calculate all of the ratios. So far the results were very good. However, the working capital of Jamna Auto Industries is -negative 51 cr. So I am unable to calculate the Working Capital Turnover Ratio.
What does this -negative working capital exactly convey and how much difference can it make as compare to other ratios. The results of Jamna Auto for all the ratios till now were excellent except for the working capital.
Thank you.
WC is defined as CA-CL. It turns negative when CL is a larger number than CA. Now, CL also includes payable. Now imagine, if your products are so good, than your customers have paid you in advance to get the finished goods. In this case customer advances will be treated as payables. This will lead to a -ve working capital. So you need to clearly look into why WC is -ve.
Thanks for the reply :)..Yes WC is negative due to High Trade Paybles.
In that case you should consider it as a positive.
Hello,
With respect to Working Capital Turnover ratio can I look at Number of Days In Working Capital in money control and use this? Will this give almost the same type of information right?
I\’d suggest you use screener.in or ratestar.in instead of MC.
Hello,
In your debt to asset ratio example on Jain Irrigation Systems you have told total debt is Rs.3686.578Crs which is right. But you have told total assets as Rs.8204.447 Crs, which I am not seeing in March 2014 balance sheet. Is that your typo? I am seeing a total asset of 5,882.60Crs in march 2014.
I am trying to get all these ratios from Money control itself. Can you tell me if I can directly see debt to asset ratio in money control ?
I\’m not too sure if MC is the right source. Please refer to the annual report directly.
Hi Karthik,
Working capital for Maruri Suzuki is coming negative for FY\’16 and FY\’15, hence the capital turnover ratio is coming to -14.451, i have taken figures from https://marutistoragenew.blob.core.windows.net/msilintiwebpdf/Consolidated_BalanceSheet.pdf, is it possible ?
Regards,
MSP
Yes, -ve working capital is possible and in some case desirable. Common reason is when the company receives money as advance from its clients (or vendors) towards the company\’s products , then this reflects in the current liabilities, and therefore it leads to a -ve working capital.
Hello Karthik sir
Higher the interest coverage ratio good or not and how much the interest coverage ratio should be for a better company?
Thanks
Generally an ICR of over 3 is desirable. Between 1.5 to 3 is alright…and below 1.5 is something I\’d not be comfortable with.
Thank-you
Welcome!
Hello,
EBITDA calculated through [Total Revenue – Other Income] – [Total Expense – Finance Cost – Depreciation & Amortization] in last page yields a different result – 560 crs whereas EBIDTA calculated in interest coverage ratio yields EBITDA = [Revenue – Expenses] yields 769.98 crs. Which one is correct?
Thanks!
Guru, if I may, as I\’m not a pro… EBITDA, should not have \” Depreciation & Amortization\” subtracted from it. In your first formula \” Depreciation & Amortization\” is getting subtracted from earning… hence, your second answer is correct….
Looking forward to someone more experienced in confirming my answer
EBITDA = [Total Revenue – Other Income – Operating Expense]
Apologies if I\’ve used any other number, I guess its a mistake and I will look into it.
Dear Karthik, awesome job!!! Great job…. Wanted to know one thing. Isn\’t COGS already calculated in WIP Inventory cost? For example, across the sources, I say that WIP Inventory = Raw inventory + Direct Labour + Manufacturing Overheads…. However, I understand that the way it is done here is different. In that case, how is WIP Inventory cost getting calculated here?
Looking forward to your reply!!! Thanks……
Thanks, happy to know you liked our content!
COGS is expense which is \’already\’ incurred against which revenues are recognised. However, WIP is an on going expense and the revenues will be recognised at a later point.
Thans Kathik….Its a great thing you\’re doing…and as an engineer, venturing into this filed, I shall remain indebted to you….. Now, u see, (Sorry that I\’m a lil confused) COGS is change in finished goods (Opening+Produced-Finishing) and finished goods cost include manufacturing cost….So, how can change in WIP be negative…. As in it must then be that somewhere else in P&L statement total cost for WIP is getting added, then we must be subtracting unused WIP somewhere…. Where is this total cost being added?
I mean, should not direct labor and other manufacturing cost be reflected under the Expense Head? And, if I may ask, could you in a couple of words say how fixed costs are added to the WIP Inventory (for example utilities cost/rent cost, etc)
Getting an exact split up of fixed costs under WIP is quite tough, you will get some explanation under the associated notes. I\’d encourage you to pull out the AR of some other company and study this to get a deeper insight.
hmmm…interesting, please do give me sometime to put my thoughts together. Will get back shortly.
Thanks a lot Karthik…… I shall wait for your reply!! In the meantime, I\’m indeed trying to go through a couple of other AR and get a better understanding….
P.S.: You\’re doing a fantabulous job…Kudos!!!
Cheers!!
Karthik, looking forward to your reply…hope you got some time!!
Hi dear Karthik
Trade Receivable for the FY13 : Rs.380.67 Crs
Trade Receivable for the FY14 : Rs. 452.78 Crs
Average Receivable for the FY13 : Rs.416.72
why is it 416.72
should be 607.0
thanks for replying in advace
Average Trade Receivable for FY13 would be Average of Trade Receivable for FY12 and Trade Receivable for FY13.
416.72 got it thanks but it is for FY14 isn\’t it?
by the way do you have those materials in the Hindi?
Lot of thanks
Yup.
Will try and get this in Hindi.
Thanks, Please paste the Hindi link when you are able as well
it would be better to understand for the beginners
Sure, will do. Thanks.
HELLO ZERODHA I THANK YOU ENORMOUSLY FOR THIS GREAT SERVICE OF EDUCATING PEOPLE LIKE ME FINANCIALLY ,CAN YOU SHED A LITTLE LIGHT ON VERIFYING PRODUCTION PARAMETERS WHEN THERE ARE GOOD \”INVENTORY DAYS\” NUMBER,IS LACK OF GROWTH IN REVENUE NUMBERS ONE OF THEM
Thanks Srikanth.
Inventory days is a simple calculation. You just divide \’Inventor Turnover\’ by 365. Inventory Turnover is sales/Inventory. Higher the number, the higher is the number of days for the company to convert inventory into cash. Always make sure you compare the company\’s numbers with its peers to know how it stacks up.
Dear sir, can you please explain how to calculate interest coverage ratio when company is capitalizing interest cost, for ex. i have taken of godrej properties( consolidated 15-16), in that company is showing finance cost as 15.35 cr. but its real fincance cost is on page 195 given BANKS 140 CR. , OTHERS 190 CR. , OTHER BORROWING COST 81 CR. Now how to calculate this, please explain so that in case of company capitalizing interest we can calculate.
You need to add up these costs and consider this as the interest costs. Take EBIT and divide it over interest costs to get the ICR.
Dear sir, pls explain that in INTREST COVERAGE RATIO, you have mention EBITDA – EBIT – DA, Now my question is we have already deducted DA in EBITDA then why again we have to deduct DA in EBIT calucualtion.
No, we need not deduct D&A from EBIT. Interest Coverage ratio (ICR) is EBIT/Interest paid.
Couple of things you need to note –
1) While taking the Interest amount in the denominator, make sure you take the interest amount from the schedule, as some companies tend to capitalize the interest to show less interest amount and boost the bottom line
2) If the interest coverage is higher than 3 then it is a good sign, you need to be careful if ICR is between 1.5 and 3, and finally if the ICR is less than 1.5 then please do watch out for such companies as there is a high chance of them defaulting on interest payments.
First of all it is an amazing website. Dear Mr. Karthik as per my understanding we cannot ascertain COGS from financial statements since it does not provide enough information on items like Direct Labour (which may be very crucial in industries that are labour intensive.
After looking at a textbook on accounting the formula for COGS looks like Raw material consumed + Direct Labour + Depreciation related to plant and machinery and building used in production process + Other Manufacturing Expenses + Opening stock WIP – Closing Stock WIP gives us Cost of Production. From the Cost of Production we add opening stock of finished goods and subtract closing stock of finished goods to get COGS. So we can only get Cost of Sales and not COGS.
Further, in many annual accounts \”Other expenses\” do not present data which provide segregated costs that are function-wise like the one given in ARBL so we need to use some amount of judgement to decipher the ones that are related to manufacturing.
Kindly correct me if I am wrong it would be of great help. How can one learn financial modeling from your website and pro forma financial statement forecasting
Sanat – absolutely. In fact for each company based on the nature of business we need to arrive at the variables which would make up for the cost of goods sold. Clearly one size does not fit all!
same formula has been mentioned for 2 ratios fixed assets turnover and total assets turnover i.e operating revenue/average total assets.
same formula means same value, then why 2 different ratios?
is it by mistake or they imply same thing?
Fixed asset takes into consideration long term assets, but total asset turnover takes into consideration both fixed and current assets. So there is a slight difference between the two.
while calculating fixed asset turnover operating revenue is taken as 343.7 crs. Whereas in annual report net revenue is mentioned as 34367m , which if converted to crores comes out to be 3436.7 cr and not 343.7crs. so from where 343.7crs value is taken in annual report?
Hi Rohan,
Thank you for your query. You are right about the calculation of revenue. The operating revenue for the calculation is arrived at as follows :
= 34367 * 10,00,000 / 100,00,000 = Rs. 3436.7 crores.
We have made the necessary corrections.
where to find inventory values 292.85 cr and 335 cr in annual report?
I am not able to find them
Please see the circled images in the attachment, I have extracted the same from ARBL Annual Report ( 2013- 2014) – from its Balance Sheet.
If I calculate interest coverage ratio for amaraja battery-
EBITDA=560cr
EBIT=560-64=496cr
financial cost=.7cr
so interst coverage ratio=496/.7=708 x
is my calculation correct, how come interest coverage ratio is coming so high i.e 708?
Hi Rohan,
Thank you for your query. You are right about the calculation of the interest coverage ratio. It is 708 times because the denominator ( interest component) is a negligible amount. Please note it is a good number for an investor because it shows, the company has sufficient funds to service the debt. However a high ratio like this could also indicate, that the company is not using leverage to the fullest to increase its earnings.
HI,
EBIT=Earning Before Interest and Tax…..
EBITDA= Earning Before Interest Tax and Depreciation and Amortization….
here which one is includes or excludes Depreciation and Amortization cost?
EBITDA includes D&A.
EBITDA – D&A = EBIT.
Hi, sir
EBIT=EBITDA-Depretiation and Amortizatio
or
EBIT=EBITDA+Depretiation and Amortization?
which one is correct?
EBIT=EBITDA – Depreciation and Amortization.
Is there any difference between \”Share Capital\” and \”Total Number of Shares\”? Or are they both same?
They both are related. For example if the Share Capital of a company is Rs.10Crs, with the face value of each share as Rs.5, then the number of shares will be –
Share Capital / Face Value
= 10 Cr / 5
= 20 Lakh shares.
Is EBIT and PBIT different??If different then could u please explain why are they different i am really confused over both the terms
They are the same Micheal.
and what is the difference between operating leverage and financial leverage??
The operating leverage measures the effect of fixed costs on the total cost structure of the company
So, firms which incur higher proportion of fixed costs in comparison to their variable costs are considered to have a high operating leverage, whereas firms which incur lower fixed costs and higher variable costs are considered to have a lower operating leverage
Financial leverage measures the amount of debt financing on the total capital structure of the company
So, firms which use higher debt in proportion to equity are considered to have higher financial leverage, whereas firms which use lower debt in proportion to equity are considered to have lower financial leverage.
I would like to ask u What does negative (or) zero working capital & receivable days mean??
Working Capital (WC) = Current Assets – Current Liabilities
Hence -ve WC indicates that the current liabilities are more than current assets.
In Financial Leverage Ratio,Average Total Asset is 8912.615 but correct value is 8012.6155.
If yes,please correct it.
Thank you for pointing out the error. We have made the necessary corrections.
Which is valid?
(From The Financial Ratio Analysis (Part 1))
In ROE DuPont Model
Financial Leverage = Average Total Assets / Average Shareholders Equity
(From The Financial Ratio Analysis (Part 2))
Financial Leverage Ratio=Average Total Asset / Average Total Equity
Both are same i.e Avg Shareholder Equity = Average Total Equity.
why is change in inventories of finished goods, WIP not included in cogs???
Mostly because they are balance sheet items.
Interest Coverage Ratio: the formula is correct but you have put in value of EBITDA(769.98 Cr) instead of EBIT(565.44 Cr) beacuse of which the ratio comes out to be 1.67 which should be 1.209…i guess!!
Oops, thanks for pointing this, will make the necessary corrections.
Thank you for pointing out the error. We have made the necessary corrections.
This comment sort of contradict comment posted on March 12 2015. But then responses to both are \”corrected\”. Not sure the formula and applied numbers are correct. The way I understand EBITDA is earnings before interest tax depreciation and amortization. Thus, EBIT should actually be EBIT = EBITDA + DA because you are considering earnings only before interest and tax(EBIT), I guess.
Sir,
What is the basic difference between Fixed Asset Turnover and Total Asset Turnover?
Thank you With Best Regards.
The basic difference is :-
The Total asset turnover ratio helps a firm to evaluate how well it is utilizing all its assets while it is trying to generate its revenue vis-a-vis a Fixed asset turnover ratio which evaluates how well a firm is utilizing its fixed assets while it is trying to generate its revenue.
So, a high total asset turnover and fixed asset turnover ratio indicates efficient utilization of a firm\’s assets and a low total asset turnover and fixed asset turnover indicates inefficient utilization of a firm\’s assets.
Mr. Karthik
In Interest Coverage Ratio why we have subtracted Depreciation & Amortization cost (Rs.204.54) two times from total expenses. Please clarify
Hi Ashish,
Thank you for pointing out the error, we have made the necessary corrections.
Seems, this is still not corrected. Shouldn\’t EBIT means earnings excluding only interest and taxes? If so, we should simply subtract finance cost and tax expenses line items? DA should be be inclusive?
Please recheck and/or confirm. Thanks.
Total asset: FY14 = 2139.4, FY13 = 1770.5 Crores. Average = (2139.4 + 1770.5)/2 = 1954.95
Ah got it 🙂
You are taking the sum total of both Current and Non current assets. However in \’Fixed Asset\’ Turnover ratio, the assets being refereed to is just \’Fixed Asset\” and not all the assets.
No you did not 🙂 The typo I am referring to is in the calculation of Total Asset Turnover ratio. You seem to have calculated Fixed Asset Turnover ratio again.
My bad ! and I\’m quite embarrassed :). Thank you so much for pointing this out, I\’ve made the necessary changes.
Thank you. I think I did not emphasize enough in the description about the whereabouts of the error. Anyway …. could you please have these typo related comments deleted now? There purpose is over now.
I guess the comments should be there, to constantly remind us to be more diligent while proof reading 🙂
Another typo I guess. Average asset of ABRL for FY2013-14 is 1954 and not 614. Therefore, the total asset turnover should be 1.7 and not 5.5. I hope I am not annoying you.
Ajit, I rechecked the numbers. Rs.614 Crs seems to be the Average total assets for FY13 and FY14. Unless I\’m missing something very obvious !
There is a typo in the calculation of Fixed Asset Turnover Ratio of ABRL. Since the operating revenue is 3437 and not 353.7, this ratio should be 5.5 and not 0.55.
Thanks, making the correction now.
For a general calculation can\’t we use the formula COGS = Current Total Expense + last year inventory – current inventory? I was hoping that this formula works. This would have saved me in looking into each item of expenses and figure out which will go into COGS.
Thanks for your advice regarding moneycontrol. I will check out morningstar now. — Best regards
Ajit – Maybe I need to explore this a bit deeper.. honestly I\’ve never used the formula Investopedia suggests i.e COGS = Current Total Expense + last year inventory – current inventory. In fact more often than not I end up using the one that I have mentioned in the chapter.
Also on another note, the value that you calculate and the ones mentioned on sites like moneycontrol, morningstar, ET markets etc will hardly ever match point to point…it will differ by few bps. Hence for this reason I always tend to treat these ratios as a ballpark.
The difference were not small. You were speaking of the same ratio GPM in the range of 28% where the investopedia\’s formula was giving GPM in the range of 14%, unless I am misinterpreting the formula.
I understand, like I said I have not used that formula for COGS. Need to dwell more on it. Will surely get back on it as it is learning for me as well.
I was confused on why employee benefits were not counted in COGS. So, I googled COGS and found out this on investopedia
\”There are several ways to calculate COGS but one of the more basic ways is to start with the beginning inventory for the period and add the total amount of purchases made during the period, and then deducting the ending inventory. This calculation gives the total amount of inventory or, more specifically, the cost of this inventory, sold by the company during the period. Therefore, if a company starts with $10 million in inventory, makes $2 million in purchases and ends the period with $9 million in inventory, the company\’s cost of goods for the period would be $3 million ($10 million + $2 million – $9 million).\”
So for Amaraja Batteries FY13-14, this would look like COGS = (3404+292 -335) = 3359 Crores.
This reduces the GPM significantly. GPM = (3404-3359)/3404 = 1.3%
I am sure I am reading something terribly wrong. Not sure what.
This is the link where I found the alternate way to calculate COGS.
http://www.investopedia.com/terms/c/cogs.asp
I think I found my mistake. Investopedia is suggesting this formula: COGS = Last Year Inventory + Total Expenses – Current Inventory. For ARBL, FY 13-14 this formula is giving COGS = 292 + 2942 – 335 = 2899 Crores. This implies GPM = 3403-E3)/3403 = 14%. Please note that moneycontrol.com also shows a GPM of 14% for ARBL for FY13-14 (http://www.moneycontrol.com/financials/amararajabatteries/ratios/ARB). Your calculation shows a GPM of 28% for ARBL for the same year. I am not sure who is right and who is wrong.
Ajit – The GMP calculation is shown here – (http://zerodha.com/varsity/chapter/equity-research-part-1/). Calculation of COGS varies a bit from company to company. Also please dont rely on moneycontrol, I\’ve found errors multiple times. Suggest you try morningstar India website.