15.1 – Getting started with the DCF Analysis
We discussed “The Net Present Value (NPV)” in the previous chapter. NPV plays a vital role in the DCF valuation model. Having understood this concept, we now need to understand a few other related topics to the DCF valuation model. In fact, we will learn more about these concepts by implementing the DCF model on Amara Raja Batteries Limited (ARBL). With this, we will conclude the 3rd stage of Equity Research, i.e. ‘The Valuation’.
In the previous chapter, to evaluate the pizza machine’s price, we looked at the future cash flows from the pizza machine and discounted them back to get the present value. We added all the present value of future cash flows to get the NPV. Towards the end of the previous chapter, we also toyed with the idea –What will happen if the company’s stock replaces the pizza machine? In that case, we just need an estimate of the future cash flows from the company, and we will be able to price the company’s stock.
But what cash flow are we talking about? And how do we forecast the future cash flow for a company?

15.1 – The Free Cash Flow (FCF)
We need to consider the cash flow for the DCF Analysis is called the “Free Cash flow (FCF)” of the company. The free cash flow is basically the excess operating cash that the company generates after accounting for capital expenditures such as buying land, building and equipment. This is the cash that shareholders enjoy after accounting for the capital expenditures. The mark of a healthy business eventually depends on how much free cash it can generate.
Thus, free cash is the amount of cash the company is left with after paying all its expenses, including investments.
When the company has free cash flows, it indicates the company is healthy. Hence investors often look out for such companies whose share prices are undervalued but who have high or rising free cash flow, as they believe over time, the disparity will disappear as the share price will soon increase.
Thus the Free cash flow helps us know if the company has generated earnings in a year or not. Hence as an investor to assess the company’s true financial health, look at the free cash flow besides the earnings.
FCF for any company can be calculated easily by looking at the cash flow statement. The formula is –
FCF = Cash from Operating Activities – Capital Expenditures
Let us calculate the FCF for the last 3 financial years for ARBL –
| Particular | 2011 -12 | 2012 -13 | 2013 -14 |
|---|---|---|---|
| Cash from Operating Activities (after income tax) | Rs.296.28 Cars | Rs.335.46 | Rs.278.7 |
| Capital Expenditures | Rs.86.58 | Rs.72.47 | Rs.330.3 |
| Free Cash Flow (FCF) | Rs.209.7 | Rs.262.99 | (Rs.51.6) |
Here is the snapshot of ARBL’s FY14 annual report from where you can calculate the free cash flow –
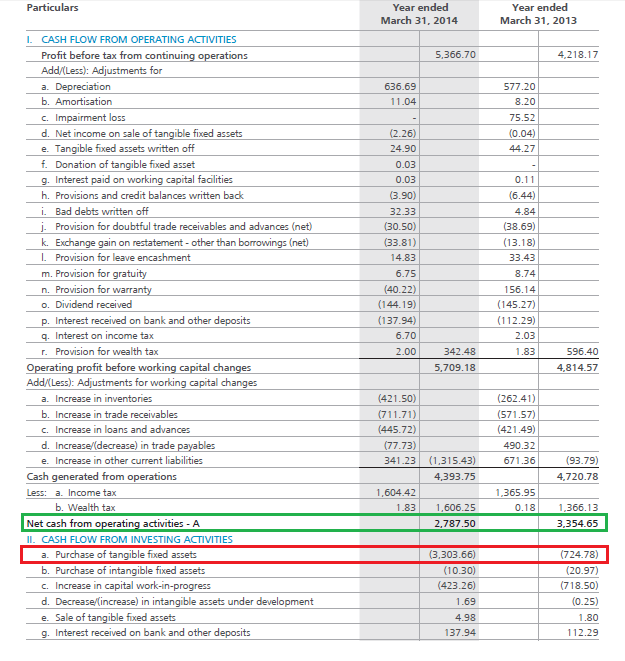
Please note, the Net cash from operating activities is computed after adjusting for income tax. The net cash from operating activities is highlighted in green, and the capital expenditure is highlighted in red.
You may now have a fair point in your mind – When the idea is to calculate the future free cash flow, why are we calculating the historical free cash flow? The reason is simple while working on the DCF model; we need to predict the future free cash flow. The best way to predict the future free cash flow is by estimating the historical average free cash flow and then sequentially growing the free cash flow by a certain rate… This is a standard practice in the industry.
Now, by how much do we grow, the free cash flow is the next big question? Well, the growth rate you would assume should be as conservative as possible. I personally like to estimate the FCF for at least 10 years. I do this by growing the cash flow at a certain rate for the first 5 years, and then I factor in a lower rate for the next five years. If you are getting a little confused here, I will encourage you to go through the following step by step calculation for better clarity.
Step 1 – Estimate the average free cash flow.
As the first step, I estimate the average cash flow for the last 3 years for ARBL –
= 209.7 + 262.99 + (51.6) / 3
=Rs.140.36 Crs
The reason for taking the average cash flow for the last 3 years is to ensure we are averaging out extreme cash flows and accounting for the business’s cyclical nature. For example, in ARBL, the latest year cash flow is negative at Rs.51.6 Crs. Clearly, this is not a true representation of ARBL’s cash flow; hence, for this reason, it is always advisable to take the average free cash flow figures.
Step 2 – Identify the growth rate.
Select a rate which you think is reasonable. This is the rate at which the average cash flow will grow going forward. I usually prefer to grow the FCF in 2 stages. The first stage deals with the first 5 years, and the 2nd stage deals with the last 5 years. Specifically, concerning ARBL, I prefer to use 18% for the first 5 years and around 10% for the next five years. If the company under consideration is a mature company that has grown to a certain size (as in a large-cap company), I would prefer to use a growth rate of 15% and 10%, respectively. The idea here is to be as conservative as possible.
Step 3 – Estimate the future cash flows.
We know the average cash flow for 2013 -14 is Rs.140.26 Crs. At 18% growth, the cash flow for the year 2014 – 2015 is estimated to be –
= 140.36 * (1+18%)
= Rs. 165.62 Crs.
The free cash flow for the year 2015 – 2016 is estimated to be –
165.62 * (1 + 18%)
= Rs. 195.43 Crs.
So on and so forth. Here is a table that gives the detailed calculation…
An estimate of future cash flow –
| Sl No | Year | Growth rate assumed | Future Cash flow (INR Crs) |
|---|---|---|---|
| 01 | 2014 – 15 | 18% | 165.62 |
| 02 | 2015 – 16 | 18% | 195.43 |
| 03 | 2016 – 17 | 18% | 230.61 |
| 04 | 2017 – 18 | 18% | 272.12 |
| 05 | 2018 – 19 | 18% | 321.10 |
| 06 | 2019 – 20 | 10% | 353.21 |
| 07 | 2020 – 21 | 10% | 388.53 |
| 08 | 2021 – 22 | 10% | 427.38 |
| 09 | 2022 – 23 | 10% | 470.11 |
| 10 | 2023 – 24 | 10% | 517.12 |
With this, we now have a fair estimate of the future free cash flow. How reliable are these numbers, you may ask? After all, predicting the free cash flow implies predicting the sales, expenses, business cycles, and literally every aspect of the business. Well, the estimate of the future cash flow is just that; it is an estimate. The trick here is to be as conservative as possible while assuming the free cash flow growth rate. We have assumed 18% and 10% growth rate for the future; these are fairly conservative growth rate numbers for a well managed and growing company.
15.2 – The Terminal Value
We have tried to predict the future free cash flow for upto 10 years. But what would happen to the company after the 10th year? Would it cease to exist? Well, it would not. A company is expected to be a ‘going concern’ which continues to exist forever. This also means that as long as the company exists, some amount of free cash is generated. However, as companies mature, the rate at which free cash is generated starts to diminish.
The rate at which the free cash flow grows beyond 10 years (2024 onwards) is called the “Terminal Growth Rate”. Usually, the terminal growth rate is considered to be less than 5%. I personally like to set this rate between 3-4%, and never beyond that.
The “Terminal Value” is the sum of all the future free cash flow beyond the 10th year, also called the terminal year. To calculate the terminal value, we just have to take the cash flow of the 10th year and grow it at the terminal growth rate. However, the formula to do this is different as we are calculating the value literally to infinity.
Terminal Value = FCF * (1 + Terminal Growth Rate) / (Discount Rate – Terminal growth rate)
Do note, the FCF used in the terminal value calculation is that of the 10th year. Let us calculate the terminal value for ARBL considering a discount rate of 9% and terminal growth rate of 3.5% :
= 517.12 *(1+ 3.5%) / (9% – 3.5%)
= Rs.9731.25 Crs
15.3 – The Net Present Value (NPV)
We know the future free cash flow for the next 10 years, and we also know the terminal value (which is the future free cash flow of ARBL beyond the 10th year and upto infinity). We now need to find out the value of these cash flows in today’s terms. As you may recall, this is the present value calculation. Once we find out the present value, we will add these present values to estimate the net present value (NPV) of ARBL.
We will assume the discount rate at 9%.
For example, in 2015 – 16 (2 years from now), ARBL is expected to receive Rs.195.29 Crs. At a 9% discount rate, the present value would be –
= 195.29 / (1+9%)^2
= Rs.164.37 Crs
So here is how the present value of the future cash flows stack up –
| Sl No | Year | Growth rate | Future Cash flow (INR Crs) | Present Value (INR Crs) |
|---|---|---|---|---|
| 1 | 2014 – 15 | 18% | 165.62 | 151.94 |
| 2 | 2015 – 16 | 18% | 195.29 | 164.37 |
| 3 | 2016 – 17 | 18% | 230.45 | 177.94 |
| 4 | 2017 – 18 | 18% | 271.93 | 192.72 |
| 5 | 2018 – 19 | 18% | 320.88 | 208.63 |
| 6 | 2019 – 20 | 10% | 352.96 | 210.54 |
| 7 | 2020 – 21 | 10% | 388.26 | 212.48 |
| 8 | 2021 – 22 | 10% | 427.09 | 214.43 |
| 9 | 2022 – 23 | 10% | 470.11 | 216.55 |
| 10 | 2023 – 24 | 10% | 517.12 | 218.54 |
| Net Present Value (NPV) of future free cash flows | Rs.1968.14 Crs | |||
Along with this, we also need to calculate the net present value for the terminal value. To calculate this, we simply discount the terminal value by discount rate –
= 9731.25 / (1+9%)^10
= Rs.4110.69 Crs
Therefore, the sum of the present values of the cash flows is = NPV of future free cash flows + PV of terminal value
= 1968.14 + 4110.69
= Rs.6078.83 Crs
This means standing today and looking into the future; I expect ARBL to generate a totally free cash flow of Rs.6078.83 Crs, all of which would belong to the shareholders of ARBL.
15.4 – The Share Price
We are now at the very last step of the DCF analysis. We will now calculate the share price of ARBL based on the firm’s future free cash flow.
We now know the total free cash flow that ARBL is likely to generate. We also know the number of shares outstanding in the markets. Dividing the total free cash flow by the total number of shares would give us the per-share price of ARBL.
However, before doing that, we need to calculate the value of ‘Net Debt’ from its balance sheet. Net debt is the current year total debt minus current year cash & cash balance.
Net Debt = Current Year Total Debt – Cash & Cash Balance.
For ARBL, this would be (based on the FY14 Balance sheet) –
Net Debt = 75.94 – 294.5
= (Rs.218.6 Crs)
A negative sign indicates that the company has more cash than debt. This naturally has to be added to the total present value of free cash flows.
= Rs.6078.83 Crs – (Rs. 218.6 Crs)
= Rs.6297.43 Crs
Dividing the above number by the total number of shares should give us the company’s share price, also called the intrinsic value of the company.
Share Price = Total Present Value of Free Cash flow / Total Number of shares.
We know from ARBL’s annual report the total number of outstanding shares is 17.081 Crs. Hence the intrinsic value or the per-share value is –
= Rs.6297.43 Crs / 17.081 Crs
~ Rs.368 per share!
This, in fact, is the final output of the DCF model.
15.5 – Modeling Error & the intrinsic value band
The DCF model though quite scientific, is built on a bunch of assumptions. Making assumptions, especially in finance, takes on an art form. You get better at it as you progress through and gain more experience. Hence, we should assume (yet another assumption ) that we have made a few errors while making the intrinsic value calculation for all practical purposes. Hence, we should accommodate for modelling errors.
A leeway for the modelling error simply allows us to be flexible with calculating the per-share value. I personally prefer to add + 10% as an upper band and – 10% as the lower band for what I perceive as the stock’s intrinsic value.
Applying that on our calculation –
Lower intrinsic value = 368 * (1- 10%) = Rs. 331
Upper intrinsic value = Rs.405
Hence, instead of assuming Rs.368 as the stock’s fair value, I would now assume that the stock is fairly valued between 331 and 405. This would be the intrinsic value band.
Now keeping this value in perspective, we check the market value of the stock. Based on its current market price, we conclude the following –
- If the stock price is below the lower intrinsic value band, we consider the stock to be undervalued. Hence one should look at buying the stock.
- If the stock price is within the intrinsic value band, then the stock is considered fairly valued. While no fresh buy is advisable, one can continue to hold on to the stock if not adding more to the existing positions.
- If the stock price is above the higher intrinsic value band, the stock is considered overvalued. The investor can either book profits at these levels or continue to stay put. But should certainly not buy at these levels.
Keeping these guidelines, we could check for Amara Raja Batteries Limited’s stock price as of today (2nd Dec 2014). Here is a snapshot from the NSE’s website –
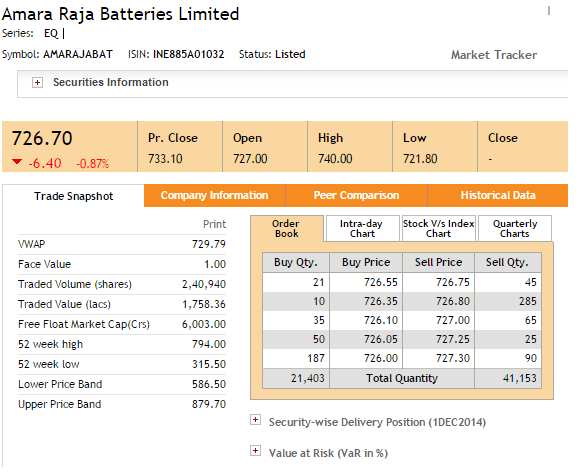
The stock is trading at Rs.726.70 per share! Way higher than the upper limit of the intrinsic value band. Clearly, buying the stock at these levels implies one is buying at extremely high valuations.
15.6 –Spotting buying opportunities
Long term investment and activities surrounding long term investing are like a slow-moving locomotive train. Active trading, on the other hand, is like the fast bullet train. When long term value opportunity is created, the opportunity lingers in the market for a while. It does not really disappear in a hurry. For instance, we now know that Amara Raja Batteries Limited is overvalued at the current market price. It is trading way higher than the upper limit of the intrinsic value band. But the scene was totally different a year ago. Recall based on FY 2013- 2014, ARBL’s intrinsic value band is between Rs. 331 and Rs.405.
Here is the chart of ARBL –
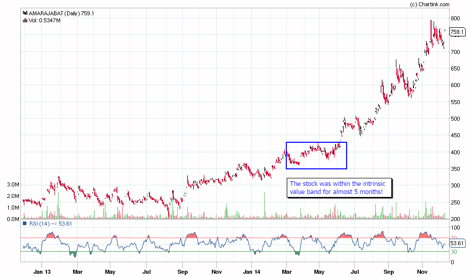
The blue highlight clearly shows that the stock was comfortable trading within the band for almost 5 months! You could have bought the stock anytime during the year. After buying, all you had to do was stay put for the returns to roll!
In fact, this is the reason why they say – Bear markets create value. The whole of last year (2013), the markets were bearish, creating valuable buying opportunities in quality stocks.
15.7 – Conclusion
Over the last 3 chapters, we have looked at different aspects of equity research. As you may have realized, equity research is simply the process of inspecting the company from three different perspectives (stages).
In stage 1, we looked at the qualitative aspects of the company. At this stage, we figured out who, what, when, how, and why of the company. I consider this an extremely crucial stage of equity research. If something is not really convincing here, I do not proceed further. Remember, markets are an ocean of opportunities, so do not force yourself to commit to an opportunity that does not give you the right vibe.
I proceed to stage 2 only after I am 100% convinced with my findings in stage 1. Stage 2 is basically the application of the standard checklist, where we evaluate the company’s performance. The checklist that we have discussed is just my version of what I think is a fairly good checklist. I would encourage you to build your own checklist, but make sure you have a reasonable logic while including each checklist item.
Assuming the company clears both stage 1 and 2 of equity research, I proceed to equity research stage 3. In stage 3, we evaluate the stock’s intrinsic value and compare it with the market value. If the stock is trading cheaper than the intrinsic value, then it is considered a good buy. Else it is not.
When all the 3 stages align to your satisfaction, you certainly would have the conviction to own the stock. Once you buy, stay put, ignore the daily volatility (that is, in fact, the virtue of capital markets) and let the markets take its own course.
Please note, I have included a DCF Model on ARBL, which I have built on excel. You could download this and use it as a calculator for other companies as well.
Key takeaways from this chapter
- The free cash flow (FCF) for the company is calculated by deducting the capital expenditures from the net cash from operating activates.
- The free cash flow tracks the money left over for the investors.
- The latest year FCF is used to forecast the future year’s cash flow.
- The growth rate at which the FCF is grown has to be conservative.
- The terminal growth rate is when the company’s cash flow is supposed to grow beyond the terminal year.
- The terminal value is the value of the company’s cash flow from the terminal year upto infinity.
- The future cash flow, including the terminal value, has to be discounted back to today’s value.
- The sum of all the discounted cash flows (including the terminal value) is the total net present value of cash flows.
- From the total net present value of cash flows, the net debt has to be adjusted. Dividing this by the total number of shares gives us the per-share value of the company.
- One needs to accommodate for modelling errors by including a 10% band around the share price.
- By including a 10% leeway, we create an intrinsic value band.
- Stock trading below the range is considered a good buy, while the stock price above the intrinsic value band is considered expensive.
- Wealth is created by long term ownership of undervalued stocks.
- Thus, the DCF analysis helps the investors identify whether the company’s current share price is justified.
do the suggestions/tips given by big firms is done like that? and why isn\’t anybody calculating this and you know giving the intrinsic value?
Everybody does intrinsic value calculation, its just the there is no standard form here. Assumptions can vary based on your perspective of the business, hence the final intrinsic value changes too.
Hi Karthik,
How do you think about intrinsic value for Banks / NBFCs when “free cash flow” is conceptually different? I slightly understand how fcf for a bank is tricky to infer. The major portion of equity itself is necessary to be reinvested into the business for growth (which is like the capex deducted from actual cash collected in a manufacturing firm). The true free distributable cash is hence is a very low value. And if you calculate intrinsic value with a guesstimate of such freely distributable cash it is a very low number. Just confused about this whole concept and wanted to understand how experienced investors reconcile this.
Thanks
Yeah, hence that is not really a good measure or value a bank or NBFC. You got to look at they asset quality, NPAs, interest margins, book value etc.
Hi Karthik,
Thanks for all this material. Extremely helpful and easy to read.
How can we reliably forecast free cash flow for a company like Titan, where operating cash flows are highly volatile due to fluctuating working capital and CAPEX cycles? Unlike retained earnings, which often grow at a relatively stable rate, free cash flow appears unpredictable and does not follow a consistent pattern. How do analysts build a DCF model and calculate intrinsic value of the company in such cases?
One more question – Warren Buffer says he calculated intrinsic value but it was always a mental math, never really calculated by putting pen to paper. He says the oppertunity ought to scream at you that you\’ve got this huge margin of safety. Wanted to understand your thoughts on how he went about this.
Well, when Warren Buffet says he does mental valuation models, that basically years of investing experience backing that mental calculation 🙂
Volatile is fine, but not negative.
Hi Sir,
1. Can the discount rate used here (9%) be relaced by WACC?
2. For calculating the terminal value here, you have used power 10 (I assume for the 10th year) \”9731.25 / (1+9%)^10\”, shouldn\’t it be 11 since we have already calculated the NPV for the 10th year.
Thank you
1) Yes
2) Hmm, I think it does. Need to double check 🙂
Hello Sir, I am not able to download the DCF model on ARBL given at the end of this chapter. Could you please look into it?
Can you please try downloading from another browser?
That worked thanks
Happy learning!
Thank you for publishing this learning material, Karthik and Zerodha team!
For fundamentals analysis and DCF calculation – what\’s the best way to do it for the new potentially growing companies? I think the modeling described here works for companies that are mature (or on that path already). Appreciate any input on that.
Hmm, that would be tricky. One way is to look at relative valuation and compare it to peers locally and outside the country as well.
Sir capital expenditure is considered as purchase of tangible assets as you highlighted that in the diagram but when i am going through the Monte carlo annual report there they have included something more with tangible assets so how can i came up with actual numbers?
in monte carlo report: \”Purchase of property, plant and equipment and Intangible
assets (including capital advances, creditors for capital goods,
Capital work-in-progress and Intangible assets under develop
ment )\”
Can you help me to identify actual capital expenditure?
One more question What if the stock price is less than the intrinsic value of the stock but the Index P/E is 21 or more than that should i buy the stock at that time or should i wait as you earlier said do not invest when Index P/E is Somewhat in this range.
Thats your call as an analysts. But such an exercise suggests that the market is mispricing the value 🙂
Intangibles can also be included in CAPEX, maybe they are working on some branding exercise?
hello Karthik,
First of all a big thank you for the treasure of knowledge provided here. I was just using the dcf model in excel which you provided and discovered that a change in net debt value had no effect on the final share price. Is this an issue with the excel sheet or is this the actual case??
Thanks Loven. Debt values should have an impact, let me check.
Hello kartik sir aditya here , sir why is onyl tnagible assets considered in the capital expenditure like the one highlighted in red
Capital Expenditure refers to money spent by a business to acquire, upgrade, or maintain physical assets like property, machine, hence 🙂
Hi, just wanted to have a comment on the current share value of ARBL which is Rs.964 with a highest peak of Rs.1775 .
The stock value never came close to our predicted value in 2014; in fact, it has been increasing.
Did you calculate an updated stock value band?
Would you say there were some wrong assumptions in the method used?
Nayan, Ideally one needs to have a dedicated model and and the bands get updated as and when new information emerges. New information via quaterly results and annual reports.
Hi Karthik
Thank you so much for the content provided. Has helped learn a lot. I have a doubt regarding FCF, while calculating the same the Capex will include purchase of intangible fixed assets as well right?
Thanks in advance
Like goodwill you mean? That would be one time cash outflow basically.
Like IPs or Patent
DIDN\’T UNDERSTAND HOW TO SPOT BUYING OPPERTUNITIES. CAN YOU PLEASE EXPLAIN
Here you go, please check this module – https://zerodha.com/varsity/module/technical-analysis/
For calculating net debt of Amara raja, we are deducting the current cash balance from the Current Year Total Debt
Net Debt = 75.94 – 294.5
= (Rs.218.6 Crs)
in other words we are deducting the Current Year Total Debt from our cash balance and adding this cash balance to the future cash value
But while calculating the future cash value we have started of of our calculation with current cash balance, this the future cash balance already includes the current cash balance.
Won’t this method allow including our current cash balance twice.
Net Debt = Total Debt – Cash & Cash Equivalents
In your example:
Net Debt = 75.94 – 294.5 = (Rs. 218.6 Cr)
This indicates the company has a net cash position, meaning cash exceeds debt.
Now, regarding the future cash flows: if we\’re starting our DCF or valuation with the current cash balance already included in the initial value, and then also adding net debt at the end (which includes subtracting cash again), there’s indeed a risk of double-counting the current cash.
To avoid this, there are generally two correct approaches:
1. Start with Enterprise Value (calculated using future cash flows and exclude current cash), and then:
Equity Value = Enterprise Value – Net Debt
2. Start with total future cash including current cash, and do not separately add the current cash again.
So yes — if we include the current cash in the future cash flow projection and also adjust for it via net debt, it gets counted twice, which would inflate the valuation.
The key is to stay consistent.
Hi Karthik,
Nicely explained the things. I have few questions.
1. In step 3 you have mentioned that the average cash flow for 2013-14 is 140.36. So you have taken a 3 year horizon and hence, the average cash flow is 140.36.
2. If I have the data from 2020-2024 and want to calculate the valuation then what should be my approach.
3. I want to do the valuation analysis of First Cry Ltd. What process should I follow.
The same approach, but different time series data. Thats it 🙂
I am getting stuck at various points. Could you suggest me from where I can get the help.
Please post your queries here, will try and resolve here itself.
what things should be forecasted for valuation analysis. Also, what should be the growth rate, terminal rate and discount rate in case of a company like firstcry.
I\’ve explained all this and more here – https://zerodha.com/varsity/module/financial-modelling/
Hello Karthik,
There are numerous DCF calculators available online. Can rely on, or should we perform our own calculations? What do you suggest?
You can use these calculators if you know its from a trusted source.
Quoting the above line, \”as companies mature, the rate at which free cash is generated starts to diminish.\” There are many mature companies with large market capitalizations. If I were to invest in some of these companies today, what growth rate should I consider: a \”terminal growth rate\” of 3%-4% or a normal rate of 18% and 10%?
It has to be in the region of inflation numbers, so maybe 3-5%.
Why did\’nt you include capital work in progress(cwip)while calculating free cash flow??
But that capital is committed right?
You have subtracted the debt from the total cash flow i.e.
(Net Debt = Current Year Total Debt – Cash & Cash Balance)
1.) Don\’t you think, at the initiation of calculation, while estimating the average cash flow we should deduct the debt.
2.) I think the assets can also be calculated in this method.
3.) I am not able to download the excel sheet in the attachment with all the formulas.
Thanks for teaching us!
1) We do factor in the debt right?
2) Not sure about this, can you elaborate?
3) Can you try downloading from a different browser?
Sir the value of total debt you use in calculating net debt is only including long term borrowing not short term. I think this is mistake.
The idea is to figure long term debt only.
I didn\’t understand that why the FCF till infinity will cap at Rs.9731.25 Crs. If you are considering a terminal growth rate of 3.5% I think it should keep compounding and not saturating to zero.
Abhiveer, this is a good question. I\’m not sure about this, but mostly this will have something to do with the mathematical derivation, but then there has to be a business explanation as well. I\’ll try and find out.
Thank you, Karthik Rangappa and zerodha. I learnt a lot from your modules in my journey to financial freedom.
Karthik Rangappa sir, At the end of this chapter you have provided a link to download excel sheet to calculate DCF model for other companies. But, it\’s not working, can you please provide a new link or make it to work.
Thank you for your hard work.
Thanks Jaswanth. Can you please try downloading this from a different browser?
What should we do if the FCF comes out to be negative
You cannot apply DCF in such cases.
Thank you so much for brief lessons. I can not download DCF Model on ARBL excel. Could you please send it on my email address?
Thanks Amol. Can you please try downloading from another browser? That usually works.
I found many research papers have taken cash flow as PAT + Adjustment of on cash items such as Depreciation etc.
I think it is more accurate than Cash flow from operating activities as PAT is the final output after paying all items including interest . Further if we adjust noncash item to it , it reflects true cash flow position . Can we take it for cash flow measurement ? What is your views on this?
Sure, like I\’ve mentioned most of the things in DCF and financial modelling is art, so feel free to use inputs that you think makes sense.
Hi Karthik,
Thank You so much for sharing such an invaluable content. For some reason, I was unable to download the Excel shared to calculate DCF. It would be great if you could help us with it.
Thanks,
Mayank
Thanks Mayank. Can you please try downloading from another browser? Thanks.
Net Debt = Total liabilities – Cash and cash equivalents.
can i take cash and cash equivalents as Cash + Reserves?
if i take only cash and cash equivalents then my net debt comes as positive for Cipla
and if i take reserves then it comes as negative?
Pls help me here.
No, dont include reserves in this.
I\’m Waiting For This Module And Thanks For Give My All Questions Answers ☺️.
Good luck, and happy learning 🙂
Hello Again 🤗🤠 Sir As You Say I clicked On Link And Start Learning About Modelling But In Second Chapter You Already cleared about BFSI sector Is Not Including Or Avoid So What Can I Do For Banking Sector Because I Like To In Invest In Bank But Now How Can I Value?
Ah, for that you should do relative valuations. We will soon include that in Varsity 🙂
Hello Sir I Have One More Question I Can Take Net Debt As A Total Liabilities And Cash And Cash Balance As A Total Assets.
Nope. Net Debt = Total liabilities – Cash and cash equivalents.
Hello Sir🤗I Have A Small Request Can You Please Built DCF Model For 10 Years FCF. So I Can Calculate intrinsic Value Of Share More Accurately.
I Request Please Built It For Me If Possible It\’s My Humble Request.
Have you checked this – https://zerodha.com/varsity/module/financial-modelling/
Hello Kartik Sir,
Very happy with the quality of content you provide!
I\’ve the following question:
how would the FCF calculation will work( how would the formula look like to be precise) if the Company\’s cashflows are negative till date.
Thankyou,
Awaitng for you reply!
Thanks Siddharth, glad youb liked the quality of our content. FCF or for that matter DCF itself does not work when the cashflow is negative. You will have to use other modes of valuation, like relative valuation.
hey, not been able to download the dcf model file attached. is the link still working?
Yes, but can you check with another browser?
I think we shoud first calculate intrinsic value. If the stock price is not in fair value band, we can ignore knowing the company ratios and business in detail. It can save time. Will that be right approach ?
There is no right or wrong approch, if you think this works, then sure, please develop the framework.
Sir,
Regarding FCF, how we should calculate this? Should we need to look the cash flow statement for this? Do we require to note the \”Net cash flow from operative activities\” minus the \”Capital expenditure\”? Does the capital expenditure only signifies the tangible assets only and not intangible?
I would request if you could kindly be a little more elaborate.
Yes, have explained in detail in the Financial Modelling module – https://zerodha.com/varsity/module/financial-modelling/
Hi Karthik just wondering why you used only long term borrowings as total debt in the calculation for net debt.
Because the current liabilities is expected to be paid off within the current financial year.
I am unable to download DCF Model on ARBL provided in the above link –> http://zerodha.com/varsity/wp-content/uploads/2014/12/Module-3_Chapter-15_DCF-Model.xlsx
Thanks a lot, the posted content was really helpful and very well explained 🙂
Seems to be working fine, can you try downloading from another browser?
Sir ji after 10 years Amara Raja is trading around 1400 it means it took 10 years to double the money invested in it now this is not good even banks double in 10 years with all these good financials it did not perform that well investing in stock has to be some thing more than just number wisdom !
Of course, applies to stock market in general. But going by data and making rational data based decision is the next best think you can do.
Sorry.
Was able to download from the other link that you had shared.
Thank You
Ah, ok. Sure. Good luck 🙂
Not able to download the excel file.
Please try downloading from another browser.
Net Debt = 75.94 – 294.5
In this equation, you have considered only Long term borrowings. However Net debt is a summation of Current and Non Current liabilities. Which is 776.7.
Thats right, checking this though.
Please ignore this. I read previous comments and tried using different browser and it worked. Thank you
Ah, ok 🙂
Hello Karthik
I was trying to download the DCF model excel file through the hyperlink but it seems that the hyperlink is not working. I don\’t know if it\’s only for me or for everyone. Could you please check it?
I just did and it worked for me. Can you try downloading from another browser?
Hi,
Could you please share the excel for DCF, i am unable to get it through the above given link.
You can check that here – https://zerodha.com/varsity/module/financial-modelling/
Hi Karthik Sir,
Firstly, I would like to express my sincere gratitude for your dedication and commitment to teaching. Your efforts and teaching style have greatly contributed to my learning experience, and I truly appreciate the time and effort you invest in ensuring that we understand the material thoroughly. Thank you for your continued support and guidance.
I have calculate the share price of Asian paint using your excel sheet. Could you please verify it?
Net cash flow from operation activity 3683(FY21),986(FY22), 4193(FY23) and Capital Expenditure 282(FY21), 551(FY22), 1486(FY23).
Average cash flow is = 2194.3
First 5 year growth 18%
Last 5 year growth 10%
TGR 5%
DR 9%
TV 212229.9
Total Dept – 59
No of share 95.92
Share Price is 1283
Lower band 1154
Upper band 1411
Glad you liked the content, Madhav 🙂
About the calculation, I cant really comment. This would require me to do the math myself 🙂
Thank you, sir, for replying.
Could you please tell me how you calculate capital expenditures? For calculating the DCF model
For the financial year 2013–14, it was Rs. 330.3.
Rahul, the easiest way is to look at what the management guidelines is for the capex. They usually state that number explicitly.
Hello sir
Thanks for sharing this module.
DCF Model on ARBL, which you have built on Excel. I am not able to download. Could you please share the link again?
Rahul, can you try and use a different module to download the excel?
The DCF model excel link is not working sir
Try downloading from another browser?
Hi Karthik, I have doubt in section 15.4-Share price, during calculating net debt , for the current year total debt entry you have considered it as 75.94 crs viz long term debt as per ARBL\’s report. My question is why isnt short term debt of 8cr not added into current year\’s total debt. Thanks to Zerodha and you for teaching me everything a B-school educates.
Abhinay, thanks for that. Total debt should include both, can you please double check the numbers, I think I\’ve included it 🙂
link to excel not working
Please use another browser to download the excel.
Hi Karthik,
Why is increase in CWIP of Rs.423 crore not considered while calculating capex? Isn\’t CWIP included in capex?
I was analyzing the cash flow statement of IOCL for FY2022-23. Even there, the Expenditure on Construction Work in Progress was not considered while calculating capex for DCF valuation? What\’s the reason for the same?
Regards,
Sreyansh.
Have explained this in detail here – https://zerodha.com/varsity/module/financial-modelling/
Net Debt = Current Year Total Debt – Cash & Cash Balance.
But while giving certificate exam on varsity app the correct ans is :
Long term debt+short term debt – cash and cash equivalent.
As long term debt suggest, it will last more than 1yr so it won\’t make in current year.
You should consider today debt, Ashay.
working from another browser sir, thanks!
excel sheet link is not working sir
Can you please try downloading the excel sheet from another browser?
Thank you for making me understand FCF. How FCF will get affected after fixed or financial assets sale? Also, there will be intrinsic brand value associated to \’intrinsic stock value\’. Why only cash from operational activity is considered? can you please explain?
Cash from operations is what the business is supposed to generate, all other sources of cash generated is short term and does not really add any long term value to the business, including financial asset sale.
Hi Karthik Rangappa,
The Excel sheet link is not valid, couldn\’t able to download the sheet. Kindly change the link.
Ashok, can you try downloading from another browser?
Hi, I read that the Reverse DCF Model is a bit more accurate than the DCF model which has drawbacks related to the randomness associated with Discount rate and future cash flow growth % values.
Can we expect Zerodha Varsity tutorials for reverse DCF as well?
Yes, we can do that 🙂
Hi karthik,
From where I can get the current discount rate? any website or link.
How frequently it changes?
You can check the RBI webiste, they have rates updated on the portal.
To calculate the net present value for the terminal value we have used the time period of 10 years (= 9731.25 / (1+9%)^10 = Rs.4110.69 Crs) this has resulted in inflated present value for the terminal value. As the terminal value is the FCF after infinite time period i guess it will make sense if we use value greater than 10.
Yes, thats right, but always makes sense to assume conservative numbers.
Karthik sir, while calculating intrinsic value in case of ARBL you have taken non-current borrowings and only cash and cash equivalents why you have not taken short term borrowings and short term receivables in calculation?
Becuase short term liabilities are expected to be cleared anytime during the year and will not stay on the balance sheet like the non current borrowings.
Sure sir…
Sir for example we have q1 and q2 results for 23-24 fy ..so can we take avg fcf of these two quaters to calculate intrinsic value of share?
You can see how these numbers match for the previous year, same quarter and try if you can project a trend. This maybe be better I feel.
KARTHIK SIR ,
SIR I CHECKED AS PER 22-23 BALANCE SHEET NON CURRENT BORROWING IS OF 2159 CRORES AND CASH AND CASH EQUAILENT IS OF 1.23 CRORES AND EQUIRTY CAPITAL IS 148.91 CRORES ….PLS GUIDE ME ABOUT THIS SIR
MY SECOND QUESTION IS WE CALCULATE AVG FREE CASH FLOW OF THREE YEARS FOR INTRINSIC VALUE CALCUALTION….SUPPOSE I HAVE TO RAISE OR DECREASE STAKE IN ANY COMPANY HOW CAN I USE THE QUATERLY CASH FLOW TO KNOW THE INTRINSIC VALUE OF THAT COMPANY….SO THAT I CAN INCREASE OR DECREASE MY STAKE…
Kindly dont use caps while typing 🙂
So once you build a EQ research module, you will have to constant update it with numbers you get from company, thats how you can keep your model sharp.
KARTHIK SIR,
I HAVE CHECKED TWICE AND I HAVE ASSUMED 10% GROWTH RATE FOR 5 YRS 5% FOR NEXT 5 YRS….STILL THE VALUE IS 1520/-
SIR PLS LET ME KNOW IF I CAN SHARE YOU THE FIGURES AND SHEET…IT WILL BE VERY CONVINENT AND I LL GAIN CONFIDENCE IF MY CALCULATIONS ARE CORRECT….
Not just the growth rate in cash flows, Nitin. What about other parameters? Things like cost of debt, equity etc?
HII KARTHIK
I JUST CALCULATED INTRINSIC VALUE OF CPCL AND AS PER SHEET ITS COMING 4407/ AND CURRENTLY SHARE PRICE IS 680/- ….I DOUBT IF I M SOMEWHERE WRONG IN CALCULATION…HOW CAN I SHARE YOU THE DCF CALCULATION OF CPCL9CHENNAI PETROLEUM CORPORATION LIMITED)…PLZ LET ME KNOW
I dont have the caluclation, Nitin. But Please do double check the assumptions, you can get such valuation numbers when the assumptions are aggressive. Maybe you need to trim down your assumption.
I have some questions.
1. I guess you have mentioned in one of the comments that you keep your estimate very conservative, like not more than 20% FCF growth. But what if the company consistently produces more like 35 or 40% FCF growth like say Divis Lab. Would you still keep at 20% for first 5 years? (I tried to do that and it skews the value)
2. What about companies that do not show consistent FCF growth or say like lower 5% CAGR? In that case would you say DCF is not a good method to analyse in such conditions?
3. I guess you have mentioned that we can consider selling the stock if it crosses the intrinsic value band. But as far as I have come across many books from great Investors, they have repeatedly suggested not to sell just based on high valuation alone until the fundamentals are intact. May I know your personal view on this?
4. You had suggested before that one should not hold stocks if it goes below certain point or else our portfolio would bleed. I came across your interview with smallcase recorded 4 years back and I guess you had told something like, you would like to see your stock value go down during tough times. So did anything change in your way of approach in these last 4 years. Just want to know so that I can learn from You.
(I read a lot Sir. But I can only ask these questions to you and you are really helping me a lot. Thanks)
1) You can start with a higher % value and taper it down as you move through the years.
2) If the cashflow is -ve, then DCF may not work well. You need to switch to relative valuations or something like that.
3) You can always trail your sell limit – as in when the stock trends up, keep increasing your stop loss threshold. In that way you keep locking in higher profits.
4) Not really, I still hold that thought.
Happy learning 🙂
Sir,
You have mentioned: FCF= Cash from operating activities – Capital expenditure.
You have taken the both the values from Cash Flow statement. While, \”Cash from operating activities\” is quite straight forward, please help with below for \”Capital Expenditure\”calculation:
(i) What are the line items that could be considered while calculating \”Capital Expenditure\”?
(ii) Like \”Purchse of tangible fixed assets\” is considered for ARBL, should it be diferent for different sectors? If yes, please help how to realize the which line item to consider?
(ii) Should we have to look for line items under \”Cash flow from investing activities\” for \”Capital Expenditure\” calculation?
1) Any long term capital used for expanding the business – investing in buildings, plants, machinery etc can be considered as CAPEX
2) Yes, it will be, and you will understand this only when you read about sectors. Check this – https://zerodha.com/varsity/module/sector-analysis/
3) You will get a better picture from the balance sheet.
This excel link does not work, please share it again.
Try downloading this from another browser?
Also, white considering total current debt what should I consider exactly from the balance sheet. For example:
Current Liabilities:
(a) Financial Liabilities:
(i) Lease liabilities
(ii) Trade payables
-total outstanding dues of micro enterprises and small enterprises
-total outstanding dues of creditors other than micro enterprises and small enterprises
(iii) Other financial liabilities
(b) Other current liabilities
(c) Provisions
(d) Current tax liabilities (net)
Out of these which one should be considered???
Please do check the links of banking chapter that I\’ve provided in your previous comment.
How to use this method to evaluate NBFC, or gold financing companies or Banks?
I\’d suggest you use the methods discussed under the banking chapters here – https://zerodha.com/varsity/module/sector-analysis/
Thanks 🙂
Hi Karthik,
I have the following queries. It would be great if you could help me by clarifying the same:
On what assumptions have we taken 18% and 10% as our future and discount rates?
While calculating net debt, why haven\’t we considered short-term borrowings under the current year\’s total debt?
Additionally, the entire calculation is based on historical + FCF. What if the company has had major capex spending and hasn\’t generated FCF for the past 2-3 years? This could be the case with companies that are expanding. In such situations, can we look at BV (Book Value) instead of intrinsic value to understand the valuation?
I\’m not able to download the Excel calculator. Could you please check if there is any error?
Also, I am extremely thankful to you and your entire team for these modules. I am really impressed with the detailed explanation of each module. This has surely helped me immensely.
Thanks and Regards,
Saurav
I think you may find all your answers here 🙂 – https://zerodha.com/varsity/module/financial-modelling/
In the Excel sheet the inflation rate is 3.5% but if you look at today\’s scenario last 10 years average inflation rate in India is around 5%. Can you suggest how to make modifications for the inflation rate as it can bring a lot of change in the intrinsic value?
Since its excel, you can change this to whatever number you think is relavent for today.
It has been around 10 years since the calculations were done by you using the dcf method, so can we keep the rates as 18% 10% 3.5% 9% in the Excel sheet or they need to be compulsorily changed from time to time?
You can change that as per the latest economic conditions 🙂
How to use dcf method for banks as they generate a negative cash flow?
You cannot use DCF for banks, Digvendra. But do check chapter 8 & 9 here – https://zerodha.com/varsity/module/sector-analysis/ , it will give you a sense of how to analyse banking as a sector.
Karthik Sir,
Not able to download the excel sheet , could you please check.
Thank you
Can you try downloading from another browser?
Thank you Sir for the quick response….the modules are very helpful in understanding many concepts in the Stock Market
Happy learning, Shwetha 🙂
Thank you Sir for the valuable information on DCF Model.
The Last Part of Net Debt and Cash and Cash Balance is a little confusing and information from the annual report/balance sheet of the mentioned example of Amara Raja BAtteries is not tallying..
Could you please guide me on the same.
Shwetha, actually we have dealt with it in complete detail here – https://zerodha.com/varsity/module/financial-modelling/
Sir the download link isn\’t working. Please
Do you want to try downloading another browser?
The FCF years are wrong, I think. 2011-12 has the FCF of 2012, sir.
Let me recheck, thanks.
Got it Sir.
\”We deduct the present-day debt from the enterprise value and add the present-day cash to give equity holders the free cash flow.\”
I guess this line says it all. So if the net debt value is positive, it means more debt than cash and hence need to be subtracted from the total PV of FCF. If net debt is negative, it means more cash than debt and hence need to be added back to the sum. Hope I\’m right.
Absolutely 🙂
1. I understand sir. But I\’m trying to understand whether the final formula is
Total Present Value of Free Cash flow + Net debt (Or) Total Present Value of Free Cash flow – Net Debt
2. What to do in case of positive Net debt value? Add or subtract. Thanks Sir.
Sathish – can you check this? Have discussed this in detail here – https://zerodha.com/varsity/chapter/fcff-fcfe/
\” This naturally has to be added to the total present value of free cash flows.
= Rs.6078.83 Crs – (Rs. 218.6 Crs)
= Rs.6297.43 Crs\”
The line says we should add but in the formula the figure gets subtracted. Is it because of the negative sign? If so should we add the number in case net debt value is a positive number? Thanks.
Its -ve of -ve, so its added back 🙂
Hi Karthik, why are we only considering the +ve cash flow difference for calculating share price? What about the assets like land, employees, etc? Why aren\’t these included in share price calculation?
DCF does not work if the cash flow is -ve, Siddharth.
Sir,
can you please share the link to download DCF model as it is not working
Checking this.
Hello, you have taken 10 years from 2014 when you were calculating terminal year and taken the values of 2024 to grow at 5% (let say). But today, as in 2023 I follow your model, then the calculations will become very different and stock price too. Can you please explain.
Yes, thats right. With such equity models, you need to update the model as and when new information comes in, which in that case is quarterly. So if you are updating the model, then the model will stay relevant so does your output. Have spoken more about it here – https://zerodha.com/varsity/module/financial-modelling/
I can\’t download dcf model
Try using a different browser, Punit.
Hi Karthik,
So for a matured companies like Infy, TCS etc which has already grown over 20yrs , how should we evaluate the value. Is it only the terminal value calculation to br done for these companies or both growth rate and terminal value?
Thats right, but for such companies, ensure you have conservative growth numbers as expecting them to grow at a higher rate may not be practical.
Hi, why is CWIP not considered when calculating free cash flow? As CWIP is also an item of capital expenditure. Shouldn\’t the formula be free cash flow = cash flow from operations – (fixed asset + capital work in progress)? As we can see in the cash flow statement of ARBL fy13-14 there is a cash outflow of 42.3 Cr under line item CWIP.
Thank you for responding in advance.
One way to think about it CWIP is that its a budget of sorts, may increase/decrease based on execution. So best to consider just fixed assets
Hi kartik Rangappa Sir,
can you please explain the concept of net debt on page 162, I didn\’t get it.
And why do we need to add it to the sum of the present values of the cash flows?
Net debt tells you how much money the company has once all the debt is paid off. It gives you a sense of how the company is positioned wrt to leverage. We add net debt to PV to get true value of the company by assuming that all the debt is paid off.
Thanks a lot sir. Finally found out that the reason for error.
When input \” 517.12 *(1+ 3.5%) / (9% – 3.5%)\” the answer was 6162.56
Instead if I input \”517.12*(1+3.5%)/ (9-3.5)%\” the answer is right(9731.25). The way I input the % sign was all I need to change.
No error if I do it directly in excel sheet though.
Ah ok. Good luck 🙂
\”Terminal Value = FCF * (1 + Terminal Growth Rate) / (Discount Rate – Terminal growth rate)
Do note, the FCF used in the terminal value calculation is that of the 10th year. Let us calculate the terminal value for ARBL considering a discount rate of 9% and terminal growth rate of 3.5% :
= 517.12 *(1+ 3.5%) / (9% – 3.5%)
= Rs.9731.25 Crs\”
Sir if I calculate the above numbers, I get 6162.56. I tried with changing brackets in scientific calculator as well. Could you tell me where the error was in my calculation?
Sathish, here are the steps –
517.12*(1+3.5%)
=535.2192
535.2192/5.5%
=9731.25
Quite straight forward, not sure where you are going wrong.
I have 3 questions.
1. Why is the discount rate 9%. Can I keep the same discount rate for all stock calculations?
2. I calculated the net present value of Free cash Flow from the last table. It seems that there is a slight difference for only those last 5 entries of future cash flows with 10% growth rate and not the one with 18%. Any reason?
3. What is your personal opinion on PEG ratio? Is DCF better than PEG?
1) Discount rate is what prevails in the economy. Yes, you can keep the same discount rate for all stocks.
2) Hmm, very hard to point out the reason without looking at the entire calculation. I\’d suggest you review each step carefully once.
3) I\’d go with DCF.
Sir,
Could you kindly share the excel to calculate DCF for other companies as well?
Please check this module, Anirban – https://zerodha.com/varsity/module/financial-modelling/
When I tried calculating DCF for some of the stocks I got confused with the cash balance and Net Debt value. Even the growth % for 5 years can it be taken as current 3yr CAGR Growth (Revenue)?
If you can send some more examples from current year it will be helpful for me. I am non financial background. But reading this course is helping me understand investments and Finance.
Yes, you can break the 5 years into 2 parts and assign two growth rates (for 3 yrs and then for 2 yrs). I\’ll try and figure more example 🙂
Thanks Karthik.
Happy learning, Manish.
Hi Karthik,
As per the question asked by Saratharni D \”Can there be a huge difference in intrinsic values calculated using different methods, where one gives Rs1400 and another Rs550\” and you told that it\’s possible as no two methods lead to same result. In that case which one to assume correct as we will make buying decision based on it
Manish, sorry, for some reason I saw 1400 and 1550 and not 550. Such a huge difference should not be there. If there is a difference, then you need to re-evaluate the models to see if the assumptions are ok. But anyway, as fas as picking one model – I\’d suggest you pick the one basis the conviction you have on the model. For example, if I feel my DCF model is robust, then I\’ll go with the DCF over relative valuation.
Thanks for your reply. Kindly clarify this one point. Can there be a huge difference in intrinsic values calculated using different methods, where one gives Rs1400 and another Rs550? In my opinion No. If you say Yes, then to what extend we can rely on it?
There could be, no two methods that will lead you to the same result. If fact the same methods by two different analysts will lead you to different results.
Calculated the intrinsic value of Metropolis Healthcare (CMP was Rs.1301 as on 28Jan23) by following what is explained here. I got Rs.1756.47 as intrinsic value. But as per the TicketTape, accessed through Kite app, the intrinsic value is higher than CMP. I used the ARBL sample template you provided here and used the corresponding numbers of Metropolis.
Can you please help me figure out the error?
Its possible that different ppl get different intrinsic values. This is because the assumptions are different. The accurateness of the intrinsic value really depends on how well your assumptions are. The more conservative the better in my opinion.
Yeah it was negitive As for the latest year 2022 their capital expenditure is 148cr higher than their net cashflow from operating activities
Ok. So that explains right? Do check the module on financial modeling.
Hi Karthik,
How to do intrinsic value calculation incase 3 yr average free cash flow is in negitive.
Regards
That wont be possible, Manish. While you can\’t use DCF, you can use the comparable or relative valuation method.
Hi Karthik, looking forward to your response. Thank you.
Sorry, I must have missed this query. Can you repost the same please?
Calculated the intrinsic value of a particular share of a company (say ABC Ltd, CMP is Rs.1200) by following what is explained here. I got a value, say Rs.1500 as intrinsic value. But the TicketTape, accessed through Kite app, shows the intrinsic value as Rs.850. I used the ARBL sample template you provided here and used the corresponding numbers of ABC Ltd.
Can you please help me figure out the error?
Thank u sir for ur so much effort for making us aware of these finance terms, always grateful to you…
Because of varsity im a lifetime zerodhas customer
Happy learning, Bharath 🙂
How can i know the current risk free rate (discount rate) to consider ?
You can check RBI\’s website for the 91 of 180-day t bill rates.
Hi Karthik,
I am very impressed with the content and happy to be the part of this learning. Just now did my first FA (Stage 1 to 3). Now feeling bit confident that before putting money in companies, I know how to evaluate. Thanks for all this.
One query – In \”15.6 –Spotting buying opportunities\” you mentioned that Amaraja batteries is currently trading at price much higher than it\’s upper intrinsic value.So suggestion is not to purchase here – I understand but what if it\’s \”investible grade attributes\” are still intact ? should we wait for price to come down (It may not come down if it\’s investible grade attribute is quite good)?
Regards,
Manish
Thats right, Manish. If the attributes remain intact, then you can wait to buy at a better price, which gives you a better margin of safety.
Hi Karthik,
What\’s assumption behind taking the discount rate at 9% ?
Basically, the risk-free rate prevailing in the economy at that point.
Hello Karthik!
Thank you so much for your wonderful lessons. It is really helpful.
I am facing challenge in understanding the estimated FCF as i can see that currently for year 2021-22 the actual figures are totally different.
the concern here is that the estimated future cash flow we calculated here is nowhere closer to the actual figures.
In fact the actual figures are negative.
Not sure if i understood this topic correctly.
Gaurav, so if the FCF is -ve, there is no way DCF will work.
Hi Karthik,
How do we approach calculating the Average Free Cash Flows when Operating Cash for a con for last 3 years are negative? In this scenario, will the Avg free cash flows arrived at be of any use to calculate the future cash flows?
thanks
Aditya
For example KOEL :- The Operating cash from 2020 to 2022 has bene nagative.
Its not possible, Aditya. DCF works well when the cash flow is +ve.
how to calculate constant currency revenue growth of IT company
You will have to fix a Dollar value to Rupee and assume its constant.
Hi Karthik,
\”This also means that as long as the company exists, some amount of free cash is generated. However, as companies mature, the rate at which free cash is generated starts to diminish.\” what does it mean. Does it mean that DCF not applicable for already matured companies as they are already there for a long time (more than 10 yrs) so we can\’t take 15% and 10% growth rate for first 5 and second 5 years respectively and only Terminal Growth Rate is applicable ?
It does exist, but the rate at which the FCF generates is lesser and you can apply DCF as long as there is a +ve rate of cashflow.
unable to down load dcf calculator
Try downloading from another browser.
I have downloaded it from another browser..
Thank you so much Karthik Sir for helping us.
Sure, good luck 🙂
Hello Sir,
This \”download\” link for excel is not working. Plz help..
Thanks!
Navdip, please try downloading from another browser.
Hi Karthik, I am unable to download the excel sheet. Please help..
Can you please try downloading from another browser?
I can not download DCF model on ARBL. Can you send me on my e-mail address
You can also check this – https://zerodha.com/varsity/module/financial-modelling/
Hi,
Truly loved the content and the simplicity with which you have explained it.
\”The link to excel sheet is no longer available. Could you please repost the same\”
Thanks
Thanks so much. Can you try downloading from another browser?
hello sir
How can we value business if it has low cash flows or negative cashflows.
You cannot use DCF to value companies in such cases. You will have to shift to other valuation techniques, such as the relative valuation.
very Thanks for your reply sir.Zerodha varsity is a school of knowledge to laymen.And you are teacher to thousands of students majorly india like me.
Happy learning, Srikanth!
hello sir
Shall we take FCF growth rate as 10 year indian g-sec rate+Country equity risk premium with respective to weighted average of particular company . For whatever time we are doing(using DCF 10 years later).
Yes, that would be even better 🙂
I think there are 3rd party sites that give you the country risk premium.
Hi Kartik, first of all the modules are extraordinary-Easy to understand, fun to read and apply! Thanks for the great effort you and the team have put in for these modules!
I had a query regarding calculation Free Cash Flows. Companies in their Cash Flow Statements use different names for Capital Expenditures-
Case in point-
1. IOCL has the head- i) Purchase of Property, Plant & Equipment and Intangible Assets – With intangible assets part of the head
2. Bajaj Auto has two heads- i) Capital expenditure on development of technical know-how and ii) Purchase of property, plant and equipment (including advances)
So which particular heads should be considered for Capex? Also should intangible assets be removed when the are part of PPE head?
Thanks Sreenath.
You can exclude intangible assets and include others as a part of CAPEX.
Hello can\’t download the excel file for DCF analysis
Working on it.
I have one question , I am quite new in Finance and I am trying to understand the valuation of capital intensive companies wherein cash flows from operations is not that much but debt is high every year and it turns average free cash flow comes out to be negative. What is your take on it . How we have to deal for calculating the FV.. Can you please help by taking any example and show the valuation for such company and your thoughts.. Also , are there any online courses by instructors on it ?
You need to project CAPEX and see if the company will do in the future. Have discussed it here – https://zerodha.com/varsity/chapter/asset-schedule/
Hello Karthik Sir,
Hope you\’re fine and doing well?
Then, I have a doubt.
When you say,
Share Price = Total Present Value of Free Cash flow / Total Number of shares.
Which metric exactly should we take that is closest to the total number of shares?
Free float shares?
Or should it include shares held by Promoters, DII\’s and FII\’s.?
Regards.
You need to consider the total outstanding shares in the market. I\’d suggest you read this module for a full charity https://zerodha.com/varsity/module/financial-modelling/
Sir the download button is not working.
Thank you so much for such a quick reply sir I really appreciate your efforts to spread financial knowledge for free. I almost feel little guilty for getting all this knowledge for free.
So can you tell me what model applies on banks on NBFC?
I guess that\’s why net cash from operating activates for HDFC bank was negative(because it gives out loans and that comes under OA). I really had a very hard time subtracting that negative with negative value(capex, which of course will be negative.)
So negative cash from operating activities for a manufacturing companies should never be negative am I right Sir?
Mohit, you dont have to feel guilty and all; just feel free to ask 🙂
For banks and NBFC, you can use a modified DCF model, but its just that I\’ve never used it myself so I may not be the best person to explain it 🙂
CF from OA can be -ve, it implies the company\’s operations are not profitable. You need to watch out for such businesses.
Hello Karthik Sir, thank you so much for these modules i have few doubts regarding DCF calculations.
I am calculating Iv for HDFC bank but while calculating net debt I couldn\’t find any line item with long term debt it just has a single line item of borrowing also I want to ask why we do not consider short term debt as well?
2. Also while calculating FCF why we do not consider capex on other assets like purchase of intangible assets etc.
3. Why data is variable on ticker websites and in annual reports?
Mohit, debt plays a very different role for banks and NBFCs. Traditional DCF models will not work.
2) We do consider, right? Check this for a more detailed explanation – https://zerodha.com/varsity/chapter/fcff-fcfe/
3) Ah, I\’m not sure about this.
Hi Karthick,
Thanks for the DCF model.
1. For ARBL, since we are now in the Year 2022, if i want to use this model for the future 10 years, what should be my FCF for 1st 5 years and the next 5 yrs? Shall i assume with 10% for 10 years until 2032?
Krish, do check this module – https://zerodha.com/varsity/module/financial-modelling/ , I\’m discussing these things in detail.
Download button on this page is not working. It\’s clickable but doesn\’t download anything. Can you please check ?
Checking on this.
Hi Karthik,
Unable to download DCF primer excel sheet.
Krish, can you please check from an alternate browser?
Hi Unable to download the calculator
Can you please try another browser?
How to determine the growth rate at which we should increase free cash flows….can we assume the growth rate to be the growth rate at which the industry is growing or the revenue of the business has been growing historically?
I\’ve just started discussing growth rates and free cash flow in this module -https://zerodha.com/varsity/module/financial-modelling/ please keep track of it.
Hi, Mr karthick really sorry the mistake was mine I have made a mistake in this calculation. I have another question don\’t mistake me for asking silly questions am a beginner so I have some question which may looks silly for you really sorry for that, but i really learning many stuffs from this article really thank for zerodha and for you for supporting us.
Cash flow from investing activities – purchase of tangible fixed assets you have shown in this article
I just want to calculate tcs FCF but there\’s
# Purchase of investments*
# Payment including advances for acquiring right-of-use assets
# Payment for purchase of property, plant and equipment
Which one of this 3 we take it as capital expenditure.
*this think 3rd one might be the right one please clarify
Thank you
No problem at all. Please take a look at this chapter, I\’ve just started explaining FCFF and FCFE in detail – https://zerodha.com/varsity/chapter/fcff-fcfe/
Hi Kartik
for below query
for Intrinsic value calculation, do we need to look at consolidated PNL, Balance sheet, Cash Flow, or standalone
I suppose it should be standalone as the Number of shares that are traded is only on a standalone basis, not on a consolidated basis
Please clarify if I am wrong
u answered-Yes, it\’s the risk-free rate + a slight premium.
My question is how do u take a slight premium, is it like 1% or 2%?
Its consolidated statememts.
Premium is based on market trends. In a bullish market, it can be as much as 5%.
Hi Mr karthik if any of the average free cash flow is in negative then how to calculate it ?? We can consider this stock or we can avoid it kindly advice it. Thank you
Tcs (FCF)
2019-20 – 3776
2020-21 – 6433
2021- 22 – -2305
I don\’t think TCS has a -ve free cash flow to the firm. Can you please check the calculations again?
Hi Kartik
for Intrinsic value calculation, do we need to look at consolidated PNL, Balance sheet, Cash Flow, or standalone
I suppose it should be standalone as the Number of shares that are traded is only on a standalone basis, not on a consolidated basis
Please clarify if I am wrong
You need to look at the consolidated basis, Sarvesh. I\’ve tried to explain that here – https://zerodha.com/varsity/chapter/historical-data/
Hi Kartik
the 9% discount rate that u took in the terminal value calculation
have u taken a risk-free rate or like FD rates which were prevailing at that particular time (i mean while writing this chapter )
Yes, its the risk free rate + a slight premium.
For FCF calculation why did we just subtracted the Capex amount and not the debt and the finance cost on the debt?….Like practically we should take the net cash from all activities right because that\’s what is in the bank and will be available to the shareholders.
Tejas, check this – https://zerodha.com/varsity/chapter/fcff-fcfe/
Hi Karthik,
While studying DCF analysis, many doubts are coming. Please clarify two main doubts:
1. Step-2 \”Identify Growth Rate\”: Instead of assuming the rates, why we can not predict based on the past growth rates?
2. 10th year is the terminal year is noted, but while calculating it, we can not use the same for differently aged companies. How to deal with the companies of various ages?
Thank you,
Sanjay
Sanjay, I\’d suggest you read this module, especially towards the end. I\’ve just started discussing DCF in detail – https://zerodha.com/varsity/module/financial-modelling/
Sir, how could we get an inference using DCF from a company with a negative cash flow , for instance Manappuram finance
DCF wont help there, Bepin.
Hi Kartik
For calculating the present value of terminal value, why did u take a number of years as 10
Below is a statement that I am talking about
\”
to calculate the net present value for the terminal value. To calculate this, we simply discount the terminal value by the discount rate –
= 9731.25 / (1+9%)^10 ( Here is why u took it as 10?)
= Rs.4110.69 Crs
\”
Because we are moving 10 years forward and figuring out how the cashflow is likely to be at that point. Btw, keep track of the financial modeling module, we will cover DCF in detail.
Hi Kartik
Why discount rate in terminal value calculation is considered as 9%, any specific reason for this?
Or do we need to consider existing risk-free rates in markets like Fixed deposit rates or T bill rates?
Sarvesh, it was the basis of the rates which prevailed in the economy at that time. YOu need to review it from time to time.
I am not able to download the excel DCF model
Please try another browser.
Hey,
The link for downloading the excel sheet is broken I guess. it would be great if you could fix it.
Thanks for putting up a great module.
Ayush, please do check with another browser?
Hi Karthik,
First of all, thank you so much for your work, it is of tremendous value, it has been my companion in my learning journey.
My concern is that I am not able to download the excel file attached in this lesson, I click on it and nothing happens, can you please check the link? It will be really helpful if you can fix this please.
Hey Praful, glad you liked the content. Someone else had a similar issue with downloading, but he/she switched to a different browser and it worked.
Thanks for the insightful and lucid article!
I cannot download the Excel file for some reason. Can you please have a look at it?
Thanks,
Arun
Can you please check in a different browser?
Dear Mr.KR,
The quality of your content is outstanding, to put it mildly. Pl keep-up the good work!
I\’m afraid I could not find the DCF model in xl in this section.
Can you kindly share the same?
With warm regards
Jai ganesh
Thanks, Jai. I\’ll be sharing an elaborate DCF model in this module – https://zerodha.com/varsity/module/financial-modelling/
Sir What is the difference between DCF way of calculating intrinsic value and Ben Graham intrinsic formula? and which one should we preferred better and how to calculate the Margin of Safety. Please help
Both of their own set of advantages and disadvantages. I\’d prefer DCF.
Hello karthik,
I know I shouldn’t be asking for help on assignments, but since I was studying fundamental analysis on varisty and had this course so I wanted to get the doubt cleared.
So basically, given the input the question has given and as the stock price & no of shares is missing here, there is no way I can calculate the P/E in this question right? Only market cap and all the data I previously told is given by them
Hey Hardik, thats ok 🙂
No, you need stock price for sure which is missing.
Hello karthik,
Thank you for your response, I understand so basically, the 9% rate here is not the risk free rate right but WACC?
also karthik I’m currently doing an online course where there is an assignment, where the ask is to calculate the P/E multiple, however the data inputs they have given are market cap, Firm value, cash & eq, total debt, revenue, net income, EBITDA, EBIT, capex, and dividend. How can I calculate the PE ratio from this as stock price, no of shares are missing.
I don\’t know if I should be helping you with your assignments. Anyway, to get the number of shares you need share capital and the face value of the stock, since P/E = Price/Earnings and earnings = PAT/No of shares. Btw, you also need the stock price.
Hello karthik,
Thank you for Your reply.
In the first comment of the this comment thread, you have told somebody that 9% used here is the weighted average cost of capital (WACC). So I’m a little confused here? Is it WACC or risk free rate in the economy? The same 9% is used for discounting the terminal value also, so that’s also the risk free rate or WACC?
And lastly can you explain what WACC is please?
Looking forward to hearing from you soon.
Hey I\’m sorry, I got a bit confused with what you were asking. Yes, 9% is the rate at which the company gets its funding of both Debt and Equity. As you can imagine, it can change from company to company. I\’d suggest you keep track of the financial modelling module, I will be discussing this in more detail.
Hello Karthik, hope you are doing well.
Is the discount rate of 9% that you have used here the risk free rate in the economy? Is that why you’ve used it to discount the values back to the PV?
If not, can you please tell me what is this value of 9% and how was it computed?
Looking forward to hearing from you soon.
Best regards,
Hardik phagotra
Thats right Hardik. But the rates have now changed, so use as per the recent economic activity.
What discount rate should in take in the year 2022?
Keshav, please keep track of the financial modeling module. Will be updating the same.
Download link not working. Solve the issue ASAP. Need the excel.
free cash flow to equity = Cash from Operating Activities – Capital Expenditures + Net borrowings
should we omit net borrowings?
Not really.
Hi. The link for download is not working. Can you send me the excel on [email protected]?
Sir
In the DCF model, can the DISCOUNT RATE be treated as rate of inflation ?
Nope, not really.
Really enjoyed reading the module, but I\’m unable to download the DCF excel sheet.
Thanks, Karan. Let me check.
Thanks Karthik for your quick reply.
Can you please clarify whether \”gross block\” and \”cost/deemed cost\”(mentioned in the recent plant,propety and equipments notes in the financial statements) are same?
Note, they are different.
Hi Karthik,
For calculating the capEX, when we take the difference between the previous year and this year cost/deemed cost(2,243.22-1,807.56),it comes around 435.66.
But in the \”Cash flows from investing activities\”, \”Purchase of property, plant and equipment\” is mentioned as 386.61.If that difference can be taken as capEx,will that affect the calculation of buying price as capEx is involved in the buying price calculation.
If this difference cannot be taken as capEx,please guide me how to calculate the capEx.
PFB the financial statement snippet of the same
Note 3: Property, plant and equipment and capital work in progress (contd.)
—————————————————————————–
(A) Cost or deemed cost
———————————————–
Balance at March 31, 1,480.99
Additions – 339.44
Disposals/adjustments (12.87)
Balance at March 31, 2017 1,807.56
Additions 443.27
Disposals/adjustments (7.61)
Balance at March 31, 2018 2,243.22
(B) Accumulated depreciation and impairment
——————————————————–
Balance at March 31, 2016 133.04
Eliminated on disposal/adjustment of assets (2.52)
Depreciation expense 190.02
Balance at March 31, 2017 320.54
Eliminated on disposal of assets (4.59)
Depreciation expense 229.08
Balance at March 31, 2018 545.03
(C) Carrying amount
——————————————————
Balance at March 31, 2017 1,487.02
Balance at March 31, 2018 1,698.19
the cashflow statement
=======================
Cash flows from investing activities
————————————-
Purchase of property, plant and equipment (386.61)
I\’d suggest you keep track of this module – https://zerodha.com/varsity/module/financial-modelling/ will be discussing this and more.
Hi Karthik,
In one of the previous comments answered, you have stated that to calculate the capex,the increase in gross block(difference between this year and the previous year) can be taken.
In this \”ARBL\” example, the difference in gross block is (9892.76-6750.43)=3,142.33 only against \”Purchase of tangible assets\” is mentioned as \”3303.66\”.
Please explain how to calculate capex when it is not clearly mentioned in additional notes.
Thanks
Tamizh, if there is an increase in gross block, then it is understood as CAPEX increase. Its difficult to get the details on what the capex was spent on, maybe its included in MD&A. But you just assume (in this case) 3142.33 was spent. The difference maybe is the sell off in assets.
Hello Karthik,
The link to download DCF template is not working. Could you please make the DCF excel available?
Regards,
Akshay
I will check again. Meanwhile, can you please try in another browser? Thanks.
While Calculating the share price how to calculate total number of shares if face value is more than 1? Ex – Equity share capital is 10cr & face value is 2, so should I divide Total Present Value of FCF with 10cr or 5cr?
10Cr divided by 2 is the total number of shares i.e. 5Cr shares in this case.
Hi Kartik,
The link of DCF model download is not presenting the excel file. Please check.
YW6323
Let me check, meanwhile, you can also keep a tab on the latest module on Financial modeling, will be uploading a detailed one – https://zerodha.com/varsity/module/financial-modelling/
Hi karthik, I understand the FCF=Cash from operations – capex.
There may be two types of capex.
1. CAPEX made to maintain the existing business like replace machines, rejuvenate the existing factory etc. This will not add any value and we can not expect the increase in income. However, it will reduce the FCF.
2. CAPEX made to buy or establish new factory. This will add more value as it will create more income in future. This will also reduce FCF.
Both the above scenario are different. One is not beneficial and other is beneficial to the company.
Hence, while calculating the historic FCF and projecting it for the future, how to factor in these two different scenario.
Chandan, you can ignore the short-term capex for DCF.
Hi Kartik ,I was using this on Zomato but as FCF is negative for all consecutive years my ,all projected cashflows are negative ,what can be done in that case
YOu cannot value Zomato based on DCF, Akshay. You need a positive cash flow for DCF.
Net cash from operating activities is 2,787.50 for 2014 but why they using 278.7 for FCF calculation. Can anybody explain, please?
278.7 is in Crores. Numbers have been converted to crores.
Hi Karthik,
While analysing some companies, I could see the \”average free cash flow\” is negative. Can you let me know how the buying price can be calculated in these scenarios.
Its not possible to apply regular DCF for companies that have -ve cash flow. You will have to apply relative valuation techniques to get a sense of valuation.
Thank you sir for this informative content.
Sir in a bull market all good companies are overvalued.
How to do value investment in a bull market.
Anupam, it is tough to find value in a bull market. Most traders just ride on the momentum.
Hello Sir, The entire fundamental analysis course was wonderful. You explained all the details very elaboratively which helped us understand very well.
I had a few questions:
1. How did we get the the discount rate for the DCF model? You mentioned it as the opportunity cost of capital so, are we taking it as the risk free rate/treasury bill rate or we have assumed it some other way?
2. While calculating Free Cash Flows= Cash from Operating Activities – Capital Expenditures , why did we only subtracted the \”Purchase of Tangible Fixed Assets\” and not the \”Purchase of intangible fixed assets\” as well?
3. While conducting the research, how do you suggest we should look at the previous year values for the various figures like \’Cash from Operating activities\’ etc. We have to look at the annual reports of previous years right?
1) You can consider this as the opportunity cost
2) Ideally you should, but I guess there were none in this case
3) Yes, you need to look at the annual report. I\’d suggest you keep track of this module – https://zerodha.com/varsity/module/financial-modelling/ , covering all these topics and more.
Dear Karthik Ji,
Thanks for the valuable lessons you are providing us on Varsity, looking forward to learning more, we are waiting.
Small request- as you said…\” Please note, I have included a DCF Model on ARBL, which I have built on excel. You could download this and use it as a calculator for other companies as well.\”…..the excel sheet mentioned above is not available there, please make it available.
Regards,
Rajendra
Thanks, Rajendra. Its weird, I can download it, not sure why its not working at your end. Can you try a different browser, please?
Hi Sir…
DCF really well explained even a newbie can get it easily. pls share excel sheet of DCF model, unable to download from the in text link.
thanks.
Thanks, Kiran. I tried downloading and it worked. Can you please change the browser and check again?
Ah!, it works for me in Edge but not in Chrome, weird!. Thanks for the amazing lesson Karthik. Valuation is something I\’m pretty clueless at. I need to work through the chapter once again to fully grasp it. I\’m excited. Thanks once again!
Hi Karthik, the download link is not working for me. Possible to recheck it once? I\’d love to have that excel
Its working for me, Pradeep. I just checked 🙂
Hi Karthik, could you please check the download link once? I\’m not able to download the excel which you had created.
while calculating Future cash flows for ARBL 18% and 10% are taken. and while calculating present values it is discounted with 9%. why it is so?
These are two different rates, Manoj. One is the growth rate and the other is the discount rate.
Sir, for current year total debt you have considered only long term burrowing. is that enough or should it be total liabilities or total borrowing?
That\’s enough, Manjunath.
thank you so much kartik for your help and for replying, sorry i didnt notice that i have wrote three comment but actually i really need the answer for the third comment\”for the current year total debt you took 75.94 but actually if we add the non current liability and current liability then it will be 776.74 but i think you have take just long term borrowing so do we neeed to take only long term borrowing or here is some mistake?\”
Thats correct, dont take the non-current liability. Consider only the long term debt.
hi,for the current year total debt you took 75.94 but actually if we add the non current liability and currewnt liability then it will be 776.74 but i think you have take just long term borrowing so do we neeed to take only long term borrowing?
hi, i have one question , for arbl you have take net debt for the year 2014 75.94 cr but actually it was 776.74, so am i right here or is there any other angle that am missing
Net debt is after factoring in cash and investments. Not just the short/long term debt.
Hi sir,i have one question while taking the the capital expenditure ,why you only take expenditure of the purchase of tangible fixed asset not others?
If the company has a recurring intangible asset expense, then you should consider the same, Shanawaz.
Download Link is not working.
Can you please share the link for the chapter number also from where we can download the DCF model calculation sheet.
Aman, the chapters are arranged in a sequence, you can read one after another.
Hi Sir,
Can you please share the excel sheet where DCF model calculation has been made which I am unable to download.
Thanks
Amna Khandelwal
I\’m doing that in this module – https://zerodha.com/varsity/module/financial-modelling/
I am not able to download the excel sheet used for calculations. Kindly help.
Sir,
As you have said \”The blue highlight clearly shows that the stock was comfortable trading within the band for almost 5 months! You could have bought the stock anytime during the year. After buying, all you had to do was stay put for the returns to roll!\”
But if the stock price rise above upper limit of band shouldn\’t we look to sell,as the stock will be overvalued,but as the time flew the stock price is trading way more than the upper limit?why is it so
Please correct me if I am wrong
No, this is not a technical indicator, the decision to sell depends on how the business is doing. Its a fundamental call.
Hi, Karthik anna varsity helped me a lot to understand the market. Thanks for educating freely.
i had completed my MBA in 2020. I\’m looking for a career in finance.
Please help me should I join the investment banking side or private equity accounting or equity research side. which has good career growth in the coming decade.
Thanks for the kind words, Shiva. The easiest way is via equity research. You can always try and get in via EQ research and move your way through to Pvt Equity.
Download link is not working for the DCF excel, could you share it?
Hello chetta,
Could you explain the logic of denominator used in computing terminal value ? I could not see anyone explaining it… My question is why the guy who found the equation subtracted terminal growth rate from discounted rate ?
I think its a result of simplifying equations, just like the way it works in mathematics 🙂
You\’re right sir,I took face value 10 actually its 1 now DCF ..comes at 264 its overvalued compared to LTP of 696.
Cool, good luck, Chandu.
Sir if I do valuation for IRCTC now it might be overvalued but it is coming up with stocksplit
It trades at 600 after split
Before stocksplit assume DCF came at 1000 the stock was at 3000 levels it was overvalued now post split it\’s available at 600 and undervalued
Confused over this sir?
Stock split should not matter since you are anyway taking the latest face value in your DCF. The value of the share that you get factors in all these things. Please check your math again, ensure you have taken the correct stock split.
Sir I assume you\’ve heard company IEX
It came up IPO price was 1650 later on stock split of 1:10 it started trading at 165
Current LTP is 600
I done DCF intrinsic value came at 2500 levels
Is it undervalued
No peers to compare PE,PB
Since it\’s Monopoly business PE is 90 it\’s high ,but DCF is indicating it\’s undervalued
If there was no stock split share price would have been above 2000 now it\’s just 600 .
Hope you got my question.
Yeah, the problem with monopoly is that its very hard to estimate the true value. Anyway, from whatever I know, there is no way this company can be valued so much (personal opinion), please do recheck the math again 🙂
I have been able to understand all of it, thank you so much for putting this together. I am sure a lot of people are benefiting from this entire initiate.
I\’m happy to note that, Aashi. Hope you continue to enjoy reading through Varsity 🙂
i am not able to download that excel sheet provided at the very end. Could you pls provide an alternative for the same
Dear Team,
I am not able to download DCF sheet. please assist.
Thanks Karthik for such nice articles.
Formula:
Present values (PV) of the cash flows is = NPV of future free cash flows + PV of terminal value
Question is,
Why the terminal value is added in above formula to calculate present value of the cash flow.
This is based on the assumption that the company is an ongoing concern and will continue to exist for a long time. Hence we add the present value of the terminal value.
I got the answer of my second question from the last chapter. So this intrinsic value calculation is only valid for the current whole year only?
Yes, you need to calculate using the latest data.
Karthik,
1) As the AMARAJABAT was trading at Rs 726.70 at December, 2014. Its been 7 years and this stock never reached the intrinsic band(even in the 2020 market crash). So is it still wise for investor to wait till the price reach the intrinsic band? Or a chance once gone is forever gone?
2) This intrinsic value has to be calculated every year, right?(since every year data gets updated in the Annual Report)
1) YOu need to see if the business has moved like the way you anticipated. Price is secondary.
2) Yes, at least once a year after considering the latest information.
Hi, I am not able to download the DCF calculator from the link given above
Can try from another browser?
Hi,
In your calculations for intrinsic value, you have subtracted net debt from the cash flow sum to arrive at the net present value. However, in several other texts (for e.g., five rules of successful investing ), it has not been used at all. Only the cash flows have been used. Could you please clarify?
Sir will this formula not work please tell
The terminal value formula is correct. What I\’m trying to tell you is that you cant use this formula to time the market in terms of \’3 or 4 years. As in, you cant say, can I use the price value derived out of this formula for the next 3 years.
517.12 *(1+ 3.5%) / (9% – 3.5%)
= Rs.9731.25 Crs If for 5 years = 321.10 *(1+8%)/(9%-8%) =34678.8 Just guess
Hmm, ok. Cant really validate this.
What formula should be used in place of terminal value for short term?
We use terminal value only to find the fair price from a fundamental perspective. So identify the fair price and then take a call by comparing the fair price with the current market value.
sir thankyou for answering. All the values have been calculated in excel with 0% human error. Sir my question is this stock meets all your parameter and according to dcf its fair value is 50% to 100% from CMP. So my question is should i buy this stock or not. Buying this stock does not mean me buying this stock today. I am just trying to understand how do i conclude. so that i can buy stocks in the right industry and even better financial performance and having a long way to grow. Thankyou sir
If you are totally convinced with your calculations, then you have to put money in where your faith lies 🙂
My only suggestion – be doubly sure about everything before you invest.
CURRENT REPO RATE 4% SO IF i take discount at 7% and terminal at 1% still i get share price of 1768
sorry for posting so many comment this is my last. thankyou
Like I mentioned, it is best if you put these values in excel and get the final output. Else, it will be difficult to validate.
ALL VALUES TAKEN FROM BALANCE SHEET
sir i have not considered values in thousands so there might be fluctuation of 100 +-
SIR CONTUNING ABOVE COMMENT. one of the company is Grob tea co ltd
AVERAGE CASH FOR LAST THREE YRS = 3.5067 CR
growing cash at 18% CAGR for first five and 10% for next five for 10 yrs
TOTAL CASH GENERATED IN 10 YRS = 83.47 CR
PRESENT VALUE = 49.18 CR*
taking 3.5% as terminal growth rate and 9% discount rate
PRESENT VALUE OF TERMINAL VALUE=166.47 CR**
CASH AND CASH EQUVLANT FOR THE YEAR= 14.57 CR
DEBT FOR THE YEAR = 3 CR
EXCESS CASH =11.57CR***
*+**+***=227 CR
TOTAL SHARES =11 LAKHS AND 54 THOUSAND
DCF SHARE PRICE=1968
CURRENT PRICE = 1022.40
Possible, Manhar. It is best if you put these values in excel and check the share price.
sir i have applied this model on over 50 companies with market cap between 100 to 5000cr and same growth rate. Sir i noticed companies with good ROE,ROCE, low debt, low p/e , low p/b, growth in operating profit margin, growth in sales, good promoter holding and good eps i get a share price which is thrice or twice the current price. so sir how should i act upon the price i have found and what should be my next step. should i buy them just because they have 3x price according to dcf or something else. sir please suggest
Manhar, that\’s how it is in a bull market. It is very hard to find value stocks.
What is the terminal growth rate for five years?
Lalit, the terminal growth rate is for a much longer period, not valid for 5 years.
Hey Kartik, thank you for such brilliant articles on finance.
I am Omkar, a 22 yr old, engineering graduate.
As the due diligence process tells, to calculate all the financial ratios and read through the Annual report and then finally to use the DCF model. But, I felt compelled to use the DCF model on TCS, just as an experiment. To my shock, the stock price was a mere ~40 rupees. Can you please tell me whats the issue here. Below are the values I calculated and some I borrowed from websites like moneycontrol and screener.
Total PV of cash flow 17108.61
Total Debt 5697.00
Cash & Cash Balance 3412.00
Net Debt 2285.00
Share Capital 370.00
Face Value (INR) 1.00
Number of Shares 3752384706.00
Share Price (INR) 39.50
The numbers are grossly wrong, Omkar. I can\’t really point out where you\’d have gone wrong, but all I can suggest is you look at the numbers directly from the annual report. Make sure you are considering the consolidated numbers, and also ensure you are converting the numbers to Rupee crores.
Very very informative. Could you please tell what should we specifically take in Total Debt? Thanks so much.
The total debt itself includes both long term and short term debt, Dheeraj.
hey i cannot download the dcf excel sheet
I don\’t have any knowledge of excel
Hmm, it is quite easy to pick up excel Lalit. I\’d suggest you give it a try.
517.12*(1+3.5%)/(9%-3.5%)=6162.56 is this wrong calculation please tell me
I\’d suggest you put this on an excel, Lalit.
Sir You said I prefer to invest in companies where there is no government intervention and less competition
I was looking for pharma and sepciality chemicals where there is more competition
The growth for the sector was promising
Now should I need to ignore this companies because high competition and regulations
You need to strike a balance, Bharath. There are no industries where there is 0 Govt intervention.
No sir scanned for note/schedules it\’s not available
Sir and what to do when company invests more in capex than operating cash flow,in this case FCF will be negative
But companies FCF will be positive after taking other items in investing and financing activities.
Thats ok, its just that you won\’t be able to apply DCF here, you can apply other methods of valuation (relative valuations).
Sir for capital expenditure,I\’ve copied this from Rossari biotech 2021 annualreport and same with previous years.
Payments to acquire property, plant and equipment (including
Capital work in progress) and intangible assets,what to do in this case there is not even notes to take only capex for tangible fixed assets
How about analysts notes, Bharath?
Hi Karthik,
Link to download the excel file given in 15.7 Conclusion is not working.
Can you try another browser?
SIR IN 15.4
NET DEBT = CURRENT DEBT- CASH AND CASH BALANCE
1. so here is current debt long term debt + short term debt if not then please correct me
2. is cash and cash balance the cash generated from operation activity because for 2014 cash from operations is 275cr but you took here as 294 please correct me if i am wrong.
1) Yes
2) You need to take this from the balance sheet, not cash flow statement.
hello sir, if any company has negative free cash flow then how can we procced further??
YOu cant really do a DCF on this, Vishal.
once we buy a stock below its fair value do we need to sell it immediately above its fair value range, if not then till when do we hold it and when do we exit
You hold it till you think you\’ve get a fair price 🙂
At present can you tell me.what is the intrinsic value of amaraja battery Ltd.
I have calculated it as 116.9 per share price.
Ah, I\’ve not really updated the valuation module, Robichan 🙂
Hi Karthik, the download link for the excel seems to have some issue. Could you please fix that? Thanks
Checking on that, Attraya.
Hi Karthik, you’ve provided very simple presentation of concepts which are difficult to understand for people of non commerce background. Great work. Thanks a ton for the efforts put in.
Query: While trying to use a tool from Screener to add to my filter about the price based on intrinsic value (i.e based on FCF method), I found an inbuilt ratio Price to Average Free cash flow for 3 years per share in the Screener website itself. Can you pls guide if it is actually similar to what you mentioned in this chapter, except for 3 years as against 10 years mentioned in the Chapter?
Thanks GP. I\’m not sure if this is the same one. I need to check this, but from what I can concur, it seems to be similar to the price to cash flow ratio.
Hi Karthik.
I was calculating DCF for PGIL. The FCF of last 4 years turned out to be negative. Do we proceed further or how do we go about this? Even though the FCF is improving till now it is in negative only. Do we consider this as a red flag and eliminate this stock?
Hmm, no. Dont think you can apply DCF to companies that have -ve cash flow.
The DCF excel sheet is not downloadable anymore.
Is there any alternative way to access it.
I\’d suggest you keep track of the latest module on financial modelling, it has/will have a detailed version of DCF.
Hello Sir,
I hope you are doing well.
How do I find a companies current order book?
You need to keep track of it quarter to quarter. Usually, the company will talk about it in the quarterly results.
How to calculate intrinsic value in case of banks share….as they give a lot of loans hence there cash flow from operating activities is mostly negative…..so how to calculate free cash flows as all answer will come in negative if taken as it is
As I\’ve stated in the chapter, it\’s a little tricky to apply DCF to banks. You will have to adopt other valuation techniques for banks and NBFCs.
Hey Karthik.
How exactly do you calculate the intrinsic value of a company when it has had Negative Free Cash flows in all of its previous years?
Thank you.
Classic DCF does not really work, you will have to value companies based on relative valuations or some other valuation technique.
Hello Sir,
I am asking about earning quarterly earning estimates about a company or future potential earning for a company?
Normally companies release estimates saying next few quarters may not be good etc or something like that.
I have not seen that with smaller companies.
Where could I find out street expectations for a company?
Ah, these are called earning guidance, not all companies give. But you can develop this yourself, things like financial modelling help in doing this.
Sir thanks for the valuable learning
unable to download the excel sheet of DCF please help
Sumit, can you please try another browser? Thanks.
Hello Sir,
Where can I find monthly sales results etc and quarterly estimates of a company?
For example I often find for large IT companies but what about smaller comapnies like Nippon India (result out soon)?
Monthly sales may not be available, but quarterly will be published by the company on their website when they announce their quarterly results. Quarterly results are important for all listed companies.
Hello.
Are there websites that calculate DCF automatically?
https://tradebrains.in/dcf-calculator/#:~:text=This%20is%20the%20intrinsic%20value%20estimate%20per%20share%20for%20Indian,by%20over%2074.45%25%20right%20now.
I found something like this
I\’m not sure, I\’ve never used this, so cant really comment.
I am not able to download the excel calculator placed at the end of this chapter.
Okay sir I agree, my bad.
I tried the same for Reliance Industries and in that case also I am getting a negative average FCF value. Am I missing something here?
Thank you in advance
Hmm, maybe Reliance has a negative FCF considering all the capex that they\’ve done? Can you cross check this from another source?
I was doing equity research on HDFC Bank. While doing DCF modelling and calculating average FCF of past 3 years (2019,2020,2021); the average FCF value comes out to be negative which leads to a negative NPV of the company. How is this possible? How should I proceed with this. Thank you in advance
Ali, I\’m not sure if you can apply this to banks, I\’ve mentioned this in the chapter as well.
Hi Sir,
i am unable to download the excel sheet , please share the active link to download the excel sheet.
Regards,
Sankar
Working fine for me. Can you try another browser?
Hi Karthik,
If the stock price is above the higher intrinsic value band, the stock is considered overvalued and cannot be bought. Instead of calculating the intrinsic band as the third step, can the intrinsic value can be calculated first so the stock can be ignored in the beginning itself.
You can, but for that, you will anyway need all the other information right?
IS DCF model applicable to analyse Banking or Financial sector to calculate intrinsic value? And what is the sector wise limitation of this model?
YOu can, its just that I\’ve not done it hence don\’t have much experience.
Hello Sir,
What exactly is capital expenditure?
Does investment and financial activity gets considered under capital expenditure?
To calculate FCF we require Cash flows from operational – capital expenditure.
The money that the company spends of expanding the business ( could be adding new plants, machinery, equipment) is called capital expenditure or just CAPEX. Yes, investing activity is usually capex.
Hi, for the calculation of Net Debt, for Current Year Total Debt it looks like you have only taken into account Long Term Borrowings. Why is that and should we also not include Short Term Borrowings?
Maybe I\’ve ignored it since it\’s a small amount. Anyway, total debt should be considered.
sir,
i have gone through the Module 3 Fundamental Analysis
i have understood the DCF calculation because of your clear and easy approach
can you please give your thoughts on Free cash flow to equity (FCFE) and Free cash flow to firm (FCFF) and their significance with their calcution (how to find FCFE & FCFF)
i am regularly checking your upcoming module i.e., Financial Modelling
thank you
Hey Nikhil, I\’d request you to keep tab on the latest module on Financial Modelling (which is work in progress), I will be discussing all these and more.
To Follow up,
What is the minimum amount that companies decide to keep in their reserve fund?
Like for example, a company would like to keep a minimum 10L in its reserves. Every year they slowly add to that amount, and eventually, it becomes 1 Cr in like 10 years. Is there an upper limit that companies like to maintain as a reserve fund?
Maybe instead of constantly increasing its reserves, it can give some to shareholders in the form of a dividend or invest it into some MFs or something?
No set number, really depends on the company.
Hello Sir,
I hope you are doing well.
How liquid is a companies Reserve fund?
Is it just kept stored in a bank account or where exactly is it kept?
Fairly liquid. Usually goes into banks, FDs, liquid funds etc.
Sir,
Would you tell me how to calculate free cash flow for Banks/FIs for the purpose of DCF analysis?
Thanks & Regards
Vinothini
Please keep an eye on this module, will be explaining this and more – https://zerodha.com/varsity/module/financial-modelling/
Hello Sir,
Do company promoters know who own their stock? When exactly do they know If I am a shareholder?
Do they keep a weekly check or monthly check?
They will know provided the share holding is large.
hi sir
just wanted to confirm opportunity cost and discount rate are bank fd rate
how do u assume terminal growth rate
Sort of. I\’ll explain this in more detail in the upcoming module on Financial modelling.
Hi,
I am not able to download the excel sheet you specified in the conclusion. Could you help me in getting a copy of that?
Not able to as in? Can you please tell me what is the issue?
Hi Karthik,
While calculating Free Cash Flow(FCF), Capital expenditures should be deducted from operational income. Nowadays, companies are indicating Net Cash Flow(NCF) which takes into account Cash from Investing activity as well as Cash from Financial activity. Considering the above circumstances, whether FCF or NCF should be used to calculate the future cash flows as shown above?
sir,
not able to download the DCF model through the download link given by you.
kindly check and provide the same.
thank you
Don\’t worry, the next module i.e. the module on Financial Modelling will have an elaborate section on DCF 🙂
Sorry for asking this but goI is government of India or gold* bonds?
Its Govt of India, Mohit. Gold bonds are called Sovereign Bonds.
It is 6.056%(10 year gold bond yield) right, but why not FD\’s or any other riskfree instrument? Is it because they are providing the highest rate of return with regard to riskfree instrument!
Only GoI bonds are considered risk free in its true sense. Hence.
Hello sir, what should be the discount rates for today\’s market and the reason or logic behind it. Should it be the FD rates for discounting?
You can consider the 10-year GOI bond yield as the discount rate, because its considered risk free 🙂
I am unable to download the DCF model excel. Please help
Ah, seems to be working fine. Try using another browser?
Hello, While calculating the terminal value on what basis the discount rate of 9% was assumed?
Roughly the risk-free rate prevailing in the market.
Hi Karthik,
First of all, thank you for providing knowledge cost-free when everyone else is busy making money out of it. I love reading your content.
My question is regarding DCF where we calculate average cash flow for last three/five years. I have seen with some companies having good +ve value of cash from operating activities but their capital expenditure is more that what they are generating from operations, in which case the net FCF becomes negative. Now it is difficult to apply the two stage FCF growth formula because the estimated FCF keeps decreasing beacuse of net -ve sign (-100 cr becomes -115 cr for 15% annual FCF growth).
How should one evaluate the intrinsic value in such cases. Also, can you cover some other methods regarding the fair price evaluation in some future modules.
Best wishes to you
In fact this is one of the drawbacks of DCF, i.e. you cant use it for -ve FCF. The next module is on Financial Modelling. I plan to discuss relative valuation there.
Hi,
This quite interesting, can u please share DCF model on excel?
Unable to download from above link.
We have a new module on Financial Modelling coming up, I\’d suggest you take the excel from that 🙂
Hello Sir,
Would you recommend investing in micro caps and small caps like that??
The only information we have is through the internet, and who knows what happens behind closes doors in those companies as they could be easily manipulated correct?
I\’d but after an extreme amount of due diligence.
Hello Sir,
In your Risk module you spoke about your missing out of Sundaram Clayton.
Back when the stock was 270, the market cap was roughly 500 cr. It was a microcap company.
I\’m trying to understand your thinking on why you decided to let go a well known stable company and safer bet like Bajaj Finserv and try to invest in a much much riskier Sundaram Clayton which was pretty much unknown.
What made you choose Sundaram clayton?? Considering it was a mirco cap, it could be easily be operated by market movers and cause problems considering its rise from 280 – 5000.
Could you please explain your thought process?
Salvan, Sundarm came from a solid background i.e. it belonged to the Sundaram group, which is quite well established. Plus it was an auto ancillary play, the sector was gaining some traction, plus it was available at a throw-away price.
Tata motors intrinsic value happens to come in negative. Could you please tell what a negative intrinsic value suggests?
And thank a lot for the excel sheet…..it has made things way easier.
Hmm, I suspect it can be negative. Can you please double-check the steps again?
Hi, I think there\’s a nee for more clarity on the choice of 9% as the Discount Rate while calculating Terminal Value.
1) Where did this 9% come from?
2) Is there a convention in choosing a particular %?
3) Does the Discount Rate change for the kind of company you\’re analysing in terms of sectors or life cycle of the company?
I think there\’s a void around this 9%.
Thanks in advance.
Aman, will share more clarity in the next module i.e. Financial modelling. But generally speaking, the discount rate should be equal to opportunity cost i.e risk-free rate + risk premium.
Dear Sir,
Unable to download excel sheet of DCF model.. Could you please provide the link..
Warm Regards..
Let me check. Meanwhile, the next module is on Financial modelling, which will be an elaborate affair anyway 🙂
Sir when will be financial modeling module out in varsity
Can we expect this month?
Sir do you suggest any other resources for learning valuations
I Will put up the first chapter in maybe 15-20 days, busy with a few other things.
Sir for banks and nbfc we can\’t use this model,I learnt one ev/edibta valuation where we can find target for next one year I applied NAV method which I learnt in college the intrinsic value came 26
I will share Ebidta valuation model
https://drive.google.com/file/d/1I1QDuFjanlta3gwZtdm58i3jzr8QXogn/view?usp=drivesdk
Thats right. Thanks for sharing. YEs, there is the EBITDA method and book value method as well.
Sir if Intrinsic value is 1498 we need to add 10% minus 10% and need to buy only in that range than what is the target
I thought we need to buy lower than intrinsic value and intrinsic value is the target
Not really, we use the intrinsic value to identify a price to invest in the stock. Once you buy, the decision to sell depends on your perspective of the business.
Thanks Karthi , that was always my thought. But setting up demat account with zerodha for NRI customers, in my case from USA is it lengthy process ? I know there are some formalities like PIS letter etc needs to be done. Also if i open account either in my father or mother name with zerodha, will there be any problem if i invest through that using my own money ?
Not really. For the broker, all that matters is that the money should come from the trading account holder\’s linked bank account.
Thanks Karthik. one more question please, currently living in USA and investing in stocks on monthly basis in us market. But planning to return to India in another 5 years. Being so should i stop investing in us market and start investing in indian stock market or i can continue to invest in usa stocsks till i am in usa and start investing in india once i am back ? Reason to ask , i am not sure what will be the difficulty in managing my stocks which i have invested in us market when i move to india and what will the impact of tax on dividends or stock profits for my us investment after moving to india. If you have any thoughts on this it will be really helpful to know.
Its a tough call, Ashok as there are many variables involved 🙂
Maybe have both legs open? Since the long term goal is India, maybe have 60% of assets here and 40% over there for geographical diversification? By the way, just to let you know. You can continue to invest in US even after you shift back to India via the LRS route – https://m.rbi.org.in/Scripts/FAQView.aspx?Id=115#Q1
Hi Sir,
I am calculating FCF for a company. Please find it\’s data below.
FY 17-18: CF from Operations: 682; Fixed assets purchased: -5,906
FY 18-19: CF from Operations: -4,347; Fixed assets purchased: -7,174
FY 19-20: CF from Operations: -1,451; Fixed assets purchased: -6,896
1. Can you please let me know what will be the FCF for the above the FYs? (iam little confused as there are negative values .For eg when i go by the formula 682- (-5906) = 6588 which becomes a positive number)
2. What does it mean if a company has a negative value for fixed assets purchased
3. If the company\’s cash flow from operations is negative, from where does the company takes cash to make investments on fixed assets
Joshua, usually in such cases, the debt component of the company will be high. There is no other way the company will have access to capital. Do check that once.
Sorry the downloading excel seems to be a issue with my chrome browser. I tried in IE and it worked. Also i have one question Karthik, this DCF calculation you explained and the figures to assume like growth rate etc, is only relevant for Indian stock market or it can be used for US market too ?
Ah, glad to note that Ashok. Think of it as a generic template. Can be applied to any company across the world.
Hi Karthik, Thanks for the article. I am not able to download the excel. Not sure if its just me facing that issue though.
Ah, let me check. I think I noticed someone else with a similar compliant.
Hi
Thanks for the enriching modules..
My doubt is that there\’ll be companies at different ages in the market like <5 years, 5-10yrs and more than 10years… If we are analysing a company more than 10years old then is this split growth rate concept for next 10 years still valid or should we just consider their terminal growth rate???
Depends on the growth opportunities of the company. For example, I\’d take the terminal rate for a company like ONGC and not really do the 2 stage process.
Hello Sir,
In Section 15.4 – The Share Price:
Total Debt =Long-term borrowings+ Short-term borrowings
But while calculating you have taken only \”Long-term borrowings\” of 75.947Crs, but not Short-term borrowings of \”8.383\”
Any reason behind that?
Please let me know.
Thank you.
I guess this is because you consider only non-current liability.
sir,thanks for your wonderful articles…..there is very much little content available on internet about valuation and dcf sir…i have gone through professor aswath damodaran youtube channel,although he did a great job it is a bit difficult to understand him….we will be really happy and thankful if your pen writes down about valuation sir.
I will try and do that, Mahesh.
hello sir, in websites like invtopedia free cash flow(FCF) is calculated as FCF=sales revenue-operating costs-taxes-net investment-change in working capital……Does your equation(used in this article) and this equation yield same output value…kindly explain sir.
Yes. Btw, I do plan to put up an entire module on valuations and DCF.
Sir,
Why some stocks have negative intrinsic value because of average 3 year FCF is negative?
Yup.
Why exactly did we use a discount rate of 9% here? Was it the risk free return rate of Government security back at that time?
Because of yes, I guess if applying the formula today, do we need to check what should be the discount rate now?
That\’s right, Ajay. You need to check the prevailing rate in the economy to get a sense of the discount rate.
IF A LARGE CO. GETS A FRUITFUL OPURNITY THEN IT CAN EXPAND FURTHER AND CAN PROVE MULTIBEGGAR ON ITS OWN. BUT THEN ALSO WHY IS SAID FOR LARGECAP THAT THEY ALREDY HAVE GROWN QUITE LARGE AND WILL NOT GIVE RETURNS LIKE MID OR SMALL CAP
Thats not true at all 🙂
Sir while I was calculating net debt for IOL CP in there balance sheet cash and cash equivalents was 28.09 crores and there was other particular called bank balance(other than cash and cash equivalents) 126.56 crores I checked notes it was mentioned fixed deposits in bank should I consider rt his for calculating net debt
FD is cash equivalent, yes, you should consider this.
In part 15.4, why did you take current year total debt as 75.94? According to balance sheet, the long term borrowings are 75.94 Cr and short term borrowings are 83.83 Cr.
Since short term is current and long term is non-current, shouldn\’t we take the short term borrowings as current year total debt? Since it is to be settled in the current year?
The DCF model requires you to consider just the long term debt Ajay. Also, remember we consider the Enterprise value, where in short term debt is factored.
Can a stock have negative fair price by DCF if it has a lot of debt on it\’s books?
Nope, not possible.
Hello sir, I am not able to download the template. Could you please let me know if it is a problem from my side or the hyperlink is not working?
Ah, not sure why this is happening. Need to check on this.
Sir, How to calculate Intrinsic Value of a company which has negative free cash flows.
You cannot apply DCF here, hence you need to look at comparable or relative valuation techniques.
Hi Karthik,
1. Why we have used the discount rate(9%) 2 times to calculate the Terminal value?
-> one time while calculating the terminal value and other to discount it to PV
2. Why you have taken 10yr time frame to calculate the PV of the Terminal value?
Thanks in Advance.
Vinay
1) That\’s the PV of the terminal value and the present value of the future cash flow.
2) Terminal value incorporates all the future value after the 10-year time frame (or any time frame you\’d like to consider).
valuable lessons
I have 2 questions-
1. Why while calculating capital expenditures only expenditures on tangible assets are considered and not those on intangible assets?
2.What is the logic behind calculation of net debt and adding it to npv
1) Both can be considered for capital expenditure
2) You mean the enterprise value? That\’s because the debt holders have a higher claim on the company\’s value. But if its NPV you mean, remember all that matters in NPV is the amount of cash you have, hence.
= 209.7 + 262.99 + (51.6) / 3
=Rs.140.36 Crs how did u come up to this amount i calculated it over and over again but i count find the answer that u did plz reply need help no being able to understand this point
Hello on the Computation of net debt (Total debt for the year- cash & cash equivalents) you were not able to incorporate the short term debt on the total debt for the year does total debt should be 84.33.
YEs, you don\’t usually need to incorporate short term debt here.
How do you come up with the opportunity rate & discount rate of a company.
These are dependent of the risk of free money in the economy.
Hii, I have a query everything is okay but by what percentage should I expect my stock to grow. I am talking about CAGR, suppose I put every value according to model you mentioned and intrinsic value comes at 500-550. I am getting stock at 500. How will I estimate it\’s CAGR for a period of time say 10 years.
CAGR is historical. You need to have an estimate over the growth rate of the P&L, price is just a function of the market\’s demand and supply.
I tried to apply the formula \”FCF = Cash from Operating Activities – Capital Expenditures\” onto the SpiceJet\’s earnings. In their Consolidated Cash Flow Statement, the \”Cash from Operating Activities\” was clearly listed, but I could not find any line entry as \”Purchase of Tangible Fixed Assets\” or as Capital Expenditures.
In this case, how do you arrive at the second element of the equation?
YOu\’ll have to look at the increase in gross block and take the difference between this year and the previous year. That will give you capex.
hi sir, Thank you.
while calculating the net debt why only using Long term borrowings and not including Short term borrowings ?
Also can we include intangible assets also to calculate Free Cash Flow.
Thanks.
Short term is expected to get settled within the year, so no point taking the short term debt to perspective.
Karthik,
In the above example of ARBL intrinsic value band was at Rs 331 – Rs 405. When I did the DCF analysis (ARBL, 2019-20) with an average FCF of Rs 154.4 cr (FY 2011-12 to FY 2019-20, 9 year average), intrinsic value band came at Rs 361 – Rs 441. My questions are
1. For ARBL, consistently the stock price has been higher than the IVB (apart from the crash in March 2020). The investor who missed the opportunity at March 2020, when can he/she will be able to buy ARBL? Wouldn\’t it be an endless wait?
2. How important is IVB while picking a business to invest?
1) If you think the stock price is worth it at this price, you should go ahead and buy. No one can estimate the waiting part of investing 🙂
2) Quite important as it gives you a sense of how wide the intrinsic price band can fluctuate.
Cool Sir.
Good luck!
Sir, What Checklist/Points you will suggest to look into before investing in Mutual funds ?
Do look at the last few chapters to get a perspective. Have has been discussing the same 🙂
Got it Sir. Thanks for the clarification.
Good luck, Sunny.
OK Sir, means it does not matter whether there is a particular trend (uptrend or downtrend) or not (in the above example) you just have to take (Final Value/Beginning Value) ^ 1/n – 1 ?
Thats right, you only take the starting and the ending value over the time.
Sir, What will be the CAGR in this case over a 4 year period since there is no particular trend :
03/17 – 5,982.58
03/18 – 4,961.73
03/19 – 5,324.74
03/20 – 4,770.59
CAGR = (4770.59/5982.58)^1/4 – 1 = -5.5%
is this correct ?
Thats right. The investment has de grown over the years.
Yes Sir, this is the one.
Thanks alot.
Sir, in one of the comments you had once mentioned some website name for video courses and now I am not able to recall which website it was. Can you share the website name again ?
THis one? https://learnapp.co/home?
Thank You Sir.
Good luck, Sunny.
Why we assume the FCF growth rate??? Does we can\’t calculate the past 10 year growth rate and take that growth rate for future?????
You can take that as an average, Neeraj. However, the general expectation is that as the business matures, the growth rate tends to decline.
Ok Sir. Thanks.
Sir, How do you classify a company as a small cap/mid cap/large cap company ?
What cut-off market cap is usually followed ?
Doc check this – https://www.amfiindia.com/research-information/other-data/categorization-of-stocks . The top 100 companies are large-cap, 100 to 250 are midcaps, and beyond that are small caps.
can you explain on what basis should we consider the discount rate ?
Thanks.
Usually, the risk-free rate in the economy plus the risk premium of 2-3% works as the discount rate. This is a thumb rule though.
Sir, while calculating FCF why are we not considering investments in intangible fixed assets and only reducing the tangible assets investements from CFO ?
Tangible assets are linked to CAPEX, hence.
hi, quick question. How did you come up with current year total debt to be 75.94? That figure is same as Long-term borrowings of Non-current liabilities.
Yup. YOu can add both long term and short term debt to arrive at the total debt.
How to use it to calculate intrinsic value of a bank?
I\’m not really the right guy to answer this 🙂
What if the average free cash flow came negative? I am doing it for Reliance Industries ltd., it has negative average free cash flow for last 10 yrs too.
Unfortunately you cannot apply DCF to -ve cashflow situations. YOu will have to do a peer or relative valuations.
sir do we need to add tagible and intangible assets for capital expenditure or only tangible assets
Sorry, can you please share some context to this?
I have a questions,
When calculating \’Net Debt = 75.94 – 294.5\’ I can see from the balance sheet that only the Long Term Borrowings as taken. Why are the other current and non current liabilities not taken as part of this calculation?
You dont need to consider the short term liabilities (current liabilities) since these are expected to be get settled within a year.
Since there are some expenses related to intangible assets. If they are available can i consider it. I\’m trying to be as conservative as i can and i wanted to get as much as true value i can by removing all the expenses.
Yes, you can. Look for it in Óther expense\’ section in the liabilities side of the balance sheet.
2. debt needed to be repaid at some point. what I think is we are calculating how much money shareholder will be left with after all the expenses. In that case total debt is needed to be repaid not only current debt to know what is the true value that shareholder will get.
3. Capex is total expenses occured. In that case cost of intangible assets is also needed to be considered right? as company is paying for that also.
1) True
2) Hmm, but how will you aggregate the cost of intangible? For example, band building can be done via a celebrity endorsement.
Hi Karthik, i have few questions from this chapter.
1. why we calculated FCF for only 10 years? why not more than that?
2. Why you just removed net debt from total present value? why not total debt ?
3. why only purchases of fixed tangible assets are considered as expenses why not other expenses in investing expenses?
4. why terminal value is discounted back for only 10 years when it is calculated for infinite years?
1) You can. Remember, higher the number of years, higher is the modelling error. You need to strike a balance somewhere.
2) Debt has to be repaid at some point right?
3) The formula requires you to take only the CAPEX, which is the fixed tangible assets
4) To get the present value.
While calculating the Present Value for the Terminal Value, why do we discount it for 10 Years?
As the terminal value is the value that free cash flows will be generated till infinity.
Because we are looking at the terminal value itself from 10 years hence.
Where is the excel file? I am not getting it. Thank You
It is there right above the Key takeaways.
Dear sir.
How do you calculate Intrinsic value through DCF for housing finance companies like INDIABULLS, REPCO , PNB. All these companies have negative cash flow from operating activities from past 3-5 years. Is it possible?
The regular DCF method may not work, Virendra. I\’m not really sure about a good way to value these companies. Have been trying to put up some content around this, but that has not happened 🙁
Best article in wonderfully explaining DCF concept. I really love your other articles as well. Keep up the extraordinary work guys !!
Thanks, Sandeep, happy reading 🙂
Dear Karthik
Thanks for your inputs.
So in DCF model..for the Cash and Cash Balances & Long term debts..do i need to set the values as whatever being shown in latest year in the Balancesheet (the cumulative one)
OR
I have calculate the diferenece from Balance sheet (of the closing balance for this year and last year ) for Cash and Cash Balances & Long term debts and then will set them in the DCF model.
Please explain
Regards
Indranil
The common practice is to take the difference between the two years.
Karthik do we need to look at the cash and cash equivalents balance from the balance sheet or the one which is mentioned in the closing balance of cash and cash equivalents
This is actually derived from the cash flow, but yeah, the final number sits directly from cash flow to the balance sheet.
Yes…correct. I wish to calculate CAPEX using BS and PL statement.
The easiest way is to look at the netblock from the fixed asset side of balance sheet. That will give you CAPEX.
Dear Karthik
Please correct me if am wrong.
Balance sheet for the existing year comprises of the data where existing year\’s financial component gets added up on top of the cumulative performance till last year since balance sheet shows the overall performance of the company from the date of its incorporation.
So if we need to find existing year\’s debt and cash balance we need to subtract cummulative value of 2018 from cumulative value of 2019.
Am i thinking on the right track or i have to take whatever is shown in the balance sheet.
Please suggest.
Regards
Indranil
That\’s correct. The balance sheet is carried forward while the P&L/cash flow is for the current year. To get the difference (balance sheet) you need to subtract this year\’s from the previous year numbers.
Dear Karthik
One very basic doubt 🙂
When am taking these two below parametrs from Balance sheet for calculating the DCF , to reach the absolute value i have to subtract the last year values from this year value right..and then i have to include those values in the excel model
1)Longterm loan( secured+unsecured)
2)Cash & Cash Balance from the balance sheet
For Example : In Balancesheet if the values shown are like this
Longterm loan( 2019) : 76 Cr
Longterm loan( 2018) : 45 Cr
Then the absolute value for 2019 would be ( 76-45=31 Cr) and 31 Cr need to be added into the model ??
Kindly share your views.
Regards
Indranil
Why are you taking the difference? You should look at absolute values, right?
Hey Karthik!
Great work on the article…
Also, I wanted to ask that whether items like unclaimed dividends and money held by banks as margin will be added to the value of cash and cash equivalents in the DCF model ?
And if Current Maturity of Long-Term Debts will also be added to the amount of total debt ?
Looking forward for you reply 🙂
All of that will be covered in cash equivalent bit. You can actually check the notes associated with the cash equivalent bit to figure the details.
correct .. my bad
I didn\’t understand. how come the result is 9731.25 cr instead 97.31 cr ?
= 517.12 *(1+ 3.5%) / (9% – 3.5%)
= Rs.97.3125 Crs
could you please explain as 517.12 is already in crore
Hmm, I guess you are missing on some parenthesis. Can you please calculate the numerator and denominator separately and do the division again?
Yes…I understand but as you mentioned in your previous articles, the fixed assets reported on Balance sheet (PPE) are depreciated before posting on the sheet (the gross block concept). So..the capital expenditure will be equal to the change in PPE + Depreciated Amount. Don\’t you think so? Please don\’t confuse my question with your calculation…the purchase of fixed asset reported in cf statement is definitely equal to the Capex coz it is not depreciated? But just suppose a scenario where we have to calculate CAPEX using only the BL sheet and PL statement.
Hmm, I need to think through this. Is your intention to calculate CAPEX from BS & PL?
Hello
I didn\’t understand why didn\’t we add depreciation to the purchase of fixed assets while calculating CAPEX. Isn\’t CAPEX equal to change in PPE + Depreciation Expense?
But why do you want to add Depreciation to CAPEX? Isn\’t the purpose of CAPEX to give you a clear view on the actual spend? Remember depreciation is an accounting expense and it is treated separately in the expense side of P&L.
yes Karthik, i realised that , so changed that to 12% and 7% , got reasonable results.
Now my question is how do i decide this number for diff companies in diff sectors ?
Depends on your overall portfolio. If the idea is to have about 10-12 stocks, then 1 or 2 stocks per sector should do. Higher the number of stocks in the portfolio, higher the exposure.
I did this for coal india considering 2019 report as the starting point and i see outstanding shares at around 616 cr, eventually i get 48 as the intrinsic value which makes me believe i\’m doing something wrong . below is my data
Sr no Year growth rate FCF PV
1 2020 18 767 645.5685548
2 2021 18 905 761.7203939
3 2022 18 1067 898.0725528
4 2023 18 1260 1060.516792
5 2024 18 1486 1250.73647
6 2025 10 1634 1375.305109
7 2026 10 1798 1513.340628
8 2027 10 1977 1664.001347
9 2028 10 2175 1830.653985
10 2029 10 2393 2014.140224
11 TV 3.5 45066 37931.15058
Pulkit, 18% and 10% growth rate for a company like Coal India is too high, right?
Thanks Karthik for your overwhealming response…
1)For the total shares can we take the total outstading shares shown in the AR or we need to sustract the preferential shares from the same.
2)So by risk free rate do you mean by the 9% which has been taken into this calculation.
Regards
Indranil
1) Take the total shares, Indranil
2) No, you can consider the current risk free rate, around 5.5% – 6% I suppose.
Dear Karthik
Its was certainly a good Discussion.
I have few doubts from the above topic.indly share your inputs for the same.
1)I am unable to get the link of your excel file calculation.Can you kindly share it over here.
2)For calculating the total debt in the above calculation , do i need to take the long trm debt + short term debt.
3)Dont you feel the discounting rate shuld be current FD rate at bank, since thats the oppurtunity cost we are missing.
4)The total outstanding share which is shown over here..Can we take it from NSE website under List Issued Capital (Shares).Is it the normal shares or preferential included.
Thanks in advance for your reply.
Regards
Indranil Saha
1) Search for \’Download\’, and you\’ll get the link.
2) Long term debt
3) FD rate is also roughly equal to the risk-free rate in the economy
4) I\’ve not seen the NSE website, I\’d suggest you take the data from AR
thank u for reply.. i will go thru one more time.. if i have doubt i will ask for guidance.
Sure, please do.
Hello Sir, I hope you are doing well. I have below query with excel sheet(download form). Please guide.
1. To calculate DCF, should we refer company standalone balance sheet or consolidated balance sheet?
2. Also please guide about intrinsic value calculation. What reference/document to use
Thank you.
1) You need to look at the consolidated financials
2) We have discussed IV calculation in detail here, right?
I want for certification purpose…… that\’s why new registration is required an?
For that, you need to download the app on your phone. Certification is only with the app.
sir,I was calculating NET DEBT=Total DEBT-Cash & Cash equivalent,But TCS Company does not have any Borrowing.
So,can i Simply put Total Debt=0,and Find out Net Debt?
Yes, net debt = 0.
hello sir,I\’m calculating Free Cash Flow for TCS company,There CAGR of free cash flow is around 12% and it is also old company.
so,what Growth Value should i opt for first 5years and for another 5 years.
plz reply soon
Thankyou
You can look at a fairly constant growth value here, Sunny. Single digit maybe.
User new registration …..login or sign up….when will this new sign up will be open?
You do not need to register for Varsity, it is freely available for anyone to access.
When will u start with new registration plzz let me know?
What registration, Nishita?
Ah ok … Thanks Karthik
Hi Karthik,
Where can I get Beneish Score for free. Does Zerodha have any tool which can give me that score ?
Beneish scores require subscriptions from sites like guru focus … which is quite expensive. Thanks
We don\’t provide this, Sohan. You will have to look at fundamental data providers for this.
How is fair value calculated?
One of the techniques is the DCF method. Have explained the same in this module/chapter.
Morning karthik 😊
1.Here while assuming growth rate….. Is there any specific rate for different industries or business???
Like 18% to 10% for manufacturing sector
X% to Y% for Z sector….????
2.After calculating intransic value, we came to know that ARBL LTD is trading at very high level…..
In case what if ARBL LTD is trading at 500, and we know that it will grow further……..
Should we really drop or loose this trade only because of intransic value???
Thank you
1) Yes, it is dependent on the industry.
2) What is the fair value estimation based on your calculations? This really depends on that.
Sorry, terminal value not considered. Discounted cash flow calculated for 10yrs
So is it fine now?
Hi Karthik,
Thanks for the very useful module on the fundamental analysis. I have a very basic doubt, i learnt DCF method(before seeing Zeordha)
they are using current cash flow from operations for the calculation and terminal growth values are considered in the calculation.all else is the same. When i calculate the intrinsic value for TCS in that method it comes around 1082Rs. But, in our method it comes around 3178.9rs. there is huge difference since ,i dont understand if there is really two methods available. Can u pls clarify me?
Hi Karthik,
With respect to the Terminal Value, you mentioned that \”as companies mature, the rate at which the free cash is generated starts to diminish\”. But when we apply this to various existing companies, isn\’t this relative?
For example, a company like Maruti Suzuki is a quite established company and has been present for a long time. Is assuming a growth rate of 18% & 10% for 1-5 and 6-10 years respectively, followed by a growth rate of 3-4% correct? Isn\’t these companies already at a matured stage. Shouldn\’t we assume a growth rate of FCF of about ~5% from the 1st year itself for such companies?
Thanks
Absolutely. For companies such as this, you will have to look at the company\’s own trend and also the industry trend and take a call.
Hi. As you said towards the end of the chapter that there was a 5 months window to but ARBL stocks and stay put. Now considering that I am a long term investor, then while buying the stock, where should i put the stop loss ? Because if you see in the 5 months window, the stock price did go down and could have triggered my stop loss considering that I bought the stocks in the beginning of the window and set the trigger at the LOW of the candle patterns formed then (as suggested in TA).
You need to set exit criteria, Arjun. Your exit should be based on whether these criteria are triggered or not.
Thanks for the details Karthik! Can you please help me in understanding this analysis works well for which all industries or sectors.
Also Karthik, just wanted to know if possible for you to make me understand how loss making companies & companies with -ve cashflows are valued. In recent times, we\’ve seen many such companies grabing great deal from investors like PayTm & Flipkart.
Thanks in advance.
This can be applied to any simple business, but not banking and NBFCs. Unfortunately, for companies which make -ve cashflow, this cannot be used. You will have to use a relative valuation technique for this.
Hi Karthik,
What about the companies that are generating negative cash flow from operating activities. The DCF result of those companies will also be a negative figure which will also lead to a negative valuation at the end. Also how to determine the discount rate used for discounting the cashflow.
It would be great if you can help on this.
Thanks in advance!
Kapindar, you cannot apply DCF to companies with -ve cash flows. In fact, this is one of the drawbacks of DCF.
Hello Kartik,
Thanks for this interesting session. It helped me a lot in starting the research, however I\’m unsure if the said analysis will also work for the banking stocks. Unlike other companies, Banking companies have deposits on their balance sheet which is a huge liability & have the same features of borrowings.
It would be great, if you can throw some lights on it.
No, this will not work for Banks and NBFCs. I will try and find a source for this.
I think I failed to communicate my question correctly, In the net present Value calculation when we calculate the present value of the terminal value, i.e 9731.25 / (1+9%)^10 = Rs. 4110.69 Crs, shouldn\’t it rather be 9731.25 / (1+9%)^11= Rs. 3771.18 Crs as it is after the 10th year and the calculation for the 10th year has already been done in the table above it. (The power 10 should be changed to power 11).
I need to think through this, but intuitively, 10 makes sense as our point of reference is 10 years. But yeah, let me run through this again.
In the net present value calculation, shouldn\’t the power for terminal value be ^11 as it is after the tenth year and the tenth year cash flow present value has already been calculated in the table.
Terminal value is for perpetuity, so there is raise to time here.
Hi Karthik…
Hope you are all well in this difficult time…I have a question regarding TATACHEM…on calculating the intrinsic value using DCF, I got it about Rs1100…so why doesn\’t the stock look attractive to the investors…is it for the poor growth rate?
There could be multiple reasons –
1) Your model may be inaccurate
2) Maybe the market has not realised the true potential
3) Poor growth rates
4) Qualitative factors weighing heavily
Point is, DCF is just one metric to look at along with many others. DCF is not the only measure to base your investment on.
Ok..looking forward to seeing that module soon.
Thanks.
Yup.
Ok. I understand that currently there\’s no module on Relative Valuation techniques. Can you please share any source from where we can get more info about relative valuation techniques and how to use them?
Thanks.
Information is scattered Prateek, not available in 1 spot. YOu will have to search and assimilate. Will try my best to put up something on this soon.
Ok..so, if 3 years is too short and 10 years is too long..settle somewhere between 5 to 10 years for calculating TV depending on the nature of the business?
Thanks.
Yeah, unfortunately no right or wrong answers to this 🙂
But, I remember reading in some of your blog posts, that it is tricky projecting TV for more than 3 to 5 years considering the dynamic nature of businesses. So, I\’m a little confused.
Yes it is. However, 3 year data is too little for TV calculation.
Hi – While considering Terminal value, will it be more effective/realistic to use calculation based on total 5 years or should we stick to 10 years? If yes, in what ratio should we split the growth rates in 2 stages let\’s say for a growing company?
Thanks,
Prateek
Terminal value is more dependent on the terminal growth rate. I\’d suggest you take the 10 year period.
Hello Sir!
Thanks for the earlier reply.
While calculating Net debt I see that we used long term debt, shouldn\’t we use short term debt too.
i.e the current year total debt= Long term debt + short term debt
Thank You
Long term suffices, the short term debt includes working capital debt as well, which wont matter for net debt.
Hello!
You said Net Debt = Current Year Total Debt – Cash & Cash Balance
Here for ARBL, Current year debt was greater than cash & cash balance then why don\’t they pay off the debt with that money.
Thank You
That would be the compnay\’s call right 🙂
Hi,
I think there is an error. You mentioned that stock was trading a year back (A year back from the date at which this post was published) at fair price but you didn\’t considered that before that one year company didn\’t had the same cashflow and profit as it had on the date you wrote this. So how could that year old price be considered correct after an year.
But Shashank, isn\’t DCF based on forward-looking assumptions on cash flow?
Hi Karthik,
I was on the Net debt portion of the course, and just wanted to make sure that as for net debt we only consider Long term borrowings as you did on the example of ARBL.
Please advice
Yes, long term debt is what you need to consider
sir, plz provide valuation for Banking/NBFC
Not planned for now, but will consider.
Hi karthik,
For every company the growth rate is different based upon their life cycle. so we cant take 18% or 15% to every company.
So how can we find that certain company or industry is at growth stage, maturity stage in order to estimate their growth rate???
For eg:
You have valued the ARB stock in 2014 and used growth rate as 18%,now (2020) we cant assign the same rate.
Agree, therefore you need to tweek it according to the industry and company you are working on.
hey Karthik,
Assume I did my fundamental analysis, my background check and everything is satisfying from a long term investment perspective. At what percentage from the buying price should I put my stop-loss?
And also tell me if that stop-loss changes if we are at some crisis(like COVID-19).
When you buy at a margin of safety, its implied that you have a wide safety net. I know people who keep about 25% SL from the entry price, some with higher tolerance extend this up to 50%, so this depends on your risk perspective.
The COVID scenario is very different, SL does not help her, what helps is how well you know the company and your conviction on the business growth.
Hi Karthik – I understand the importance of Stage 1,2, and 3 analysis for long-term investment. I wanted to know whether we can possibly tweak and use Stage 2 and Stage 3 analysis for short-term trading i.e. 1-3 months?
Thanks,
Prateek
That would not be a great idea I think. Having said that, I\’ve not used, so I cannot really comment on it.
Got it thanks,
1-So considering today situation 5% cool but once the market recovers from corona we can take it back to 6.5-7 %?
2-I recently also finished reading Coffee can investing and foundout on twitter that smallcase had portfolio based on CCP but its not available now. Can you please check and if possible list any website which can help me filter stocks by the same criteria mentioned in the book because doinf it manually for 5000+ stocks is not practical. ( except screener )
Thanks a lot!
1) You will have to assess it from time to time perspective.
2) Not sure about that, but you can check with smallcase support, they will help you with it.
Hi,
Thanks for the analysis, really liked the way you have explained.
Please could you help me download the excel sheet.
Thanks in advance
Regards,
Prabhu
Its available at the end of the module, Prabhu.
Little late on the ride! Amazing content, but got 2 doubts.
1- Considering current risk free return rate is 6.35% as on 19 april 2020, you mentioned in the comments above to take 150-200 basis points, Which makes it roughly 8%. Then why do you recommend in the comment above to take it as 5%?
2- There seems to be little confusion in the comments regarding one should include short term borrowing while calculating net debt or not, please specify.
Thanks a lot for wonderful info!
1) Because of the times, we are living in, where growth rates are muted. 5-6% is not bad given the uncertainties around. Also, better to be conservative while calculating the intrinsic value
2) You can ignore the short term debt unless its way too large.
Happy reading!
Sir, my question is what is the reason for choosing 9%? And what should the present DR be since it would change over time.
Take the risk-free rate prevailing in the economy. That would be around 5% as of today.
What is the reason behind selecting 9% as Discount rate? In today\’s situation what should the DR be ?
Agreed, this was about 5 yrs ago 🙂
which method is reliable to find intrinsic value? DCF method or Ben Graham\’s intrinsic value formula?
Hard to call one more reliable over the other. End of the day, they are all susceptible to modelling errors.
Sir
Some people use historical P/E of the company to compute intrinsic value of a stock. As compared to DCF model, how much accurate is the historical P/E method for computing the intrinsic value of a stock ?
Do both the methods with give the same intrinsic value?
Thanks
I\’m not sure how historical PE can be used to get the intrinsic value of a stock.
Sir
Kindly include a module to determine the intrinsic value of stocks of banking sector and NBFCs also.
Thanks
Thanks, will try and do that.
Sir
In your reply to Sh. Harshad Salvi dt. 10 Dec 2014, you classified companies into Large, mid, small, micro cap etc. in terms of rupee value of market capitalization (500 crore, 2000 crore etc.) I think as per recent SEBI circular, the top 100 companies in terms of market cap are regarded as Large Cap, 101 to 250 companies in terms of market cap are regarded as Mid Cap, 251 and below are regarded as Small Cap companies irrespective of rupee value of market capitalization. Correct me if I am wrong.
Thanks
Yes, this classification came in in Oct 2018.
Sir
In the example above, growth rate of future cash flow is taken as 18% and 10% (for first five and next five years respectively) but discount rate is assumed as 9%. I think discount rate is inverse of growth rate. Correct me if I am wrong.
Secondly is there any concrete basis to take discount rate as 9% only, why not 1% which is even less than terminal growth rate?
Thanks
This is the growth rate of the free cash flow. Also, why do you think the discount rate should be inverse of growth rate? The thumb rule for discount rate is to take the risk-free rate in the economy.
Sir
I the example for calculation of Terminal Value, you have assumed discount rate (9%) which is greater than terminal growth rate (3.5%). What if discount rate is less than terminal growth rate, in that case (Discount rate – Terminal growth rate) will be negative ?
Thanks
Ah, that will be an interesting situation. However, my guess is that in such a scenario, the terminal growth rate will be lower than the discount rate. For example, in US the terminal growth rates is assumed sub 1% right now. By the way, this also depends on the industry and the specific company.
Hi Karthik,
Just a point-out.
Under the Share Price calculation, the Net Debt is given as Current Year Total Debt – Cash & Cash Balances. However, the Current year total debt points out to 8.38 Crore Rupees (Short term borrowings under Current Liabilities section) and not 75.49 Crore Rupees (Long term borrowings) in the FY14 ARBL Balance sheet. So the result for the Net Debt would be,
8.38 – 294.5 = (286.12) Crore Rupees.
Which would, in turn, produce the Total Present Value of Free Cash flow as,
6078.83 – (286.12) = 6364.95 Crore Rupees.
At last, the intrinsic value for a share would be,
Share Price = Total Present Value of Free Cash flow / Total Number of shares
Share Price = 6364.95/17.081 = Rs 372.63 per share
I notice that this is not much of a difference. But if anyone would mistakenly use the long term debt of a company (for instance, if that company\’s long term debt is too high) then it would affect the intrinsic value of the share thereby partially voiding the calculation done.
Please correct me if I am wrong. Thanks!!!
Thanks Harris for pointing this, I need to go through the numbers again, it been a while now.
Sir does this FCF analysis applies for all sectors or are there different valuation metrics for different sector companies ?
Yup, however, I\’d suggest you don\’t apply this for banking and NBFC.
Hii Mr.Karthik,
Firstly,huge THANK YOU for this entire Modules on stock market. I appreciate it.
Secondly, While calculating FCF the Capital expenditure was reffered to as \’Purchase of tangible fixed assets\’
why is that so ? Why other similar expenses have not taken into account ??
Capex is nothing but building/purchasing long term assets which is most commonly knows as tangible fixed assets. Other short term expenses, does not make an impact on long term valuations, hence the model tends to ignore that.
Does the above formula to calculate F.C.F applies for banking companies also ?
Hmm, this is not really best suited for Banking and NBFCs.
Hi Kartik,
I am using screener.in to screen the stocks and ideally want to get the required numbers from there itself instead of opening the annual reports, etc. Need to understand a few things:
1. For any company\’s balance sheet as shown here https://www.screener.in/company/CAPLIPOINT/consolidated/#balance-sheet – can you tell me the calculation for the Net Debt (which has to be put in the excel)
2. Screener also provides intrinsic value of each stock. Is that calculation reliable?
3. They also provide Graham Number – I see considerable difference between Graham Number and Intrinsic Value. Which is more reliable as a quick way to identify stocks trading below fair value?
1) Net Debt is short term +long term liabilities minus the cash and cash equivalent
2) I suppose so although I\’ve not used it myself
3) Both are different techniques, hard to choose one over the other
hi,
while calculating fcf
in RIL for last 3 years cap exp is more than cash from operating activites so fcf is negative for 3 years and even the IV is in negative
please help
Hmm, it is really complex to model a company like RIL, it has several moving parts to it, Vivan. You cant stick to conventional DCF technique here.
Hi Sir,
As we know that the lock down and virus has affected most of the companies – big and small. How can we still predict the growth of the company at this time. What growth rate percent do we use now?
I wish I had an answer to give you, Ayush 🙂
Hey great work there, really enjoyed learning
Though i have one question
Why is the share price of amara falling from 2015 when its fundamentals are so strong as researched by you? The company\’s profits are increasing year on end with no red signals in its financials and ratios yet the share hasnt been performing all these years
Ah, I\’ve not really looked at this stock after the module was done. Maybe there is new information which is not factored in.
Hey,
1. \”For example in case of ARBL, the latest year cash flow is negative at Rs.51.6 Crs. Clearly this is not a true representation of ARBL’s cash flow, hence for this reason it is always advisable to take the average free cash flow figures.\”
In the above statement you made, why do you say that the cash flow in minus is not a true representation of ARBL?
2. In case of IRCTC, I see that the cashflow has been in single digit for the last to last 2 years and for the last year it was in minus. So does this count as a heavy point enough to ignore investing in it?
1) Could be a one-off year…or could be cyclical. Hence average.
2) You need to see why this is -ve. Usually, the notes will have the reason for this. You need to look at this and assess to figure if this one-off year or is it because of a serious business issue.
1. While taking the growth rate, you advised to take 15% for the first 5 years and then 10% for the next 10 years. But shouldn\’t we take CAGR of growth rate for the past 5 years?
2. Why have you divided the terminal value by 10 while calculating its NPV?
1) This depends on the sector and the company. On hindsight, even 10% looks aggressive now. Yes, the CAGR helps. I\’d probably take the CAGR minus few basis points.
2) Hmm, I\’m unable to spot this in the NPV section
Hi Karthik,
Thanks a lot for all your inputs over the past few days. You sir, are truly amazing.
I had a couple more doubts on some qualitative aspects of a business. Would request your thoughts on the below.
How is the decision making different in a family run business than in a business run by a board?
While doing FA, how should I go about analysing this entire point of whether a company is run by a family or a board?
Would also request you to share your thoughts about a company that was started of as a family business and the family members still hold most of the shares, but they have kind of stepped into the background and appointed a board to manage the daily running of the business, e.g. Dabur.
Thanks,
Nikhil
1) Like a family, the head of the family makes a call here but with a board, the decision will be voted by the board members, so a big difference there 🙂
2) Look at the management structure and you\’ll know how the company is set up
3) Many in India are family led, promoter driven companies. Companies such as Nestle, Colgate, Bosch etc are board run businesses.
Thanks for the clarifications Karthik.
Hi Karthik,
I have a few doubts regarding the variables in the DCF Model.
1. What all should be included in Capital Expenses? In the ARBL example, you have only included \”Purchase of tangible assets\” but other purchases also cost money. Should these not be included under CapEx?
2. Total Debt – In the ARBL example, you have only included Long-term Debt. While analysing some balance sheet, I found that the Short term debt is way higher than the Long term debt for some companies. What\’s the rationale for not including short term debt.
3. Also, in most BS, there is an entry called \”Other financial liabilities\” under both current and non-current liabilites and the notes usually say these are loans and advances from creditors and others. Should these not be included as well under Total Debt?
4. Cash and Cash equivalents – Most BS have this entry along with another entry that says \”Bank balances other than Cash and Cash equivalents\”. Should these be included in the Cash and Cash equivalents for the DCF Model?
Thanks,
Nikhil
1) Usually, CAPEX involves purchasing of plants, adding machinery, land, and other heavy-duty expenditure. The idea with CAPEX is to figure how much the company is investing today in the business so that can reap its benefits in the coming years.
2) Hmmm, I think in ARBL\’s case there is no short term debt if not for very little
3) You can leave this since these are settled (or likely) to be settled within a year. Current item sorts.
4) Yes, the bank balance is cash
Hi Karthik,
I am really grateful to you for this module. The greatest benefit I got from this module was in differentiating between companies which have strong growth prospects and companies which have a sound business but the growth has kind of saturated.
A lot of companies I did FA on, cleared Stage 1 and 2. That reassured my belief that these companies are fundamentally strong. But after stage 3, I was just shocked at the valuation the DCF model gave. It was 4-5 times lower than the current share price.
Just to make sure I wasn\’t doing anything wrong, I rechecked it multiple times. I even went way too generous on the growth rates and made the discount rate very low. Also, reduced the debt to zero just for testing. Even then, the model\’s price was way lower than the current share price.
I think this was happening because I was looking mainly at blue Chip companies. What do you think?
Thanks,
Nikhil
Possible, Nikhil. The valuations have been a stretch for a lot of large-cap stocks.
I\’m getting totally confused.
What exactly is the confusion?
Hello
Can you explain the term of total present value of free cash flows. In above case net debt is added but sign is different (-).
Hmm, Vedant its explained in the chapter itself, right?
Ok. Will check back later for that.
Also, I was going through the comments made by other users and I came across one where you had mentioned that the valuation of Banks and finance companies is done in a different way.
Since HDFC is a finance company, I guess the DCF model won\’t come in handy.
Is there any new module for that in the pipeline currently?
Thanks,
Nikhil
That\’s right. Financial modelling is on the cards, I\’ve started preparing the groundwork for it, hopefully, should start posting chapters by early next year.
Hi Karthik,
There are no notes associated with the cash flow statement in the AR of FY19 for HDFC LTD.
Also, can you tell me how to reply on the same thread? I clicked on the \”reply\” below your comments but it is directing me to start a new thread.
Thanks,
Nikhil
Hmm, I\’m not sure about both actually, let me check 🙂
Hi Karthik,
I was comparing the Consolidated cash flow statement of HDFC LTD. for FY 17, 18 and 19 for the DCF model. I think HDFC went through some changes in accounting practices in 2019.
The net cash flow from operations for 2018 is 28333.23 cr in 2018 Annual report. However, it is shown as 3237.56 cr in 2019 Annual report.
How do we deal with such situations?
Thanks,
Nikhil
Hmm, did you check the notes associated with this for possible explanations?
sir
how long term ,will be considered if a stocks is being averaged over 2 years,
eg
a stock at 100 rs bought
1>40 qty in july 2018
2>60 qty in dec 2018
3>100 qty in nov 2019
and the avg cost of script is x/2
The ageing of the stock works on FIFO basis. The average is based on a value-weighted basis which is basically total Qty * Price / total Qty
Hi Karthik. Again thank you for the modules and its simplicity.
My question is regarding estimating average for FCF. You have used arithmetic mean (average) to estimate. Considering the fact that FCF values are quite extreme (form 200 levels to -51), would it help to take geometric mean instead for past 3-year values?
Similar question was asked earlier but that was on EBIDTA.
I\’ve not really tried the geometric mean, Rahul. Need to spend some thought on this.
Sir
Can you provide please other valuation model explanation in detail like EV/EBITDA model?
Which also may be helpful in calculation of IV of -ve FCF business.
Have been wanting to do that for a while, Jitu. Will add to this module.
Sir
I was calculating share price of ONGC through DCF analysis with growth rate 10 and 5%,terminal rate-2.5% and discount rate 9%.
Calculated share price was too too much then the current market price.
Sir pls give advice on assumption of growth rate each type of company like growth rate for matured company etc .
First time it seems we are speculating while going through DCF analysis.
Jitu, for a well-established company 10% growth rate can be a bit on the higher side. Maybe 7-8% is more likely.
Thank You 🙂
Hey Karthik,
As mentioned in the Financial Ratios analysis Part 2 the formula for Total debt is = Long term+ Short Term borrowings
but while calculating the Net debt which is Current year total debt- Cash and Cash Balance in the equity research part 2 the value of current year total debt is given as 79.54 Crs which is only the long term borrowing.
Ram, current debt formula considers only long term debt into consideration and not the short term debt.
Firstly, thanks a lot sir for this wonderful material which deals right from the very basics to the expert level. It has helped many amateurs, like me, to come in terms of the share market.
Sir, I wanted to know what is actually the discount rate which we have assumed at 9% in the given module of FA?
Thanks for the kind words, Suman.
The discount rate is usually the risk-free rate in the economy plus a few additional % points. For example, if the risk-free rate is 8%, the discount rate can be around 10-11%.
In first image cash flow from operating Activities for FY14 is different from the next snapshot data of cash flow from operating activities(green highlight) for same FY , Why?
They both are different, Vinay. The first image is the Free cash flow (FCF) which we calculate while the 2nd is the operating cash flow which the company reports.
how to decied discount rate of and terminal growth rate?
The discount rate is usually the cost of capital, approximately in the region of 10-12%. The terminal growth rate is usually the long term inflation average.
Hello Karthik,
i have doubt on calculating net debt, in that we need to take both current and non current liability or only non current liability ?
from your explanation you took non current liability. Please let me which is correct formula ?
Manu, Net Debt = Long term debt + short term debt – cash & cash eqyivalents.
So yeah, you need to take both.
Hello Karthik Sir,
I have one doubt , while calculating using this formula ( FCF = Cash from Operating Activities – Capital Expenditure).
In capital expenditure why we are considering purchase of fixed tangible asset .Because few company will buy asset and few will not buy they will keep cash idle .Buying asset also will added value addition to the company right.
This will add large impact in intrinsic value.
How free cash flow will be linked to share value ?
Yes, but that is a cash outflow, right? Remember, the objective here is to find out the free cash after all the CAPEX.
Sir, can you please explain how to calculate total debt.You have mentioned in one of the above comments that total debt=Long term borrowings(in non current liabilities)+short term borr.(in current liabilities). But in the illustrated calculation of net debt you choose 75.94 Cr as total debt(which is only long term borrowings of AMRL),it has to be long +short term borrowings right? i.e 75.9+8.3Cr =84Cr, where 8.3Cr is a number obtained from short term borrowings of annual report.
*total debt refers to current year total debt in the above query
Net debt is essentially total debt minus cash and cash equivalents. Net debt is different from total debt.
Karthik do you think that the growth rate for very small cap companies like INOX Leisure should be more than 18% ?
There is no right answer to this, because frankly, your guess is as good as mine. However, I\’d rather be on the conservative side, 18% is slightly on the higher side in my opinion 🙂
Hey Karthik if the net debt is positive then should it be added or substacted from the total present value of free cash flows ?
It gets added.
Sir, why am I not able get annual reports for FY18-19 of any company?I am trying to get annual reports of Justdial,JK tyres and Techm. When is an annual report officially published on the website?
Maybe they are not updated yet. I\’m guessing it should be available by (or before) the end of next month.
Hey Karthik, I had a few questions,
1) Can we substitute the DCF model for the Graham number?
2) Is it normal for a company having a market cap of 320 crs to have a debt of 80 crs and have a P/E ratio of 1.68 and a exponentially high ROE and ROCE of 50% both
Thanks in advance.
1) Yes, you can. However, please be aware that the economic situation is a lot different now, so ensure the numbers are relevant for the current economic environment
2) A debt of 80Cr against a market cap itself of 320crs itself is a large red flag. I\’d not waste much time on this. High ROE is due to leverage, and P/E of 1.68 is self-explanatory.
Karthik so what should be the debt of a copmany like having a market cap of 300cr
And one more thing
Debt is current liabilities+ non current liabilities . But by this formula when I calculated Inox leisure\’s debt it came to be 615 Cr and on Screener the debt is only given as 75 cr. Why is there a change?
Not sure, I\’d suggest you look at the balance sheet in the annual report for the correct information.
If you ask me, I\’d say none 🙂
WHILE YOU CALCULATED THE NPV OF ALL THE FUTURE CASH FLOW AND THEN U SUBTRACTED THE NET DEBT .WHY WASNT NPV OF THE DEBT TAKEN IE….. THE FUTURE DEBT WHICH WOULD BE TAKEN AND THEN NPV OF THAT DEBT
The company is assumed to get debt free and go easy on CAPEX.
Dear Sir,
Well written and well explained. I would like to ask -what is your qualification?
Good luck and happy reading 🙂
what if FCF is negative due to high capital expediture ? How will be use DCF analysis in such cases?
You cannot use DCF with negative FCF. In fact, this is one of the drawbacks of DCF.
Well written and very useful. I have been trying to calculate most of your calculations but not getting values posted by you. What is the meaning of * in this equation? 517.12 *(1+ 3.5%) / (9% – 3.5%). sorry for my ignorance.
The equation is the formula for terminal value calculation. Its explained in the chapter 🙂
Why can i not start by dcf model for company and see if it is undervalued or not and then do the rest of the analysis instead of this why do i have to consider other tenants before the valuation model ?
Well, in my opinion, DCF (or valuation in general) is lower in the order of priority. You need to check for the quality of business, management, and the industry before starting on valuation.
Karthik,
I can\’t quite agree with you, as you have quoted that \’If the stock is trading cheaper than the intrinsic value, then the stock is considered a good buy. Else it is not.\’
Then I don\’t get it why should we first analyse all the fundamentals and then come to the price because what if the company has great fundamentals but is overpriced then there is no sense in buying.
Your comments?
what if the company has great fundamentals but is overpriced then there is no sense in buying – Of course, why would you want to pay more than what it deserves? In case of great business, you can add a premium and then price it for intrinsic value. What you pay should be within this.
I did not get the calculations of termibal growth of rs 9731.25crs. Please elaborate the calculation .
The terminal growth rate is the rate at which free cash flow will grow over the years at the terminal growth rate.
Hi Karthik,
While using DCF to ascertain Intrinsic value, i read under Equity share capital header the following,
accordingly have considered The Share capital :908.3 lakhs with FV;2 Rs.
Would the data be affected on the event of Bonus shares being given in the interim ~ June 2018?,
and the Annual report for 2018-2019 is not available.
13 Equity share capital
As at 31st March, 2018
Issued, subscribed and paid up
4,54,15,210 fully paid up equity shares of ` 2/- each (31st March, 2017
4,54,15,210; 1st April, 2016 4,54,15,210)
908.30 ( all amounts in lakhs)
Yes, if there are interim corporate activities, then the share capital would change. You need to check the latest values. You\’ll get this in the updated shareholding pattern published during the quarterly results.
Hi Karthik,
If the company has declared Split (1:1) and Bonus shares(1:2) for DCM method for Intrinsic value computation.
The company has fixed June 27, 2018 as the record date for the purpose of ascertaining the eligibility of the members for sub-division of equity shares from face value of Rs 2 each to Re 1 each and issue of bonus equity shares of Re 1 each in the ratio of 1:2, i.e. one equity share of Re 1 each for every two equity shares of Re 1 each (i.e. after sub-Division of shares).
It\’s Annual report for 2017-2018 has the following for Equity share capital:
13 Equity share capital
As at 31st March, 2018 As at 31st March, 2017 As at 1st April, 2016
Authorised capital 1,585.00 1,585.00 1,585.00
7,92,50,000 fully paid up equity shares of ` 2/- each
(31st March, 2017; 7,92,50,000;
1st April, 2016: 7,92,50,000)
Issued, subscribed 908.30 908.30 908.30
and paid up
4,54,15,210 fully paid up equity shares of ` 2/- each
(31st March, 2017 4,54,15,210; 1st April, 2016 4,54,15,210)
Now, please enlighten me on how to consider the values for Equity share capital and FV( Spilt and Bonus shares)
while computing for DCF.
Bineeth, you should just take the latest share capital after all the splits and bonuses. No point looking at the older transactions.
HI Karthik,
I\’m employing DCF to the script Avanti Feeds, using the downloaded excel sheet given in the link.
The following has been extracted from the Annual reports from the company\’s website for 2016-2018.
FCF for 3 yrs
\’16 : 174.47
\’17:284.64
\’18:327.82
Cash and cash equivalent for 2018: 5.9443.
The intrinsic value arrived is INR ~2k.
Free Cash Flow Estimate (In INR Crs)
2015 – 16 2016 – 17 2017 – 18
Net cash from Operating Activities 174.5 284.5 327.8
Capital Expenditures 49.8 32.0 52.7
Free Cash Flow (FCF) 124.7 252.4 275.1
3 Year Average Free Cash flow 217.4
Inputs Cash flow & Present Value Table
Number of years considered 10 Sl No Year Cash flow PV of Cash flow
FCF Growth rate for first 5 years 18% 1 2018 – 19 256.55 236.45
FCF Growth rate for last 5 years 10% 2 2019 – 20 302.73 257.15
Terminal Growth Rate 4.00% 3 2019 – 19 357.22 279.67
Discount Rate 9% 4 2020 – 20 421.51 304.15
5 2020 – 19 497.39 330.78
6 2021 – 20 547.13 335.36
7 2021 – 19 601.84 339.99
8 2022 – 20 662.02 344.69
9 2022 – 19 728.22 349.46
10 2023 – 20 801.05 354.29
Intrinsic Value Calculation (INR Crs, unless indicated)
Total PV of cash flow 11,320.07
Total Debt –
Cash & Cash Balance 5.94
Net Debt (5.94)
Share Capital 9.083
Face Value (INR) 2.00 Terminal Year 2023 – 20
Number of Shares 454,15,000 Terminal Value 18,513.08
Share Price (INR) 2,493.89 PV of Terminal Value 8,188.06
Intrinsic Value Band
Model Error leeway 10%
Lower Intrinsic value band 2,244.5
Upper Intrinsic value band 2,743.3
I feel that i may have gone wrong somewhere because the current market price is ~400.00 which is much lower than the lower intrinsic value.
Please advise me where i may have gone wrong?
I think you need to relook at these numbers –
FCF Growth rate for first 5 years -18%
FCF Growth rate for last 5 year – 14%
Terminal Growth Rate – 4%
Sir while calculating Net Debt why did you include only the short term borrowing and long term borrowings and not the total of current and non current liabilities which include things like trade paybles as well ?
You included just the long and short term borrowing part not the total of current and non current liabilities ?
Debt means the loans taken from banks which includes both short term and loan term. Liabilities is a broader term. Net debt refers only to loans.
1. Also sir can you explain the difference between \”Owner Earnings\” and FCFE ?
2. Also can I take an average of FCFE OF last 5 years of cash flow statements and then predict the future FCFE ?
3. Will it be okay if i ignore the interest (1-tax) part from the formula if not then what should be the interest and tax ?
1) Owner earnings = Share capital. FCFE is the free cash flow to the firm
2) Hmm, you can. However, i\’d suggest you take the growth rate and increment the FCFE accordingly
3) Why would you want to do that?
I am having the following problems during my analysis of the FMCG SECTOR :-
1. I am calculating the FCFE for the previous 5 years to come up with an average FCFE to start my future growth with .
But is it right to subtract net debt for each back year as some loans are carried forward to the next year and we are subtracting them again and again ?
2. Should I take current borrowing or not if they are more than long term loans and if i should not take them then why ?
3. Instead of taking the growth rate to be 15 or 18 % is it a way to approximately calculate the growth rate WHICH I AM considering by checking previous increase in the FCFE ? I am doing analysis for FMCG sector
4. To calculate the FCFE should i add or subtract the net debt it\’s very confusing ?
Sir it will be very helpful if you can explain these points in detail thanks in advance .
1) No, subtract the net debt from the starting year and then project at the growth rate
2) Current by definition has to be settled within the year. Given this, it may not be a good idea to consider in FCFE
3) You can take the average industry growth rates, btw, 15-18% maybe too much for an FMCG firm
4) Subtract
Capital expenditure considers the investment made in the company. If a company is making new investments for capacity expansion like buying new machines, acquiring other small companies etc to see the big the returns in the future; obviously its FCF will be lesser or even negative. This gives us an impression that it is not throwing back cash to the investors. But fast growing companies need to keep on investing to fuel the big growth. How do we tackle that kind of situation?
In such situations, you can probably take slightly higher growth rates for the future, Santhosh. But this can always be tricky. Another option is to check if you can bump up the sales growth in later years.
Sir, thanks form making fundamental Analysis in simple terms. It will helpful for buying the stock for 1yr or short term trend ? If it is ok than can we do FCF & terminal value only 5 years .Is there possible to get intrinsic value ?
Yes Pavan, 5 years is good enough.
I was calculating capital expenditure for swaraj engines, in their cash flow statement they have shown net of investment purchased and sold under CFIA , how i will calculate cap exp. in such case
The same way, Yash. This should not matter.
Hi sir, i have calculated the share intrinsic value as on 23-03-2019. i got the result as below . Are this correct result:
Company Name: Exide industies FY2017-18
Lower Intrinsic value band 108.8
Upper Intrinsic value band 133.0
Well, I\’ve not really worked on Exide, Hujur. So I\’d not know if the range is right or not 🙂
Sir, I am not a big fan of DCF because of the following reasons. Please do correct me wherever I am wrong as I am still trying to understand this financial things.
1. Terminal value on the basis of assumed growth rate after 10 years is meaningless. A small change in the assumed growth rate makes huge difference on intrinsic value as TV forms the major portion of the PV of the FCF. It is nothing better than a guess work.
2. Considering FCF based on last three years data is not at all sufficient. There could have been major change in the income, cost, expenses on tangible assets etc in any one particular year.
3. We are assuming the growth rate of a company for 5 years-10 years when even the company management itself is not sure of their performance in the next quarters. We can see the difference between the estimated earnings and actual earnings of a company in broker reports even on quarterly basis; some times the difference is as high as 50%. And they have lots of information about the company which a retailer can not obtain.
4. one more assumption on discount rate.
5. Why should one take 10 years. why not 5 years or 15 years?
6. should be we not consider the assets of company while evaluating the value of a company? DCF considers just cash flows. why consider only long term debts leaving aside it asset parts?
Hence we are trying to derive the results when we have all the variables which are just assumed.
I dont know if any one has validated the DCF method by back testing on several companies using historical data (3-5 years data rolling method). Means, what was the IV of a stock 5 years back based on its previous three years data vs its market price and how it has grown after 5 years.
I feel a simple DCF is very weak in providing us even close to the real picture. We need to add something more to it to provide us the clear image. I dont know what!!
1) Agree to this completely. DCF is highly sensitive to terminal growth rates.
2) You can work around this by eliminating any on-off transaction or incomes
3) Same as 1
4) DCF is riddled with assumptions
5) I\’d stick to 5 yrs, estimating anything beyond this can be pointless as the business environment is quite dynamic.
6) Considering assets can be tricky as you\’d need to price in the asset, it is not as straight forward as cash or cash equivalents
Personally, I use DCF only as a reference, it provides some insights which can be useful while investing. Never depend on DCF on its own.
sir
suppose a stock is sold (CNC ) at rs 50 and qty 1000. and it goes to rs 120 then the loss would be more than the value of holding .
so if there is not enough cash in account .how the broker or exchange will recover that money.
thank you sir
To sell in CNC means, the stock should be available in your DEMAT. Once it gets sold from CNC, then you need not have to worry about recovery.
Sorry Sir Kindly ignore the above doubts, I was wrong, Sorry
Glad 🙂
This is great resource,Indeed. Thank you very much for giving this great knowledge. 🙂
I got a doubts.
Sir, When you calculating FCF, you prefer with 2 statges ,you said first 5 years you calculate with 18% next 5 years you calculate with 10%. Below you calculate 18% in both statges. Kindly clarify my doubts
**************************************************
We know the average cash flow for 2013 -14 is Rs.140.26 Crs. At 18% growth, the cash flow for the year 2014 – 2015 is estimated to be –
= 140.36 * (1+18%)
= Rs. 165.62 Crs.
The free cash flow for the year 2015 – 2016 is estimated to be –
165.62 * (1 + 18%) ****** (Is this 10% or 18%, Because you said first 5 years you go with 18% next 5 years you go with 10%)
= Rs. 195.43 Crs.
So on and so forth. Here is a table that gives the detailed calculation…
I think this is a typo 🙂
The calculations for the 2nd stage, however, must be done using 10%.
Hi Karthik,
Say, I followed the above steps, and found the intrinsic value of a share.
This intrinsic value calculated today is valid till what time frame ? I mean, after how many years do we need to re analyse the stock and find the new intrinsic value ? (Because a company may perform extremely good (or bad) which can drastically change the intrinsic value, e.g. Tata Motors.
Please throw some light on this
Thanks,
Saurav
Saurav, it is best if you updated your information every quarter if not every 6 months.
sir
for a particular point of time how we can check that whether the pledged shares of promoters are sold by lenders of not .
You will have to track this from the exchange circulars I guess.
sir
1. why don\’t we get interest on the cash fund on our trading account.
2. where exactly (the cash funds of trading account ) is physically stored at zerodha .
thanking you
Ashwani
Hello Sir,
I Was Calculating the Intrinsic value of avanti feeds ltd, and it is coming as 1656, why so high ? i am confused, and also face value of stock on nse is showing as 1 and in annual report it is showing as 2. why are they different?
I think there could be few errors in the DCF inputs. The difference in FV could be because of the delay in updates, I\’m guessing NSE is latest.
what if FCF is negative ? if suppose how the company performing ? Shall we take this stock for further consideration? Can you please let me know…..
DCF does not work if the FCF is negative. You will have to stick to other valuation techniques such as the relative valuation.
Hi Karthik,
Should buying of debt mutual funds be included in capital expanditure while evaluationg the free cash flow?
Thanks.
That should be treated as a cash equivalent and not really CAPEX.
Hi,
I found this series of articles very useful. Thanks a lot Karthik. Based on example given above, I tried to find out reasonable price of Star Cement. However, the my target price is way off compared to CMP and equity research from others. I assumed the following:
Growth rate 1st 5 years: 10%
Growth rate next 5 years: 5%
Terminal growth rate: 3.5%
Discount rate: 7%
The company\’s numbers are as follows:
Avg. free cash flow of last 3 years: Rs. 20487 Cr.
Net Debt: Rs. 27023.96 Cr.
Total Shares: Rs. 4192.29 Cr.
Based on these numbers I get following share price band:
Low: Rs. 177
Mid: Rs. 197
High: Rs. 217
Whereas CMP is just Rs. 98 as of today!
I read some equity research articles and they suggested target price of around Rs. 120. Only if I bring down the numbers significantly, do I get numbers that match with others. I found the company has following pros and cons:
pros:
Largest market share in north-east in cement sector
Govt keen on developing infrastructure in north-east to counter China
cons:
Company only recently managed to bring down its debt with the help of government subsidies.
Govt ended transport subsidy which will have an impact in future
Increasing cost of raw materials will have impact of margins
So I have a feeling that my numbers are over-optimistic. So I am not able to decide whether DCF is applicable to all types of companies in all situations. What other factors should I look at other than looking at ratios, reading about business and management and performing DCF?
Thanks once again for such informative posts.
Varun, I think the terminal rate is slightly on the higher side and the discount value is on the lower side. Maybe you should try tweaking these?
Thanks for replying Karthik. I will look into terminal rate. However, I have kept discount at 7% considering current FD rates. Should we determine terminal rate in some other way instead?
Repo rates are close to 6.5%, so your discounting rate will be higher by at least 200 – 300 basis points. The terminal rate is usually sub 3%, something like 2.5%.
Thanks for replying Karthik. That was helpful.
Welcome, Varun!
Hello Sir,
All the above stated values as same till now, like growth rate, discount rate ,etc? Or there is any changes with change in time and regulations.
No change with respect to regulations, but you may want to recheck the economic conditions to arrive at the new risk-free rate for discounting.
Hello,
Can you explain how to calculate the risk free interest rates? Please
The bank FD is a proxy for the risk-free rate.
Hello Sir,
Thanks a lot for such an enlightening tutorial. No tutorial would be as simplified as this one!
I have a bit of confusion on the growth and discount rates considered in the example
Growth Rate: 18% and 10% that is fair assumption
Terminal Growth Rate of 3%- 4%(3.5% here) is understood
Discount rate for Terminal Value as well as the discount rate for NPV both are 9.
is this 9% related to any of the numbers above? How did we arrive at this.
We Compound with 18 and 10 and then discount everything with 9.
Please help me understand if there is any co-relation here.
Glad you liked the content.
These are the rates prevailing in the economy, usually the risk-free rate. I guess when I wrote this, it was around 9%.
Hello,
While calculating value of FCF, if the final value is in negative, then how to take calculation further and find out estimate of future cash flow?
You cant, DCF does not work if the Free cash flow is -ve.
Then what to do in that case. how can we find the value of that stock?
Relative valuation of stocks, where we compare the company with its peers helps.
Hello Sir,
Is this same method and process to do fundamental analysis of all stocks in different sector for a beginner?
Yes, except for banks and BFSI 🙂
what does you mean by BFSI???? And please upload a chapter on fundamental analysis of banks.
BFSI = Banking, Financial Services, Insurance.
sir one last question ,(1) Is purchase of non current investments come under the capital expenditure, when we calculate the free cashflow?
(2) please tell about which all expense come under capital expenditure?
Sunil, I think the best way to understand this is by looking into the notes defining the CAPEX. Pick up any annual report of a company and look at these note, you will be able to get this.
let\’s take a look on benjamin graham intrinsic value formula: eps*(8.5+2g)4.4/bond yield of 30 yrs :here g is the assumed growth
now 18+18+18+18+18+10+10+10+10+10=140/10=14 here 14 is our assumed growth rate
now take eps of 2013-14 which is of both yrs= 15.11+20.96=36.07/2=18.035 our current Eps is 18.035
Current bond yield of 20 yrs of bond yield of india is= near 8
now put all the elements formula=18.035*(8.5+2*14)*4.4/8
=18.035*36.5*0.55
=362.052 which is near to your dcf value 368
now apply margin of safety minimum 10% then it will be= 328 near this value the stock would be undervalued.
Thanks for sharing this, Sunil.
sir, in free cashflow why did you not subtract the purchase of intangible assets? why the intangible assets come under capital expenditure?
We subtract everything that constitutes the CAPEX, including intangible assets.
sir,Is dcf method applicable for banking stocks?
Yes, you can.
Needless to praise your work, it\’s priceless. People commenting on it for over 4 years now shows that what value it has.
Query – ARB\’s share traded in the zone for 5 months & let\’s assume someone buys it. But soon it broke out of the band. Someone who would have followed this method would have got out @ around 450 & missed on the bigger rally towards +600. Pls let us know your thoughts.
Request – will be great if you can refresh the whole model. I know it\’s going to be hectic but will do a world of good for us readers 🙂
Thanks for the kind words 🙂
Well, the idea is to follow the method, not all will turn into winners 😉
Refresh will take away a lot of bandwidth, but you do have a point. Will give it a thought. Thanks 🙂
Dear Sir,
Thank you very much for making a non-commerce background person like me interested in such a topic. amazingly simplified way… but sir, I was trying my hand on applying the theories to other companies. But how can I calculate the free cash flow for the finance companies? e.g. DHFL. because I saw the annual report of DHFL but did not find anything like capital expenditure. Now the formula is FCF=net operating cash flow-capital expenditure.. so, how can i calculate this for finance companies or banks etc??
Manash, it can get a little tricky for finance companies. I\’ll try and add supplemental notes to cover this. Thanks.
Sir, will the free cash flow to equity numbers calculated from EBITA reconcile with the numbers obtained from Cash flow from operations minus Capital expenditure ?
And another question : is it better to take geometric mean of the actual numbers of say EBITA instead of arithmetic mean in order to nullify the chances of outliers to skew the data ?
Ah, interesting. I\’m guessing it should. Frankly, I\’ve not used geometric mean in this case, so I cannot really comment.
Sir,
Thanks for such a detailed analysis but I have the following questions,
1) Why did we consider the time period of 10 years ?
2) Can we select the time period of 1-2 years ? In that case how would the calculations vary?
10 was the usual practice, Shantanu. If I were to do this again, I\’d probably bring it down to 5.
Hi Sir,
First of all great initiative 🙂
I have one query:
If promoters don\’t have any holding in the company and 100% holding is with public, should we invest in that company or not?
Regards,
Well, the shareholding pattern is just one of the variable required while looking at a business. You need to at other variables as well, like how the business is doing compared to peers.
If business is fundamentally sound, can we invest our funds?
I was studying about CARE, operationally business is good and comes 2 amongst its peer.
Thankyou for your prompt response 🙂
Yes, one needs to ensure that the business is fundamentally sound before making the investment. If you think CARE qualifies, then you should make the investment 🙂
Good luck!
Thank you so much sir 🙂
Welcome!
Hi Kartik,
How did you get the Terminal value as 9731?? I\’m doing the calculation and it shows 6162. What am I missing here can\’t figure out. According to formula Fcf (1+rr%)/disc rate-rr%) . So 517.12 x (1+3.5%) / (9%-3.5%) gives me 6162.5699
Regards,
Pulkit
I need to run through the math again, it been a while since I looked at this 🙂
Meanwhile, can you please check the placements of brackets and numbers again? Thanks.
Hi Karthik,
Until now all your calculations are spot on I have done most of them manually as well.. Either I m missing something here or I m unable to understand the formula. I have rechecked it multiple times but it comes the same as 6162….
Having said that your material is beautifully written. I\’m going to get into Share market after reading some more materials of yours.
Regards,
Pulkit
Thanks for the kind words, Pulkit 🙂
Let me check the calculations again. Since no one had raised the concern earlier, I assumed the numbers are right 🙂
Hi Karthik,
Take your time.
Regards,
Pulkit
Hi Karthik,
By any chance did you run through your calculations for TV?
Regards,
Pulkit
Nope, not yet.
Hello Karthik,
Terminal Value = FCF * (1 + Terminal Growth Rate) / (Discount Rate – Terminal growth rate)
Here * denotes multiplication sign right?
Regards,
Pulkit
Yes, that\’s right.
Thanks
Welcome!
how did you come on 294.5 in cash &cash balance
As reported in the Cashflow statement.
Thanks
Good luck, Ram!
sir, according to the calculation amara raja was higher than its value ,bt after that it never touched down to the levels that were calculated in this chapter, what conclusion should be formed out of this .
Did the conservative calc. made us to think the company is overvalued.
Possible. Also, the model should have been updated with new numbers.
Hi,
How to identify if the stock is only Buy or only Sell trend for a day frequency?
Is there any option in Zerodha to identify this?
Thanks.
You just have to look at the price movement and take a call, Guru.
Thanks Karthik.
But price fluctuations aren\’t indicate Buy or Sell trend right. If my understanding is wrong then can you tell the logic to identify based on price movement?
and
How to find particular stock bid orders and analyse Buy or Sell trend? As few stocks always has Buyer only one day and other day Seller only. Because of this i got huge loss in 2 stocks.
Appreciate your response.
The trend can be identified in many ways technically- moving averages, ADX, RSI etc.
Bid-Ask does not really help in identify longer-term trends.
Hi 😀
For computing DCF is it okay to consider more than 3 years (let\’s say 6 years) of financial data, because in doing so \”Avg Free Cash Flow\” will incorporate fluctuations due to cyclical changes in industry and it will give a better estimate for buying price. What will you prefer ?
Of course you can, Hammad. Take 5 or 6 years data and try to project for 3 years and not more than that.
what is your rationale behind projecting FCF for 3 years only (instead of 10)?
This is a personal opinion, I think it is quite tricky to project for more than 3 years considering the dynamic nature of businesses.
1) I am a little confused now. In the blog post you\’ve mentioned that you like to do projection for 10 years and in the comment thread you are saying you prefer forecasting for 3 years. Is it because market has changed since the blog post was written ?
2) You mentioned that we need to update the model whenever new data is available, so we need to compute new FCF. Whenever company publishes quarter results Cash flow statement is missing from it. So how will you compute new FCF for the model ? Is there some other way for updating the intrinsic value band based on quarter results ?
1) Yes, Hammad. My views changed since then….and it is not because of the markets, but because of my own understanding of how business work 🙂
2) The only update would be on the P&L side which is made available on a quarterly basis.
When will be the financial modeling Karthik sir
Hopefully sometime this year. Too many things have come up 🙂
Hi Karthik,
The actual Cash flow for ARBL for F.Y. 2014-15, 15-16 & 16-17 has been quite contrary (forecasted sum of 3 years- 592 crs., actual 85 Crs.) to what was predicted by DCF model in the module here. Though, it was never a buy at that time at that price but my concern is about the accuracy of DCF model. Especially when we considered 18% GR as conservative for first 5 years for this particular company.
In the interest of your valuable time pls. let me know if you\’d want me to share the calculations and screenshots taken from the ARBL\’s annual report for the said F.Ys\’
Regards,
Himanshu, in most cases, once a DCF model is set up, it acts a \’Base Model\’, the Base model is updated as and when quarterly results are announced. All these things are a part of Financial Modelling. Clearly, we have not done that, hence I\’m not surprised if the numbers are off.
Hi,
The snapshot (snapshot of ARBL’s FY14 annual report from where you can calculate the free cash flow –) has capital expenditures data which I\’m unable to find anywhere. Plz tell where to find it to continue the calculations. Also tell from where has this snapshot been taken from.
All snapshots are from the Anual Report only, Arunodh. You can find this information in the AR itself.
Thanx karthik for the clarification, and I\’ve found it on AR. Though I\’m unable to find the \”purchase of tangible fixed assets\” in many ARs. Then in that case what value should I look for ?
Another doubt, from the very beginning of DCF we\’ve applied the analogy with the example of pizza machine. Basically net cash flow is discounted, and here we\’ve taken only operating activities, but what if there are some other cash flows from financing and investing activities which are totally neglected here ? Shouldn\’t they be included anywhere in calculation? Shall we not simply take net cash flow from all the three activities and then carry forward the calculation ? Looking forward for the explanation, thanx in advance. 🙂
For a business, cash flow from operating activities is what really matters. CF from investing and financing activities are important, but that is something I won\’t base my valuation on.
Hey Karthik,
I am back with another silly query (pls dont hate me). 😛
Could you tell us the criteria based on which one can pick up stocks to trade INTRADAY? I am interested in INTRADAY because as I mentioned elsewhere…\”I NO MONEY HAVE!\”.. 🙂
Also, it would be a great help if you could dedicate an entire module to Intraday trading…covering all aspects from picking stocks, trading hours, booking profits/losses etc. Of course, only if and when you find time…but please do advise on how to pick stocks for Intraday..please. Thank you very much!
Regards,
~Abudhar al Hassan
No place for hate in this forum, Abudhar 🙂
The best stocks to trade intraday are the Nifty 50 stocks, it has the liquidity required for intraday trading. Will try and put up a module on intraday trading one of these days 🙂
Sir,
Why did you calculate the PV of terminal value (clause 15.3) by simply discounting the terminal value by discounting rate??
= 9731.25 / (1+9%)^10
= Rs.4110.69 Crs
If this is right way of calculating the PV of terminal value (which is sum of FCF) then…..
(1) Refer Table of Chapter clause 15.3 – The Net Present Value (NPV)
Why don\’t we get NPV (= Rs.1968.14 Crs) by simply discounting the sum of FCF (=Rs. 3339.71) with 9% rate by using the formula
PV = FV / (1+ discount rate) ^ No. of years ??
or conversely…
why don\’t we get Net FCF (=Rs. 3339.71) by compounding the NPV (=Rs. 1968.14) with 9% rate by using the formula
FV = PV (1+ growth rate) ^ No. of years ??
(2) Refer Table of Clause 14.4 (previous chapter):
According to the simple discounting by you for terminal value,
In table of clause 14.4 also, we should be getting NPV (=Rs. 32,80,842) by simply discounting the total FCF (=Rs. 50,00,000) with 8.5% rate and vice-versa….BUT, We do not. Why ?
Why formulae of PV/FV don\’t seem to work the way you\’ve used to calculate NPV of terminal value?
Please Note that in my Question above by FCF, I mean Future Cash Flow (which is basically FV), not Free Cash Flow.
Sorry for similar abbrev.
Suggest you look at the comment I posted earlier.
There is a mathematical derivation (which I\’ve not discussed) to arrive at the formula for estimating PV of terminal value. I\’d suggest you look it up online.
1) We cannot really compound at a constant rate in 2 stage (or multi-stage) DCF since there are varying rates
2) When it comes to terminal value, remember this CF is to perpetuity – so things get a little complex here. I\’d suggest you look up this derivation for better clarity.
Ok Sir, Will look it up online.
Thanks!
Good luck!
As of today-18th May 2018, do the rates of growing FCF hold good i.e. 18% for the first 5 years and around 10% for the next five years.
Or would you recommend using higher/lower rates as per the present economic scenario?
This depends on the company you are looking at. Holds true if the company and the sector are both promising.
Hello, would you be uploading a chapter on Financial Modelling?
That would be an entire module, Parinita. Hopefully, sometime during this year. Thanks.
Okay, thank you 🙂
Welcome!
Hi Sir,
Your material is great! thanks for sharing it.
I have a few questions to ask –
Q 1) I cannot make myself understand why we compare the current market cap. with the NPV of FCF\’s, like how are these two related? why we don\’t consider PAT as a parameter instead of FCF (right now DCF does not make any sense for me).
Q 2) Also to my understanding I think the most important part should the brand name and if the company enjoys long-term MOAT which should be kept in view while doing valuations and during DCF calculation we don\’t add any goodwill value, please correct me if I am wrong and help me understand the concept.
Thanks in advance! 🙂
1) Where are we comparing MC with NPV?
2) Yes, the brand name is quite important. However, DCF is purely based on numbers. Think about it this way – if the company is valued purely based on numbers and you find it at a discount, then you can be doubly sure about the margin of safety concept.
I\’d suggest you value a company completely based in DCF, you will get a hang of it 🙂
We are calculating the intrinsic stock price by dividing the NPV/ Number of shares outstanding and current market price is market cap./number of shares outstanding. So aren\’t we generating a relationship between the current market cap with the NPV?
Also please help me understand why we consider FCF and not PAT while evaluating the NPV of a company?
No, the number of shares is basically Share Capital / FV.
DCF as a technique looks are future cash flow, discounted back to today\’s terms. PAT, on the other hand, is just relevant to the current year\’s performance.
Hi Karthik Sir,
ICICI bank posted loss yesterday, but share price is going up. What could be the possible reason?
Thanks
Satya
The market is forward-looking, perhaps bad result was already factored in.
Hello Karthik,
Thank you for such a detailed explanation.
I got confused while I calculating the share price for ARBL based on data till 2016-17.
Cash From Operating Activities After Tax(starting from 2016-17 to 13-14) are : 552.89, 554.71, 388.220, 278.750
Capital Expenditures(starting from 2016-17 to 13-14) are : 438.16, 517.18, 455.387, 330.366
Groth rate are: 18%, 10%
Discount Rate: 9%
Terminal Growth Rate: 3.5%
Total Of Long Term Borrowings till 2016-17: 69.01
Cash And Bank Balance till 2016-17: 170.92
Total Number Of Shares: 17.08
All figures are in Rs. cr.
Based on the above data when I calculated stock price it came out as: 27.19
But this stock price is wrong I guess.
Could you please check, is the price really come out as 27.19 or I am missing something.
Clearly, something is amiss here, Mayank! Are you sure you about the Capex numbers? Looks a bit off for me.
I will check again and let you know, Thank you for a quick reply.
Hi Karthik,
Reverified the numbers again from the annual report 2016-17, 15-16, and 14-15. Numbers are correct.
Hmm, I\’m not sure, Mayank. Have you look at the share capital number again. Make sure you\’ve divided the face value correctly.
Karthik,
The stock value 27.19 is correct based on the data. I also checked some online tool https://www.safalniveshak.com/introducing-dcf-calculator and this tool take the same kind of inputs as we use as per your calculations, and giving the nearly same stock price. Can you please check what wrong here?
The calculator will give the same value for the same set of inputs. Can you double check on that again, Mayank?
Hi Karthik,
Cash From Operating Activities After Tax(starting from 2016-17 to 13-14) are : 552.89, 554.71, 388.220, 278.750
Capital Expenditures(starting from 2016-17 to 13-14) are : 438.16, 517.18, 455.387, 330.36
The calculation was correct. The stock price is 27 rupees with data from year 13-14 to 16-17 and this is because of the large amount is spent on the capital expenditure if you see from above data.
When I added three last more years for calculation means from 11-12 to 15-16 and calculated the stock price came out as 216.
Current stock price for amaraja battery is 800 rupees. And I don\’t think I will ever get this stock at 216 price.
Do you still think this way of DCF calculations will work for the fair value of a stock? Or if you know any other method please please suggest.
Well, DCF is one of the most standard valuation technique. Apart from this, there is relative valuation technique. I\’ve not covered this yet, hopefully, will do sometime soon.
DCF modelling is not appropriate for Financial Institutions.Free cash flow will come always negative for loans given by them.Kindly discuss some other valuation model for Financial Institution.
Sougata, I\’m yet to get comfortable with that myself. Hopefully sometime soon 🙂
Thanks for your reply at least.Following formula can give some light on it but I don\’t how to calculate it
Free Cashflow to Equity = Net Income – Net Capital Expenditures – Change in non-cash
working capital – (Debt repaid – New debt issued)
All these data points are available in the financial statements and with that, you can easily calculate the same.
Sir,
The current year total debt will be same as the current year liabilities (Total Liability = Shareholders’ Funds + Non Current Liabilities + Current Liabilities) or not??
As in chapter 6 total liabilities was 2134 Cr. and in the present chapter debt is written as 75.94 Cr (which is long term borrowing) .
Please clarify.
Debt can be long term and short term in nature. Long-term debt is classified under long-term liabilities and short-term (less than 1 year) goes to current liabilities.
Total debt is a sum of both these types of liabilities.
Then in this example, what should be the value of debt?
I guess around 75Cr?
ok..
I used this anaysis for 2-3 stocks which i wanted to buy but by analysis their share price came very less than their actual market price.
Should I not buy them??
please give your view..
If you think there is intrinsic value, then maybe you should 🙂
Great Article and very informative karthik.
What are the other valuation techniques apart from DCF ? can you cover that as well ?
You can do a relative value analysis, Seema. This has been on my list of things to do, hopefully, sometime soon 🙂
lets suppose in april-may, i have calculated intrinsic value using previous FY annual results, now how should i adjust the quaterly results as an input into your excel sheet..i mean what data should be tweaked or it only works with annual results when cash flow etc. is available
Ashish, you work with the previous year\’s cash flow. Also, you will have a fair idea on how the cash flow structure, in case of any major change during the year, then the company will make announcements and you will have to incorporate the same in your excel model. The point is that the cash flow will not change drastically if there are events which impact the cash flow, then you will know.
Do we have any other excel sheets which can be useful for us? if, yes then please provide us.
In what context, Patel?
Hi Karthik,
In above example of ARBL , you have calculated the Average cash Flow (historic) for 3 years , but you have predicted the Future Cash Flow for 10 years , Is\’nt it the Average Cash Flow (historic) should be calculated for 10 years and then predict the future Cash flow on that value ?
Over the last few years (after I wrote this piece), I\’ve come to he conclusion that the average should be for 5 years for predicting for 3 years.
I did not get that karthik , Are you telling to predict 3 years future cash flow data we have to take the average historic cash flow of 5 years ? Correct me if I am wrong.
Hmm, yes. Take a look at the last 5 years to see how things are looking 3 years hence.
Is this DCF model applicable to all companies and sectors ? or are there any exemptions ?
Yes, pretty much applicable to all, except for financial services.
Thank you so much Karthick. If it was not for your efforts i would have never understood these concepts !
Please help me with a doubt. Why is \’Cash used from Financial Activities\’ not considered while calculating the \’Free Cash Flow\’ ?
Thank you Again !
Free cash is generated by operating activities alone. Remember, operating activities represents the core business of the company.
Hi Karthik,
Can you throw some light on how to calculate Discount rate for any company? In the above example of ARBL you have taken it as 9% ,is it purely on assumption basis or any facts lying behind it ?
Its usually taken in as an approximation, Sohail.
Is there any specific range of values that can be taken ?
On what factors the value majorly depends on through which we can infer the approximate value of discount rate ?
Take the risk-free rate in the economy, you can add about 100-150 basis points to this risk-free rate. This will be your discount rate. Please remember, this is a back of the envelope estimation.
Thanks karthik that helps.
Cheers!
Hi Karthik,
I was looking at the 2017 Annual report of Suven life sciences ltd. The cash inflow of annual results of 2016-17 8.68crs with purchase of investment of about 300crs. Otherwise the cashflow for previous years were 200+crs. I took 170 crs as current year inflow and calculated 12% increment in first 5 years & 10% for next years.
Cash Flow@2017 190 Future Cash Flow Present Value of Future Cash Flow
2018 218.5 200.4587156
2019 251.275 211.4931403
2020 288.96625 223.1349645
2021 332.3111875 235.4176231
2022 382.1578656 248.3763914
2023 420.3736522 250.6550739
2024 462.4110174 252.9546617
2025 508.6521191 255.2753467
2026 559.5173311 257.6173223
2027 615.4690642 259.980784
Terminal Value at 2027 11582.00875 4892.365663
Net debt 1725 7287.729686
Intrinsic Value 5562.729686
Fair value/Share 435.2002571
Even with 3-5% growth this looks compelling buy at current levels of 190/- or am i wrong somewhere
Hard to say unless one puts these numbers on excel, Shankar. On the face of it, the calculations looks alright.
I see. You are taking long term borrowings with Current cash flow
Yes.
Hi Karthik,
Good read.. How did you come to the conclusion of 75.94 cr as the outstanding debt. I\’ve gone through the earlier chapters also, but couldn\’t see it
Hi Karthik,
Does the DCF model work for Commodity goods like \”Chemicals\” to determine future value of their stocks?
Yes, it does to all manufacturing companies.
while calculating the cost of equity will be considering the 10 yer yield on government of India debt or the 1 year bank FD rate – this is related to risk free rate
You can take either, again for a conservative approach, you can take 3% higher than the risk-free rate prevailing in the economy.
WACC = E/V*RE + D/V*RD*(1-TC)
Where:
Re = cost of equity
Rd = cost of debt
E = market value of the firm’s equity
D = market value of the firm’s debt
V = E + D
E/V = percentage of financing that is equity
D/V = percentage of financing that is debt
Tc = corporate tax rate
karthik had a question on cost of debt
when we calculate this will we be only considering long term borrowing and ignore the short term one or we have to consider both
and ignore the other line items under ( non current liabilities and current liabilities )
2nd question
regarding the cost of equity
ke = RF +B (RM-RF)
rF = Risk free rate
b = beta
rm = market rate of return
while calculating the cost of equity will be considering the 10 yer yield on government of India debt or the 1 year bank FD rate
& market rate of return – is it correct that we consider compounded annual growth rate for index Nifty which is 13.84% in market rate of return
On a conservative approach, you can consider the short-term borrowing as well. But the majority considers only long-term borrowings.
You can take either, again for a conservative approach, you can take 3% higher than the risk-free rate prevailing in the economy.
Mkt return can be around 14%.
thx for the reply
Welcome!
hi Karthik,
I am curious to know that how can you do valuation of companies which use thier free cash in investment activities.
For hero motocorp they keep very less cash and use most of the cash is investment activities.
Thanks
You stick to the same methodology, Sarvasva.
Kartik if i stick to same methordology wont valuation of hero motars come very low. What i was thinking that we should add cash is in investment activities as positive cash flow. So could you tell the reason of not including cash used in investing activities as positive cash flow?
Not really, remember, while doing DCF, we are taking cash flow from operations in perspective. Go ahead and run these calculations and see what numbers you get.
Sir, i am a beginner here…. please help me with the discount rate that you used in the main article while calculating terminal value..
you used 9% and also mentioned int he previous reply it is nothing but the WACC , but i am in a maze, how to find the wacc!!
I\’ve not touched upon WACC, but roughly, you can use the discount rate at around 3% higher than your bank FD rate.
Hi, I tried to calculate intrinsic value for All cargo logistics
Average free cash flow of 4 years is 26,594 Lakhs
I have taken growth rate 15% for 4 years and 10% for another 4 years
So cash flow at the end of 8 years comes to 68,099 Lakhs
NPV comes to 2,56,695 Lakhs
terminalgrowth rate value comes to 12,81,499 Lakhs
After reducing net debt i.e 34,422 Lakhs final value comes to 15,03,772 Lakhs
Total no. of shares is 2,456.96 Lakhs
Intrinsic value = 612 CMP = 194
Can you please recheck and verify if this is correct ??
Thanks
NPV is higher than the CF at the end of 8 years? Otherwise it seems alright to me.
Sorry cash flow for 8th year is 68099 Lakhs
Total cash flow for 8 years is 3,90,163 Lakhs
Can you recheck and calculate the numbers from the annual report of the company ? I have done the calculations for the first time so i am not sure if i did it right 😛
Azeem, I\’ll try and do the calculations, but really swamped with work. On the face of it, it looks alright to me 🙂
Its okay, do it when you get time… mid caps are cracking anywys… might get it at a much cheaper price 😛
Good luck 🙂
Sir
As u said,its good to invest in companies who has monopoly,duopoly and oligopoly in the market.but what I f the company have competitors which are not listed in bse or nse.how do we take this into consideration?
Hmmm, this depends on how strong the unlisted player is. If the unlisted company is a market leader, then I\’m not sure of it makes sense buying the listed entity, just because that\’s the only option available.
But sir how would I get to know whether the unlisted company Is market leader or not? Are they performing better or worse than the company which is listed? As u know AR of unlisted company is hard to get.
You need to study market reports. For example B9 Beverages is challenging the incumbents like USL, B9 is not limited but a simple search online shows up interesting results – http://www.livemint.com/Companies/wSi4uHsMqW4Ryk6SmjujXK/Bira-91-raises-fresh-funds-to-enter-new-markets.html
How many types of valuation techniques are there ?
I can think of at least two – DCF and relative valuation techniques.
Hi , I am new to equity market and I have failed to make any successful investment yet .
I am full time employee work in a IT firm . Zerodha varsity is best platform for freshers and i have also recommended many of my friends to visit this site .
My main concern is that, there is so much to learn on this platform starting from technical analysis to fundamental analysis .
when it comes to investing in a company it is very difficult for me ,
1.To evaluate a company on the basis of every financial ratios mentioned varsity .
2. To go through all the financial instruments ,financial research and balance sheet .
Can you tell me how can I evaluate a company or equity through few checkpoints rather than reading all the historical background of it , reason being I dont get that much time to do analysis and I am really willing to invest and scared at the same time .
Glad you like Varsity, and thanks for sharing this with your friends.
Unfortunately, there are no shortcuts, Anand. Investment analysis is a time-consuming process, but if done right, it can reward you extremely well. Here is a suggestion – break this down into a smaller task and try to accomplish this. Remember, you only need to identify one of two good investment ideas in a year. However, this idea should be developed backed by conviction and solid thesis.
\”Please note, I have included a DCF Model on ARBL, which I have built on excel. You could download
this and use it as a calculator for other companies as well.\”
From where I can download excel sheet mentioned here?
Pls ignore it. I got the hyperlink on this page but it wasn\’t there in PDF I was referring.
Looks like the excel is not there. Will try and upload this sometime soon.
What is ideal frequency and period for calculating Beta for a company stock?
Also what is the ideal period should be considered for calculating the market rate of return?
The above two questions are in relation to CAPM to calculate Cost of equity for discounting rate of cash flows!
Thanks
I\’d say once in 3 or even 6 months is good enough for beta. Market rate is more or less constant.
Hi karthik
Could you share the link of DCF calculation Excel sheet to download since i could not find it here .
Its available at the end of the chapter before the key takeaways.
You can also download it from here
Thanks for sharing the excel sheet
I have used this sheet for control print company
I have taken data from FY16-17 ,FY16-15 ,FY 15-14
But this calculation shows error .the share price is showing as 8.62
note: the company have no long term debt but it has short term debt (14 crore ) but i have omitted short term debt for calculation
This share is trading near to Rs 500 . but the intrinsic value is showing as rs 8.6
Why this difference ?
This is quite a big difference, I get a feeling you may have made mistakes in the discount, growth rates. Can you double check again, please? Thanks.
Hi Karthik,
More questions for DCF
1. the average of cash flow is coming out to be a negative value. is that considered a negative cash flow?
2. Some companies use the word \”Net Cash Flow Generated from Operating Activities\” and some write like \”Net cash flow from/(used in) operating activities\”. What is the difference between the two?
3. What is the method of valuation for companies having negative cash flow?
4. A company is investing hugely in CAPEX due to which its DCF valuation is appearing lower than CMP. Rest of the Fundamentals are good. What can we understand from this?
1) Yes – not a great sign and you cannot really apply DCF for companies with -ve cash flow
2) Hmm, I guess both are same
3) You could opt to do a relative valuation technique. Have not really covered this in Varsity, will do sometime soon
4) This could imply the company is going through a major capex cycle, which also means that the spend on capex \’may\’ taper down over the coming years.
Thanks a lot Karthik.
Concepts are are quite clear to me now.
I am waiting very eagerly to learn relative valuation technique. I request you to please publish that as soon as possible.
many thanks in advance.
Glad to not that, Manish. Yes, will try and do that as soon as I can. My current focus, however, in on Trading Systems.
How important is the Face Value of a stock?
when I am doing DCF analysis for Borosil glass, the face value in March was 10 Rs. and after a split in September the current FV is Rs. 1 which is impacting very heavily on future stock price. Rest of the fundamentals are ok but still the CMP is coming out to be overvalued due to face value of Rs. 1. On the contrary If I take FV 10 the future valuation shoots up to 5 times of the CMP (coming undervalued when taking FV Rs. 10). Please advise.
Always take the latest FV. In this case, it would be Rs.1. This does not have any impact on valuations as everything else gets adjusted proportionately.
In cash flow statement, there are negative sign on capital expenditure. Do we have to take the negative value
of capital expenditure for DCF calculation? or we have to ignore the negative sign and put the positive value?
This is the change in capex wrt to the previous year. If yes, the you can ignore the -ve sign and take the number directly.
Can Trade Receivables be counted under Cash & Cash Equivalents (Cash & Bank Balance)?
Nope, not really.
One more question-
While reading Cash Flow statement which figure do we have to take from Cash from Operating Activities. Would that be Net Cash inflow from Operating Activities? and Which figure to pick for Capital Expenditure (would that be Purchase of Property, Plant & Equipment / increase in Capital WIP ?)
i have got the answer of 1st question. Just answer for 2nd only.
Replied.
Net cash from operating activity is good. Yes, Purchase of Property, Plant & Equipment / increase in Capital WIP represents CAPEX numbers.
Hi Karthik,
Is there a service which provides DCF model in excel. I will like to dnld and tweak them for valuation ranges. Please advise.Thanks.
Hmm, not sure about this Shashi. Check out this company called Creytheon, they were trying to do something along these lines.
Thank you
Cheers!
Hi Karthik,
The intrinsic lower and upper value are coming quite low for a company stock. Does it signify that the future of company is not good or in future the stock will trade in that low range only?
If the numbers are right, then yes, the future may not be that great for the company you are evaluating.
Thanks Karthik, this model has been very helpful to understand stocks. Just 15 days back i was ignorant about what are stocks and stock market. When my other colleagues talked about the share market I felt that I am just a kid in front of them. I always tried to abstain from their discussions of stocks because of having no knowledge of it. But the arms and ammunition you have provided through your Varsity is sufficient to fight the battle of stock market. Now just because of you I am able to advise my those colleagues about the selection of right stocks and they are just awestruck \”How\” !! . Just in 15 days 🙂 Thanks again.
Hahaha, I\’m happy to know that Manish!
Happy learning and stay profitable 🙂
Hi,
I have tried making the Share price
Lower intrinsic value
Upper intrinsic value
Margin of safety
but a lot of companies share price is coming in negative am i making any mistakes. I will give you the names of companies like Apollo Tyres, Reliance, NTPC, ACC .. etc
And if the company is purchasing more assets than its cash flow from operating activities, then what does that mean?
kindly help me.
Hmmm, I think you could be going wrong somewhere, John. Anyway, if a company is purchasing more assets, then it implies that are investing in the business. The cash flow from operations should support this purchase.
Thanks a lot Karthik, I\’ll recheck it.
Cheers!
Hi Karthik,
My DCF analysis is sometimes giving the desired result but sometimes just the unexpected numbers which is not matching to some of fundamentally strong companies. How much should we trust on DCF analysis?
Could you share the link of DCF calculation Excel sheet to download. I think there is some tech issue I am unable to see the link here. Many thanks
Let me recheck.
I have got the link to download now. Thanks a lot Karthik. You have done tremendous job. This has changed my perception about the stock market.
Good luck, Manish!
Well, DCF is just a model. It will give you results based on the inputs you feed. So you need to trust yourself that you are feeding in good data to DCF.
How to calculate the intrinsic value in case company is having negative free cash flow and it is raising funds from financing activities and by using the fund from OA & FA, company is investing in fixed assets (IA) ?
Since company is in initial phases, company is not paying any dividends (which is good that company is utilizing its reserve to earn extra from future, also known as funding from retained earning), hence dividend growth model not applicable.
Net asset method not applicable, since we dont know the market value of its assets.
Example of such company – 8K miles.
The only way i see here to calculate the intrinsic value is by P/E ratio.
PER = 1/Required return
Price (Fair) = PER*EPS.
RR would be the required return for the investor based on growth rate and ROE of last 5 years.
Is it Correct?
That would be difficult in case the company has -Ve free cash flow. I\’d suggest you do the relative valuation here. I\’ve not discussed this on Varsity, maybe I will soon.
Hi Karthik
what opportunity cost should I take in my calculation of DCF and also at what rate should I discount the terminal value? Is there any fixed Opportunity cost and discount rate?
No fixed opportunity cost as such. I usually assume around 10-12%?
all above calculation in Crore
Got it.
sir i got confuse please check below solution
i try to find out DCF of bpcl of (current year 2016-17),past year 2014-15,2015-16
rate as (15%for first five year) , (10% next five year), discount rate – 9%,terminate rate – 3.5%
net operating 18,194.41 10,233.90 7,881.93
caital expenditure -8,034.94 -9,374.49 -8,982.42
FCF 10,159.47 859.41 -1,100.49
avreage fcf 3306.13
terminate 201534.8768
pv of terminate 85130.50994
PCF is 412614.3699
pv 497744.8798
debt 62256.56
total pv 435488.3198
no share 144
share price 3024.224443
lower 2721.801999
upper 3326.646888
1. sir above calculation is right or wrong ?
2. bpcl is trade at 550 so it is undervalued stock ?
3.please guide if i done wrong
reference
https://www.bharatpetroleum.com/bharat-petroleum-for/investors/shareholders-information/annual-reports.aspx
It would be very difficult to validate this, Gulshan. But on the face of it, the steps looks correct. However, I would not consider 15 & 10% growth rate for a company like BPCL. More like 10-8% would be more realistic I guess. Also, 3.5% for the terminal is a bit of stretch, I\’d be inclined to keep it sub 3%.
sir how can estimate growth rate of company ? basically steps correct as per your checklist but i not getting about growth rate calculation and terminate rate of stock
please help me sir
Growth rate can be assigned based on your expectation of how the company will grow. Typically, for a large well-established company, the growth rate is quite low, sub 10%. For a small to mid-size company, the rate can be higher. Essentially, this number will come from your expectations of well the business is likely to do in the future.
sir their is no mathematic formula for calculation growth rate
Growth Rate = (New Price / Old Price)-1 , expressed as a percentage.
hello sir , sir i am college student and i already studied about pv & fv but the way teached it i never forget these concepts
my qustion is
1.can we use free risk rate (govt bonds rate ) as discount or weighted cost of capital ?
2. how you calculate growth rate (like 18% , 10%)
3. sir can i work under you as a intern ? i have winter vocation from jan onwards
thank you
# graet treacher @ Karthik sir
1) No – the cost of capital will be much higher than that, upwards of 10%, at least.
2) This has to come from your research experience, the company you are studying, and the sector the company belongs to
3) Unfortunately, we do not take interns. But I\’m almost always available on this forum. Ping me anytime you need, will be happy to share whatever I know.
sir i completed module 1,2,3 ,4,5,9 but module 9 is toughest to understand
i have some questions
1. if i do position sizing on momentum trade on the bases ATR ?
2. sir i\’m using pi it only scan 50 stock how can i increase the limit ?
3. how much internet speed requied for easy flow of pi ?
4. sir can you recommend any book on momentum to me for future learning
1) Yes, you can use ATR
2) Let me check this
3) A regular broadband connection is good enough
4) No particular book on momentum strategy as such, at least, I can\’t seem to think of one.
sir then how can i learn about momentum and build a strategy on it ?
where from it i can learn t ?
I plan to write about it in this module – https://zerodha.com/varsity/module/trading-systems/
sir yesterday i written you a query on valuation of bpcl but ii show awaiting moderation on comment sir please reply of that query
thank you
I just replied, Gulshan. Good luck!
Hi Karthik,
Thumps up to your work.
But I was unable to convince myself to the terminal value concept in intrinsic value calculation. One may forecast next 10 years FCF with investible due diligence but estimating total FCF post 10 years in calculation of FCF, does this a dependable idea to calculate the terminal value as there will be so many dynamics far from 10 years. As in case Amar raja, the terminal value(which calculated with least certainty for post 10 years FCF) is a major portion in intrinsic value i.e ~60% rather than next 10 years FCF(which were calculated with most reasoning) .
And secondly can we apply DCF model to all companies the same way.As Newbie growing companies may not have a healthy FCFs, so many promising young companies will have a negative recent avg FCFs.
In fact, this is exactly the drawback in DCF valuation. It relies heavily on terminal value! Unfortunately, there is no way around it. Yes, you can apply DCF to all companies, except on Banking/Financial services firm.
Also, if you are not convinced with DCF, you may want to check out relative valuation techniques. I missed including that in this module, but maybe I will one of these days. Good luck.
Dear sir
As the intrinsic value by DCF seems too far low from it\’s market price for the most of the companies, practically can we find good companies which are selling below intrinsic value ( based on DCF). Does we find the situations often? or is it difficult to find such opportunities?
Yes, the situation is quite often in a bear market, but in a bull market such as the one we are in now, the occurrence is not too often, as the prices would have run up quite a bit.
Thanks.
If one is long term investor, What would be the stock picking strategy in bull markets. and when we can say the market is too hot to fresh investments and instead should consider selling.
Irrespective of the market cycles, your stock picking techniques should stem from basic fundamentals and valuations. Given this, valuations do tend to shoot up in a bull market. So you may find fewer opportunities. The market is considered too hot when stock prices can no longer explain the stock valuations.
Hi Kartik,
You State that there is an excel download available for DCF. I\’m unable to find it here.
I think it has been removed when the upgrade was done. Let me check. Thanks.
Where can I get the \”intrinsic value band\” of a stock?
Not really available anywhere. You may have to calculate this yourself by doing a simple DCF.
Thank you for the prompt response.
Cheers!
Hi,
while trying to find \”Cash from Operating Activities (after income tax)\”
In Ashok leyland annual report
In 2014-15 annual report, it is shown as 49560.90 lakhs as on mar 31 2015, but
In 2016-17 annual report it is shown as 132,449.57 lakhs as on mar 31 2015.
why there is a change?
Which one do I have to consider for calculation ?
I\’d take the FY 2016-17 data as there are chances that the numbers may have been restated.
A real gem! I have been going through DCF model in many sites, videos, podcasts, but never through anything explained so well. Kudos!
Thanks Anand!
Happy learning 🙂
Hello,
I so grateful to you and Zerodha for the amazing explanation in all chapters, I am learning so much.
I have a doubt in the calculation of FV of estimated cash flow in the table when the growth rate is 10% for 6th year.
the formula would be 140.36*(1+10%)^6 , right? I am getting 248.65 rs instead of 353.21. Where have I gone wrong?
Thank you
Its 321*(1+10%) = 353.21.
Hi sir..i am a bit confused here…you say DCF would help in calculating fair value in case the company is generating negative free cash flows…but in this chapter u have used DCF method only, and as per your previous reply, u said its difficult to calculate the IV in case of negative cash flows..is there any other method in DCF to calculate IV in case of negative free cash flows…can u please elaborate on this sir..
I am getting confused between FCFF and FCFE model. Is this the FCFF model? As you removed the debt part after the discounting?
This is the Free Cash Flow to the Firm model.
I did a DCF valuation analysis for a financial services stock and the valuation is coming out to be 1300 while the stock price is 40. It can be noted that the FCF was only positive this year and negative the past two years. What do you think of such a scenario. Is it a legit valuation?
Hey Karthik,
Your work is completely outstanding. I\’m grateful to you for teaching the way you do.
I just had one more favor to ask of you. Can you please convert all the Chapters in Module 9 into a PDF as well? It makes it really convenient to read without an internet connection.
P.S – I\’m getting a Zerodha account just because I got to learn so much from the Varsity.
Hey Vidur, thanks so much for the kind words 🙂
And, thank you so much for choosing us as your broker. I\’m sure you will be equally amazed by all our other offerings.
Chapter 9 PDF will be ready once the module is completed. Right now, its work in progress.
Karthik,
Hats off to you for the kind of work you have done! Really Splendid. I have become a everyday follower of Zerodha.
This excel is really great, can I have similar excel for all the important financial ratios, which can be used for any company?
That would really great.
Thanks and Keep doing good work!
I\’m glad you liked the content, Gowtham. Will try and put up the excel sometime soon.
Hii If Free Cash Flow Is A Negative Number Is There Any Way 2 Calculate Share Price?
Nope, not that I know of.
Ok, Sir But If A Company Is Satisfying Most Of The Checklist But Unable 2 Generate Free Cash Flow, Should I Stay Away From Investing In Them? In The Same Context I Want 2 Ask U If A Company Is Great In All Parameter But Last 5 Year Revenue & PAT Growth Is Flat. What Should I Do?
I\’d hesitate to invest in both the cases.
Hi,
Regarding the capital expenditure, what if in the Cash Flow Statement, they are included with intangible assets, capital work in progress and capital advances. How do we calculate purchase of the tangible fixed assets??
You need to look at the note (or schedule) associated with the gross block. This will include the all the details, including the depreciation bit.
Hi,
Please suggest that how can i download this Fundamental Analysis PDF file, i am unable to download it.
Thanks,
Ashutosh
We are yet to put it up, Ashutosh.
Hello, Karthik! Thank you for a splendid article on Equity Research. I would appreciate it if you could shed some light on the cost of debt. How should one calculate it in an Indian scenario? What if the company is not paying any interest or is debt free? Is it in any way related to the Government bonds? If so, what should be an ideal spread for it?
Cost of debt really depends on the company and the kind of realtion/reputation it has in the debt market. Ideally for a well managed company, the cost of debt (under current economic scenario) should be around 9-10%.
All right. But how can I estimate that 9-10% on my own? Do I look at the financial statements? Or is there a website/journal which updates the Cost of Debt figures for the firms? I would be glad if you could direct me to any website or written material on this subject.
You will have the make this assessment yourself. This varies according to to the company you are dealing with…which further depends on the industry it belongs to.
Please suggest the site from where i can get the Annual report with full bifurcation of listed companies?
What exactly do you mean by full bifurcation?
i am using moneycontrol site .
I this site they give investing Activity but they do not give the bifurcation of the investing activity like purchase of tangible fixed assets etc
i.e they do not give full bifurcation of the header
so for comparing the different data in the P/L statement, balance sheet and cash flow statement which site you refer?
In fact, you should look at the Annual Report for data. That is the cleanest source of data.
Sir calculation of free cash flow made here is done with annual report .But most of the companies for eg Amara Raja didn\’t come up with annual report of 2017.
How can we calculate free cash flow using statement of audited financial results published after quarter on bse.
If possible then please let me know the formula.
Thanks a lot for educating us.
I think the AR is available. CF / BS is not published quarterly. Till you get the latest data, you have to depend on the previous year\’s numbers.
As told earlier u have explained everything in great detail, thanx a lot for the same. I only have one doubt, I have downloaded the excel sheet given at the end, in that sheet- u have divided the total share capital with face value so as to find out number of shares. Can u pl explain me why u have done so, till now I was thinking that share capital= total no of shares .M I wrong?
Share capital is the total nominal Rupee value of the outstanding shares ….for example if I have 10 shares worth 1000, then in a crude sense, share capital is 10000 and number of shares is 10.
So u mean to say is to get the total number of shares I need to divide share capital by face value eachtime ….Right?
Yes Sir.
Thanks
I did it using the consolidated statements in coal India annual reports
Yup, you should be working with consolidated statements.
Hi Karthik,
Thanks for the excellent chapter.
I was calculating the share value Coal India using the method described and got a value of around 550.
As the share is currently selling around 250, will you consider it as a good buying opportunity.
Please let me know your thoughts
If you have done it right, then probably its massively undervalued. You may want to double check all the variables before buying it. Good luck.
Hi,
Just wanted to ask. When there are different types of share class like in Tata Motors, which share class\’s no of shares outstanding should i take.
Suggest you stick to the regular EQ class.
What growth rate and terminal growth rate should i take into calculation ?
Its best if you keep the numbers very conservative. This also depends on the the industry/sector and the growth stage the company is in.
hi ,
i was going through intrinsic value calculation method. i have a follow up question
in today\’s scenario should i consider 7 percent as discount rate(since you considered 9% in 2014-15??
No harm is being a little conservative. I\’d still stick with 9%.
is this method universal for all kinds of companies like service companies , news paper, banks etc..
For them what is actual capital expenditure (considering their fixed assets are very less).
i calculated intrinsic value for sandesh(a gujrati news bulletin ) and it looks very undervalued ..
Yes, but do not apply this to banks and NBFCs.
Is there any method available for intrinsic value calculation for banks,NBFCs..
You can use a modified version of DCF….however, I dont know much about it.
Respected Sir,
Thanks a lot for educating all of us. I have a confusion. I performed the DCF for Akzo Nobel and the price band came around 2000-2500. Current price is around 1800, that is below the lower band which somewhat signifies that the stock is undervalued. While, the PE ratio of the stock is 35 which means the price is too much according to its earnings. What should we as an investor interpret in such a situation?
Hmm, assuming you\’ve done it right, then it suggests that the stock is undervalued. However, PE has nothing to do with this. It could be that the undervalued price itself is trading at a higher multiple.
Thank You so much sir for your reply. Just a clarification. According to the DCF the stock seems to be undervalued but according to the PE, the valuations seems expensive as we usually don\’t buy stocks above the PE of 30.
If you are confident about DCF value, then you should go with it I guess 🙂
Hello Karthik,
Why intangible assets cost is not considered in calculating FCF?
Thanks and Regards,
Ravi
Ah! I\’m guessing its because FCF considers only cash expense towards current and real assets. I\’ll have to do some research myself. Thanks for asking this question.
In today\’s high speed technology big players or institutions will get intrinsic value (as per model) through alerts and algorithms which may create arbitrage opportunity between IV and CMP and they will be the first to fill that gap and take profit, do retail investors have an edge after doing all the hard work (fundamentally) in today\’s trading environment?
Of course, FA is anything but an HFT environment. When a stock is trading at sub IV, then that price stays. For example if the IV of a stock is 100 but its current market price is 85, then the stock wont be in a hurry to jump to 100. It may happen gradually over few trading sessions. You will be in a comfortable position to grab that stock at attractive valuation.
Sir,
what\’s the difference between growth rate and dimnishing rate?
How to assume the dimnishing rate?
Growth rate is the rate at which any variable growing – could be EPS, Margins etc. Not sure about diminishing rate.
Sir,
How we will know the discount rate through which we have to calculate present value?
You can do this via WACC basis. But I\’ve not discussed this. You can assume a 10-12% rate for most of the stocks.
Sir, if we calculate the valuation of Sintex industries by the same valuation model, it comes out to be a negative value owing to high value of debt and small operating cash flow. Could you please explain in detail.
I guess the issue would be in their cash flow from operations. If a company is generating -ve cash flow, then estimating their fair value will be a tricky affair.
how to arrive at the fair value of stock in such cases
DCF will help you arrive at a fair value.
Hi Sir..can u pls tell where can i get DCF model for finding the IV of share where in the free cash flows are negative
No DCF calculators online I guess, Jaideep. Even if they are present, I\’m not sure about the authenticity.
Hi Sir,
Was performing FA for IOC, i am getting a total present value 908023 and total number of shares is 243 (both values in crores).
The intrinsic value is 3741.34 with upper limit 4115.47 & 3367.20, however the share price is hovering around 406 (when am writing this).
i can see that the intrinsic value has its decimal place shifted to right by 1 position when comparing with actual share price.
Are these decimal point shifts expected in DCF or Should I consider these stocks to be massively undervalued or is it that my calculations has gone wrong somewhere (has double checked, everything looks fine :))
Also, i am seeing 2 types of EPS values (basic & diluted) in the annual reports of many companies, which one should be considered for EPS Growth calculation?
Thanks,
Nirmal
I\’d suggest you take the diluted EPS.
I\’m guessing you would made an inadvertent error while converting lakhs in crores or some division somewhere….leading to the decimal shift.
SIR ..Not able to understand discount rate for dcf method ….is discount rate equal to risk free interest rate…??
No, it\’s not the same as risk free rate. Discount rate is the rate at which you will discount the future cash flow. It can be considered as the opportunity cost.
Sorry that would be FCF = Operating activities CF – CAPEX
then why the other two are not subtracted.
Great Job , karthik Sir . I am really inspired by your write ups .
Sir , i understood the things in complete except the arriving at the FCF.
You said that Free cash flow = Cash flow from Operating activities + CAPEX.
But you added only increase in the tangible fixed assets with CF from operating activities for ARBL’s FY14.
Why dint you add Purchase of Intangible assets or for that matter the purchase of Capital work in progress ??
Are they not a capital expenditure?
Yes, we only take the differential of cash. And CAPEX includes long term expenditures. WC is a short term in nature.
Respected Sir,
Thanks a lot for such valuable info & all modules.
I programmed two DCF calculators in excel that helped me & I hope will be useful to others as well. I would like to share it on this platform.
Here are links –
1) 2 Stage DCF Value Calculator (Portable, simple with only takes 3 years data inputs) – bit.ly / 2muDWyv
2) 2 Stage DCF Value Calculator with Margin of Safety (extended for multiple years data inputs) – bit.ly / 2muLuBi
(input cells are highlighted grey color, rest is calculated automatically)
Once again thanks to Zerodha team for great efforts !!!
Regards
James
Thanks for sharing this, James! I\’m sure this will help many.
Sir,
Is this the only method to find the intrinsic value? If any other methods are there, then please share link sir.
thank u.
You can do a relative valuation as well…this does not give a you an intrinsic value, but gives you a sense of the current valuation – http://www.investopedia.com/terms/r/relative-valuation-model.asp
Hi Karthik,
Total Debt every where you are taking Long Term+Short term, however, at DCF calculation you are taking only long term debt, why so?
Regards,
MSP
For most of the ratios calculation we take total debt, however for DFC we can consider just the long term debt, especially if the short term debt is negligible.
Dear Karthik,
I feel there is an error in table (15.3 – The Net Present Value (NPV)) growth rate you have mentioned 18% and subsequent 10% but entire calculation is done on the base of 9% to get the \”Present value\”.
I request you kindly recheck this…. Tanveer.
Tanveer, 9% is the discount rate, which helps us bring back the future cash flow to present rate. The 18% and 10% used earlier is the growth rate of the the future cashflow.
Dear karthik,
Good job. Easy understanding. I am new to FA.
How one can identify, the transaction of capital expenditures?. I see in annual report, in various titles.
Pl. explain.
regards,
B.Sankar
Thanks Sankar.
Usually, an associated note will give you the details. Capex, for instance will be mentioned in the Gross block section, which is on the asset side of the balance sheet.
Hi there,
I have estimated the average cash flow of the company , but as per analyzing the growth rate of the 2 Phases {Phase 1 – Explosive growth , Phase 2 – Moderate Growth } , you in the above example we have used a rigid % figures for the 2 Phases ., now i just want to ask or suggest would it be better if we used the industry standards., as in we just get the average historic growth average (of FCF ) of all the peers .? or maybe any other way you can discuss .? And please submit your response as whether my suggest idea is doable ./feasible and how your suggested idea of using a rigid % growth figures for the 2 phases is more superior/inferior to the idea .?
Looking forward for a satisfying idea !
Please Also suggest a way out when the company i am assessing has a negative average cash flow ( step 1 )
Simple, just avoid it 🙂
Many good opportunities out there.
Of course, you can. Remember, valuation is also an art form! The agenda behind rigid numbers is to keep it conservative.
In topic 15.4, net debt = current year total debt – cash & cash balance. If it\’s in brackets, it\’s a negative value, right?……. If the net debt which is -218.6crs, is added to the total present value of free cash flow, it must be 6078.83 – 218.6 = 5860.23crs.
But you have added it giving a value of 6297.43crs……. Can you please explain the calculation, karthik???
Net debt = Total debt minus cash and cash equivalent
In case of ARBL,
Net Debt = 75.94 – 294.5
= Minus Rs.218.6 Crs
Therefore,
6078.83 minus of minus 218.6
= 6297.43crs 🙂
Hi Karthik,
WACC , from where we would get for a particular company.
Regards,
MSP
You need to calculate this. It is the weighted average of cost of debt and equity. Usually it is around 10-12% for any company.
Hi Kartik,
What if Cash Flow is negative number, as in for example of REC.
Well, in that case its hard to estimate a fair value using the DCF approach.
I would really appreciate, if you can guide on how to discover intrinsic value of such companies.
Also, i think similar would be the case for financing companies.
I should have mentioned this earlier –
1) If the CF is -ve for 1 or 2 years but +ve for rest, then it is not a problem. DCF is applicable, just follow the regular steps involved
2) If its -ve all through, I\’d suggest you look at relative valuations
Karthik, I am not quite clear on the denominator part of the terminal value formula. I understand that the numerator part is the FCF till infinity.(Discount Rate – Terminal growth rate) – What does this logically mean? Also, If the interest rate reduces, DCF suggests to pay more price for the same stock. Correct? Thank you! P.s: I am soon going to open an account with Zrodha. Thanks for all your help 🙂
Sure Dhinakaran, Zerodha will be happy to have you as a client! We look forward to your account 🙂
The formula is mathematically deduced from a longer expression (to begin with). I suppose to understand the logic, you will have to understand this derivation. Unfortunately, I don\’t have an online link, else I\’d have pointed you to the same.
How do we calculate the working capital change or we simply take the working capital change in cash flow statements. Please provide me the formula for net working capital where I had lot of confusions here. Thanks in advance.
Working Capital change captures the effect of cash on the cash position.
Anything that tends to increase the cash flow needs to be added and items which tends to decrease the cash position needs to be deducted. I guess the same has been explained earlier in this chapter.
How do you calculate the discount rate ?
You have to make in intelligent guess. Alternatively, you can take in WACC (weighted average cost of capital) to estimate this. My advise would be to take a number that makes sense and then build a data table which would reflect the changes in the discount rate versus the share price.
In FCF , only Purchase of tangible fixed assets is considered as capital expenditure. Why are the rest of the expenditures not included ( Purchase of intangible fixed assets,Increase in capital work-in-progress ) ?
What we are essentially looking for is the cash flow generated from operations, essentially current items. Things like fixed asset belongs to non current items.
Hi Karthik,
For me it is getting difficult to calculate Infosys intrinsic value. To calculate Net debt when i check total debt , I did not find any debt as such hence I took value as 0. and then cash & cash balance as 32697 hence net debt comes (32697) Please can you check and confirm. This is from annual report 2016
Net debt is Debt – Cash, since Infy does not have any debt, there is no point calculating this at all.
Thanks a lot for your response all the time.My question is while calculating the intrinsic value we take growth rate for 5 or 10 years.So the value we got is that the growing rate of the company we take and its value is after 5 or 10 years i.e. is we are calculating the present value for fcf of after 5 years.So how we conclude the present worth of the company in today\’s term in current financial position.Please correct me if I am wrong.
You add up all the PV of FCF along with cash in bank. Divide this over the existing number of shares and you get an idea of its intrinsic value (based on expected cashflow).
How to take the intrinsic value when the free cash flow is negative because intrinsic value is also negative or there is another method to calculate the intrinsic value when FCF is negative
There is no IV if the CF is -ve.
current year total debt = 75.94 which is also the long term borrowings
but long term term in non current debt. and current year debt is always short term borrowings.
can you please explain this.
thanks in advance
Ah, current year refers to the current financial year.
Is there anyway to find the intrinsic value of bank stock. From my view, DCF valuation doesn\’t work for banking sector.So pls provide me any source or idea to find the intrinsic value of the bank stocks or any other valuation methodology. Thanks in advance.
Banks are not really my strength Vimal, afraid I wont be able to help much here.
One another question my is that, I\’m going to read FA of a company So first I conclude the intrinsic value or read whole financial statemynts and ratios like first you described all statements and ratios of Amara Raja and in the end of time the intrinsic value is showing not capable to buy the shares right now. Please suggest me I\’m beginner. Sorry for my bad English as I already asked you about Hindi modules
Thanks a lot dear
Its exactly the same Sammandar. You have to start with the basic financial statements and progress towards identifying the intrinsic value.
Thanks a lot dear first and I still have some doubts before going further as you described about the Amara Raja in your modules. According to my understanding all stuffs were well & good at this point and in the end after evaluating intrinsic value we are not able to invest right now because of overvalued then in this case, Will we wait till undervalued if will wait then how much time because the difference is too much between current stock price(around 700 & intrinsic value (around 350), . Please tell me what is the right decision in this situation.
Thanks
Yes, usually its a good idea to wait till you get the right opportunity. However, this valuation model is old now, we have lot more data points (in terms of financial data). We need to use this information to check the latest intrinsic value.
Good, Thanks for kind advise
By the way how much time will you take for Hindi modules?
Not sure 🙂
Dear Karthik
The % no. like you took 18%, 9%, 8.5% those things are you took by yourself or by any rules & regulations?
Thanks a lot
No rules as such, you put these numbers based on experience.
First of all Karthik, I would like to thank you very sincerely and literally from the bottom of my heart for putting the entire module of fundamental analysis together. I have minutely followed till financial ratios (chapter 10) and have skimmed through the rest of the chapters due to prior familiarity with DCF and CAPM. And I can tell how much effort you must have put in to compile all this write-up.
I also started as an enthusiast, did a finance basics course, learnt a theory about present values, asset pricing and CAPM but still in practice, somehow I used to get stuck till Anual Report analysis (I have not yet done corporate finance course.) Somehow, I was not getting the link of connecting the real financial statements of a company to theoritical financial models.
I feel this is yet another reason to respect your effort as you have seamlessly tied all the three important aspects of fundamental analysis together.
1. Reading anual reports and financial statements
2. Using and moreover deriving financial ratios and taking out meaning of it, and
3. Fair value calculation.
Hats off!
If you wouldn\’t mind I have few tweaking suggestions and requests for individual topics in the chapters. I will put individual comments wherever applicable (and as I read again :D). I genuinely feel that will make this material even more well rounded.
Thanks and Regards,
Chad
Many thanks for the very kind words and the encouragement Chad.
I know the efforts are worth it when people take time to read this…and more importantly benefit from it. Please do share your feedback and I\’ll be happy to work around it.
should we use tangible fixed assets only or Purchase of fixed assets, including capital
work–in–progress and capital advance ? If so , how do we find only the Tangible fixed assets ?
Thank You .
The schedule associated to Fixed assets usually gives this information along with the accumulated depreciation as well. Suggest you look into it. Thanks.
can we take 5 years average free cash flow in place of 3 years ?
Yes, you could.
What does the lower price band and upper price band on NSE site indicate ?
Stock price movement on a daily basis can be controlled by exchanges to curb excess volatility. If a stock has a 5% upper and lower price band, then it means it can move up by a maximum of 5% and down by 5% for the given day.
What is Discount Rate?
Rate at which you discount the future cash flow. Discount here has a literal meaning.
Hello Karthik,
What are your criteria for selecting growth rate for first 5 years??Is it vary from company to company??Same question for Discount rate??
Yes, it would vary company to company, sector to sector. This would largely depend on your understanding of the business and the sector. There are no set rules here. However, keeping the numbers conservative is the key.
Hi,
Can you elaborate on WACC or discount rate that is used in Terminal value calculation. Can we always keep it 9% to 10% or will it vary from company to company?
Weight average cost of capital (WACC) gives us an idea of the rate at which the company is borrowing funds. To put it in a simple way – if you avail a personal loan form the bank at 12%, then WACC in your case is 12%.
Terminal Value – a company is expected to exist to perpetuity. So if it continues to exist forever, then it is supposed to grow at a certain rate. The average rate at which it will continue to grow is called \’Terminal Value\’.
Thanks Karthik. This is an excellent things you guys have done. Really appreciate Zerodha\’s effort to put this together.
Thank you 🙂
Sir, what if a company has no long term or short term borrowings (debt free)like NBCC?What should be the discount rate?
The discount rate is the same for all companies irrespective of the debt situation.
Can we infer that the more the difference in CMP to Intrinsic Value, the better stock to BUY, than vice-versa?
eg.
Scrip-A. CMP 100, IV 1000
Scrip-B. CMP 900, IV 1000
Can we infer that buying Scrip-A would be a better choice?
If the difference (scrip A) is so much, then you need to dig deeper and figure out why the difference is so much. But generally yes, higher the difference better it is !
Please elaborate the term WACC. How to calculate it ? or find it for Terminal Growth Value ?
Hi,
How to see Indian economic and global events ? any web link?
This is a useful site – http://mospi.nic.in/Mospi_New/site/home.aspx
from where mospi.nic.in we can find necessary information
I\’d suggest you use the search function on the site, Shishir.
what are the major global events and regulatory statements impact on Indain stock market? how can get this information on website?
As far as Global events are concerned, the main one if the FED monetary policy. For Indian events, check this – http://zerodha.com/varsity/chapter/key-events-and-their-impact-on-markets/
Sir…What is the \’\’Diluted\” number of share ?
Is that this kind of share count when finding intrinsic value per Share?(in case of infosis)
Diluted generally includes the total shareholding plus the authorized shares for issuance.
That mean they do not counting for calculation of intrinsic value per share?
Ex….Number of share used in computing earnings per share (Infosis)
Basic 1148472332 (only this are count)
Diluted 1148487674
If you want to be highly conservative then you can the diluted numbers.
If I would have calculated future value and PV for infosys 15 yrs back and eicher motor 6 yrs back. chances were that it intrinsic value of stock may have come in overvalued range after 1-2 yrs of calculation.
So I would have exited, but How to know that its not overvalued and still potential growth is left in stock/company?
Such investment decisions go beyond number crunching abilities. You should be able to assess companies management, business model, scale etc. This is where qualitative research comes into play.
Hi,
How do we get information about company\’s auditors,bankers whether they good or not?
You will get to know the names in the Annual Report. How good or bad they are is something you will have to figure out by means of research 🙂
Hi,
While calculating Net debt should we deduct Cash and cash balance from long term borrowing?
why we will not consider short term borrowing?
Because, short term debt is a current item, however Net Debt represents a longer term picture.
Sir how accurate are the intrinsic values that are provided by screener.in ?
Not sure Akshay.
as said by you sir
FCF is the base for dcf, but why do I have to forecast my future FCF on an average historical FCF
Without forecasting how else would you gain visibility on the future cash flow? The idea is to keep it ultra conservative and realistic.
Hi Karthik,
I am doing DCF analysis for L&T with the excel sheet provided above and Free Cash Flow average is Negative value for L&T. So the approx. share price is showing wrong values.
1) Can you explain how to do DCF analysis for companies with Negative Cash flows ?
2) If DCF analysis can\’t be applied for Negative Cash flow means, is there any other method to determine approx. values ? Any specific method names ?
Billa -its hard to model companies with -ve cash flow since most of the input variables are \’rough estimate\’. Also the reliability is mainly on the terminal value in case of -ve cashflows…also do remember terminal value is sensitive to discount rate.
In such situations I usually go by other valuation techniques – P/E, comparables, P/BV etc.
respected sir,………… if possible please give my answer as early as you can………..please…….thanks
respected sir, you have derive FCF = Cash from Operating Activites – Capital Expenditures, for the year 2013-14 i.e. Cash from Operating activities (after income tax) Rs.278.70 and Capital Expenditures Rs. 330.30 in P&L statement for the year 2013-14 i could not understand. please calculate Rs. 278.70 and 330.30 how it comes? Thanks a lot.
Sure, will check again and get back as soon as I can. Thanks.
Hi Nishu,
The Free cash flow (FCF) represents the total value of the business. It is calculated as follows :
FCF = Net cash from operating activities – Amount paid to purchase tangible fixed assets
FCF (2013) = 335.46 – 72.47 = 262.99
FCF (2014) = 278.75 – 330.36 = (51.66)
Please click on this link from the ARBL Cash flow statement to understand the computation.
Kindly provide the link.i am also confused.
Plz help.thnx
Which link, Samir? All the links are available in the chapter.
517.12* (4.5)/(9-3.5). Is not equal to 9000 crores, please rectify the figures, m getting doubt over my calculations
Oh sorry, my bad, rates not divided by 100.
Thanks, you got me worrying for a minute 🙂
I think the figures of future cash flow are wrong, there may be calculation mistakes. Please check as I am getting these, please see the attached file
Hi Kartik,
Can you please explain, how to calculated Current Year Total Debt & Cash & Cash Balance.
Is Current Year Total debt = Current Liability + Non Current Liabilities ?
and Cash & Cash Balance = Reserves and Surplus ?
Regards
Total Debt = Long term debt + short term debt
Cash & Cash balance = As stated in the Balance sheet, no need to calculate. However you can consider adding \’Investments\’ to Cash & Cash balance provide the investments are all liquid in nature (such as liquid funds, short term debt products etc).
Bro when you was explaning DCF analysis taking example of ARBL
you calculated Net Debt=Total Debt-Cash and cash Balances
Here you took total debt= Long term Borrowings
But it should be Long term Borrowings+Short term Debt
Explain?
Yeah, I guess I omitted Short term debt because it does not exist for ARBL. Also the \’short term borrowings\’ present in BS is \’Current\’, which is not really considered in DCF.
Bro in all bs, short term debts are taken in current liabilities??
Why you have not taken in dcf analysis
Whether to take it or not
Explain
Nikhil – Yes, please do include it.
Bro for DCF analysis which report is more suitable?
Standalone or consolidated??
Consolidated statements for everything!
How does greece crisis affect the indian share market?
Experts suggest that Greece is not a major trading partner with India…so it should not really affect us much.
In case of banks and Financial Institutions, mostly CashFlow is negative and excel sheet shows wrong Valuation data.
Any idea how can we do valuations in case of negative net cash flow ??
Valuation of banks is a little tricky. Will try and upload a chapter on this soon.
Hi Karhtik,
I have a query on DCF calculation. Here goes the question
1) When a company like for example KNR constructions has subsidiaries and hence consolidated financial statements, then do I use the values from consolidated balance sheets for DCF calculations?
2) In case of KNR, if I use the consolidated statements I get a negative value for average free cash flow (I took 3 years, then 2 more years making it 5 year average) and hence negative PV\’s. However If I take the standalone values which are much better I get a positive value and considering the results of the 2 quarters of FY2015 which have already passed and estimated 3QFY15 values, the stock price comes very near to what it is presently trading at in the spot markets. I would like to have your view on this.
It is always a good practice to look into the consolidated numbers. Imagine this – a person could be earning a great salary on a month on month basis, but if he lives in a joint family with 10 dependents on him, draining away all the money he earns, then obviously his salary pales in comparison to his monthly liabilities. The family is his, and one cannot really separate it from him. Like wise with standalone and consolidate numbers. In fact there are companies which on a standalone basis has horrible numbers but on a consolidated basis the whole scene changes.
In \”= 9724.89 / (1+9%)^10\” what mean of symbol of \”^\”. pls explain because I no read it in normal maths.
The symbol \’^\’ means – raised to the power of. So in the mathematical expression – \”9724.89 / (1+9%)^10\”, it means the number 9724.89 is divided by (1+9%) which is (1.09) raise to the power of 10.
Hi Karthik, Instead of taking the projected values of FCFF , finding the NPV and then subtracting Net Debt to find FCFE, can\’t we calculate FCFE for say 5 years, find the average and then project the future values on this average growth value?
You can, if fact that is what you do when you build a financial model. I dint discuss that as I thought it could be a bit heavy. Maybe I\’ll introduce a module on Financial Modelling at some point in the future 🙂
Hi Karthik, I was looking at the attached cash flow statement, Could you tell me whether Purchase of Fixed Assets Including Capital work in progress and Capital advances can be considered as CAPEX for finding out the FCF or should we take out CWIP and Capital advances from the given value?
Hi Karthik, another question related to the above image.
In the attached image above, as you can see there is a significant Finance cost involved. So I take it that we add (1-tax)*Interest to FCF to calculate FCFE. That is FCFE=CFOA-Capex+(1-tax)*Interest+NetDebt.
I have the following questions – 1) For Interest*(1-tax), I consider only Interest costs out of total finance costs right? The other cost in the total Finance cost here is Foreign exchange loss.
2) (1-tax), here is the tax rate; Current tax/EBT? or Total tax(Current +Deferred+Taxes of earlier year)/EBT?
Yes, you will have to account for the benefit of tax shield that the company enjoys by virtue of paying interest. The formula what you have stated is correct. Forex loss should not be included in this calculation. (1-tax), here the tax referred to is not the tax amount, it refers to the corporate tax rate, which is a % figure. Usually about 34%.
Keerthan – You can include this in FCF calculation.
Karthik, from FCF that is Cash from OA-Capex you have arrived at Cash from Op Activity-Capex-Net Debt that is FCFE right? Why is Interest*(1-t) missing in the equation?(FCFF). Could you explain these concepts? FCF,FCFF and FCFE?
FCF/FCFF = Free cash flow to the Firm. A firm includes both deb holders and equity holders. FCF conveys to us how much cash the company is generating for both these types of holders. However if we have to find out the cash component specifically for equity holders then we got to look at \’Free Cash flow to Equity\’ or FCFE. FCFE gives us the cash component applicable to the equity holders of the firm. Yes, taking interest*(1-tax rate) makes sense but I guess since the interest component was very low, I must have skipped it. By taking interest*(1-tax rate) we are actually accounting for the tax shield the company enjoys by paying an interest to debt holders.
OK. I just came across Zerodha Varsity last weekend and I must say I am very impressed with the material. It is very simple, lucid and clear. I have some suggestions for you. Both TA and FA modules are very good.
1) In TA you could also look at adding a chapter on Elliot Waves. It is an extremely helpful tool.
2) In FA you could also add a module on relative valuation methods, (P/E, EV/EBITDA, Market capitalisation/Free cashflow yield, Enterprise value/Free cash flow yield etc). These valuation methods are equally good especially the one\’s involving cashflow yields.
3) You could also be a module on valuation metrics in different sectors for general understanding (Cement, IT, FMCG, Realty etc).
4) There could be a brief write up on taxation as well( LTCG,STCG etc)
Even if you so not add any of these, It is still an excellent job so far.
Correction-
3) There could be a module/ write up on valuation metrics in different sectors for general understanding (Cement, IT, FMCG, Realty etc).
Thanks for you kind words. Zerodha has taken a lot of efforts to build Varsity…it is still in a early stage, it will have a lot more content as we go forward. Will try and include all the topics you have suggested, please stay tuned. Right now the focus is on Futures and Options as there are many request coming in for these modules.
Would you pls explain what constitutes Large Cap, Mid cap & small cap cos?
I personally use this classification –
1) Between 50 – 500 Crs of MC – Ultra Micro Cap
2) Between 500 – 2000 Crs of MC – Micro Cap
3) Between 2000 – 10K Crs MC – Small Cap
4) 10K to 25K MC – Mid Cap
5) Above 25K MC – Large Cap
Note MC = Market Capitalization.
Hi, Few Questions…
1. On what basis should one select the future growth rate of FCF? Has it got to do anything with Profit growth rate(NP or GP)? if not, then
how should we determine the growth rate?
2. Why did you select the discount rate of 9%? Is it related to Cost of Capital (or WACC) of the Co.?
3. The above exercise is based upon FY14 results summary. The results must have been out somewhere in the month of April or so. Then,
how could one have purchased the stock in FY13-14 only without knowing what the results are going to be? And also, the stock was seen
trading closer to the upper band of the intrinsic value (in the month of February-March), which doesn\’t warrant adding stock to one\’s
kitty. In other words, it appears to have traded at around fair value. Then why would one invest in the said stock once results were out.
My answers in line –
1) This is the hard part, there is no clear basis that is prescribed. I personally prefer to be as conservative as possible when it comes to setting the FCF rate. I never exceed 20%. Besides, I prefer the 2 stage DCF process where I have two different FCF rate.
2) Yes, the discount rate is nothing but the weighted average cost of capital (WACC). 9% is probably a bit low, I should kept it at probably 10 -11%. In fact this is the reason why I have given the excel link, people can feed in their desired rate and play around.
3) You maybe right on the 3rd point, not sure how I erred here. Let me re-look and if required rewrite.
Hi Karthik,
Do you still vouch for above example\’s validity in the context of the fundamental concepts taught by you…
Sorry, dint get that…are you talking about ARBL?
Yeah, Very much. The point no.3 in our discussion
Harshad – I have made the necessary correction in the chapter.
hello sir,thank you so much for your precious guidence.sir pls explain how to calculate the WACC or discount rate.
The calculation is quite cumbersome. I\’d suggest you take a figure in and around 10%.