
3.1 – Annual Report recce
Picking up from the previous chapter, now that we have our excel sheet set up, we will extract the data from the annual report to our blank excel sheet. The excel sheet at this stage should look like this –
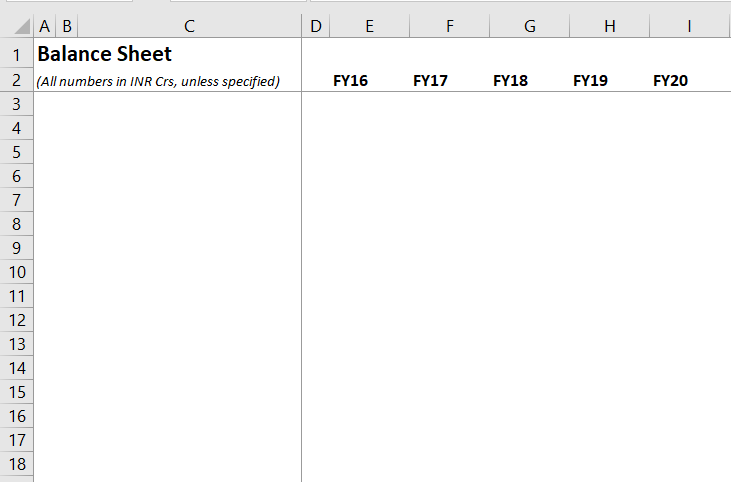
And a similar page set up for the profit and loss statement.
Now, before we start extracting the financial statements data from the annual report to the excel sheet, we need to conduct a simple survey of the annual report. Remember, for our financial model; we need the historical financial data from the last five years. We will use the data of the last five years as the primary input for the model.
It is essential to ensure that the last five years data is consistent and there no missing items in the statements. Let us understand this with a quick example.
Assume this is the revenue section of the P&L for an imaginary company –
Year 1 –
-
- Gross Income
- Duties
- Net Income
- Other income
Year 2
-
- Net income
- Other income
The company states the Gross income and duties paid in year one, but in year 2, the company states the net income directly. Inconsistencies like this can be a problem while modelling since it creates multiple gaps in the model. For this reason, even before we start copying the data from the annual report to the excel sheet, we need to first look at the last five years annual report and ensure that the statements are consistent over the years we are interested.
Let us go ahead do this now.
In the previous chapter, we discussed the ‘main model’ and the ‘helper model’. The main model is the one in which we will build a financial model end to end, and the helper model will help us understand concepts related to the financial model.
So I guess it’s time to introduce the company which will act as the first ‘Helper Model’.
We would be dealing with Relaxo Footwear. Relaxo is one of the largest manufacturers of footware in the country.
As a first step, I download the company’s last five years’ annual report and put these in a single folder. Usually, a listed company puts up the annual report in the ‘Investors’ section of the website. I’d suggest you download the same from Relaxo’s website.
My folder with the annual reports looks like this (I know this is basic stuff, but I’m posting an image just for clarification) –

I’ve even renamed these reports in a format that I like. I now go ahead and open all these annual reports side by side.
Please note, we deal only with the consolidated financial statements and not the standalone statements.

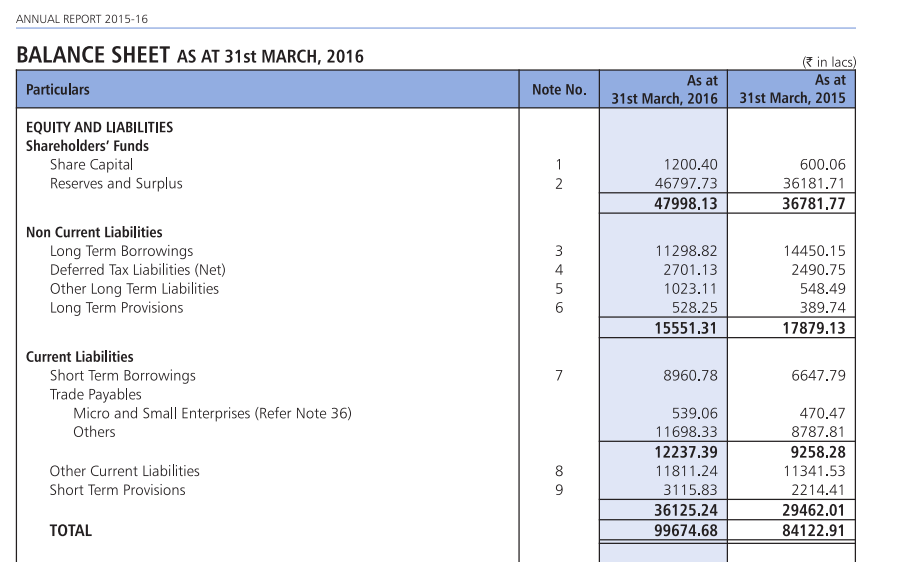
I’ll start by reviewing the consolidated balance sheet of the company. At the very first inspection, I can see that company changed the accounting format in 2018. How did I figure this? Well, take a look at the below screenshots.
Balance sheet as stated in March 2016 –
Balance sheet as stated in March 2017 –
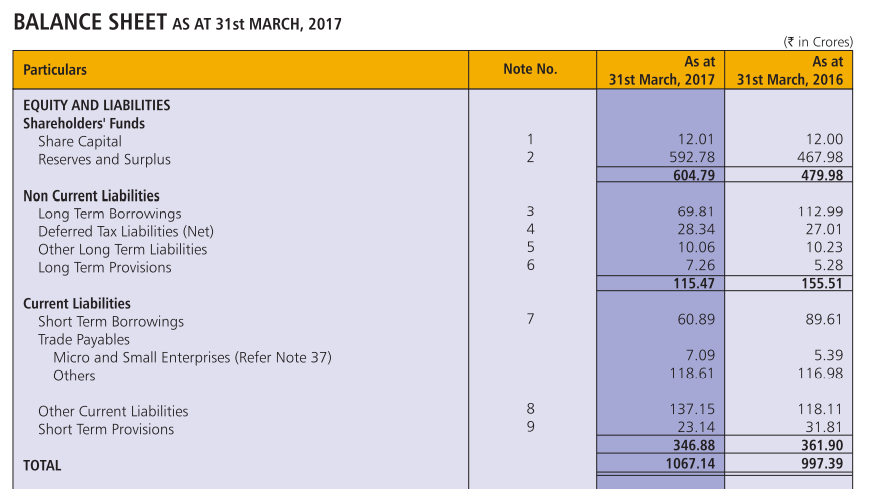
You’d probably know that in every annual report, the company states the numbers for the financial statements for the year in review and the previous Financial year. This is the case in the above two snapshots. However, for the Financial Year 2018-19 –
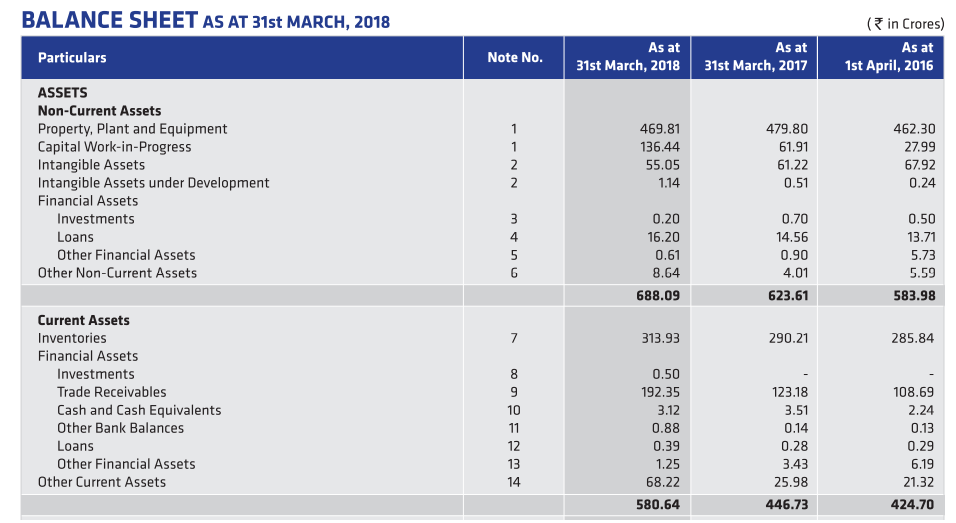
The company has restated the Balance sheet for FY 2016, 2017, and 2018. So as a financial modeller, I’d ignore the financial statement from the 2016, 2017 Annual report and take the numbers for FY 2016, 2017, and 2018 from the 2018 Annual report.
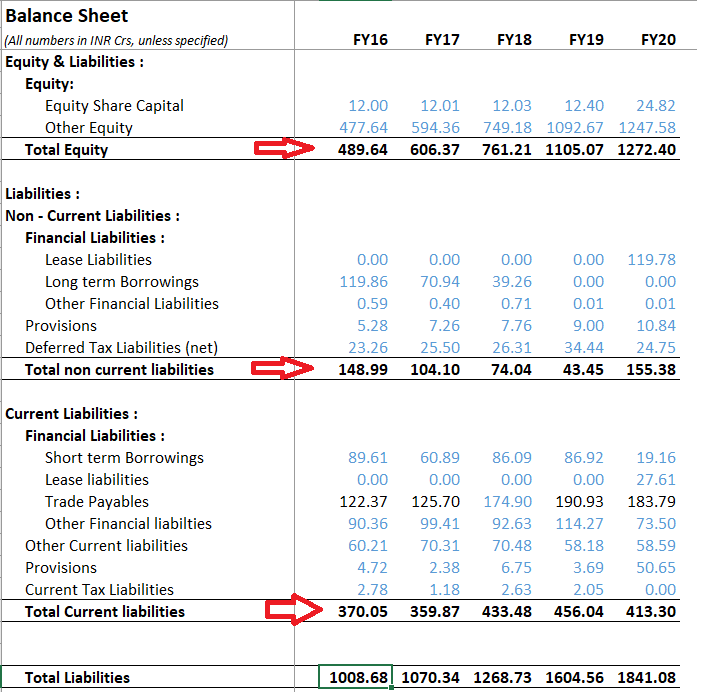
Next, when replicating the Balance sheet on excel, I’d take the line items as per the latest financial year. Let me explain why; here is the balance sheet snapshot as per the 2020 Annual Report –

Under current liabilities, there is a line item called ‘Lease Liabilities’, but this was missing in 2018 and 2019. But because it is present in the 2020 balance sheet, I will have to consider this line item and include it in my excel sheet; of course, the value against this line item will be 0 from 2016 to 2019, and INR 27.61 Cr in 2020.
I’m trying to suggest that if you take the line items as stated in the latest year annual report, chances are you’d have covered almost all the line items. But this is just a hack; it may not work all the time.
3.2 – Data extraction
Alright, with that in place, let’s start extracting the data from the Annual report to the excel sheet we set up in the previous chapter. Of course, this is a lot of manual work, but there is no other way around this. Remember, we start with a blank excel sheet; we’ve only set up the skeleton for now. My sheet looks like this –
![]()
To start with, on the left-hand side of the excel sheet, I type down the line items of the balance sheet. The order in which these line items are listed is the same order in which the balance sheet is reported. Please take a look at the snapshot below; I’ve typed out the assets side of the balance sheet.
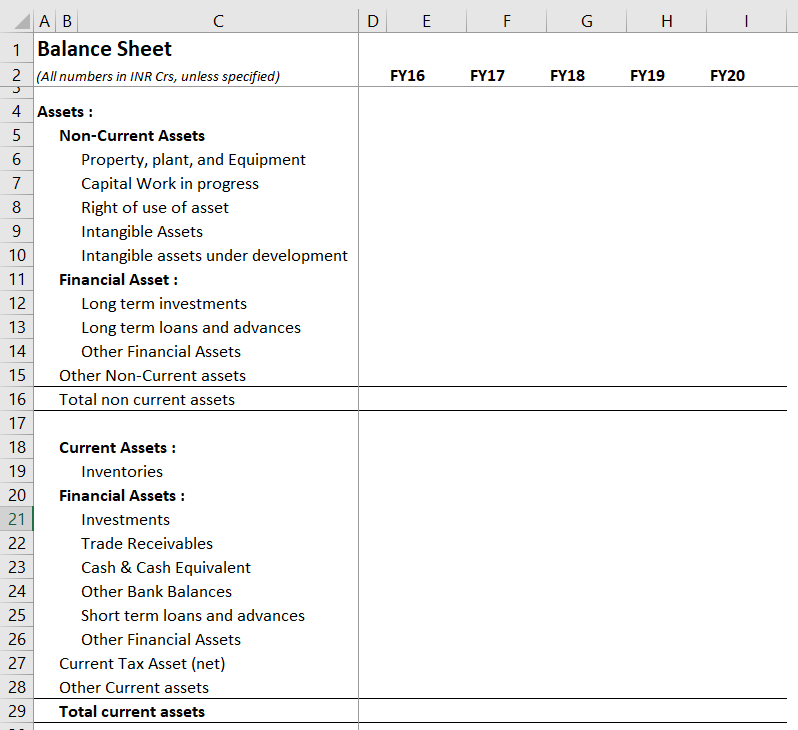
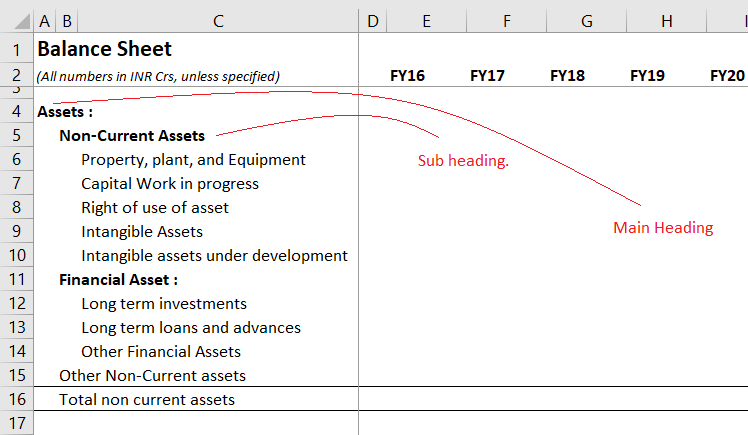
Notice a few things here; I’ve used column A and B as an Index. I’ve typed out the heading and subheadings in these columns. I’ve highlighted what I mean by main and subheading here –
In column C, I’ve mentioned the actual description of the line item. There are two main reasons to do this –
-
- Indexing and segregation of heading and subheading is an excellent way to present financial statements. It not just looks easy on the eye but also captures more information
- Navigation becomes easy
What do I mean by navigation? When you have a lot of data to deal with, you need a quick way to navigate through it, and excel allows you to do that. I want you to do a small exercise to appreciate the ease of navigation.
By the way, I’m assuming that at this stage, you’d have entered the asset side of the balance sheet in your respective excel sheet, in the same way as I’ve done. If not, I’d suggest you do that quickly before reading further.
Now place your cursor in cell B5, where we’ve typed ‘Non – Current Assets’. Now, press the control key + the down arrow on your keyboard. The cursor should directly jump to the next indexed cell, i.e. ‘Financial Assets’.
This quick jump helps you navigate faster and focus on the primary data chunks.
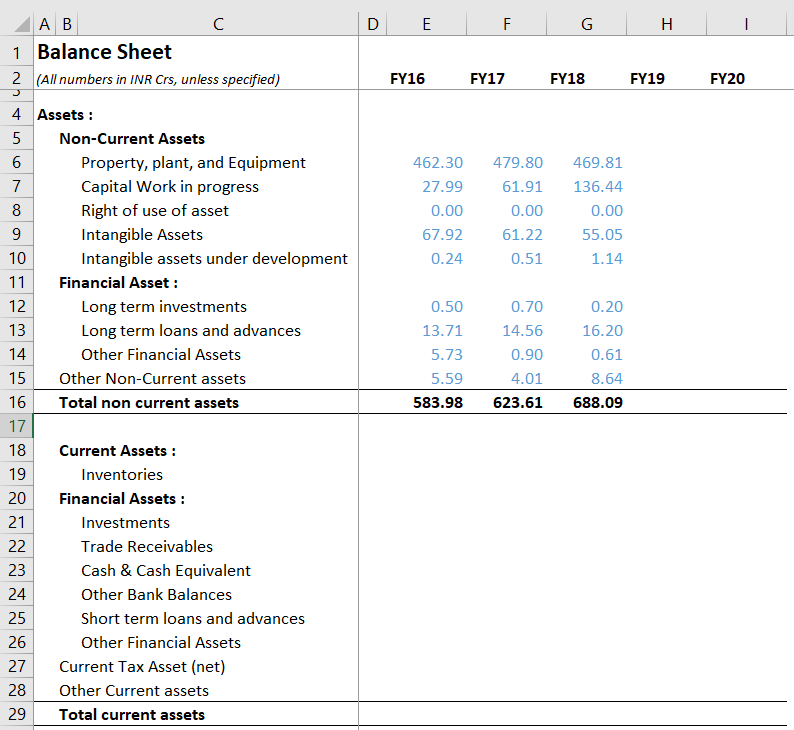
I’ll proceed to set up the liabilities side of the balance sheet as well. So at this point, my balance sheet sans the values is set up. Here is the snapshot, but please excuse the compressed image; this is the only way I can present the entire balance sheet in the following image –

Once you’ve reached this stage, the next step is to copy the data from the annual report to the excel sheet. Please do recollect; I’m looking at the 2018 balance sheet to copy the data for 2016, 2017, and 2018.
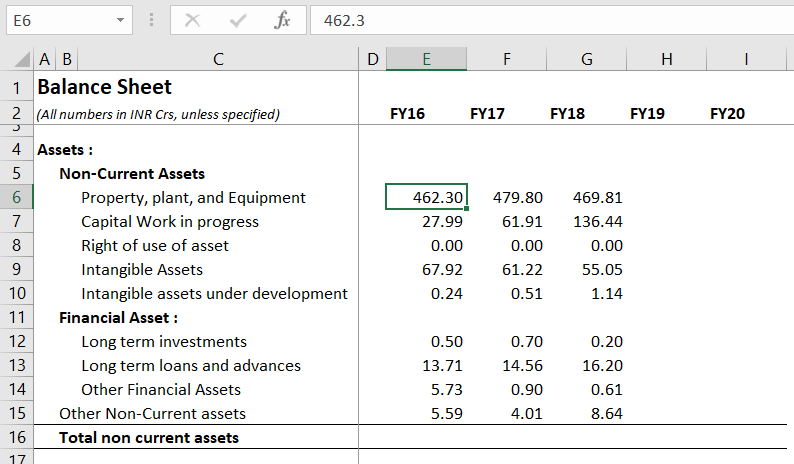
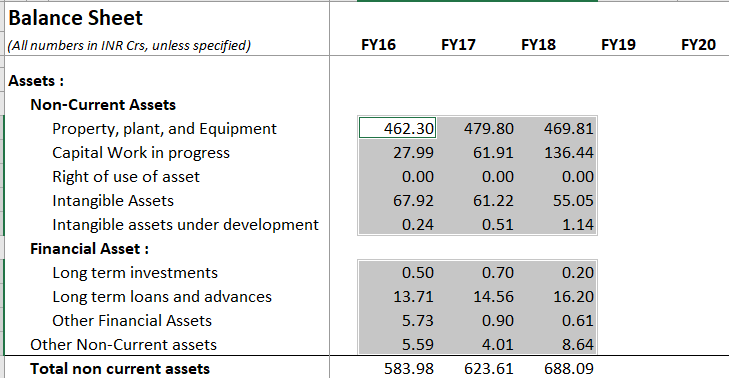
Let’s deal with the ‘Non – Current Assets’ first. Here is the snapshot from the annual report –

I’ll go ahead and copy the same onto my excel sheet –
So far, so good, I suppose.
3.3 – Assumptions, facts, and format
In the image above, I’ve deliberately placed my cursor in cell E6 so that you can see that the number, 462.30, is copied from the balance sheet and not a calculated number. In a sense, this number is hardcoded.
In the financial modelling world –
-
- The hardcoded number is considered as a fact because we are directly copying the number from the annual report
- A calculated number is considered an assumption since we apply a mathematical operation to arrive at the number.
Given this, it is essential to distinguish between the facts and assumptions in a financial model so that the user of the model can quickly identify which numbers are flowing directly from AR and the calculated numbers. Also, you will know where to look in case of an error in your model.
I’ll explain how this can be done, but before that, let’s add up the total non-current assets.
I’ve used the ‘=sum()’ function in excel to calculate the total non-current asset. The calculated number is treated as an assumption since I’ve calculated this on my own. The easiest way to distinguish assumptions and facts is to colour code the numbers.
You can easily colour code this by selecting all the hardcoded numbers in one go. Click the function + F5’ keys on your keyboard; you should get the following pop up –
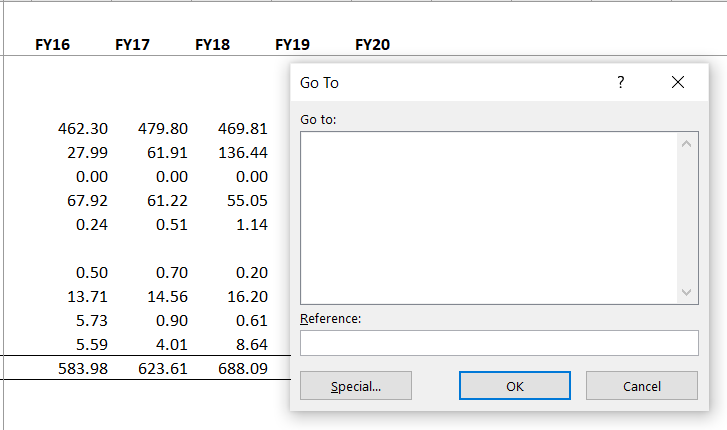
Now click on special, and select only constants and numbers like shown below –
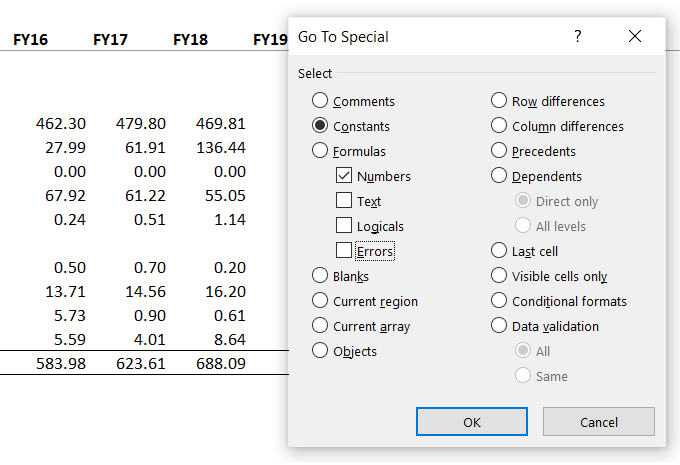
After you click ok, excel will highlight the hardcoded numbers or the facts.
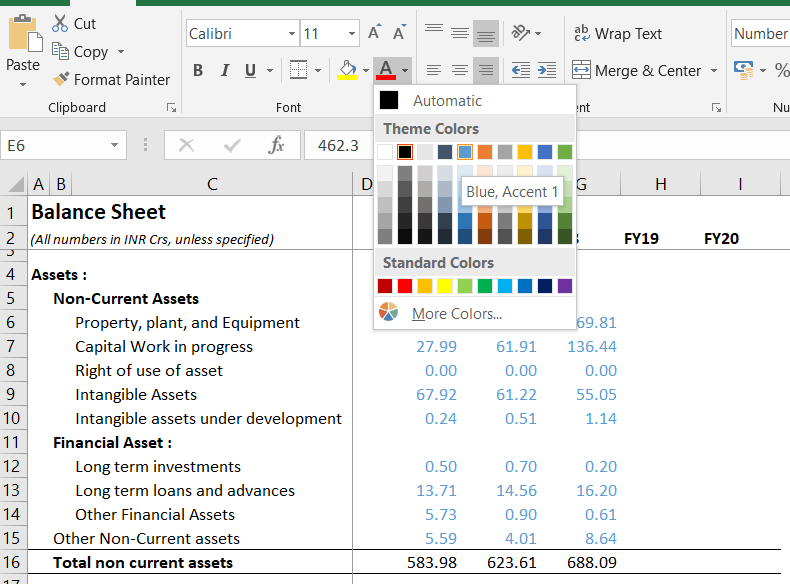
Now without deselecting the numbers, select a colour of your choice. I prefer light blue for this, but you can pick whatever you like –
After you select the colour of your choice, you can keep the total non-current assets in bold.
If you have managed to follow the above step, then the rest of it is pretty straightforward. All you need to do is extract the numbers from the balance sheet and P&L and put them on your excel sheet.
3.4 – Other things to note
Some of you may wonder about the necessity to add up the numbers and colour code them. For example, one can copy the total non-current asset as well; why calculate it separately?
We need to calculate these numbers because going further in the model, we will project each line item in the balance sheet for future years. The total is calculated anyway. Therefore, calculating it now will maintain consistency in the model.
Before we conclude this chapter, few formatting tips –
-
- Keep the numbers right-aligned
- Extend the decimal points up to two digits
- Keep all the heavy numbers in bold; these are usually the subtotal and main total numbers
- Use double borders for cells wherever necessary
I’ve completed filling up the balance sheet. I want you to pay attention to few last things –
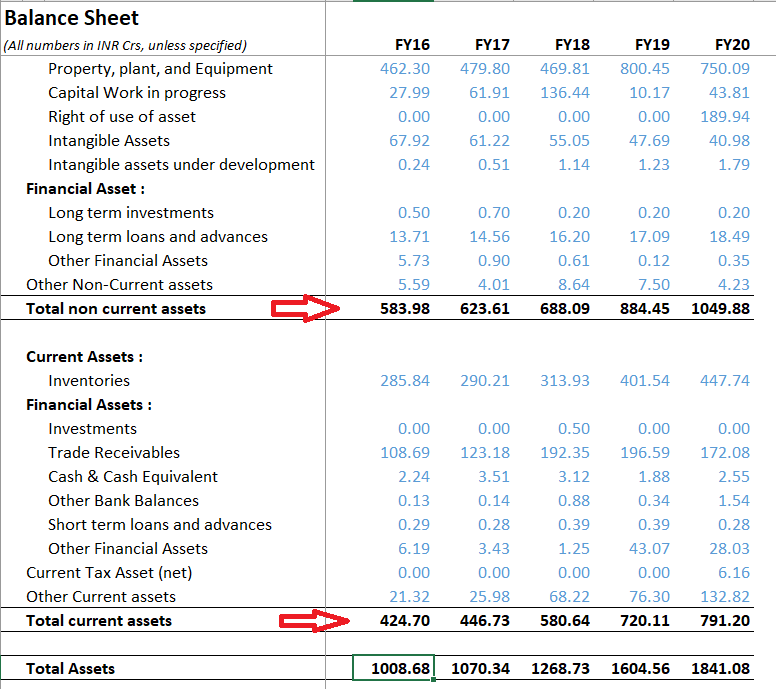
I’ve calculated the total assets on the asset side by adding up the two subtotals, i.e. total non-current assets and total current assets. I’ve taken a similar approach on the liabilities side as well –
Lastly, to ensure my balance sheet is balanced, I run a ‘True’ and ‘False’ check. Remember, if assets = liabilities, that means the balance sheet is balanced.
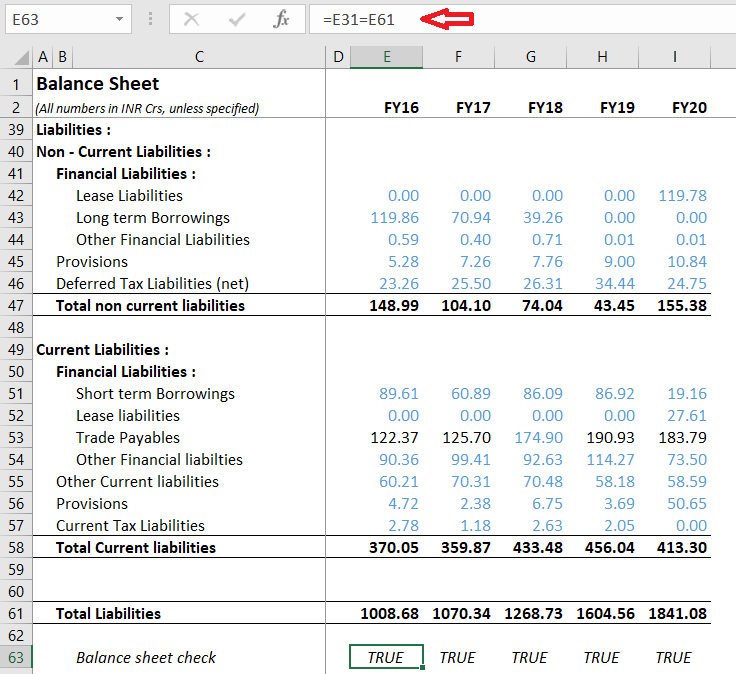
Since it’s true, the total assets are equal to total liabilities. Hence my balance sheet is balanced. I’m not going to explain the data extraction method for P&L. It is a similar process. Do let me know if you get stuck on any of the steps; I’ll be happy to explain. But I do hope your P&L would look like this –
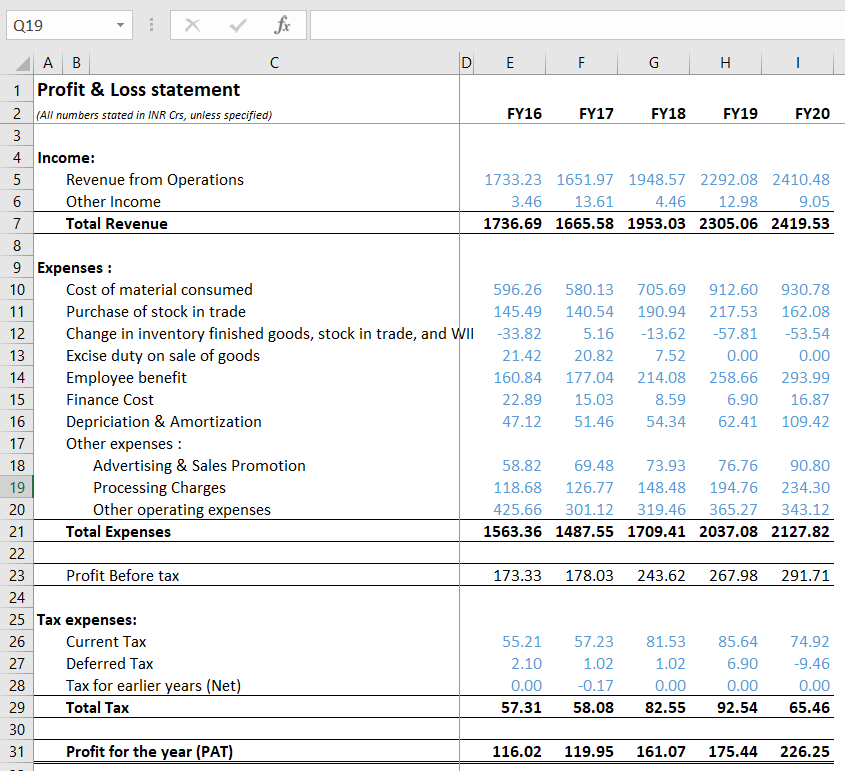
If you are attempting the P&L, you will notice that the ‘other expense’ in the expenses section is expanded. I’ve done this deliberately to showcase that when you have a heavy line item in the P&L, then it probably is not a bad idea to break down its constituents. The reason for doing this is that we can model these lines items at a more granular level, thus ensuring our model is realistic.
Remember, Relaxo is the helper model, and this won’t be our main model. We used this to help us understand how data can be copied from the financial statements to excel. We will move on to the main model in the next chapter.
By the way, ‘Historical data’ was supposed to be the first step of financial modelling, but I hope you realise that many tiny little steps are hidden within the main step. You can expect the same for all the other steps.
As an assignment, I’d suggest you replicate the balance sheet and P&L on your own. I’m sure the learnings from this exercise will be exciting.
Download the excel sheet used in this chapter here.
Key takeaways from this chapter
-
- Perform an annual report recce before setting up the excel sheet
- It makes sense to take the latest year’s financial statement for the format; the chances are that you will cover all the line items. But this is only a hack
- Indexing helps in quick navigation
- Differentiate between fact and assumption data points. You can do this by colour coding
- Maintain format hygiene across the sheet
- If need be, breakdown the heavy line to get a better granular view
Hi Karthik,
Thanks for your great work!
You have mentioned that this financial modelling is not applicable for banking / finance sectors. How to perform integrated financial modelling for the companies in those sectors?
You can look at relative valuation, Gautham.
Hi, Are there any resources that your recommend for the PE/VC modeling from a US perspective?
Not that I can think of.
You asked us to copy the balance sheet and P/L statement as is, then in the next chapter (chapter 4) the whole format changed. Where did Net block and gross block and all these simplified terms came into picture?
Hmm, I\’ve explained the layout and template to follow right?
I tried to figure out but I could not. only Processing charges has been added under other expenses from \”Manufacturing expenses\”.
Sure, is the company you are dealing with is into manufacturing? Because if the company is into heavy manufacturing, then it should have stated the manufacturing expense in P&L.
In the P&L FY16&17 there is something called \”Manufacturing expenses\”, why we did not make an entry of it for 2016 & 17? and I also did not understood why it has been removed from P&L for other years from 2018?
Request you to pls double check from notes in annual report as well. I dont think its excluded, it maybe clubbed under other expenses if at all.
Cool, thank you! 🙂
Happy learning 🙂
Understood what happened here, Company changed the numbers for some particulars for FY2019 in column in FY20 annual report. For eg.“Trade receivables(H22) were 196.59 in FY19 AR but this number changed to 222.57 in FY20 Annual report. This has happened with few more particulars in balance sheet. Which number we should consider if company changes their previous year amounts in latest year AR? Please let me know.
I\’d suggest you take the numbers from the latest annual report.
hi, While tallying my excel sheet with the provided excel sheet I noticed that FY2019 \”Trade receivables(H22)\” are 196.59 where as in actual Annual report it is 222.57. I was wondering and wanted to know is this already corrected later in the next chapters? or for now can I change my numbers as per provided excel or keep it 222.57 only?
Not sure exactly where this will lead to me so I asking.
Ah looks like you figured. I checked your other comment 🙂
I did find it but why did we take the value of years 2017 and not 2016 like the rest for Advt and Sales , Processing charges in the other expenses
I\’ve explained why it makes sense to take the data for previous year from current year annual report. Request you to check that.
Sir in the subdivision of other expenses for FY 16, I\’m not able to find the numerical for Advt and sales expenses, and processing charges.
Do check the notes under the expense, you will get the details.
Sir can we expect this module in PDF Format. Please make it available in pdf format. It really helps us. Thank you
In FY16,the other income amount is different from the annual report, in AR it is 225.42 (in lacs) if converted in cr then it should be 2.25. But in model which you have made, the amount of other income is 3.47. Is there anything else added to the other income? Please help me with this
Hmm, not sure. Btw, I would be taking data from the next year for this year (as stated in the annual report). So please check that.
In P&L statement sheet, Expense side \”Exceptional item\” & \”Profit before exceptional item\” is missing. How to consider for calculation in model?
Check the nature of these line items, if its small and one off, then its ok to ignore in the larger model. If its reoccurring, then you will factor that it.
Good Eve Sir,
How to download this module as pdf?
Thank You
There is a PDF provided at the end of the module page, please click on it and download.
Yes sir in notes its security deposit which is 15.34cr.
Security deposits are recoverable upon termination of agreement unless otherwise agreed. (can you please elaborate this)
while entering values in excel can we simply ignore the security deposit and enter
the (loans to employees which is 0.09 Cr)
It seems like a rental clause, Ashay. Yes, you can ignore I guess.
Sir I have downloaded annual report of relaxo footwears for last 5 years from company\’s website however in all annual reports it has only one balance sheet(consolidated).
In annual report FY 21 in Assets line item (Loan) is 15.43 Crs But, in annual report FY22 the same balance sheet for FY21 in Assets line item (Loan) is 0.09 Crs.
so while entering the values in excel sheet which one should I enter 15.43 or 0.09 as there is huge difference between the two and both the values are in Crs.
Please check the associated notes for the reasons for this. Is this because they have sold off assets or any other reasons?
Hey im doing this on a different company in which the annual report has numbers in INR million so i converted it to INR Crores but im getting a difference of .03 in assets and liabilities , is it ok if just manipulate the data by .03 or should i make the balance sheet again in INR million.
It is a personal preference. I prefer to see it in Crores, but if you are ok with millions, then there is no need to convert. You can use it straightaway as is.
Karthik,
Firstly, thanks for the content and its been amazing reading so far for all the modules
Question : do we have any API which provided the data which you are trying to exact from the Annual report again this should be historical values and it should contains data for all fields which you are trying to extract
i did a search and found Yahoo finance was having and now shutdown, do we have NSE or any vendor who had the APi so we can consume?
Thaks Madhu. I\’d suggest you try this – https://www.bseindia.com/static/about/xbrl_info.aspx
Hello Sir,
Why the trade payables mentioned in the excel is not reflecting the balance sheet number. For TP You added some values.
Please advise.
Trade Payables 122.37 125.70 174.90 190.93 183.79
It is mentioned right?
I found different value for net profit in two annual statements for same year. I tried to find the reason for this discrepancy but couldn\’t find it or I missed it in the annual report. Can you tell me which section might reveal some information regarding this? Which value should I take?
Use the numbers from the latest annual report, Prajwal.
Learned a lot of things in this chapter.All seems to me very interesting.A great thanks to the team.
Thanks for the kind words, Ujjal. Happy learning 🙂
From where you got the breakdown of the Other Expenses line item ? Could not find it in P&L data of the AR.
It will be present in the AR, please check the P&L and the associated notes under expense.
Hi Karthik,
While Extracting the data from AR 2019-20, I noticed that the Inventories for FY19 have been updated from 401.54 to 382.43 and the Trade Receivables have been updated from 196.59 to 222.57.
I see that you have considered the data from AR 18-19 and have not used the updated numbers. Why is that? and what does this difference imply?
The numbers do tend to get restated whenever there is a balance sheet event. This is normal practise. We will be putting up a reel/Youtube short on this topic soon 🙂
How will i able to identify between facts and fabricated facts in an annual report.
Why any business would tell me real facts of his business
Is product demand and expected business a same thing?
For example: 1. \”Expected business which a company would get in its coming year\”, is this a fact?
The easiest way is to check the annual report of a competing company and see if they too are stating similar things or if there is a big difference between the two narratives.
I was preparing the balance sheet for Atul Auto Ltd. I find \”False\” in Assets=Liabilities.
Assets 29,930.22
Liabilities 29,930.23
I don\’t understand why. I\’ve typed data several times, the results is the same. Kindly help.
Thats because of the 0.01 paisa difference 🙂
Hello sir, I just observed that in the FY 18 AR trade receivables as on 31st March 2018 were at 192.35 csr, but in the FY 19 AR trade receivables as on 31st March 2018 were at 173.45 crs. Similarly, trade receivables as on 31st March 2019 were at 196.59 crs but in the FY 20 AR it is recorded at 222.57 crs. I tried checking the notes but I was still unable to understand the reason for this difference. Can you please explain why there is this difference in the annual reports?
One of the reasons for this is that numbers get restated. One thing that I prefer to do is if I\’m interested in looking at FY18 data, then I\’ll check FY19 AR for FY18.
Just just had one query how did you get the P&L operations pls can you explain
P&L operations? Can you share more clarity on this question please?
Sir I have bit confusion in p&l statement,in fy 2018 revenue from operations mentioned 1964.44 but in your p&l it showing 1948.57 so is there any mistake in it or something else that I don’t understand?
I must have excluded Other income. Can you check that again?
hindi me translate kijiye
\”Payable for capital expenditure\” is part of other current financial liability or other current liability?
It is current liabilities as far as I know. Do read the notes for the associated description.
Current maturities of Non current borrowings is part of borrowings (under financial liabilities) or other current financial liabilities?
It is a part of borrowing.
In the company which I took, \”Right of use of assets\” is not mentioned in balance sheet in latest Annual report (FY 22) but it\’s mentioned as a line item in FY 20 and FY 21. So should I add a row for it or add in PP&E?
Yes, add a row and include it. It will be 0 for FY20 and continue from FY22 onwards. Since its a new data point, you can consider keeping it constant for future years.
Hello Sir,
Thank you the module and making it easily understandable!
My question is:- Some line item numbers in the previous year financial statements change in the following year\’s financial statement\’s last year column. Eg: the numbers of the year 2019 in the annual report of 2020 is not same as the data in 2019 annual report. Why is it so? And which data should we take for modeling purpose?
Thank you
If this happens, its most becuase the company restates the numbers. Also, this does not happen all the times. Take the latest numbers.
Hello sir!
Thank you so much for taking up this module. I wish to make a small contribution to make the manual task of copying the data from the annual reports easier. Here are the steps involved:
Step 1: Take the annual report of the company and select the financial statements we wish to extract data from i.e, the balance sheet and P&L statement. I\’ll choose the 2020 annual report for this example. One can use this online pdf editor for this: https://www.ilovepdf.com > split pdf > upload the file > extract pages > select pages > merge pages in one pdf file
Step2: Use OCR to convert the tables in pdf to excel. This is a useful site for this: https://www.ocr2edit.com/convert-to-excel
I have done the same and uploaded the result here: https://drive.google.com/drive/folders/1m3hHhtWGDHkXDaU8Bm8Edic-Gd69XMxb?usp=sharing
This works most of the times and produces excellent results. The values will be in numbers and one can format the file accordingly. I hope everyone finds this useful.
This is nice, thanks for sharing it here 🙂
Got the answer to my question from a similar comment. Thank you!
Sir while copying data for P&L A/C do we have copy till PAT only or do we also have to copy data related to \’ Other Comprehensive Income \’, EPS, etc ?
You need to consider the entire P&L.
sir, i P/L after PAT there is a section called \”other comphersive income\” and \”EPS\”. so, what i have to?
Consider that as well, Vijay.
Hello sir, awesome learning. Thank you so much for entire material.
I have one question. I have standalone and consolidated of F16 to FY 18 but in FY19 and FY20 bifurcation is not mentioned. Company name is HSIL (packaging business).
Can you suggest what to do in such kind of situation.
Vishal, then most likely it is consolidated. You can cross-check that by looking at FY 18 numbers and see if the continuity makes sense.
hello, sir in the relaxo example total revenue and pat are diff. for fy 17 in annual report of 16-17 & 17-18 that is bit confusing…
Please check the related numbers in \’18.
And if you can\’t help me figure out the above, the only option for me will be to copy your numbers and move forward without understanding anything.
And I am sure the purpose of this exercise was to make students understand the concept
PLease check my previous comment 🙂
I am unable to understand how you have come up with that figure.
If you look at the annual report of 16-17, the amount you have taken as the advertisement expense is clearly shown under the heading as of 31st March 2017 and not as of 31st March 2016 and that too it is part of the Note 23 and not the Note 24 (Other Expense).
But if you open the annual report of 2017-18, then the figures taken by you in FY17 is correct but the figures for FY16 is still confusing.
Can you please help me here with detailed explanation.
Hey, the company has restated the numbers, so please look at the numbers from 2018 AR. I\’ve mentioned this in the chapter itself.
Hi Karthik,
Hope you are doing well!
Can you please provide clarity on the figures taken in the Advertisement Expenses under Other Expenses is correct or not?
If I can see the annual report correctly, you have taken the advertisement expenses of FY17 instead of FY16 while filling the P&L details.
Also, it will be great if you can show us the break up of the other expenses as this will help us match the data.
Thanks,
Smridh
I think they are correct, Smridh. Please do check in associated notes as well.
Hi Sir, one of the best places to learn without any charges it seems like a company is contributing towards CSR with the dedicated branch as Varsity (Virtually)🙂. It is really such a great place to learn from scratch.
I just have a doubt that my Total Liability is in surplus by 0.003 over Total Assets, I checked 3-4 times thoroughly but all the numbers were exactly punched as per AR 2018, Shall I move forward or how to correct this?
Thanks for the kind words, Sonu!
It is better you find the error and correct it. The balance sheet should be perfectly matched. It will be some minor rounding error which you\’d be missing. Verify each number again and again till you get it 🙂
Again something mind blowing😎.Eager 2 learn.Thanx sir ,4 your great efforts ✌
Happy learning, Tango!
There is a difference in the revenue from operations for FY18 given in FY18 annual report and FY19 report i.e for FY18 revenue from operations stands at 1964.44 in FY18 annual report where as the same stands at 1948.57 in FY19 report
Sir could u tell me the reason for this?
The numbers have been restated. I think we discussed it in this or the previous chapter.
Thank you for all you have taught, you have been an inspiration to me.You have made me a better trader more than that I\’ve realised that I love reading, finishing modules in one sit.
Learnt to be a student forever
Happy Teacher\’s day sir!
Thanks for the kind words, Chandu! Hope you continue to enjoy reading and learning on Varsity 🙂
Sir for me 2017 and 18 balance sheet line items are different and 19,20,2021 are similar
So I took latest year line item that is 2021
and included missing line items of 2018 which also have 2017 data
is that correct
Yup, that is ok.
okay.. thanks
Hi K,
How do we get the breakup data as given in profit & loss statement for Other expenses. Becoz in Note 27- mapped with other expenses, there are are many breakup categories present. Ho do we arrive at these three ?
This requires some research, please look out for the new chapter on the Revenue model that will come up this week, it may have some answers for you.
Kartik Sir thank you for sharing this with us. I have doubt in FY16( for year ended 31st March 2016) data for advertisement & sales promotion as it is 66.12, but you have considered 58.82 for advertisement from FY17( for year ended 31st March 2017) column. I am not able to match my P&L for these 1 cell ( E18) with image you have posted above. Please help.
Anuj, I\’d suggest you look at 2018 AR for 2016 data.
Sir, is it important to make excel coz we can get 5-year data in screener.in, right?
If you want to model, then yes, it is important.
Actually i am repeating the same task with another company and in that there is one point that company had discontinued operation (which is always in non recurring nature). So what we should do in that cases (i mean is it going to impact our model???)
Company Hindustan Copper (Single commodity company)
Please help!!!! 😊😊
Thanks in advance.
You include that line item in the model, it will be zero for the rest of the years.
Yes, I read the next chapter too. I never went in for predicting the flows in the future in my old model, but I did do some coloring, font changes, and a different way of indexing, etc. for easy reading of the data and even calculated values using the formulas to calculate the ratios mentioned in FA module, though I just copied values from the Annual Report directly.
Sure, I\’ll try and upload the next chapter this week.
Hi, Karthik.
Before even I looked at what company you have selected, I renamed my Excel sheet for Relaxo and, what a coincidence!
Maybe I\’ll rename it as Bata and do my own analysis for Bata, setting your Relaxo analysis as an example. 😉
P.S. I was doing a model suicide earlier, after reading the Fundamental Analysis. And that suicide Model already has data entered for 2 companies including Financial Ratios. 😀
Haha, but as you may have realised, Relaxo is a helper model. I won\’t be continuing with that example 🙂
Sir, One Request
Why \”Innerworth – Mind over Markets\” not available for download ?
After download, it becomes easy to write comments in specific section of the Module.
Thank you so much..
Thanks a lot Karthik sir for your hard work !! 🙏🏻
Happy reading, Adil!
Okay. I will do the same but what is the reason for the difference in no.s
Companies restate numbers, common practice.
I didn\’t take the no.s for 2016 as I am going for the last 5 years including 2021.
what I am trying to say is that in the 2018 balance sheet and 2019 balance sheet the no.s are different for the year 2018 for some of the items and this same goes for the next year balance sheets when compared with each other
Understood. I\’m guessing the difference is not much. You can take 2018 data from 2108 AR itself or from 2019 AR, it wont really make a big difference in your model.
I\’m like one of your friends who started with Hindalco – I started with ONGC couple of years back and never really got to cross the halfway mark. With this module, I resumed fin modeling again and would really love to finish this time. Please bring up the next chapters soon! 😛
I\’m trying my best. Hopefully this week the next chapter will be up.
Hi Karthik!
I have been learning from varsity for almost 1 year now and I love it!
Question:
I am planning to do freelancing in financial analysis and financial modelling.
So, after completion of this (financial modelling) module and doing practice, is it a good idea to use this knowledge for building financial models in freelancing? I am serious about this.
Thanks!
Suraj, I\’m glad you liked the content. But I really dont know if there is a market out there for something like this.
while extracting the historical data I copied the figures for the years 2017 & 2108 from the balance sheet of 2018 but when I opened the balance sheet of 2019, the figures of two or three items for 2018 were not the same as in the previous year balance sheet, what should I do.
the company I have taken is united spirits
But why did you take 2016 and \’17 data from \’18? I did it because the company had restated the numbers in FY 2018.
Hi, could please let me know, when we can expect personal finance module in the application?
We are developing the illustrations, once its done, it will be uploaded. Hopefully by this month end.
when will next part come sir?
This week.
Hello,
Any idea when this module would get completed?
Like how often would each chapter get added?
Hopefully once in 8-10 days a new chapter will get uploaded.
Hello,
Any idea when this module would get completed?
It will take sometime 🙂
karthik sir, lots of respect
i have one question,isn\’t there any tool available through which we can convert these reports into our desired excel formats ?if not.
then how companies like screener.in do it? manually?
Probably screener has, I\’m not really sure.
the company I am talking about is GLOBUS SPIRITS due to autocorrect it was written as globes spirits, so should I take it or not
I\’ve layed down the criteria to select the company. See if the company fits this description. If it does, then go ahead.
I am taking globes spirits for my model is it okay for a beginner or should I change it
I dont know the company, but if it kind of fits into the description then why not.
Thanks Sir for your golden advice. Reminded me of the dialogue from Scam 1992. \”Dhandha dharam h sir, aur is dharam ka bhagwan h trust (Business is a religion and the god of this religion is trust)…. The most expensive thing in this world is trust. Cheap people can\’t afford it.\”
I wish I could have a personal Q&A session with you to clear all my doubts and queries. Anyways, I will trouble you again if any other stupid question pops up in my stupid mind:)
Thanks, Harsh!
Hello Sir,
I hope you are doing well.
Can you make all your edits in a different color so one can see what has changed?
Only minor grammatical fixes, nothing more 🙂
Thanks sir for guidance.
Maybe, I can start a blog website on investments for now, so that when I start the advisory business after two years, I already have some target audience.
I don\’t have contact with any RIA but I will try. What according to you is the most important thing that can make or break such a venture?
I am inclined toward this because of my interest in markets and my entrepreneurial inclinations. Do you have any other suggestions for me which can fulfill both?
The most important thing is building trust. Trust is built over time when you do things with the right intentions, Harsh. Before you start out, maybe you should try working for an RIA for few years to understand the nuances of the job.
Hello sir, First of all thanks a lot for all this. I have learned a lot from you.
My question is this:
How is being a SEBI registered investment advisor or research analyst as a career? To get registered, post graduation is neccesaary. I am currently in final year of graduation. After that, I am planning to do MBA finance, which will take two years. In the meantime, I will keep learning about markets and investments. I have been learning so already from past 2 years. After, I get postgraduated I can become an independent registerd investment advisor or resarch analyst. What do you think about it? Does it sound practical and is there \”SCOPE\” (hate to bring this word, but couldn\’t find any alternative) in being an independent advisor or analyst? Do people in India pay for financial advice or they still want it for free??
Sorry, if the question sounds naive but any guidance will be greatly helpful. Thanks.
Its not a bad choice if you have the inclination for it. But it will take many years for you to build a reliable client base and your income levels will be volatile during the initial years. I\’d suggest you speak to an RIA to understand from their perspective before jumping into it. Good luck.
I agree this is pure art. We have just started our canvas and as master painter you are guiding each step of the way. \”Hold the brushes upright and dabble.\” Thank you so much Karthik sir, I am so lucky to be here.
Big words, but I\’m glad you liked the content. Hopefully, the rest won\’t disappoint you 🙂
Sir, when is the next chapter coming
It was supposed to come up this week, unfortunately, could not. Maybe next week.
Hello Sir,
You mentioned that there are different ways one can invest in banking/nbfc/insuarance companies.
Apart from trading them on a momentum basis, is there another way I could understand the financials of these companies?
I am extremely eager to learn.
You will have to do FA on these companies, its just that I\’m not very confident talking about it, hence I avoid these companies 🙂
Dear sir,
If i choose a company with subsidiaries as a Main model, then i have copy data from standalone statements or consolidated statements?
Consolidated statements.
Hi Karthik Rangappa, can you please think of delivering financial education on YouTube? There isn’t much quality content on Indian context. It doesn’t have to be an expensive project. You explaining to the camera, along with images you already got in your articles will be more than enough.
We are thinking about this, Augustine. We will probably collaborate with someone who can take our content and produce these videos for us.
Being a passive index fund investor (lazy investor), I may not use this (Integrated Financial Modelling) myself, but I believe this high quality financial education you are giving away for the masses will make our financial market more efficient and rational. So I can sleep better.
Thank you Karthik Rangappa
Hopefully, we will have a financially literate India in the coming years 🙂
Figures of Trade Receivables for FY18 in Annual Report of 2017-18 (192.35 Cr) and 2018-19 (173.45 Cr) are different. Sir, Is it a typing error or something else? Please explain.
Will check, Raman.
Sir,
There are differences in Tax Expense in your Excel working compare to Annual Report which is leading to differences in PAT.
I think, you will need to edit that.
Thank you
Checking this.
Karthik sir,
Really appreciate all your efforts to educate retailers, Thank you!
Wanted to request you to shed some light on qualitative analysis and key points to identify the next possible blue-chip companies.
Usually, all generally say for example in 1993 if invested and stayed with Infosys or such company it would be made you rich. We need to look forward and say which is next Infy… It will be really good if you can take us in that direction as well.
Thanks & Best Regards,
Suresh
Suresh, this very module will help you do that 🙂
Waiting for the next chapter !!!!
By next weekend I hope 🙂
Thank you Sourav Sir for recommendation.
No Issues Sir,
Thank you for replying.
Good luck!
Please search on YouTube
\’Excel crash course for finance professionals\” and learn basic excel for finance modelling.
Dear Sir,
First of all thank you for your hard work.Earlier i understood Excel workbook in chapter 02 but, now i don\’t understand it how you have prepared.Honestly I understand content but don\’t understand the Excel workbook.I spent around Three days to learn Excelworkbook you have prepared in this chapter but till i don\’t understand it.Kindly Help me Sir.
Lipu, understanding excel is a prerequisite. Unfortunately, I cant teach excel here, although I\’ve tried doing a bit in this chapter.
Hello Sir,
Banks/NBFC/Insurance companies pretty much are the main investments for MFs and PMS etc.
So how could I invest in these companies without a understanding of their financials??
How do these MFs and PMS do it?
There are ways in which you can, its just that I don\’t know how or at least don\’t know enough to write about it 🙂
Hello Sir,
Will you be talking about banks/ life insurance / nbfcs in your modules?
How on can someone invest in them reading their quarterly statements etc?
I may not, Samay.
Sir In profit and loss statement..For FY16, from where have you taken \”advertisement and sales promotion scheme\” as ₹58.82cr…
One more doubt sr, In p&l statement as well as BS statement,you have taken data for eg for FY17 …………..from FY17 sheet data as well as FY17 data of FY18 sheets and both data of same FY have differences…now either we should stick with FY17 or FY18
You look into the notes of Other expenses, you will get it. Stick to FY17 for FY17 data.
Dear Karthik,
Is it okay when there is a discrepancy in reporting total assets in FY19 from AR FY2018-19 and in AR FY2019-20? How much discrepancy is acceptable?
You can check the notes for this Pramod to see why there is a discrepancy. But yes, small differences is ok.
In FY19 balance sheet ,under current liabilities \”Trade payable\” is ₹190.93cr where as in FY20 balance sheet,the \”Trade payable\” of FY19 is ₹171.92cr and similarly \”provisions\” in FY19 balance sheet is ₹3.69cr and same in FY20 is ₹29.67cr……..Now sr which one we have to consider
Take the FY19 AR Aman.
Sir don\’t you think it is better to download the excel from screener and then work on the individual items. As far I know those numbers are reformatted as per latest annual report and are consistent.
Maybe, Bhavin. It is just that I have not done this and therefore I\’m not very sure.
Sir, the matter posted here is very informative and the minute details of a model u r sharing are very important and they are very useful for the model to be dynamic.. eagerly waiting for the next chapter
Happy learning, Naveen!
Karthik sir, thanks for providing us this valuable insights and we thank you for your hard work and commitment. God Bless You
Happy learning, Nizam!
Yes Sir, whatever I have learned from versity I immediately practice it in Excel, by doing this I improved my hand in Excel, right now practicing chapter 9, it seems tricky when I first visit the chapter, but by the time, I can understand the logic behind portfolio management. God bless you, my hero, Karthik Sir.
Happy reading, Kallol, and thanks for the kind words 🙂
Hope you get better and better at this!
Would you Provide Download as PDF Option for the Innerworth — Mind over markets?
Would be helpful to read it as PDF.
Thanks 🖤
No sir, we have discussed this so many times in the comment section.
Hello sr
I have a doubt in FY16 data.
Under Non current Assets,In financial asset you have mentioned\” Long term loans and advances \” is ₹13.71cr whereas when I cross check it with actual balance sheet it\’s ₹19.06cr , Further there is no \”other financial Assets\” but you have taken ₹5.73cr, then further\” other Non-current assets\” you mentioned is ₹5.59cr where as on balance sheet it\’s ₹0.49 lacs and rest all are same in \”Non current asset\” part…….and few discrepancies are also there in\” Current asset\” part ……sr if I am wrong..then where I am getting stucked….I have already checked 2-3 times
Aman, you need to look for it in the 2018 AR. As I mentioned, the company has restated 2016 and 2107 data in 2018. Can you please check this and get back? Thanks.
Why \”Keep the numbers left aligned\”?
Shouldn\’t it be right-aligned?
My bad, you\’re right:)
Sir,
Firstly, thanks for sharing such good content and your knowledge with us.
The question is off-topic but wanted to take your view on the current bull market which is constantly going up. Like what may be the possible reasons behind this?
Also, if someone is looking to invest into a mutual fund (Equity) for a long term perspective, should they go for it or not and similarly for individual stocks?
Thanks again for sharing complex concepts in such lucid ways\’ sir.
Deep, I\’m not sure either. But I guess higher corporate earnings, higher GST collection and things like that is also getting factored in.
Sir, you are always be my hero, hats off, and respect 🙏🙏🙏🙏
Happy learning, Kallol. Hope you were able to replicate this in your excel sheet.
In FY19 the balance sheet total on Annual report is different ( 1611.43) vs 1604.56 that we got. What happened in that year ?.
Can you double-check, FY19 AR Asha? I quickly did and the AR states the total as Rs.1604.56Crs. Btw, you must have got this from the FY2020 AR.
Thank you Sir and thanks for your hardwork.
Sir, How long should we expect this module to be completed?
I have no idea, Saurav 🙂
sir , I had a doubt that whenever I try to get data from annual report I cant copy it into excel its format changes (one word in each cell vertically) and when I download a excel format file and then copy paste it then the calculations don\’t work because it says numbers are in text format and how much even I try they don\’t turn to number.
please resolve this I have this query for a long time (and writing them one by one will be exhausting and time consuming)
Copy paste wont really work, Gaurav. It always leads to some sort of format issue. You need to type in each number, I know its a lot of effort but its worth it.