3.1 – Variance

In the previous chapter, we touched upon the topic of expected return, continuing on it, we will understand the concept of ‘Portfolio variance’. Portfolio Variance helps us understand the risk at a portfolio level. I’m hoping you are familiar with ‘Standard Deviation’ as a measure of risk. We have discussed standard deviation multiple times in the previous modules (refer to Module 5, chapter 15 onwards). I’d suggest you get familiar with it if you are not already. While we can easily measure the risk of a single stock by calculating its standard deviation, calculating the risk of a portfolio is a whole different ball game. When you put a few individual stocks together and create a portfolio, it becomes a different animal altogether. The agenda for this chapter is to help you understand how to estimate risk at a portfolio level.
However, before we proceed, we need to understand the concept of Variance and Covariance. Both Variance and Covariance are statistical measures. Let’s deal with the Variance first.
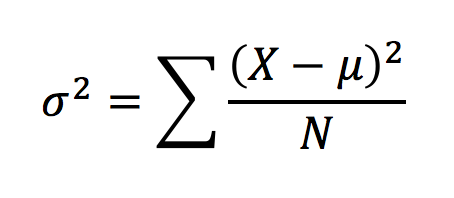
The variance of stock returns is a measure of how much a stock’s return varies with respect to its average daily returns. The formula to calculate variance is quite straight forward –
Where,
σ2 = Variance
X = Daily return
µ = Average of daily return
N = Total number of observation
Note, the variance is measured as sigma squared; I will not get into the reasons for this as the explanation is quite complex and we could digress. For now, I’d request you to be aware of the fact that variance is sigma squared. Anyway, calculating variance is quite simple, I’ll take a simple example to help us understand this better.
Assume the daily return for a stock for 5 consecutive days is as below –
Day 1 – + 0.75%
Day 2 – + 1.25%
Day 3 – -0.55%
Day 4 – -0.75%
Day 5 – +0.8%.
In this case, the average return is +0.3%. We now need to calculate the dispersion of daily return over its average return, and also square the dispersion.
| Daily Return | Dispersion from average | Dispersion squared |
|---|---|---|
| + 0.75% | 0.75% – 0.3% = + 0.45% | 0.45%^2 = 0.002025% |
| + 1.25% | +1.25% – 0.3% = + 0.95% | 0.95%^2 = 0.009025% |
| -0.55% | -0.55% – 0.3% = -0.85% | -0.85%^2 = 0.007225% |
| -0.75% | -0.75% – 0.3% = -1.05% | -1.05%^2 = 0.011025% |
| +0.80% | +0.8% – 0.3% = +0.5% | 0.50%^2 = 0.002500% |
We now sum up the dispersion squared to get 0.0318000%. We divide this over 5 (N) to get the variance i.e
0.0318000% / 5
σ2 = 0.0063600%.
So what does this number tell us? It gives us a sense of how the daily returns are spread out from the average expected returns. So you as an investor should look into the variance to determine the riskiness of the investment. A large variance indicates that the stock could be quite risky while a small variance can indicate lesser risk. In the above example, I would consider the variance high, since we are looking at just 5 days worth of data.
Now, here is something you may be interested in knowing. Variance and standard deviation are related to each other by the following simple mathematical relationship –
Square Root of Variance = Standard Deviation
We can apply this to the example above and calculate the 5-day standard deviation of the stock,
%
~ 0.8%
which is the standard deviation a.k.a. the volatility of the stock (over the last 5 days). Anyway, at this point, I want you to be aware of Variance and what it really means. We will eventually plug variance along with covariance into the portfolio variance equation.
3.2 – Covariance
Covariance indicates how two (or more) variables move together. It tells us whether the two variables move together (in which case they share a positive covariance) or they move in the opposite direction (negatively covariance). Covariance in the context of stock market measures how the stock prices of two stocks (or more) move together. The two stocks prices are likely to move in the same direction if they have a positive covariance; likewise, a negative covariance indicates that they two stocks move in opposite direction.
I understand covariance may sound similar to ‘correlation’, however, the two are different. We will discuss more on this further in the chapter.
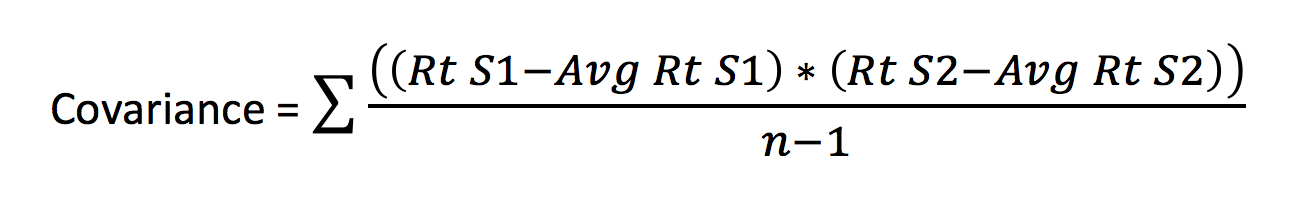
I guess calculating the covariance for two stocks will help us get a grip on understanding covariance better. The formula to calculate covariance of two stocks is as follows –
Where,
Rt S1 = Daily stock return of stock 1
Avg Rt S1 = Average return of stock 1 over n period
Rt S2 = Daily stock return of stock 2
Avg Rt S2 = Average return of stock 2 over n period
n – The total number of days
In other words, you can calculate the covariance between two stocks by taking the sum product of the difference between the daily returns of the stock and its average return across both the stocks.
Sounds confusing? I guess so. ☺
Let us take up an example and see how we can calculate the covariance between two stocks.
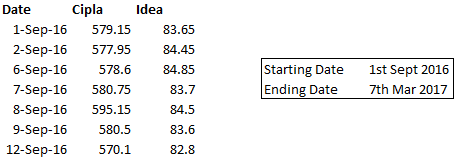
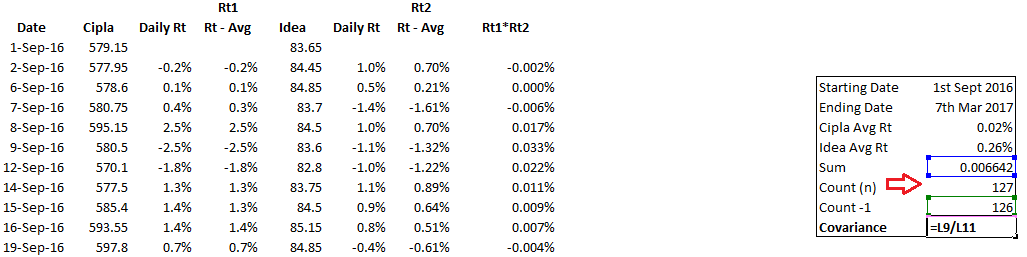
For the sake of this illustration, I’ve selected two stocks – Cipla Limited and Idea Cellular Limited. To calculate the covariance between these two stocks, we need to work around with the above formula. We will resort to good old excel to help us implement the formula.
Before we proceed, if you were to guess the covariance between Cipla and Idea, what do you think it would be? Think about it – two large corporate, similar size, but in two completely unrelated sectors. What do you think would be the covariance? Give it a thought.
Anyway, here are the steps involved in calculating covariance in excel (note, although there is a direct function in excel to calculate covariance, I’ll take the slightly longer approach, just to ensure clarity) –
Step 1 – Download the daily stock prices. For the purpose of this illustration, I’ve downloaded 6 months data for both the stocks.
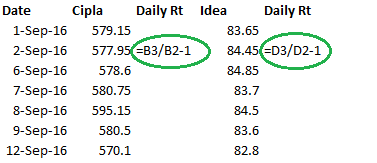
Step 2 – Calculate the daily returns for both the stocks. Daily returns can be calculated by dividing today’s stock price over yesterday’s stock price and subtracting 1 from the result of this division
Step 3 – Calculate the average of the daily returns
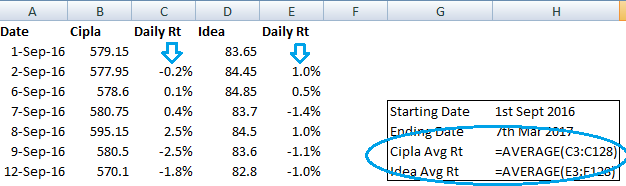
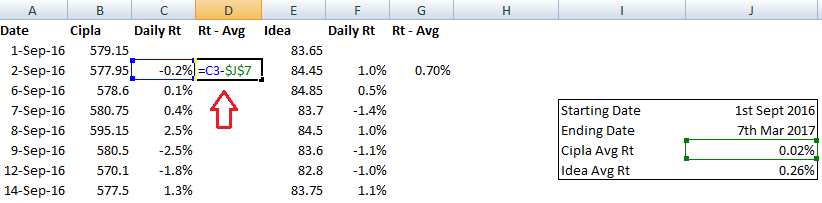
Step 4 – Once the average is calculated, subtract the daily return by its average
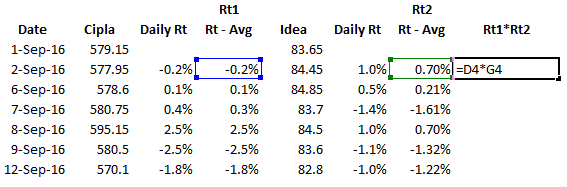
Step 5 – Multiply the two series calculated in the previous step
Step 6 – Sum up the calculation made in the previous step. Take a count of the number of data points. You can do this by using the count function in excel and giving any of the fields as the input array. I’ve used the count on the dates here.
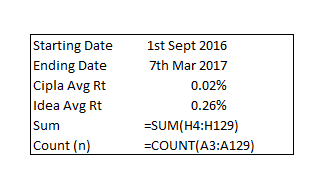
Step 7 – This is the final step in calculating the covariance. To do so, one needs to divide the sum by count minus 1 i.e (n-1). The count, in this case, is 127, so count-1 would be 126. Sum calculated in the previous step was 0.006642. Hence, covariance would be
= 0.006642/126
= 0.00005230
You can download the excel sheet.
As you can see, the covariance number is quite small. However, that’s not the point here. We only look at whether the two stocks share a positive or negative covariance. Clearly, since the two stocks share a positive covariance, it means that the returns of the two stocks move in similar directions. It means that for a given situation in the market, both the stocks are likely to move in the same direction. Note – covariance does not tell us the degree to which the two stocks move. The degree or magnitude is captured by correlation. The correlation between Idea and Cipla is 0.106, which indicates that the two stocks are not tightly correlated.
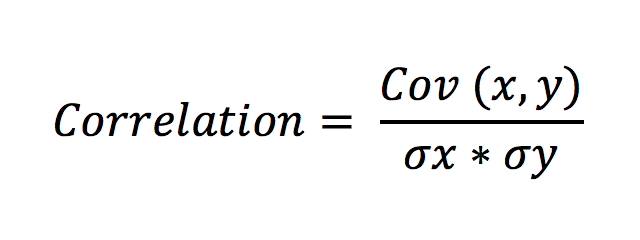
By the way, here is something very interesting fact. The mathematical equation for correlation between two stocks is as follows –
Where,
Cov (x,y) is the covariance between the two stocks
σx = Standard deviation of stock x
σy = Standard deviation of stock y
Note, the standard deviation of a stock is simply the square root of the variance of the stock. Here is a task for you – we have calculated the correlation between Idea and Cipla using the direct excel function. Can you confirm the accuracy by implementing the formula?
Anyway, in the case of building a stock portfolio, do you think a positive covariance is good or bad? Or rather do portfolio managers desire stocks (in their portfolio) which share a positive covariance or they don’t? Well, portfolio managers strive to select stocks which share a negative covariance. The reason is quite simple – they want stocks in the portfolio which can hold up. Meaning if one stock goes down, they want, at least the other to hold up. This kind of counter balances the portfolio and reduces the overall risk.
Now, think about a regular portfolio – it will certainly contain more than 2 stocks. In fact, a good portfolio will contain at least 12-15 stocks. How would one measure covariance in this case? This is where things start getting complicated. One will have to measure covariance of each stock with all the other stocks in the portfolio. Let me illustrate this with a 4 stocks portfolio. Assume the portfolio is like this –
- ABB
- Cipla
- Idea
- Wipro
In this case, we need to calculate the covariance across –
- ABB, Cipla
- ABB, Idea
- ABB, Wipro
- Cipla, Idea
- Cipla, Wipro
- Idea, Wipro
Note, the covariance between stock 1 and stock 2 is the same as the covariance between stock 2 and stock 1. So as you can see, 4 stocks require us to compute 6 covariances. You can imagine the complexity when we have 15 or 20 stocks. In fact, when we have more than 2 stocks in the portfolio, the covariance between them is calculated and tabulated using a ‘Variance – Covariance Matrix’. I would love to talk about this now, but I guess, I’ll will keep it for the next chapter.
Stay tuned for more!
Key takeaways from this chapter
- Variance measures the dispersion of returns over the expected average returns
- Higher variance indicates higher risk, lower variance indicates lower risk
- Square root of variance is standard deviation
- Covariance between the returns of two stock measures how the returns of the two stocks vary
- A positive covariance indicates that the returns move positively and a negative covariance indicates that while one stock returns moves up, the other comes down
- Correlation measures the strength of the movement
- Covariance between two stocks divided over their individual standard deviations results in a correlation between two stocks.
- When we have more than 2 stocks in a portfolio, we compute the variance-covariance using a matrix
I have calculated variance of stock using daily return of last 1000 days. Then I calculated Standard Deviation using square root of variance.Then I calculated Standard Deviation using standard deviation method. But values are not matching. Do you know why? e.g I took “NSE:ITC” everyday close value of past 1000 days. So from variance calculations I am getting “0.000487” and from Standard Deviation method I am getting “0.1788465”. Am I doing anything wrong calculations?
Need to check the excel for this, ideally they should match.
https://docs.google.com/spreadsheets/d/1g8yrl3dj0vn-FLgBYSNkbveWZ6SeVfx9WAGLLC7DjNY/edit?usp=sharing Can you please check above sheet
Will look into this shortly.
Thanks! Did you get a chance to look into this one? Thanks in advance.
Not yet, Susim. I’ve been really tied up with few things.
no problem thanks!
Bravo!
Is it possible that covariance could change over a long period for any 2 (or more) stocks? Supposing it was positive when we buy them and it might becomes negative at some point of the holding period (or vice versa)
Over a long time, yes, there is a chance for covariance to change.
Shouldn’t we consider the trading holidays for such calculations. Since stocks only moves on live trading session. So average daily returns will not be whole 365 days but actual trading days. Just a smart doubt.
Yes, on trading holidays we wont have any data points anyway.
Hi karthik, Is there anyway to download last 10 year data of Nifty in a single excel file from NSE website. Right now I can able to download only one year data at a time.
No, NSE used to allow that few years ago but have stopped doing so.
By the way thanks for this great initiative(varsity) by your team. Looking forward for Trading strategies and system
Hello Varsity team, I have made complete Varsity documents as audio book ( Uploaded in You tube channel). Where i need your confirmation/approval to publish as education content.
Sure Ramaraj, please do share the link with us. Also, I’d request you to please give Zerodha the required credit for this on your youtube channel.
Thanks Karthik , I do share the link once all videos uploaded.
Sure, thank you so much.
Hello Kartik,
Can you have pdf or ipub format for chapter no 8.? I want to download those entire chapters.
Please share your thoughts on this.
We are working on it.
Hello Karthik
Here is the play list where all video included
https://www.youtube.com/watch?v=asrIdCJPcmk&list=PLgFdFJTvemZxqKooiCe1Qykuci2818TI4
Thanks Ramaraj. Good luck and all the very best.
Ramaraj,
Haven’t seen the videos yet but it is nice on your part, to attempt for something like that, which may help others (Varisty visitors/students).
Keep up the good work.
Hi karthik, i love varsity for the simple reason that it touches upon quite many topics and still maintain the complexity level down, very useful for students who are aspiring investors. Thanks a lot.
However I Have one doubt, what is the precise use of covariance in portfolio management when correlation can tell both the movement and the strength of the movement?
Thanks for the kind words, Umer. You use covariance to calculate the correlations.
Please provide the pdf (download pdf option) for module 9
Its work in progress, PDF will be put up once the module is complete.
If portfolio managers prefer stocks with opposite covariance.Then when they will gain overall profit.I mean when one stoct is up and other stock will move down and make losses?
Well, that is exactly the skill you are the Portfolio Manager for 🙂
Thank you sir..:)
Welcome.
Karthik, is there any website or tool through which we could easily figure and compare the co-variance without doing all these calculation?
Ah, I’m afraid not….at least I dont know about it.
Karthik,
For calculating the daily return can’t we use the log function?
Thanks
You certainly can.
Sir where from I can download the daily return of stocks for past one year.
Check this – https://www.nseindia.com/products/content/equities/equities/eq_security.htm
Just want to correct if wrong, the variance calculate above should be σ2 = 0.636 and not σ2 = 0.0063600%.
Please comment as it is creating confusion.
Ah, let me check this Ravi.
Hi Karthik,
One small doubt.. For variance covariance matrix, I have taken market data of last 1 year for all the stocks in the portfolio. However, there are two stocks in the portfolio which began trading two months back only (recently listed). How to deal with such situations where data set is not perfect?
In such a case you won’t be able to build a meaningful covariance-variance matrix. You need at least a year’s worth of data.
Hi Karthik,
In the Calculation of variance above (Dispersion Squared Coloumn) iam getting 0.45%^2 = 0.00002025 instead of 0.002025 as given by you. Can you plz cross check if iam wrong?
Can you run through your excel once again? step by step? I’m sure you will spot the error. Unfortunately, I won’t be in a position to check your excel sheet. Apologies for that.
I calvulated the stdev from old method of log daily return and from root of variance .
Both are nearly equal. I confirmed the accuaracy by implementimg the formula.
Check out @Gulrose_views’s Tweet: https://twitter.com/Gulrose_views/status/1050011791135105024?s=09
I am reading your modules from 2 weeks amd now i am at the end.
Thank you sir.
I saw this tweet, Edward. Good luck 🙂
Hi Karthik,
The above calculation gave Variance = 0.0063600%.
You’ve said that “Square root of variance = Standard deviation”.
Then, Standard deviation must be 0.07974 ( Approximately 0.08 ).
But, you wrote it as 0.8.
Is that a typo error or the actual value??
0.08, Even if converted into percentage that would be 8%
I guess a typo, Vinay 🙂
Thnx man!! 🙂
Hello,
The average is based on 126 samples since a daily return can’t be calculated for the first date. In this case, should the count be 126 instead of 127? Thus, shouldn’t “n – 1 = 125” instead of 126?
Either way, thank you very much for the great material.
Yup, 125 that would be. Glad you liked the content. Happy reading!
Great article.
Can we use it for day trading?
Nope, may not be a great tool for day trading.
Hey, Can we use correlation function from excel for this???
Yes, you can use the correlation function in excel.
share price daily reutrns
579.15
577.95 -0.002072002
578.6 0.001124665
580.75 0.003715866
595.15 0.024795523
580.5 -0.024615643
570.1 -0.01791559
is this correct ?
how to get it to percentage ?
Click on the convert to percentage option if you are using MS excel.
got it sir .
As per diversifying of portfolio is concerned ,
Should we involve Gold/Silver in our portfolio to maintain a healthy average return. Because it is seen that during recession time, Gold & silver value increases while stocks decline. During the lockdown itself the gold prices increased.
Yes, adding gold to your portfolio is a good thing. Not sure about silver though.
Really a better , simplified and Sorted knowledge stuff one can easily receive , thanks Zerodha for this amazing work and keep going.
Happy reading, Vaibhav!
Dear Karthik,
Thankyou for all the efforts you have put in and continuing interactions with learners. The Varsity section is a very noble initiative.
My query/ request is- can you point out topics for traders/ investors separately? Maybe just a marker on Chapter title?
Happy to note that 🙂
Thanks for your feedback, will pass this to the team.
The covariance part of calculation helps me alot.
Thanks
Good luck!
Hello Karthik,
Thanks for making it so simple!
I had one doubt – what if the average daily returns are negative? What to do then?
This happens when the price is trending down for a while. Nothing much that can be done except for taking a larger data set. However, if its still negative, then maybe you should not consider the stock in the first place 🙂
Thanks!
Goodevening Mr Karthik
One small doubt, how do you decide, where to use log returns for your calculations vs the simple arithmetic return?
In the volatility chapters, we’ve been using log returns, but here you are using arithmetic return.
Thanks in anticipation
When the range is <20%, there is hardly any difference between log and percentage returns
If your range is higher than that, stick to log returns.
It is fascinating…. and I really thank you for reintroducing me to a subject(mathematics) that I was so interested in during my school days. The applied mathematics in finance is beautiful.
Anyways, another reason that I could collate from deep diving into the topic of log vs arithmetic returns, apart from the one mentioned above by you was the fact that log returns are by definition continuously compounded returns over time. You have so descriptively explained regarding thee calculation of the average return of a portfolio with the formula of the ‘sum of the weighted simple returns of the constituents of the portfolio’.
The same stunt however cannot be pulled off, if we use the log returns as adding the log returns compounds the returns where no compounding(between different stocks) exists and hence presents an erroneous number. Therefore as a thumb rule, one should use simple return while calculating the returns from a portfolio, but log returns when referring to a single stock. Please correct me if I am wrong.
Thanks again, and continue the good work.
Ashish, I think you can use log as long as you use the exponential function to convert it back. Let me get back on this.
Hi Karthik ! I had two queries for the entire portfolio risk exercise:
1. If the portfolio has stocks that have been more recently listed than others, do the data points need to be equal for all the stocks?
2. I have a stock in my portfolio for which only 249 data points are available when I look up the data for a year whereas for every other stock in my portfolio, the data points have been 250 when I look it up for a year. What could be the reason for this? This also relates to my first question, would one less data point affect/change the calculations in any way?
Look forward to your response!
1) Yes, thats right
2) Not possible, maybe one of the day’s data is missing? YOu may want to double-check this.
Hello Sir,
I downloaded the excel sheet of covariance.
Took 3 months of data from NSE.
Just by editing your excel sheet, I got covariance as 0.0002
and by using formula function in excel
FORMULAS>MORE FUNCTIONS >STASTISTICAL>COVARIANCE.S
i am getting 1650.
So Confused.
Right now I have 3 methods
1 Ur formula
2 Editing ur excel sheet
3 Excel sheet formulas function.
Which one I have to follow for better results.
I hope u get my point sir
thank u
The best approach is to follow the techniques I’ve illustrated and implement the same.
Finally after 4 days of trying my calculations are matching for variance, covariance & correlation!!! 🙂
Is the following correct sir ?
Generally, a value of r (correlation coefficient) greater than 0.7 is considered a strong correlation. Anything between 0.5 and 0.7 is a moderate correlation, and anything less than 0.4 is considered a weak correlation.
Thank you. Regards
Abdul
That’s right and congrats and getting it correct 🙂
How is Beta different with respect to correlation ?
Thank U
Beta is the relative risk of the stock with respect to the index, a correlation on the other hand is the likely hood of joint movement of the stock vs the index (or another stock).
Sir how have you considered dividend in the calculation of Return and Risk ?
No, have not considered that.
Sir but don’t you think we should consider dividend also in our calculation, because in the daily returns there would be one day where we received dividend as well? If yes, how shall we consider it? Can you explain with help of ITC stock?
Yes, but data collection will turn out to be a very complex affair.
Hi,
Doing great work guys @Varsity
You may consider degree of freedom (n-1 instead n) for correct calculation of variance and std
Hope this helps
Thanks
Thanks, noted. I’ll try and include a note.
So in excel when we use the Covariance and Correlation formula……… Should we input the dollar prices column of the 2 stocks or the % return column of the 2 stocks as the 2 inputs required for the formula?
$ symbol is used to lock in the cell as a reference point. So use it as the situation demands.
if i want to invest in so and so stock for so and so years, do i need to get that so and so data for so and so years or i can take any years data ?
Depends on what you intend to do with the data, Naveen.
i think ur exel have rounded up the values in step 4 while substraction ,dont u think this will effect our calculation? correct me if i am wrong.
Let me check this, Naru.
Lovely..! But unfortunately can’t get the excel download..!
Checking this.
Thanks for the good note.
I have a question if the dynamics for a stock for instance follows the Heston Model, How could we interpret the portfolio return variance-covariance matrix. Since the return will be defined with stochastic volatility, I just need a little help when I read this note I want defines how could I figure out the portfolio return variance-covariance matrix.
many thanks!
I’ve not really come across Heston’s model. Need to learn about this myself.
sir, can you please suggest a note or blog, so that I can visually understand variance and S.D. Please share a link
Ah, not sure Adil. But you can try and plot these on excel. Maybe that will help?
I am unable to download the excel sheet
Wh there is no comment after 2017
No idea, perhaps it’s a difficult concept for people to understand.
Sir the picture for calculation of variance is wrong in the varsity app version .. please ammend it
Sure, will check this. Thanks for pointing it.
Karthik Sir, above the variance(sigma2) is given as .0063600% but i think it should be .636%
I need to check this again, Muthu.
Covariance just tells us whether or not two entities go in same direction.
Correlation tells us by how much degree two entities will go together (or opposite). Like is
Pair 1 has Correlation of +0.50 and
Pair 2 has Correlation of +0.95
Then I can say pair 1 entities are more tied to each other to move together relative to pair 2 entities.
Is that like this?
Yes, you can think about it that way.
Hello Karthik,
Variance and variance covariance matrix formula image in varsity app is not the formula, instead wrong image. Would you like to upload ?
Let me check. Can you share the card number?
Hi Karthik,
Could you please explain why using excess returns (over the average), not raw returns, to construct var-covar matrix? Thanks for your explanation.
Regards,
Hardjo
Thats the statistical formula. I’m sure there is a derivation for that, I’ve never looked at that.
Salute to you! The level of dedication required to create these modules would be unimaginary.
I like the cartoons. That’s how I know your creative mind. Well, Might be it takes years to me to understand the topic that you helped me in learning in a month.
Not every person has the potential to make modules like this even if they want to. Although I havn’t read all modules yet.
You’re the steeping stone of my trading journey. You build my psychology towards market.
Might be a time that I can greet you in person.
Thanks for your support. Karthik Rangappa.
Thanks for all the kind words, Shivang 🙂
I’m glad you found the modules informative. Happy learning 🙂
Is it necessary to learn this ‘Risk’ ‘portfolio’ part from a traders perspective?
Its a good to-know topic, Shivam.
sir excel isnt working unable to download
Please try downloading from another browser.
as you have mention Square Root of Variance = Standard Deviation
sqrt of variance =0.7975%
SD=0.8916%
it is not equal what mistake am i making
Maybe some data points are missing?