
It’s the economy, stupid! Energised, moving and out of work
We love India Data Hub’s weekly newsletter, ‘This Week in Data’, which neatly wraps up all major macro data stories for the week. We love it so much, in fact, that we’ve taken it upon ourselves to create a simple, digestible version of their newsletter for those of you that don’t like econ-speak. Think of us as a cover band, reproducing their ideas in our own style. Attribute all insights, here, to India Data Hub. All mistakes, of course, are our own.
Last week, we began looking at the high frequency indicators for May. It’s a little like a full body check-up for the economy – we look at many small signals to try and suss out what’s happening in the entire country.
We continue digging through them this week.
A song of water and coal
India is ramping up its power consumption. In April, the total power we generated was a tenth higher than last year: the highest growth rate in more than half a year. We’d gone into the importance of this last month:
There’s a lot that simple power generation can tell you about an economy. You need power to run all sorts of things — offices, factories, machines — you name it. If India needs more electricity, Indians are probably up to a greater number of useful things.
Last month, we’d looked at how, despite making a lot more power, we were making a lot less hydroelectric power. In fact, it had declined in 12 of the 13 preceding months.
Well, April marks yet another month of decline — by 8% year-on-year. This is from a base that’s already low; last April, hydroelectric production had fallen by 24% year-on-year. It was 2018 when we last produced such little hydroelectric power. See this graph for a better sense of things:
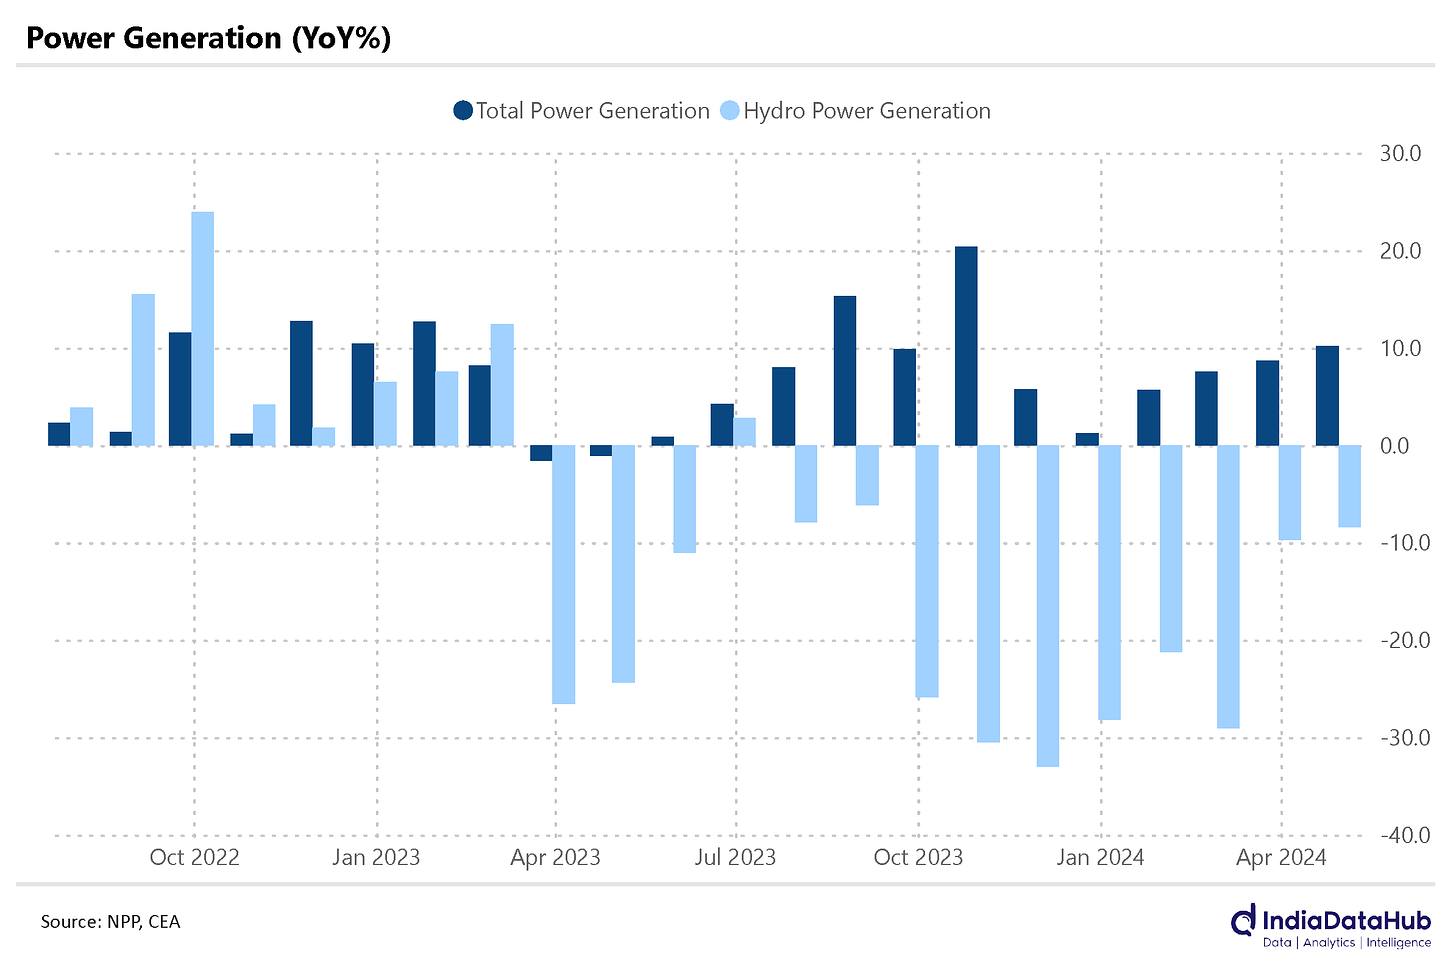
So we’re generating more power, and at the same time, less hydel power. What fills the gap? Coal, of course. Thermal power generation is up 11% since last April.
While this isn’t the greatest outcome for the environment, it’s welcome respite for coal-fired power plants. See, thermal power plants are designed to run as close to a full load as possible. This is when they’re at their highest efficiency, squeezing as much electricity as possible out of each bit of coal they burn. Below a certain load, in fact, they have to shut down entirely. (for the details, click here.)
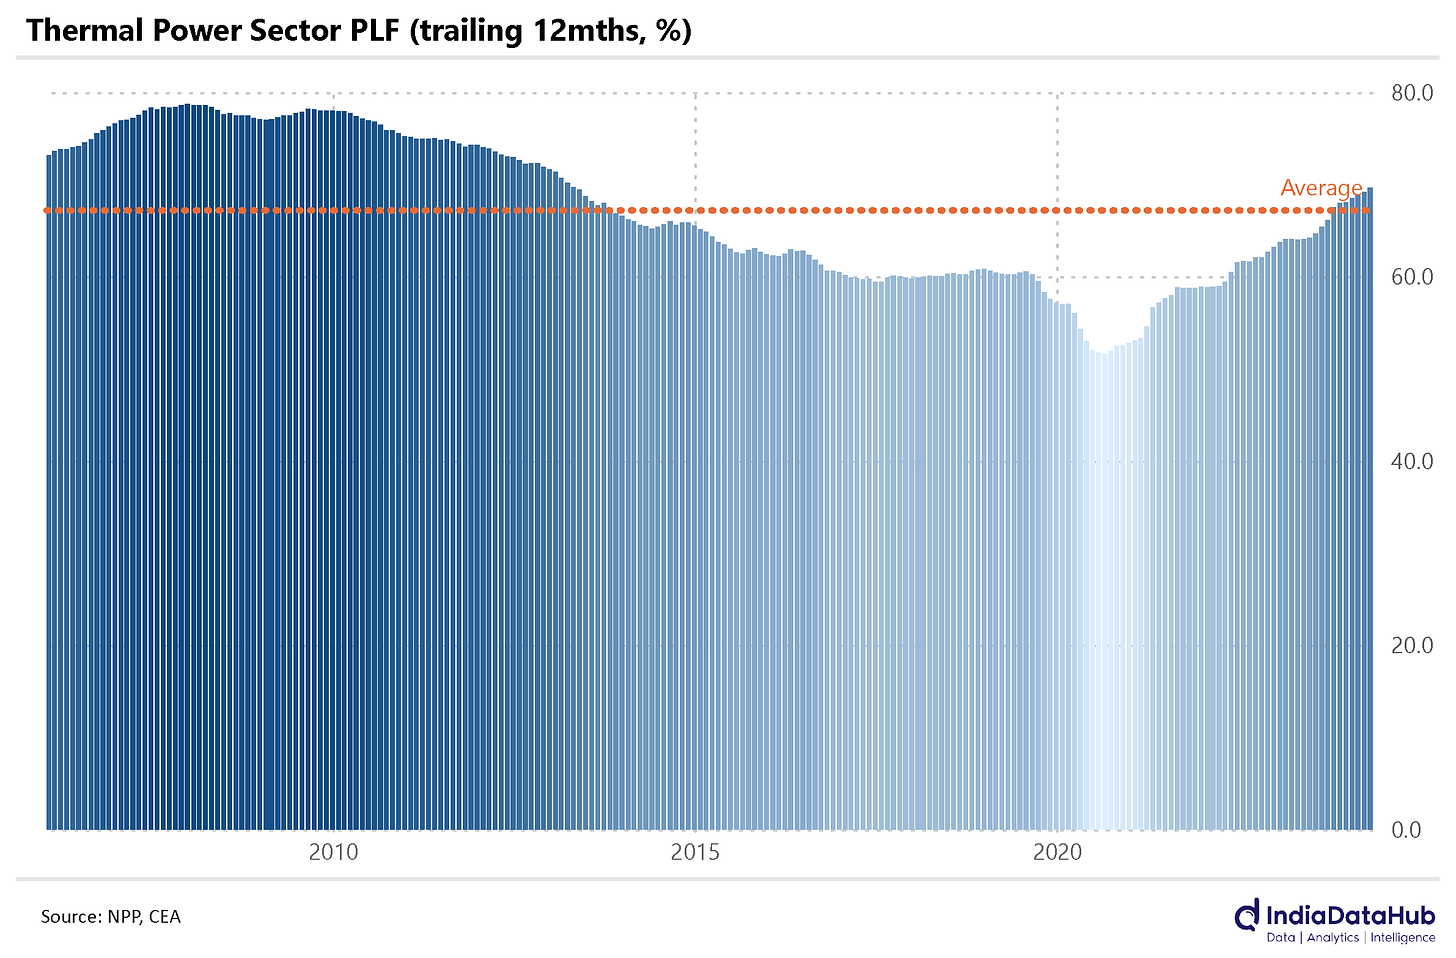
For many years, Indian thermal power plants were operating far below capacity. Their ‘plant load factor’ (PLF), a measure of how much of their capacity they’re actually using, was exceedingly low. And with low loads comes poor efficiency. This made plants wasteful, while also making them expensive to run. For privately-run plants, this caused great financial concern.
The trend of low loads has reversed over the last few years, however. India needs more power, and coal is by far what it relies on the most. The load of thermal plants has gone up. Their average PLF over 12 months is the highest it has been in more than a decade.
The highest PLFs India has seen were a little above 70%, back in the mid-2000s. This kicked off a spate of capital expenditure in setting up new plants. If thermal power production grows at a similar rate for another year, we’ll be back at those levels.
Dig more to burn more
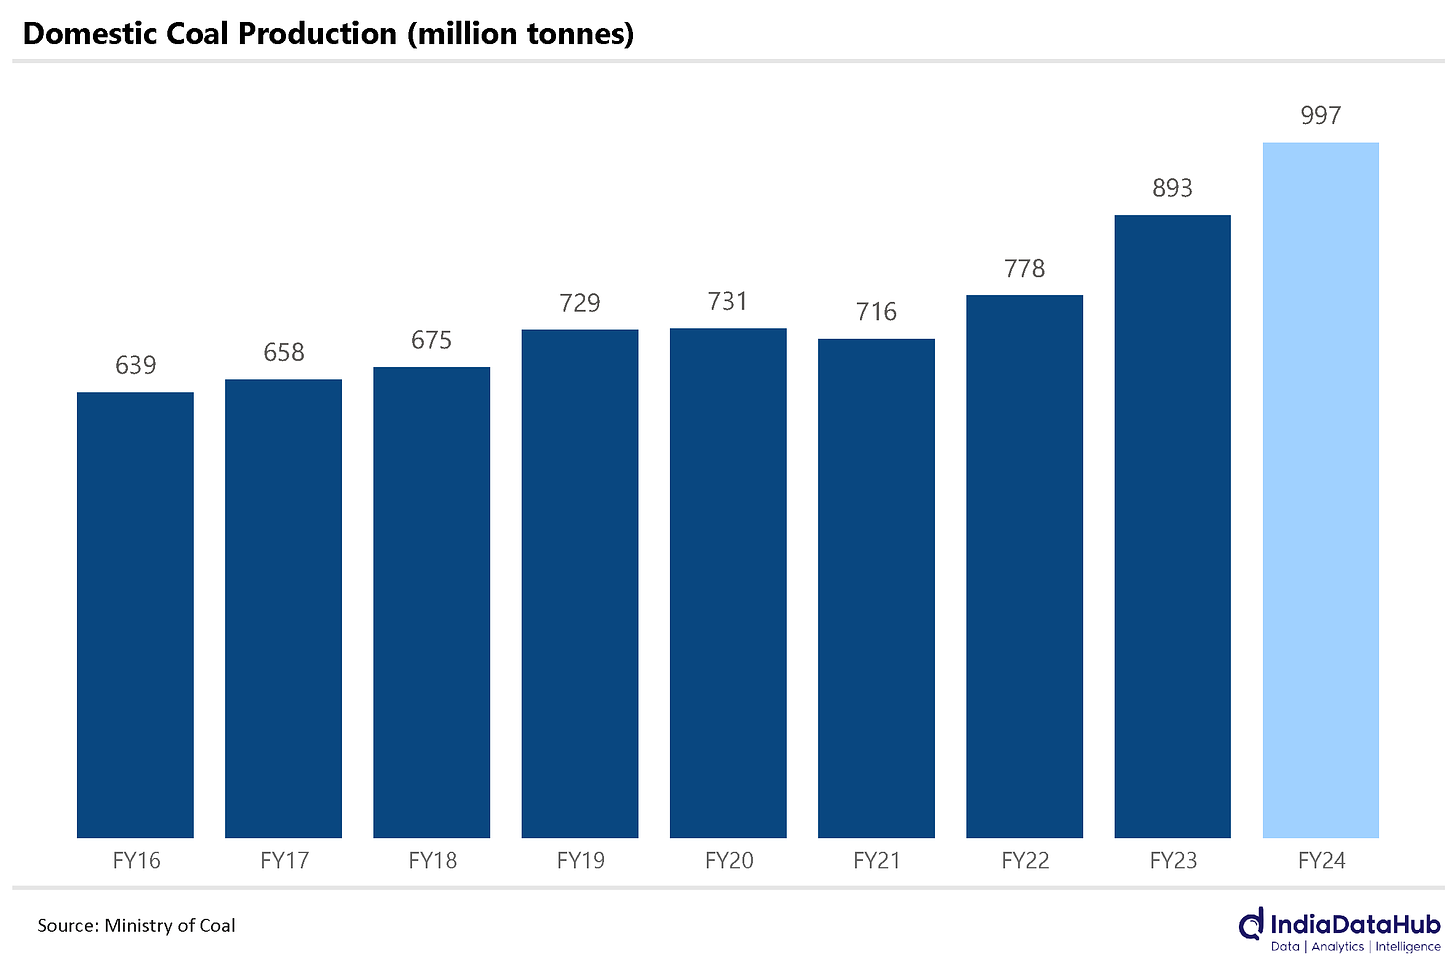
Where are we finding all this coal to burn? Well, we’re digging it out of the ground, of course.
This isn’t readily apparent if you look at April’s numbers alone. In April, coal production was up by a reasonable 7% from April last year, slowing down slightly from the previous financial year’s figures. Last financial year, though, it had grown by 12% year-on-year. The year before that, 15%. Before that, 9%. Basically, our coal production is steadily marching upwards.
And that’s a good thing, on the balance. We’d be in a tight spot if we had to import all that coal we need for power generation.
Bin Diesel
There’s more to energy than electricity generation. We also use fuel to move things around.
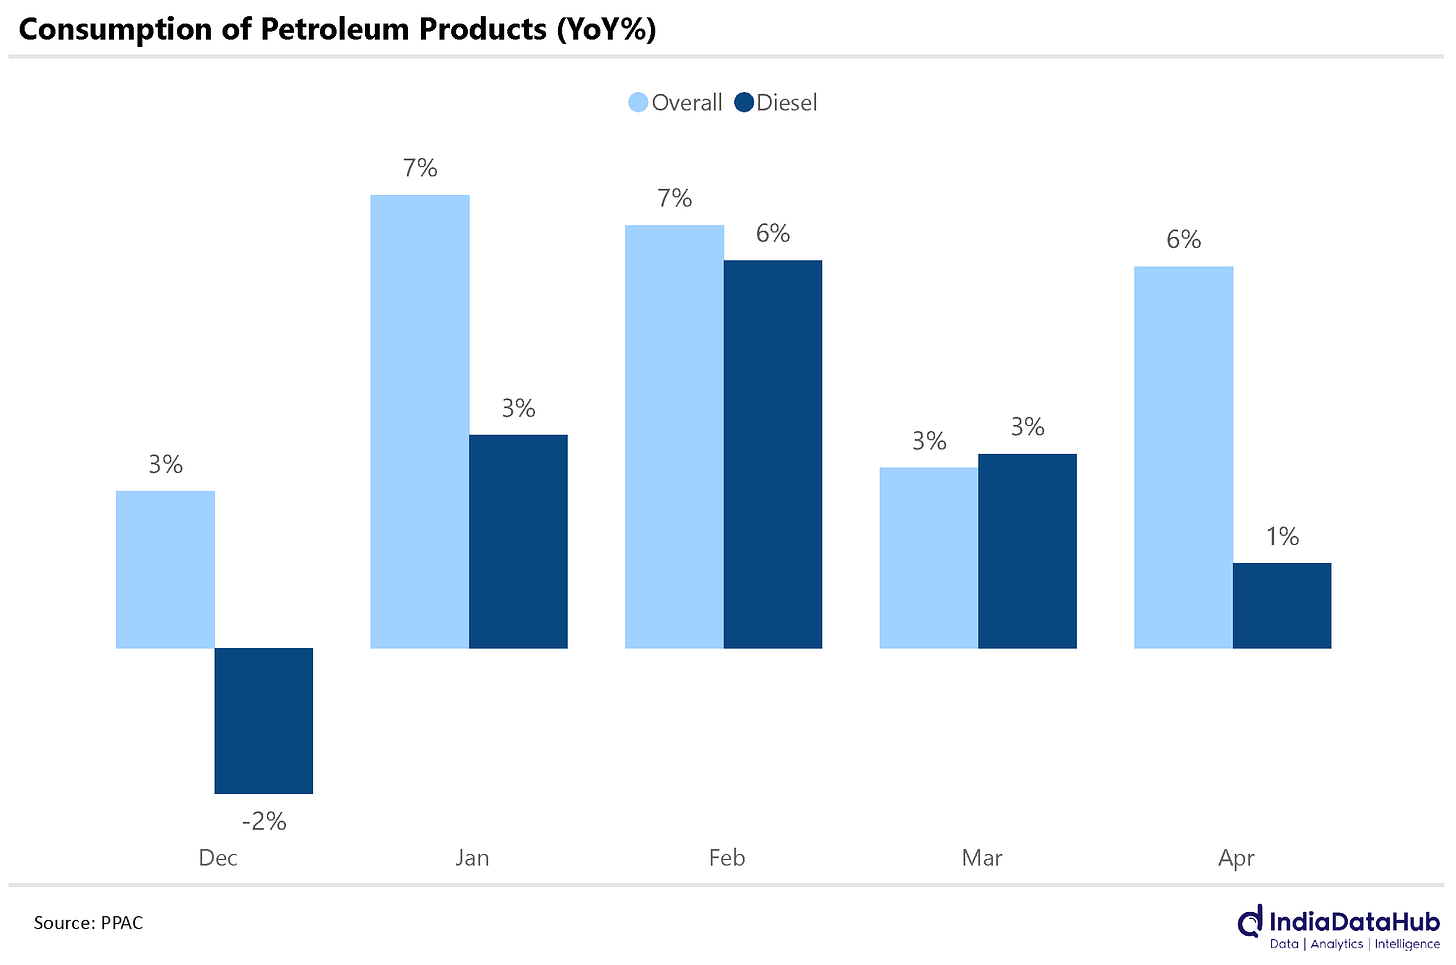
India used a modest 6% more petroleum products this April than April last year. Our petrol consumption has grown at a similar rate for a few months, in fact. No surprises here.
Well, almost no surprises — until you zoom in, that is. See, there are some petroleum products that we’re consuming at an ever-greater rate. Our consumption of petrol, jet fuel and pet coke has jumped up by double-digits. Our LPG consumption, too, has grown by 9%.
On the other hand, our diesel consumption has grown by a paltry 1%. And that’s been the story for a few months.
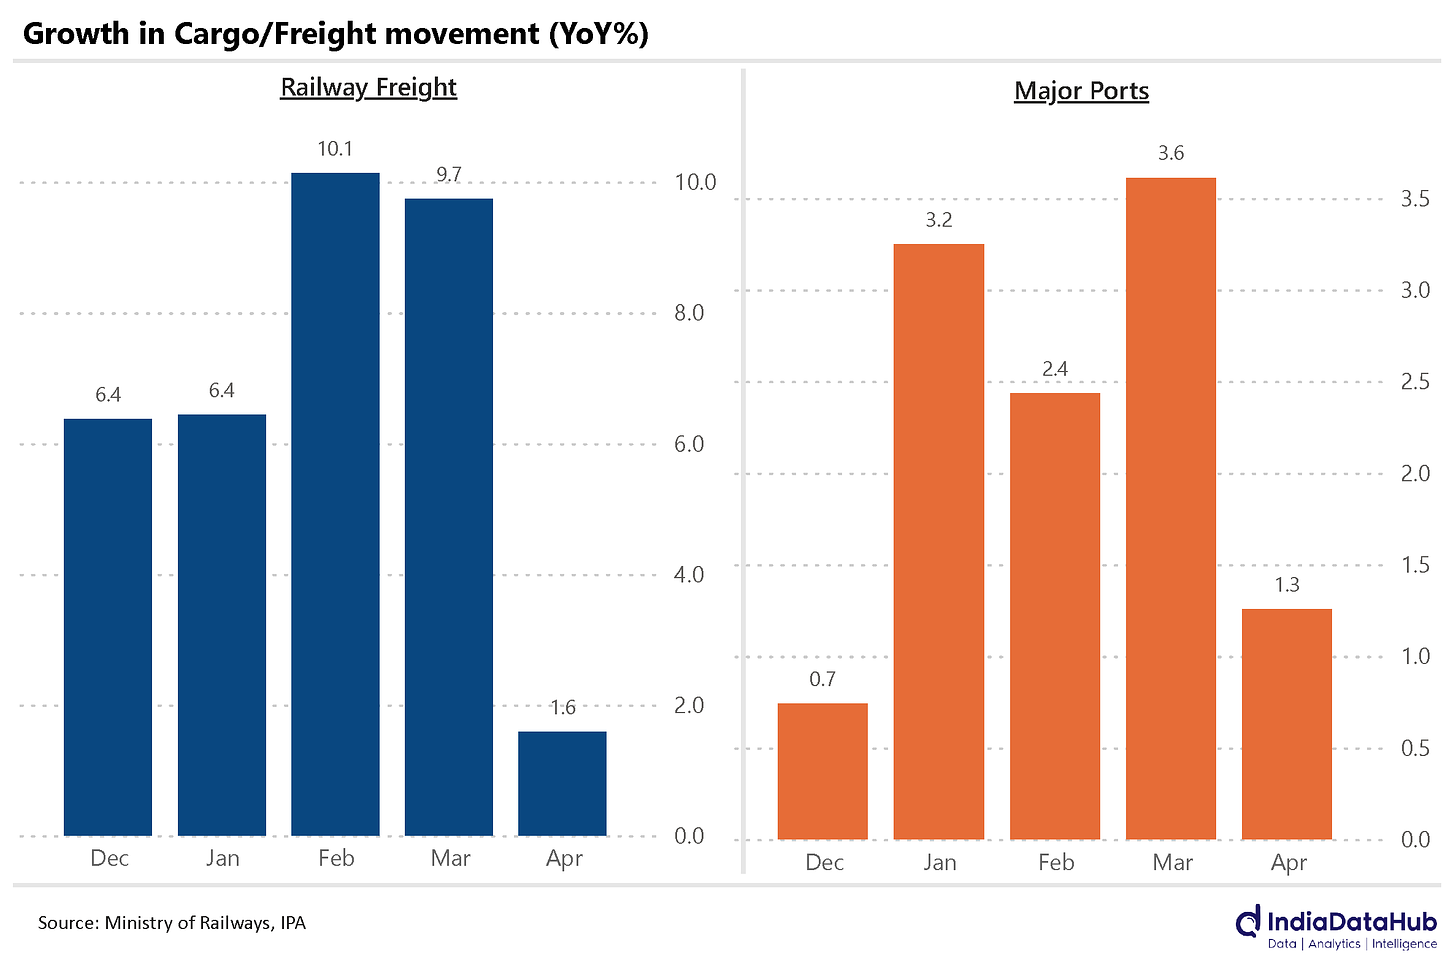
Earlier on, it looked like people needed less diesel because they increasingly preferred trains over trucks, to transport goods. Corroborating this was a 9% spike in railway freight this March quarter, compared to the same quarter last year.
April, though, wasn’t great for trains either — railway freight grew by a mere 1.6% year-on-year. Freight traffic as a whole has been subdued, in fact. Major ports, for instance, saw cargo volumes grow by a mere 1.3% year-on-year — a 4 month low.
Up, up and EWay!
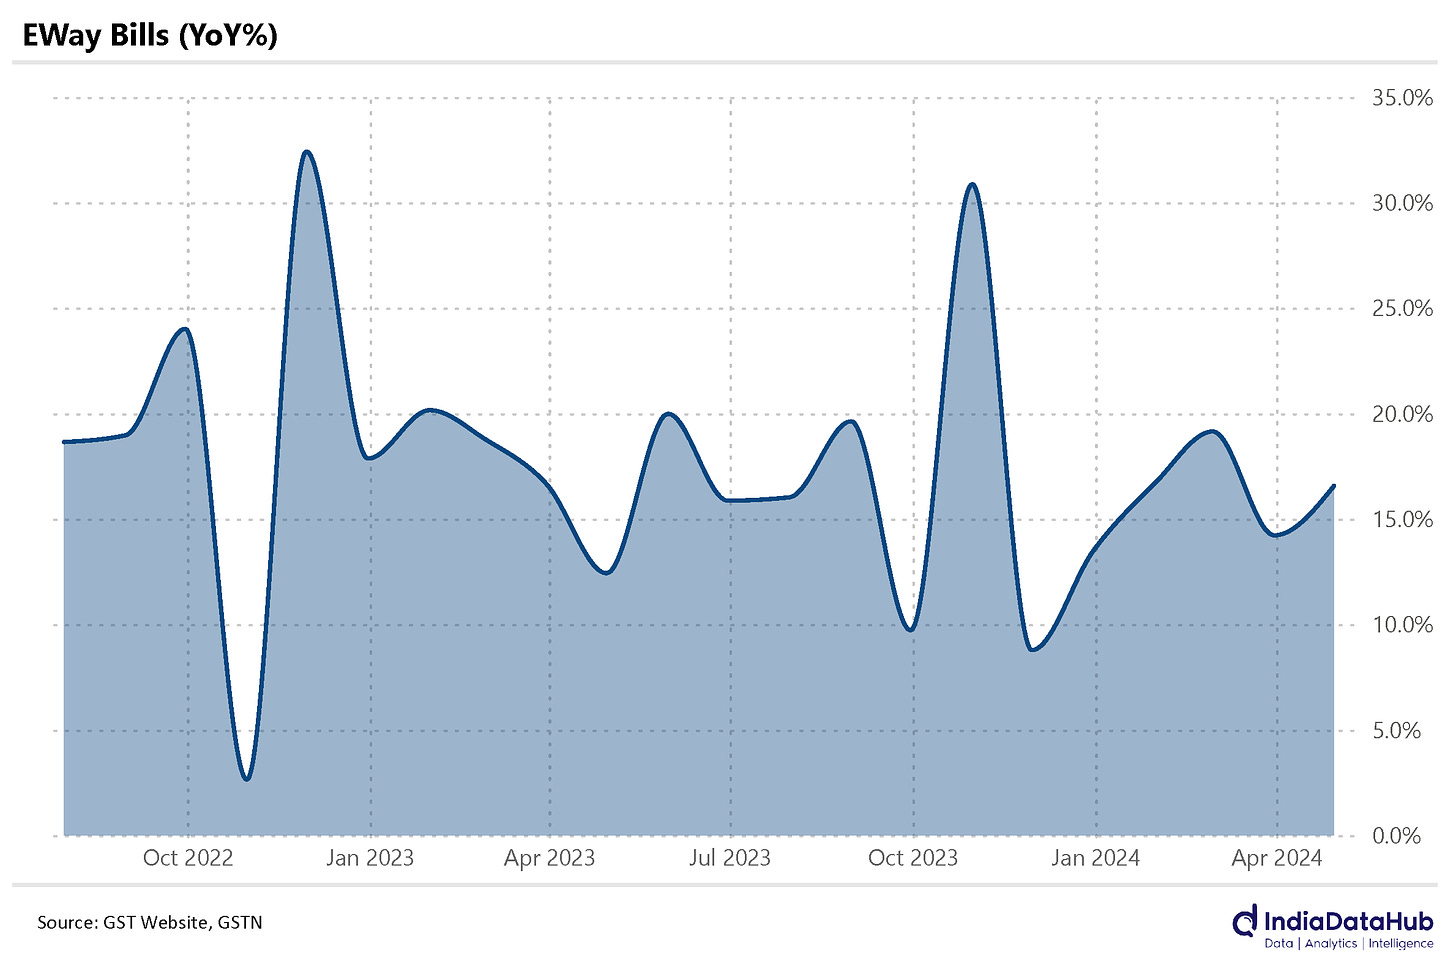
Despite the dreary data on freight traffic, however, EWay bills tell a different story.
Under GST laws, you need to create an EWay bill while transporting any large consignment of goods (that is, anything worth more than ₹ 50,000) within the country. We’re generating these bills at an accelerating pace. This April, the country clocked 17% more EWay bills than April last year, marking the 5th straight month of double-digit growth.
Most of this growth comes from interstate transport. Usually, it is goods that we import/export, or move from factories to distributors, that are transported interstate. If there is a spike in these goods, though, shouldn’t railway traffic increase? Or shipping cargo, for that matter? Why there’s such a mismatch, alas, remains a mystery.
Out of work
Finally, we have some dismal data on white collar jobs.
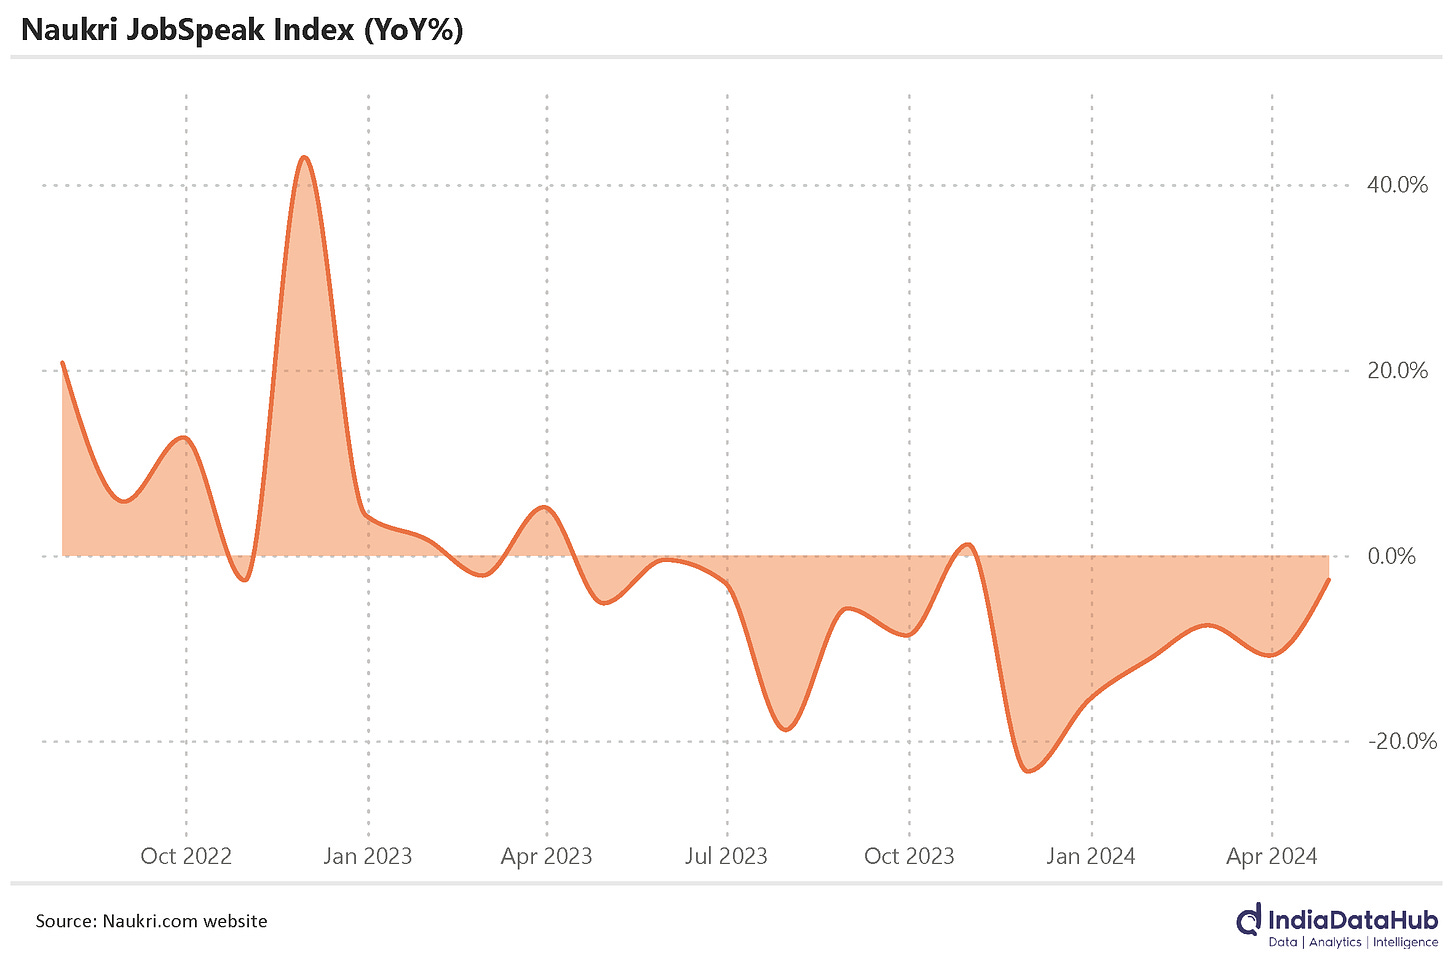
Naukri.com puts out the ‘Naukri JobSpeak Index’ every month, which looks at the number of job postings on the website. This gives you a sense of the availability of white collar jobs in the country. It’s not a perfect measure – especially because Naukri.com probably can’t access job postings on rival platforms – but its still worth paying attention to.
What does it say? Well, listings in April were lower than April last year – the twelfth month of decline in the last thirteen months.
Is there a drop in the number of white collar jobs that are available in the country? Since such jobs are, by-and-large, concentrated in cities, this might also suggest that the urban labour market is sagging more broadly. Alternatively, is it all just a distortion in Naukri.com’s dataset?
We’ll know for sure later this month. That’s when the Government releases the results of its quarterly ‘Periodic Labour Force Survey’, which looks at urban unemployment. While its December release showed a strong urban labour market, let’s see if things change this time around.
That’s it for this week, folks! Thanks for reading.