
It’s the economy, stupid! Summer high (frequency indicators)
We love India Data Hub’s weekly newsletter, ‘This Week in Data’, which neatly wraps up all major macro data stories for the week. We love it so much, in fact, that we’ve taken it upon ourselves to create a simple, digestible version of their newsletter for those of you that don’t like econ-speak. Think of us as a cover band, reproducing their ideas in our own style. Attribute all insights, here, to India Data Hub. All mistakes, of course, are our own.
May brings with it a raft of high frequency indicators to dig through. What’s that, you ask? We described them a couple of months ago:
“Those are little bits of information on the economy that we can gather regularly and quickly.
Think about it: nobody really understands how an economy is doing. Economies are impossible to grasp. They’re made of billions of transactions – people buying coffee, or filling petrol in their bikes, or picking up a copy of the day’s newspaper – each thing, each day, for each person and each business, taken together. If you really want to understand an economy, first, you must know every last thing that happens in the country.
The best we can do is look at proxies. We take the small trickle of data-points we can get – the ‘high frequency indicators’ – and use them to make whatever conclusions we can. They’re not perfect, but they give us a crude, low-resolution picture of the country’s economic activity.”
We’re doing a routine full-body check-up for the economy, if you may. Strap in.
GST collections stay steady
We’ll begin with GST collections. Why do they matter? We went over this back in February:
“The Indian government charges a Goods and Services Tax, or GST, on most transactions for goods or services in the country. GST collections, as a result, are a fraction of all the money that changes hands across the economy. Now, it’s not a perfect proxy. There is lots of economic activity that this doesn’t catch. Even so, GST collections do give you a rough picture of the trade taking place in the country.”
GST collections for April were up by 13%, from April last year. Average out the growth in GST collections for the six months that came before this, and they come to 13% as well. A pretty routine month, all in all.
As an aside: A month’s GST bills are due by the 20th of the next month. April’s numbers, therefore, tell us about March’s economy, by and large.

There’s a spot of nuance here.
Though our GST collections as a whole grew at a robust 13%, collections on imports are only growing in the single digits. This mirrors the paltry growth we’re seeing in merchandise imports, which are stuck around the ~3% mark.
What does that tell us? While the GST captures a steady uptick in business activity, most of that is domestic. Our trade with the rest of the world, alas, is seeing less exciting times.
Vehicle sales vary
Next, automobiles. We’d written about their importance of the indicator back in March:
“People always need vehicles. But vehicles are huge purchases, not made on a whim. People buy them when they have money to spare and feel confident that things look good in the foreseeable future. As a whole, then, Indian automobile sales tell us how good Indians feel about their economic prospects.”
This time around, though, it’s hard to say what people’s vehicle purchases say about their mental state.
On one hand, there’s been a definite uptick in the sale of personal vehicles:
- Two-wheeler sales were 33% higher than in April last year – the highest they’ve grown by since October 2022. That said, this figure makes things look more dramatic than they are. Last April was terrible for two-wheelers, with a marked dent in sales. Even a half-decent month would look incredible in comparison. April 2022 makes a better basis for comparison: and sure enough, the two-year growth in two-wheeler sales, this April, is comparable to the growth we saw last quarter.
- Car and SUV sales grew by a healthy 15%. Sales had fallen by 5% in March, and so, this is a healthy jump upwards.

Bigger vehicles, on the other hand, aren’t selling nearly as well:
- Tractor sales have been weak for two straight months. They grew by a mere 1% in April, year-on-year, after dropping by 3% in March.
- Trucks are having a worse time still. They’ve declined for six months on the trot.
Services exports fall
After almost 40 straight months of growth since January 2021, India’s service exports dropped suddenly in March. The decline wasn’t severe, though: falling by just 1.4% against March 2023. At the same time, our imports dropped too – by 2%. In all, we continue to export more services than we import, with our services trade surplus (that’s exports minus imports) remaining around where it was last March.
If you add goods in the fray, between January and March, India imported US$ 7.5 billion more than it exported. That’s a drop of 45% from the same quarter last year.
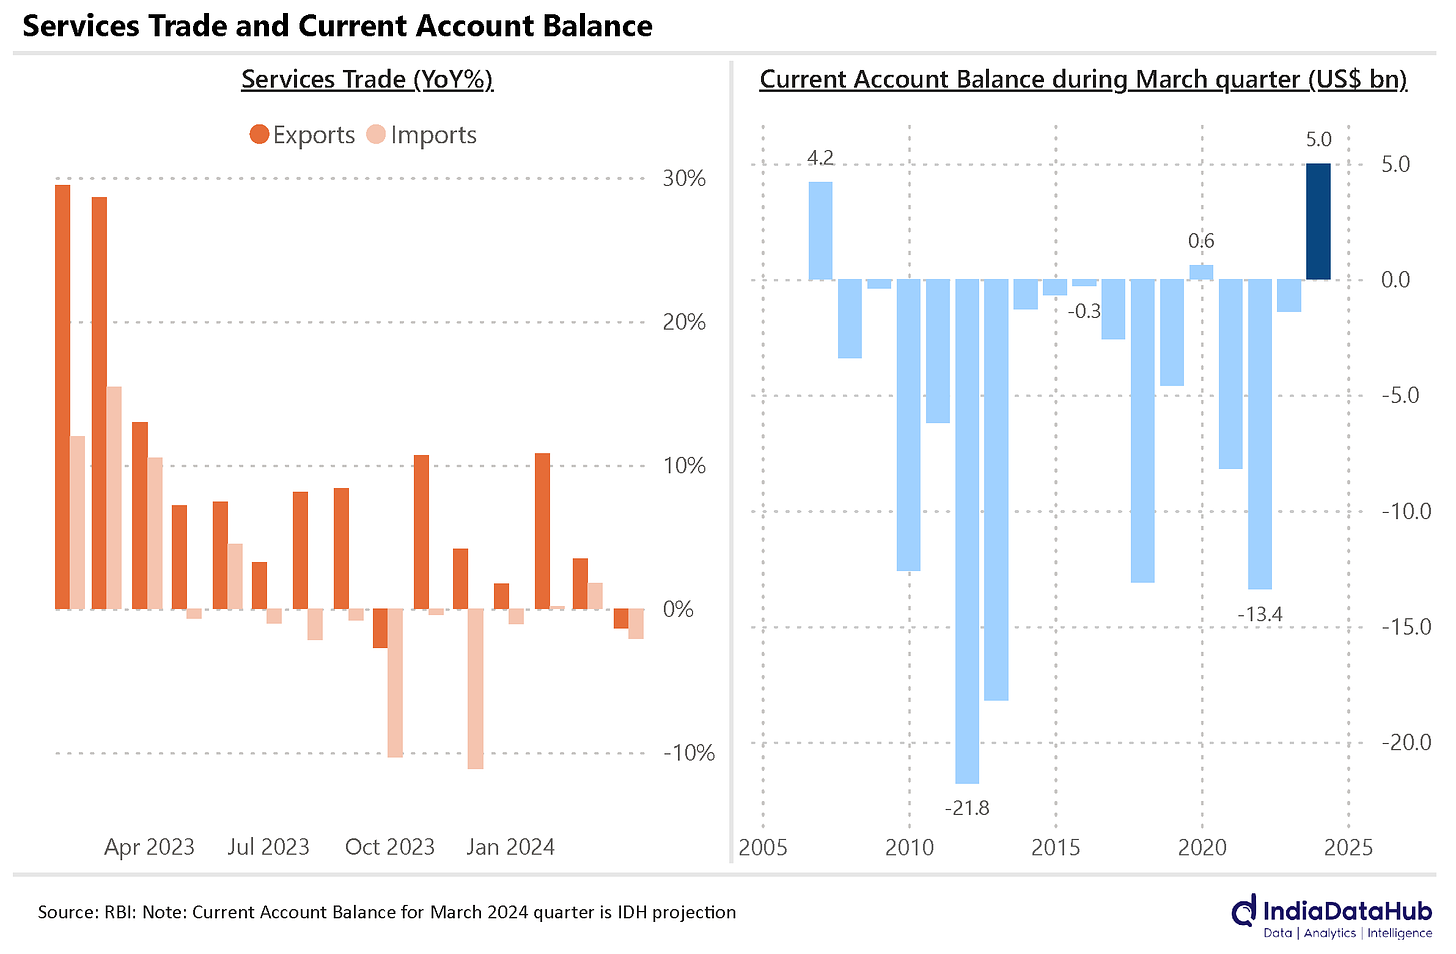
Here’s some good news: We have a current account surplus in the March quarter! If you’re wondering what that is, we’ve touched on it before:
“We maintain a record of the money going in and out of the country. There’s usually two ways this happens:
One, money goes in or out of a country cleanly. That is, whoever receives money gets to keep it, no questions asked. This usually happens when you sell something and pocket whatever was paid for it, although there are other ways in which this happens. The record of all this movement of money is the Current Account…”
Last quarter, India received US$ 5 billion more than it sent out, with no strings attached. The last March quarter in which this happened was in 2020. The last time before that? 2007. Yep. Not something that happens every day.
Rocky Rupee
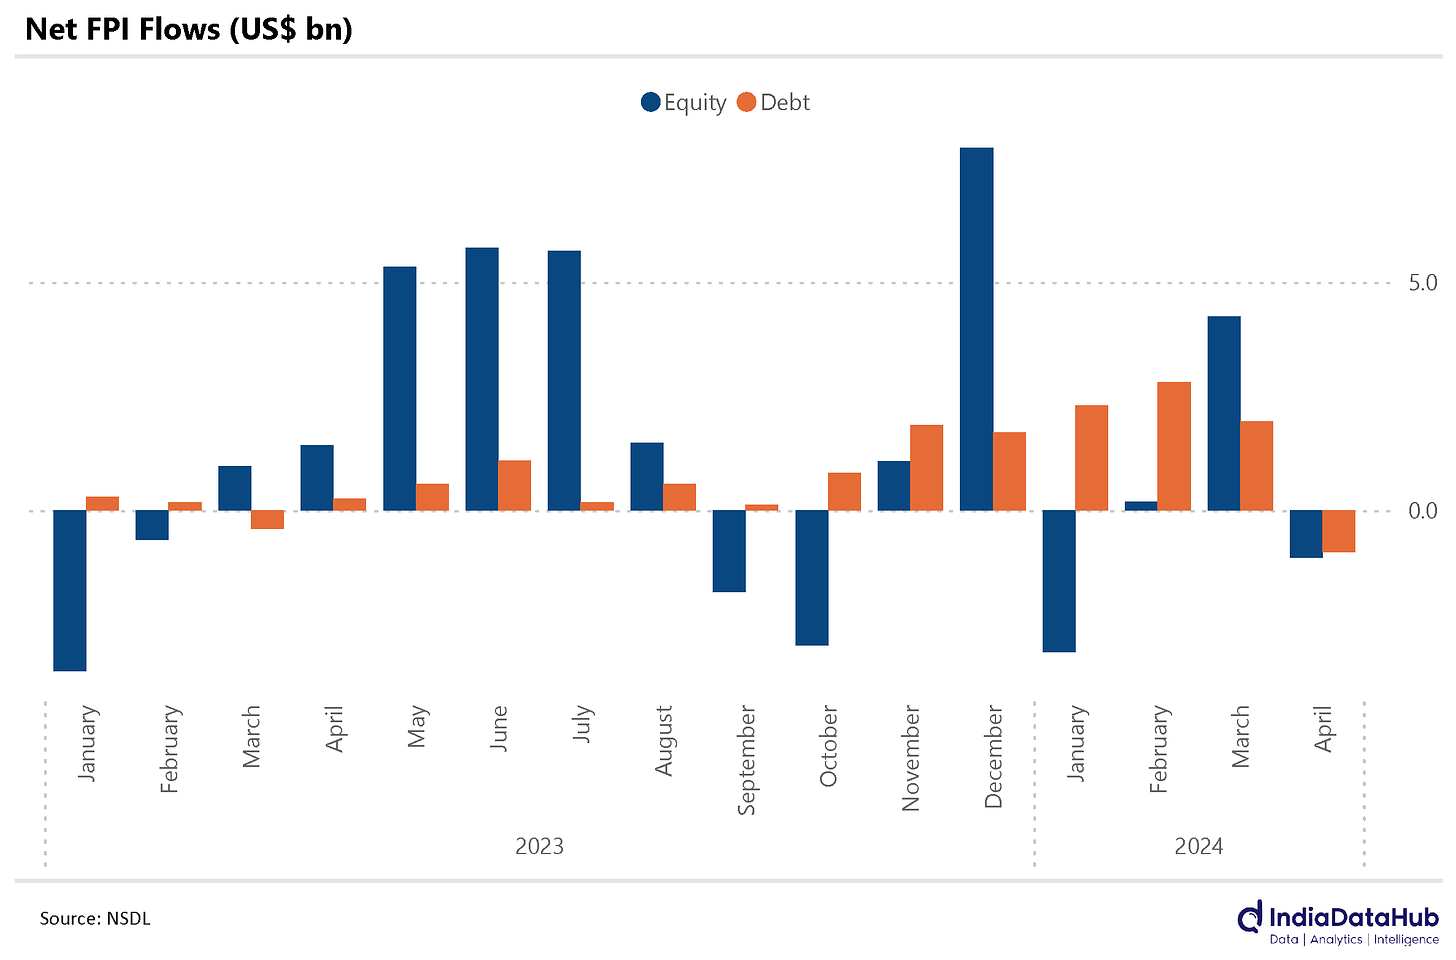
There’s a counterpart to the current account, where money comes into a country with strings attached. It creates a little obligation in the country it reaches. You either own something for putting in that money, or are owed something. This is the ‘capital account’.
The price of the Rupee is linked to how much money enters and leaves the country. Both the capital account and the current account figure, here. While we have a current account ‘surplus’ – that is, more money has come into the country than gone out – the capital account has been dragging the Rupee down.
Why? Because we’re bleeding out foreign portfolio investment.
Foreign portfolio investment are bets that people from abroad take in a country’s capital markets, without directly involving themselves in running things. For many months, we were drawing in billions of dollars in such investments. This trend flipped in April. Almost US$ 2 billion left the country, including ~US$ 1 billion that was invested in debt.
Meanwhile, the US Dollar has been gaining strength all through 2024. When this happens, it takes more Rupees to buy a Dollar. To us Indians, the Dollar gaining value is quite like the Rupee losing value – Dollars (and imports, by extension) become expensive for us either way.
Even so, we’ve managed to keep the Rupee quite stable compared to the Dollar. How? Well, remember our foreign exchange reserves, which we once compared to a country’s savings? The RBI’s been spending those to ‘defend’ the Rupee, which is a nice way of saying “buying lots of Rupees in international markets so that it becomes more expensive.” It has spent US$ 11 billion in the last three weeks alone.
The result? The Rupee hasn’t slipped much compared to the Dollar, unlike many other emerging market currencies. For now.
#Opentowork?
People don’t seem too keen on the NREGA any more. April marked the 6th straight month of decline in demand for work under the scheme, falling 5% from April last year. Zoom in, though, and a more complex picture emerges. While the scheme has practically come to a halt in West Bengal because of Centre-State issues, Maharashtrians seem to demand much more work than last year under the scheme. This graph should tell you more:
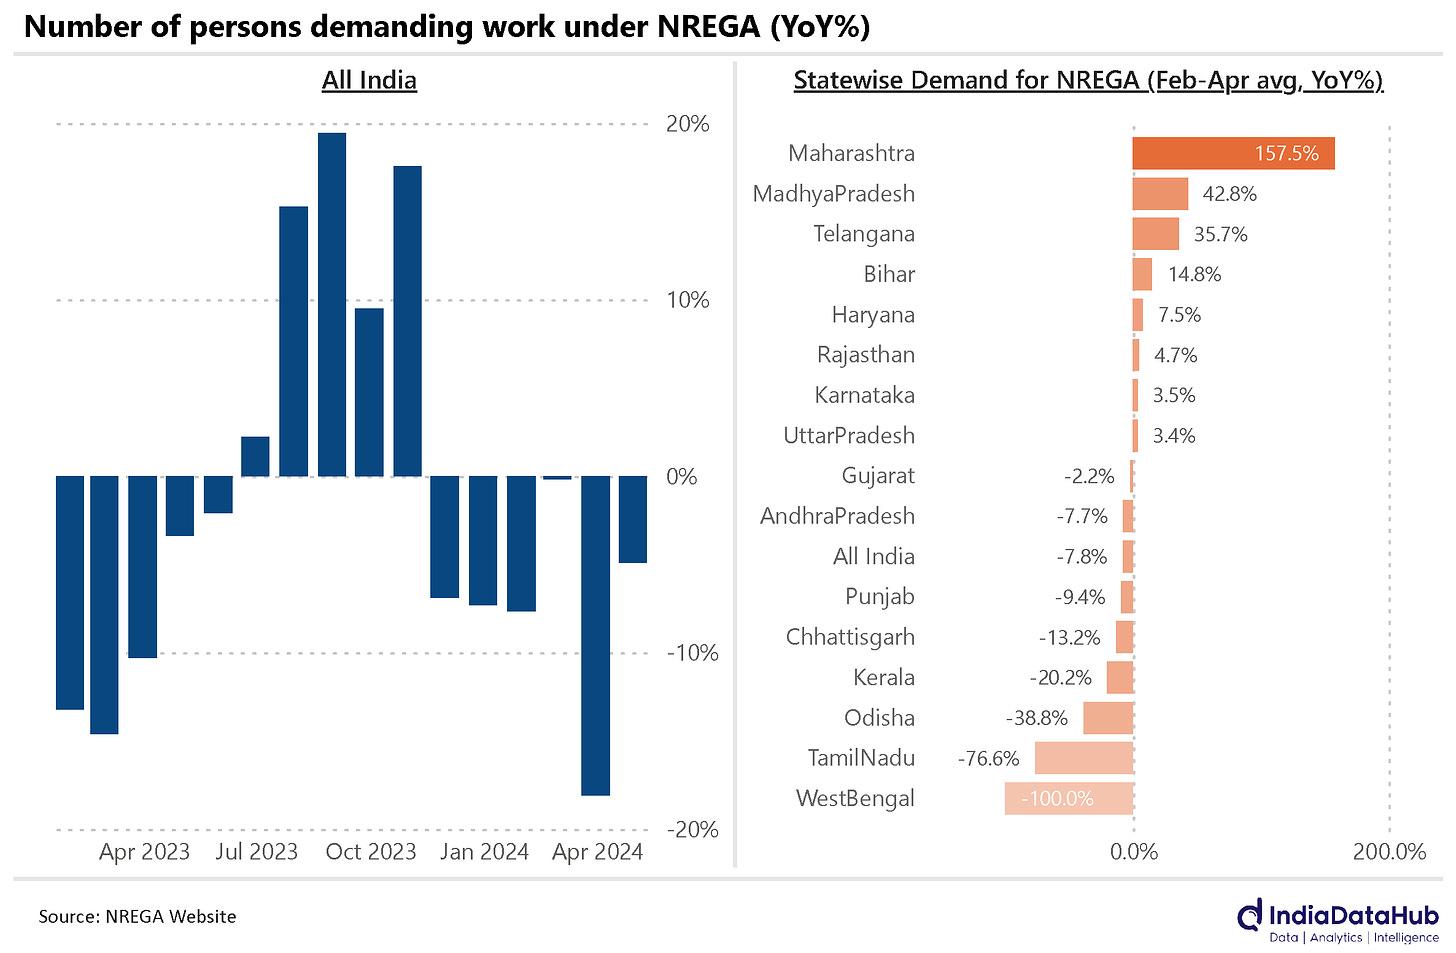
Why the variance? It’s complicated.
There are many things that dictate how much work people demand. Many of these may have nothing to do with the people themselves. The demand for work may fall, not because people are wealthier and don’t need work, but because a state isn’t focussing on implementing the NREGA scheme – for budgetary or political reasons.
These things impact the data in asymmetrical ways. Implementation issues can often suppress demand, making it look lower than it really is. A sudden jump in demand, on the other hand, is almost always because people have no other avenues to earn money.
The US job market softens
The United States, in April, had an underwhelming job market. While the ‘consensus estimate’ – a distillation of what all analysts believe – indicated that the United States would create ~240,000 new jobs, in reality, it only managed 175,000 jobs. That’s the worst it has performed in six months.
Worse still, the US Bureau of Labour Statistics also revised its prior estimates, concluding that 22,000 fewer jobs were added in February and March than we previously thought.

Only last week, we talked about how the US saw underwhelming GDP growth between January and March. The new job data confirms this. The US economy, it appears, is losing some steam.
If you’re thinking: “hey, at least we might get a rate cut out of this,” though, think again. The markets certainly don’t see a rate cut before September. There’s still some waiting to go.
That’s all for the week, folks! Thanks for reading.