
It’s the economy, stupid! Of lungis and February numbers
We love India Data Hub’s weekly newsletter, ‘This Week in Data’, which neatly wraps up all major macroeconomic data stories for the week. We love it so much, in fact, that we’ve taken it upon ourselves to create a simple, digestible version of their newsletter for those of you that don’t like econ-speak. Think of us as a cover band, reproducing their ideas in our own style. Attribute all insights, here, to India Data Hub. All mistakes, of course, are our own.
Hey! Hey Stats-man! I have a quote for you!
Uh-oh.
Yeah! You know how statistics are like bikinis? They…
Yes, yes, they hide more than they reveal. Old one. Personally, I prefer “Statistics are like lungis, they hide things you might not want to see.”
But it’s true. Take last month. Because this is a leap year, even though the numbers for February are in, we have no idea if they’re any good.
Wait, what?
Hah, yes. See, stats-folk love doing “year-on-year” comparisons for monthly data. That is, they love comparing a month from one year with the same month the previous year.
The raw numbers for a month tell us very little. If I told you that 2 million cars were sold in India in February, for instance, what would you make of it? Is it a high number? A low one? Is the industry thriving? Declining? What does it all mean for our economy? You’d know nothing. You need some base, some benchmark to make some sense of it.
For such a benchmark, we usually look at the same month of the previous year. In many ways, it’s the fairest benchmark to compare against, because so much in the economy happens in a yearly rhythm. The weather is similar. People make many of the same purchases. Events repeat themselves. The same crops are sowed and harvested at the same time. Businesses chase the same targets. Weddings, vacations, big purchases – there’s a “season” for everything. Speaking very roughly, an economy repeats the same motions in the same month every year.
That makes sense. I think. But isn’t this also true for a leap year?
It is, but for one thing: there’s one extra day in February. That is, the month suddenly stretches by ~3%. That’s 3% more time for things to take place. When we’re trying to measure changes in the tenths of a percent, that extra 3% can skew everything. All growth, this month, is slightly exaggerated.
It’s hard to know how much this changes things. If February 29 didn’t exist, would the same things happen on February 28? Or March 1? Did special things happen because it was the “leap day”? Or was it just an ordinary day for everyone concerned? There’s no true answer to such a question when you’re looking at something as big as an entire economy.
All one can say is: take everything this month with a pinch of salt. There’s stuff this lungi is hiding.
Any more pinches of salt from you and I’ll have a BP problem.
Hilarious.
But let’s look at the high frequency data-
The what?
The ‘high frequency data’. Those are little bits of information on the economy that we can gather regularly and quickly.
Think about it: nobody really understands how an economy is doing. Economies are impossible to grasp. They’re made of billions of transactions – people buying coffee, or filling petrol in their bikes, or picking up a copy of the day’s newspaper – each thing, each day, for each person and each business, taken together. If you really want to understand an economy, first, you must know every last thing that happens in the country.
The best we can do is look at proxies. We take the small trickle of data-points we can get – the ‘high frequency indicators’ – and use them to make whatever conclusions we can. They’re not perfect, but they give us a crude, low-resolution picture of the country’s economic activity.
Ahh. But they’re useless this year?
Not useless, no. But fuzzy, yes.
We’ll start with energy.
Everything in the economy consumes energy: buildings and factories, machines, vehicles, goods carriers, offices, everything. This makes energy a good proxy for the health of an economy. If an economy consumes more energy than before, more things are happening inside it.
You sound like a yoga instructor.
Haha, maybe. I can see it.
Although we’re talking about profane, earthly matters. You know, electricity, fuel – that sort of thing. Here’s the news:
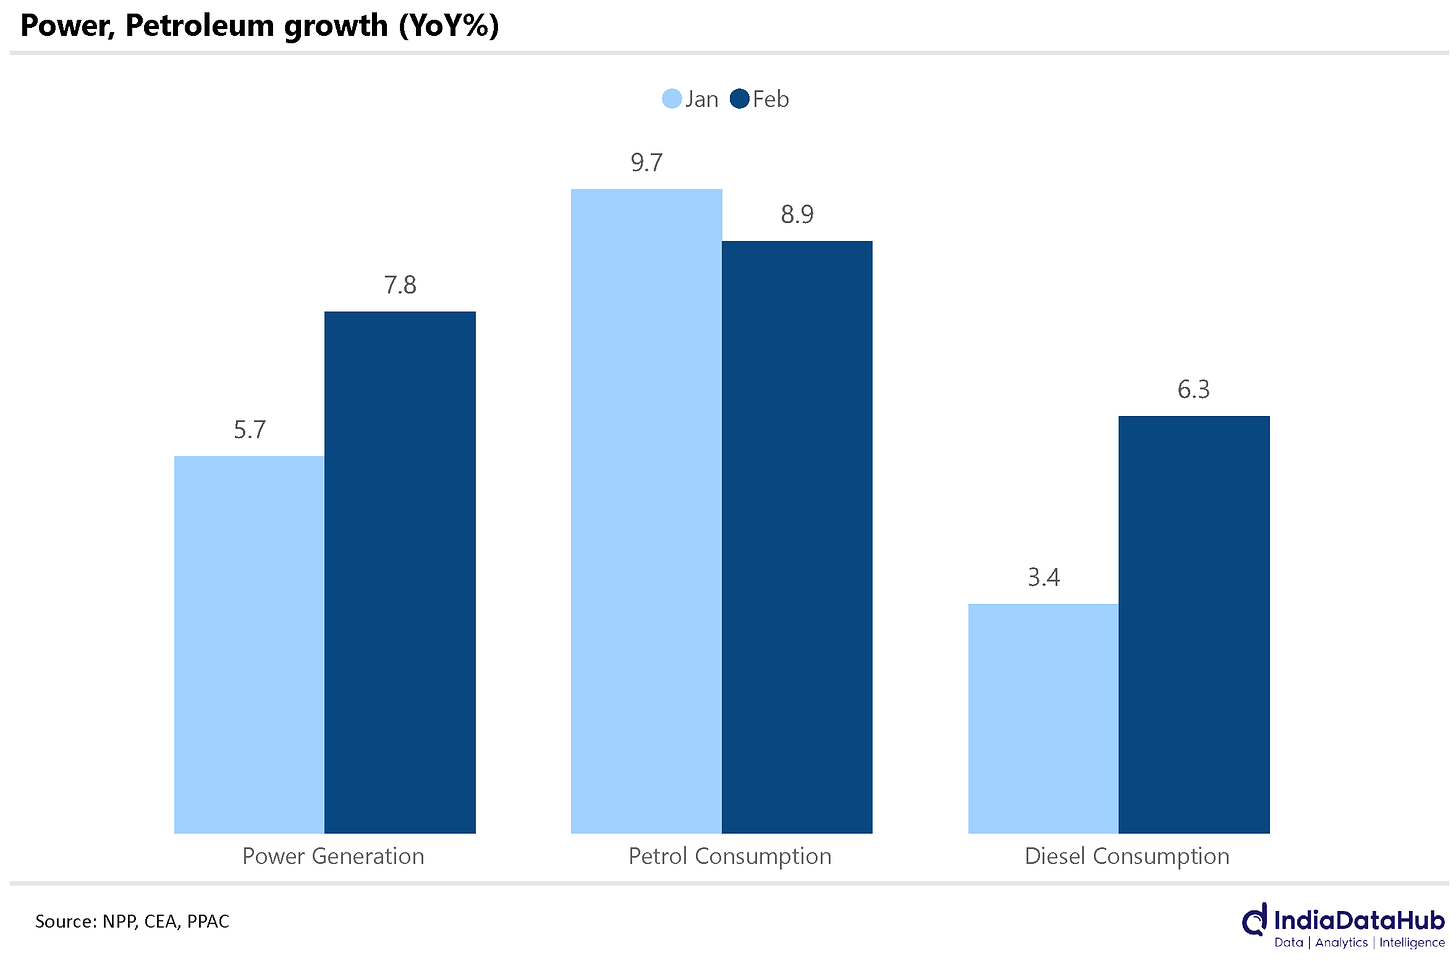
- Power generation grew by 7.8%, year-on-year, in February, compared to 5.7% in January.
- Diesel consumption went up by 6.3%, year-on-year, in February, compared to 3.4% in January.
- Petrol consumption grew at a lower rate than January, at 8.9%, year-on-year, in February compared to 9.7% the month before.
That looks like pretty hefty growth?
Yes, except, remember the leap year distortion!
To account for the extra day this February, we need to pull these figures down a little. That would tell us that our consumption of power and diesel has grown by about the same pace as it did last month. Petrol, on the other hand, has grown much slower.
Let’s move to vehicle sales.
People always need vehicles. But vehicles are huge purchases, not made on a whim. People buy them when they have money to spare and feel confident that things look good in the foreseeable future. As a whole, then, Indian automobile sales tell us how good Indians feel about their economic prospects.
Right. So, are people buying vehicles?
Top-line? Yes. A lot. But not like they were in January.
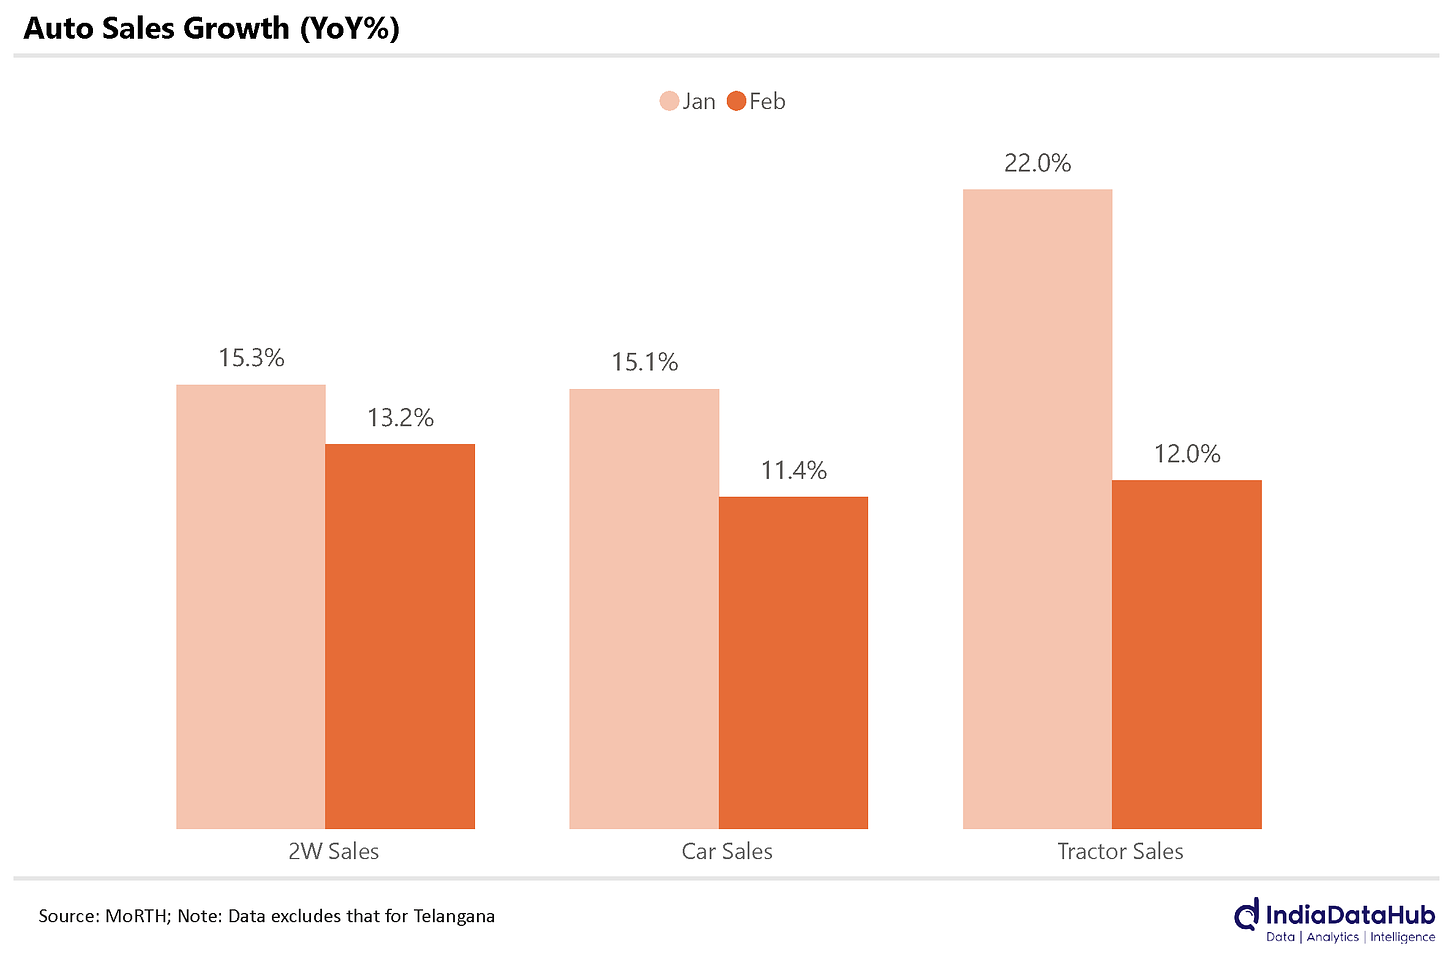
We saw massive growth in automobile sales in January. Year-on-year growth, across segments, ranged from the high teens to the low twenties. Things have calmed down a little in February.
Here’s the data: all three segments – two wheelers, cars and tractors – saw low double-digit growth: the year-on-year growth was 13.2%, 11.4% and 12.0%, respectively. Except…
Let me guess. Leap year shenanigans?
Leap year shenanigans indeed. Account for that, and we’ve probably seen growth in the high single digits. Not bad, still, but far lower than it was in the month before.
There’s other stuff that tells us that people aren’t buying too much, too. Let’s look at cargo-
There’s more high frequency data? I thought it was something we got very little of!
Oh, you wish. There’s a lot more. We aren’t even going through most of it here. It’s just very little information when you compare it to everything that happens in the economy.
Anyway, cargo. A lot of the economy is made of people buying and selling physical goods. Looking at how many goods have moved around in a month gives us a good sense of how well the economy is doing.
The cargo data isn’t great for February. Our ports received just 2.4% more goods this February compared to the last. Account for, er.. ‘leap year shenanigans’, and they’ve probably not grown at all.
We’ll now turn to GST. The Indian government charges a Goods and Services Tax, or GST, on most transactions for goods or services in the country. GST collections, as a result, are a fraction of all the money that changes hands across the economy. Now, it’s not a perfect proxy. There is lots of economic activity that this doesn’t catch. Even so, GST collections do give you a rough picture of the trade taking place in the country.
Now, there aren’t any leap year shenanigans in February’s GST data.
Okay..? And why’s that?
It’s simple: you need to pay your GST for a month by the 20th of next month. So the GST money the Government earned in February, to a large extent, was for transactions that took place in January.
The distortion will come up a month later, in the data for March.
Right. So what do, well… February’s January numbers say?
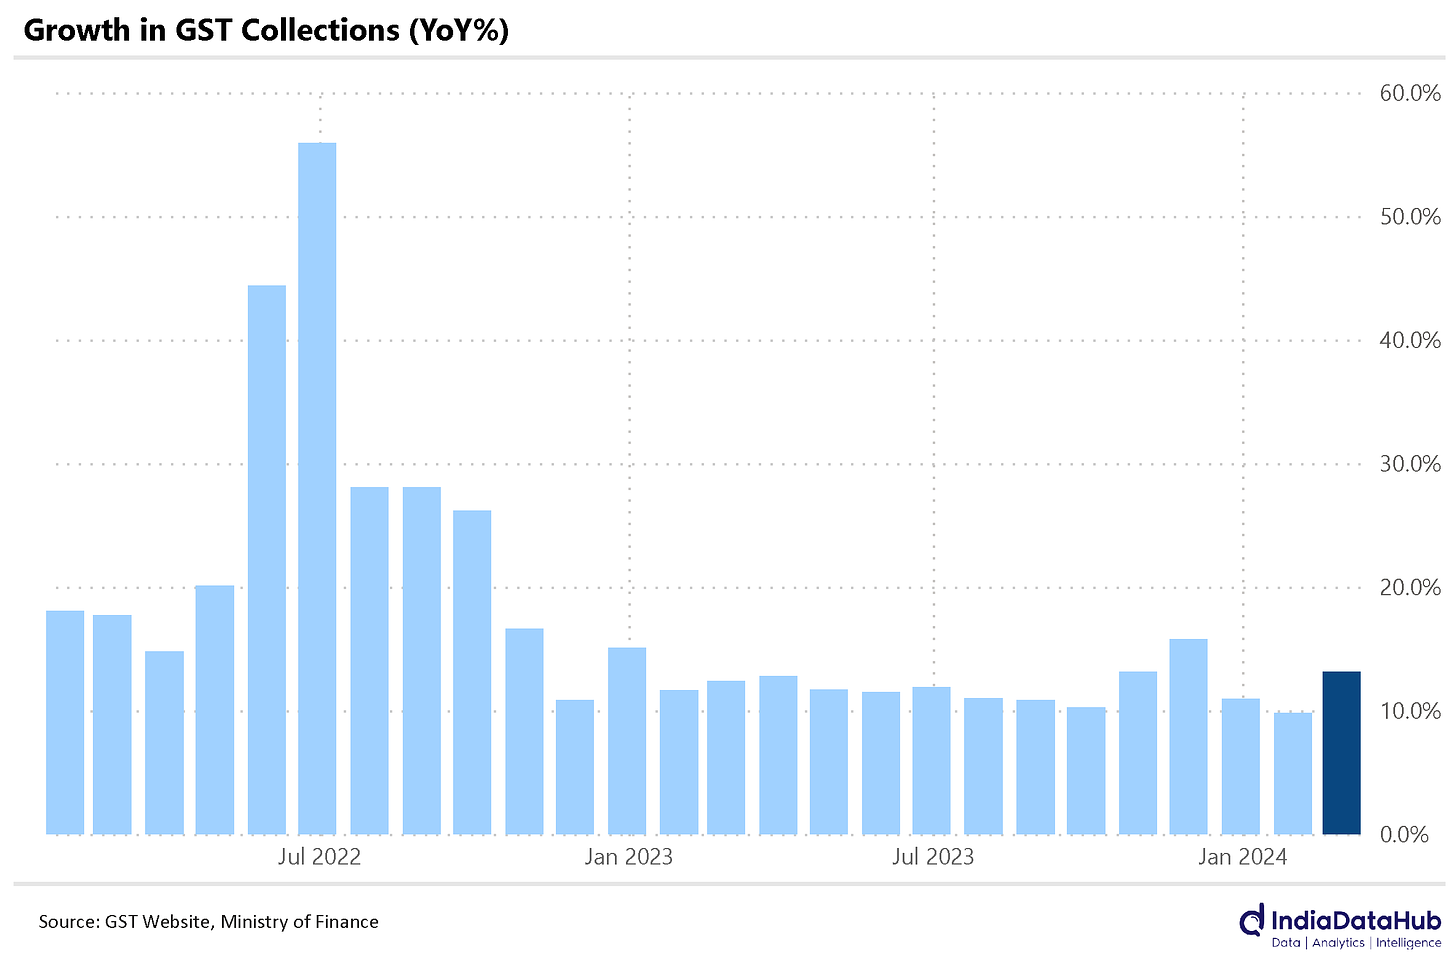
GST collections in February grew 13%, year-on-year. That’s a full 4% more growth than in the numbers for the previous month. This shows robust, clean growth
There’s some interesting, and maybe heartening, news on India’s foreign trade this January.
Yeah? I didn’t know that could happen.
Yep! Let’s begin with the first half of the equation: services.
Our services exports grew well in January – by 11%, year-on-year. At the same time, our services imports barely grew – by 0.2%. In all, we’re selling far more services than we’re buying. The difference between the two – our ‘surplus’ – has grown by 20%, year-on-year, to a US$ 16 billion. That’s a record!
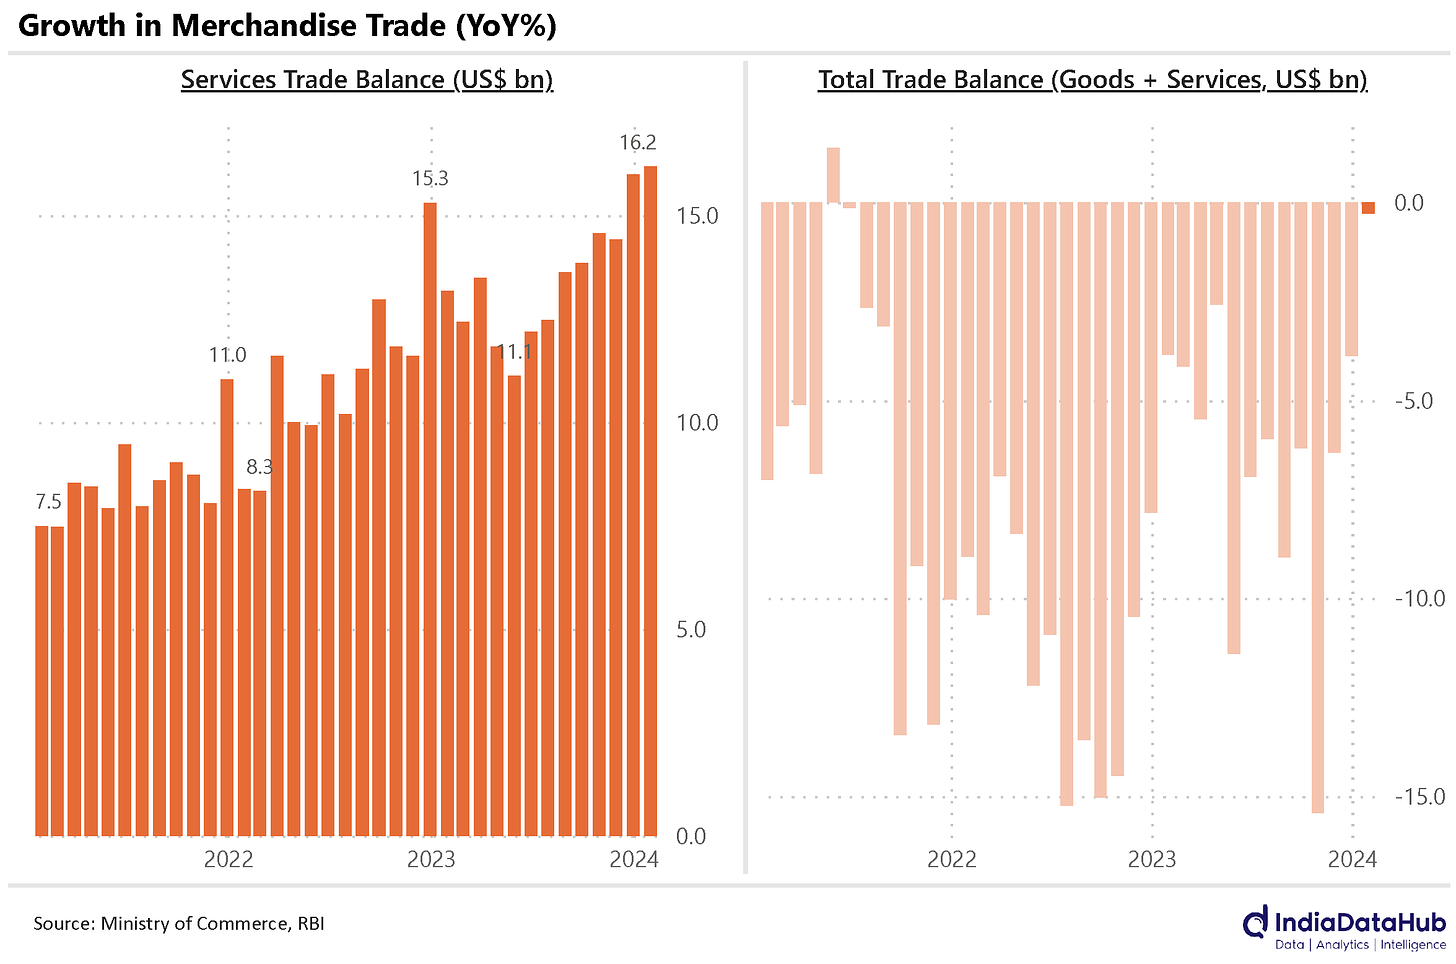
Now, the other side of the equation. We’ve exported less than we’ve imported, as we usually do. But the difference between the two – the ‘deficit’ – is roughly the same as our surplus in services.
In all, this time around, we might not have a trade deficit at all!
Okay, that does sound unusual.
Oh wait, there’s even more! Our trade deficit doesn’t account for all of our current account-
JARG-
Getting right to it!
We maintain a record of the money going in and out of the country. There’s usually two ways this happens:
- One, money goes in or out of a country cleanly. That is, whoever receives money gets to keep it, no questions asked. This usually happens when you sell something and pocket whatever was paid for it, although there are other ways in which this happens. The record of all this movement of money is the Current Account.
- Two, money can go into a country and create an asset or liability. You could give someone a loan in another country, and they have a duty to pay it back. Or you could invest in another country, and have rights over something there. This is money given with strings attached. We record such movements of money in the Capital Account.
The two make the two halves of a country’s ‘Balance of Payments’. Here, we’re talking about the first of these two.
Hmm. Go on.
Trade balances are the biggest part of our Capital Account. But there’s a lot of other stuff that goes in. This includes ‘remittances’, when Indians that live abroad send money back home. Add that to our calculations, and there’s a good chance we have a Capital Account surplus in January.
That almost never happens with India. But, well, it has. And, for reasons we’ve gone into before, this has kept the Rupee rather strong.
A lot of money is going into mutual funds, off late.
Pretty sure most of that’s because my parents are forcing me to invest.
Dream on, dream on.
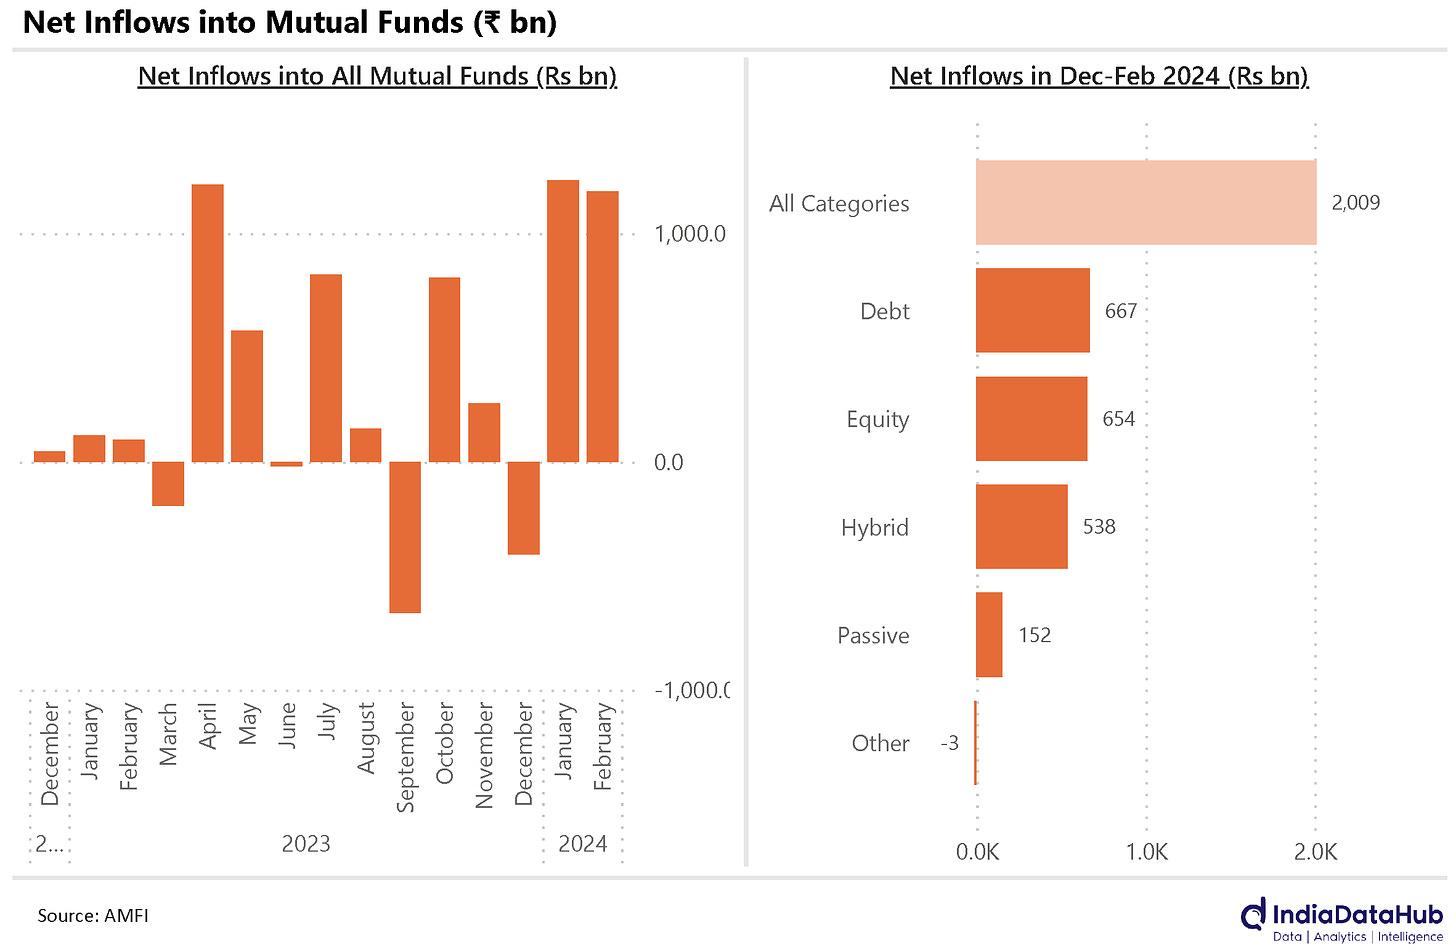
In February, Indian mutual funds recorded ‘net inflows’ of an incredible ₹ 12,000 crore. That is, the money entering Indian mutual funds was ₹ 12,000 crore more than the money that left. This the third highest for any month in the last four years – the highest coming just one month before, in January. Two strong months for the industry, coming back-to-back.
All sorts of funds have swollen up. Equity funds saw an inflow of ₹ 2,670 crore. Debt funds are doing as well as equity ones, over the last few months. Hybrid funds, passive funds and others, too, have also seen a good amount of money.
We can drill down a little further.
Less money has gone into small-cap funds than it has in a while. ₹ 22 billion entered small-cap funds this January, the lowest in five months, and only 10% of all the money going into equities.
Alright? So where’s all this new money going?
Funds that specialised in specific sectors and themes! More than 40% of all money going into equity funds went to sectoral and thematic funds.
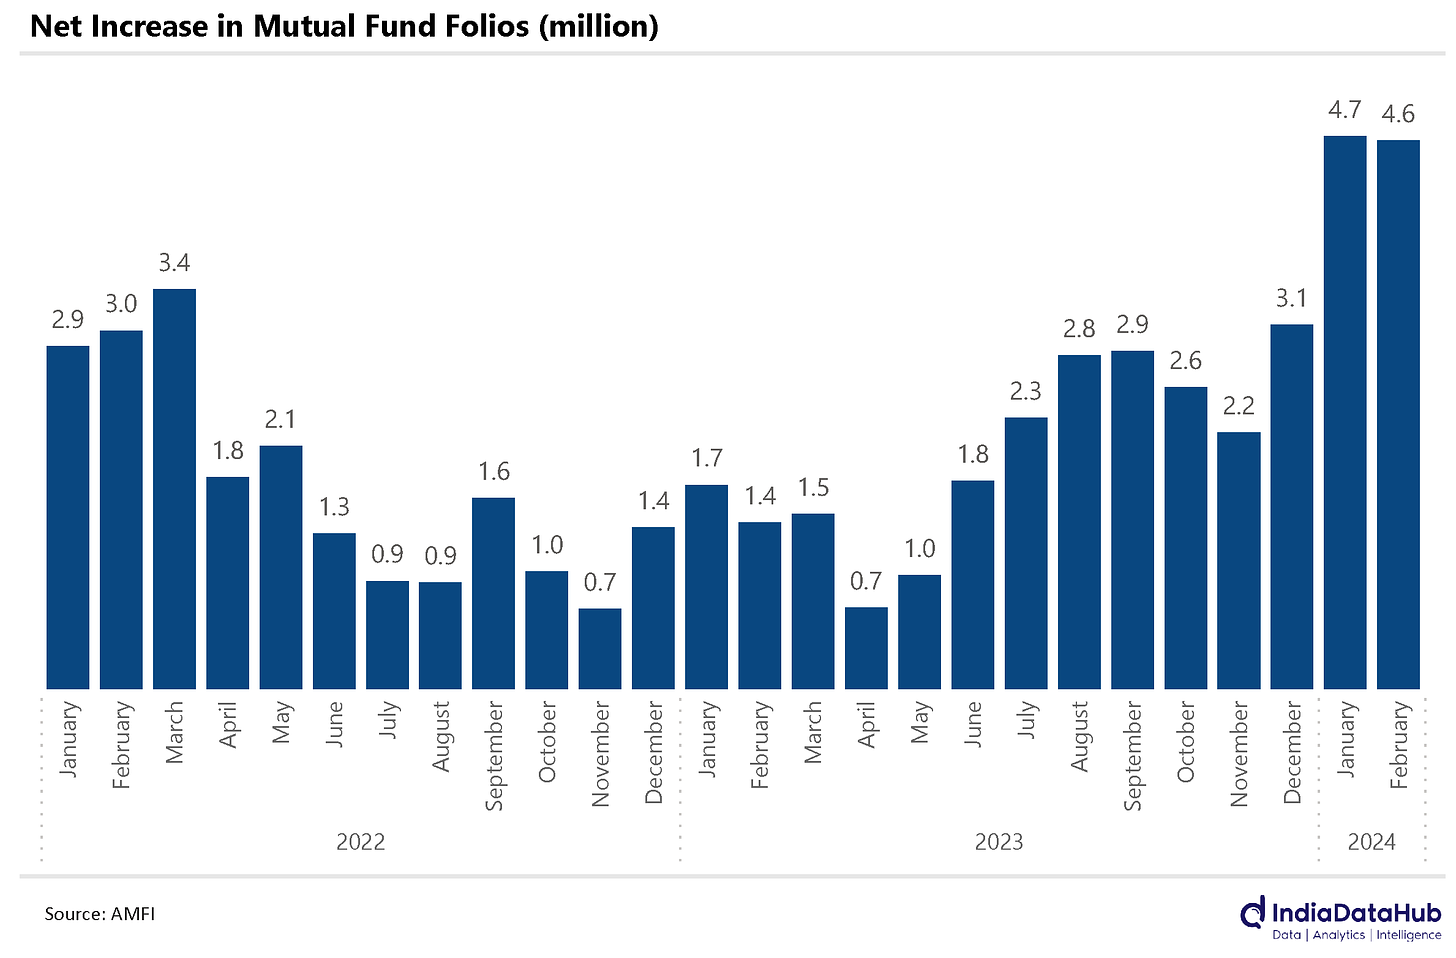
But that’s just half the story. It’s not simply that more money is coming into mutual funds – it’s also that more people are investing. This is the second straight month we’ve added more than 4.5 million folios.
What’s a.. folio?
What a bank account is to a bank, a folio is to a mutual fund.
All these weird words.
Weird words that make interesting points.
India added 30 million new folios in just the last twelve months. Think about it for a moment: 30 million new accounts. Many of those probably belong to new investors. If new Indian folio holders in the last year were their own country, they’d be as big as Nepal.
Indian investing, it seems, is growing deeper.
There’s good news from the United States, yet again.
Again!?
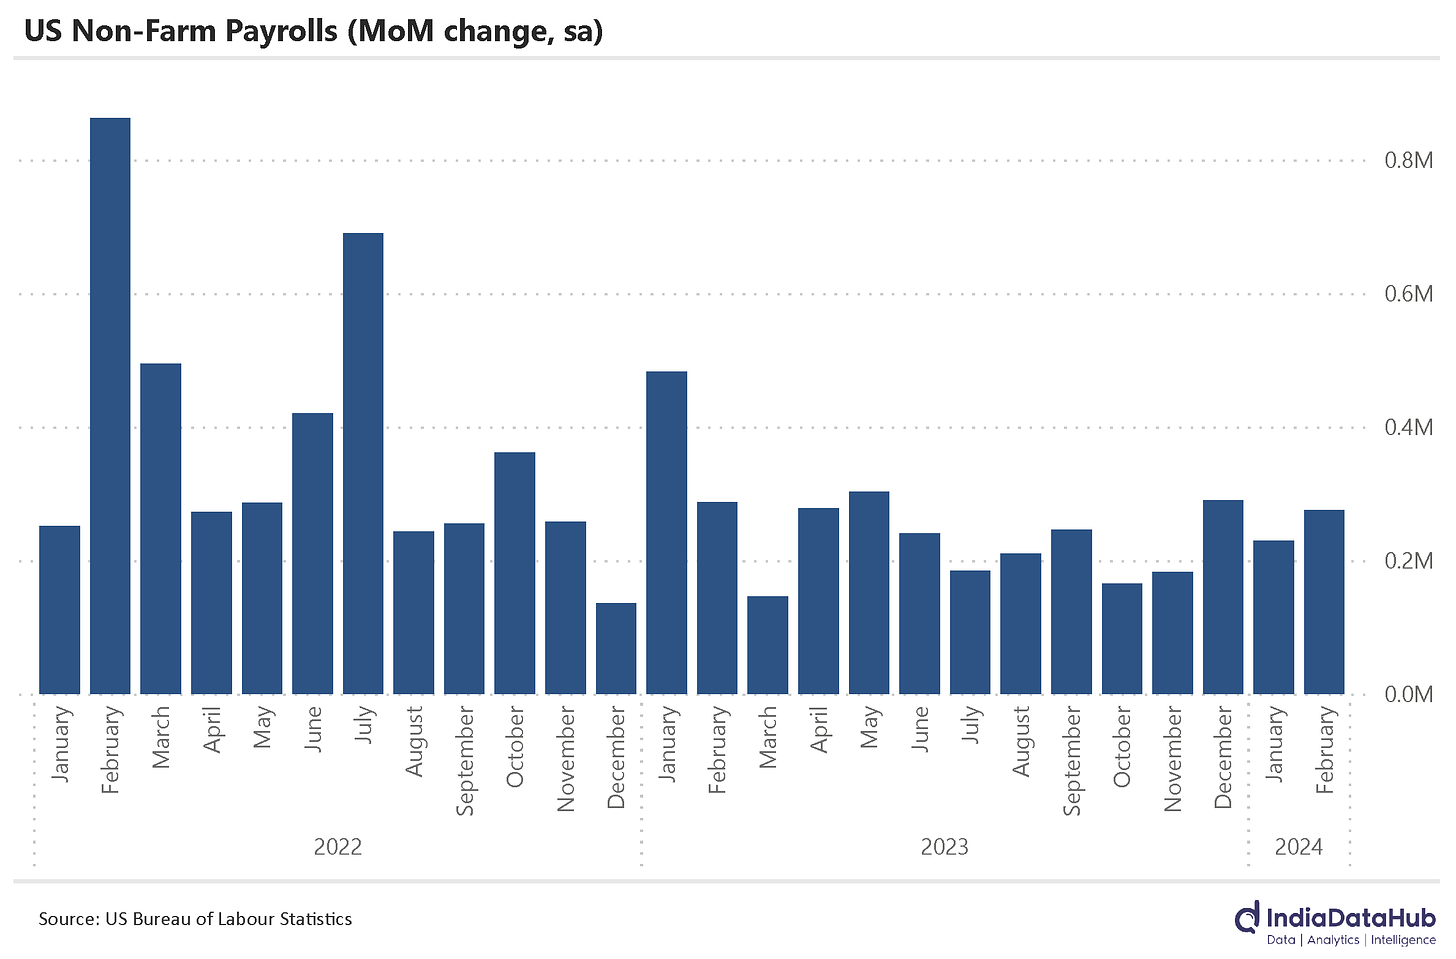
Yep. They added 275,000 jobs in February – much higher than the 200,000 that economists expected. To dampen the party, though, the Bureau of Labour Statistics revised its figures for the last two months by a total of 167,000 jobs.
Curiously, though, at the same time, the United State’s unemployment rate has increased to a two-year high of 3.9%, after sticking to 3.7% for three straight months.
More jobs and higher unemployment? That makes no sense?
Well, there could be many reasons that this is the case.
The biggest, though, is simply that payroll data and unemployment data comes from two different data sources. There could simply be a mismatch in what the two recorded.
Statistics are like lungis, after all.
There’s also some news from Europe.
Oh yeah, they seemed to be doing well on inflation last week! What’s up with them now?
Right, and they’re sticking the course. There are no moves on ECB rates. Here’s the run-down:
- Interest rate on main refinancing operations: 4.50%
- Interest rate on marginal lending facility: 4.75%
- Interest rate on deposit facility: 4.00%
That’s all for this week, folks. Thanks for reading!