
It’s the economy, stupid: Lower CPI, WPI, trade balance and more
We love India Data Hub’s weekly newsletter, ‘This Week in Data’, which neatly wraps up all major macroeconomic data stories for the week. We love it so much, in fact, that we’ve taken it upon ourselves to create a simple, digestible version of their newsletter for those of you that don’t like econ-speak. Think of us as a cover band, reproducing their ideas in our own style. Attribute all insights, here, to India Data Hub. All mistakes, of course, are our own.
Consumer inflation has come to a three-month low of 5.1% this January, compared to the preceding January. That is, the prices of consumer goods have increased by 5.1% through the year. The inflation was 5.7% back in December 2023.
Those are just random numbers to me. What’s really happening?
How do we measure trends in prices? There are hundreds of things you might want to buy. They’re sold by different people, all of whom think differently about the right price for their products. These pricing decisions come to you at random, divorced from each other. There’s no secret society of shopkeepers that forces everyone to set prices in unison. How, then, do we get a single number for inflation?
Well, we conjure up an imaginary ‘basket’ with most things you might want to buy. That’s almost 300 things – eggs, milk, kerosene, house rent, school fees, movie tickets, alcohol – all sorts of stuff. We compute the price of the entire basket to come to a ‘consumer price index’ (CPI). Changes in the CPI tell us how much inflation we’ve seen. For instance, if the price of this basket was ₹100 in January 2023 and rose to ₹104 in January 2024, the period in between saw inflation of 4%.
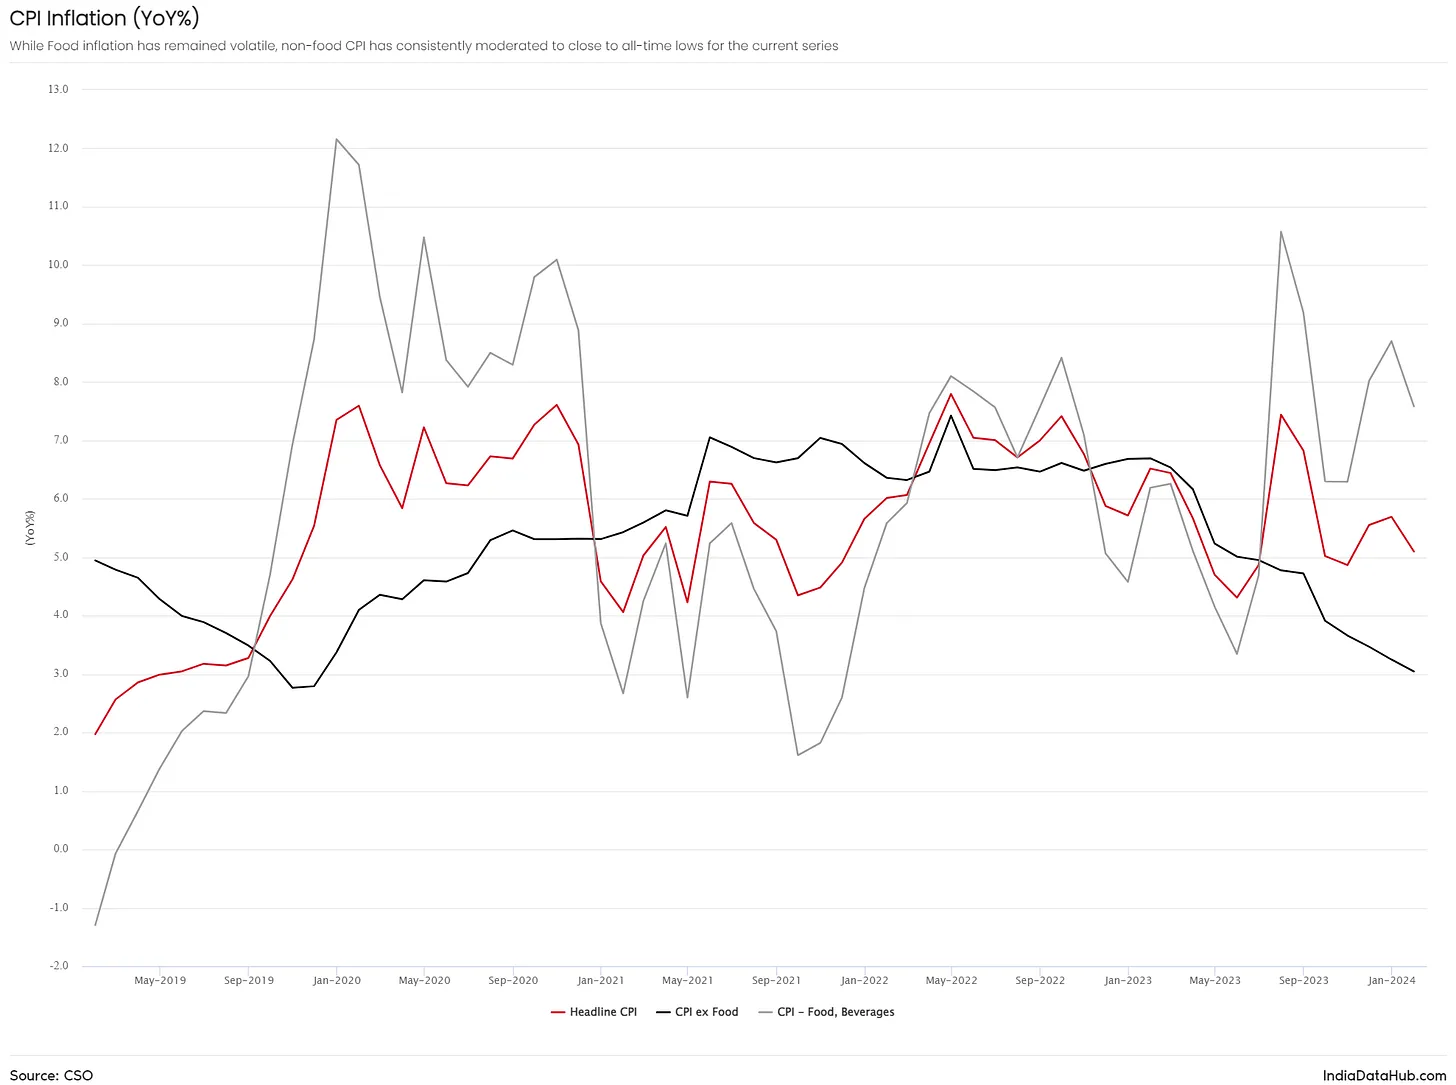
But there’s an obvious problem, here. If you’re trying to compress 300 prices into one number, there’s a lot that you’re glossing over. Over the last year or so, for instance, inflation has swung wildly in both directions. Zoom in, however, and you’ll notice that the CPI basket seems torn in two halves, both of which are moving very differently:
- Food has been deeply volatile. In some months, food prices have jumped up by as much as 10%. In others, they have risen by a tame 3%. This has given the year’s inflation figures most of their turbulence. Food inflation fell a little between December and January – from 8.7% to 7.6%.
- The prices of everything else, in comparison, have been fairly predictable. They’ve fallen gently through the last year, and in January, came to 3% – their lowest point in years.
Here’s how all three have behaved:
Ah. So, is this just how things stay? One half steadily drops while the other flutters at random?
Wellll… A little bit? We’re not sure.
Food prices are always volatile. It’s just harder for prices to stay stable when your business involves dealing with living things and weather gods. This will always make it difficult to forecast how food prices move.
But if we were to attempt a guess, the current trend is unlikely to continue for too long:
- There’s only so much that non-food inflation can drop. The lowest we’ve seen it go in quite a while was during a few months in 2019 when it hovered around 2.8%. It’s unlikely to go much lower than that.
- Food prices, on the other hand, have been growing faster than average. There’s some room for things to slow down. If they do, overall inflation will go down further. By how much? Well, food makes for roughly half the CPI basket. If there’s a fall in food prices, the CPI will fall by half as much.
For inflation to drop further, hope for food prices to come under control. If core inflation sticks where it is but food inflation drops down to the ballpark of 5.4%, we’ll hit our target of 4% inflation.
When people think about ‘inflation’, they’re generally thinking about the price a consumer must pay.
But you can also look at price rises from the perspective of what sellers have to pay. Like the CPI, you can put together an imaginary basket of the things that are sold in bulk to businesses, and track how the price of this basket changes. This is the ‘Wholesale Price Index’ (WPI).
That sounds… important? Why don’t we look at this more intently when thinking of prices?
We do. But it’s not as useful as the CPI, because we have much less control over it.
The RBI used to consider this a crucial data point till 2016. There was a problem, though. In practice, the WPI strongly mimicked the prices of commodities.
Hey! HEY! You can’t just throw jargon at me like that!
Yes, of course. My bad. I’ll explain. Commodities are things which are so standardised that you don’t care who made them.
Imagine: you’re standing by an open drain, holding a pack of these cookies that you love. I’m nearby, strolling about absent-mindedly, and I walk right into you. The cookies are whacked out of your hand, and before you can react, they fall into the drain. I apologise. You’re still mad. While you’re wondering how hard to slap me, I offer to replace them with a packet of biscuits that I have lying in my bag. Would you accept? Would you see this as fair? At least not immediately. You’ll have questions. You’ll probably want to know the brand of biscuit, and whether they’re the type you like. If you lost a pack of rich, decadent, artisanal cookies and I tried giving you some cheap glucose biscuits instead, you’re not going to be too happy.
Reset. Imagine the same sequence of events, but you’re standing with a can of petrol. Or a bar of iron. If I gave you the same amount of iron or petrol to compensate, would it really bother you? Unlikely. If whatever I gave you was of decent quality, you wouldn’t care too much.
See, while two brands of biscuits can be very different, a bar of iron is like any other bar of iron. Iron, therefore, is a commodity.
Because all bars of iron are alike, it’s relatively easy to buy one. You don’t have to go meet suppliers, or look through catalogues, or sample their iron, or check whether it is the flavour of iron you like. Iron is iron. If someone will sell you some, you buy it without thinking too hard. This allows iron to be sold in bulk, in giant, world-wide exchanges for a standard price. As long as there’s some quality control in place, you needn’t care where or whom you’re getting it from. You can trust it.
Hmm, coooookies... Wait, what were you saying?
Hrmphh.
Commodities are sold in giant, worldwide exchanges, for standard prices. Some indices track these prices, such as the World Bank’s commodity price index.
The WPI mirrors this index heavily. There’s a 90% match between the two, in fact. That makes sense, too. Commodities are usually the raw material that people use to make the things they sell. Here’s how closely the two are linked:
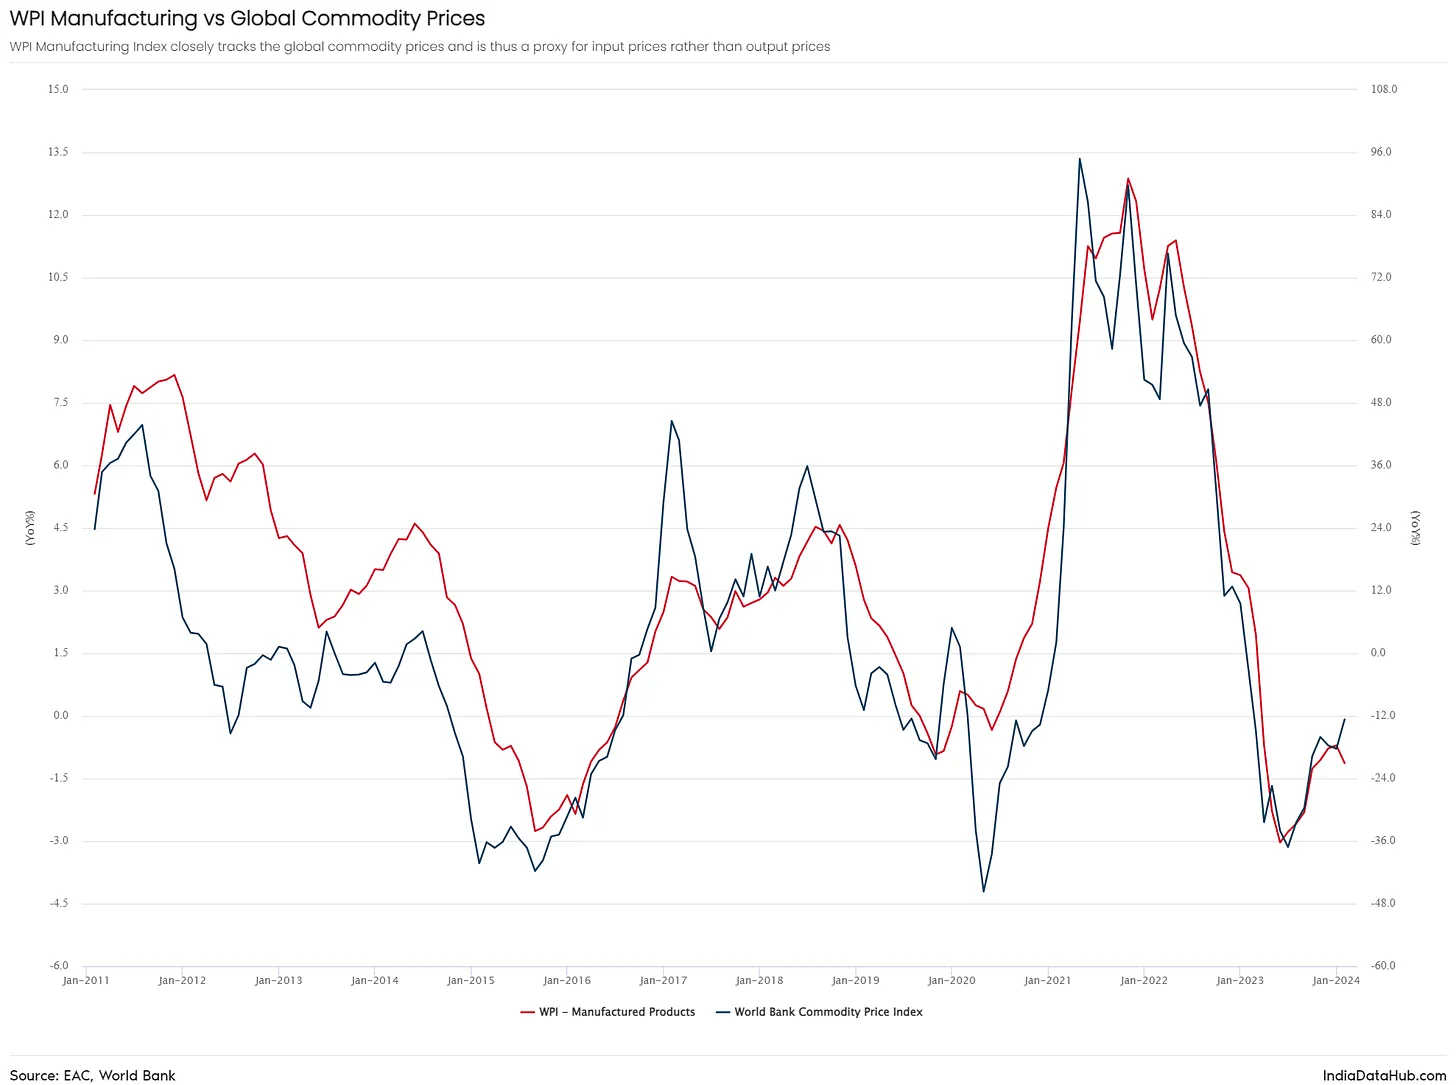
But this strong correlation makes the WPI a pointless input for policy-making. There’s a point to tracking inflation when you can actually do something about it. If the WPI mirrors global commodity prices, India has very little control over where it goes. It tells us how bad sellers have it, but little else.
Got it. So it’s just information for information’s sake.
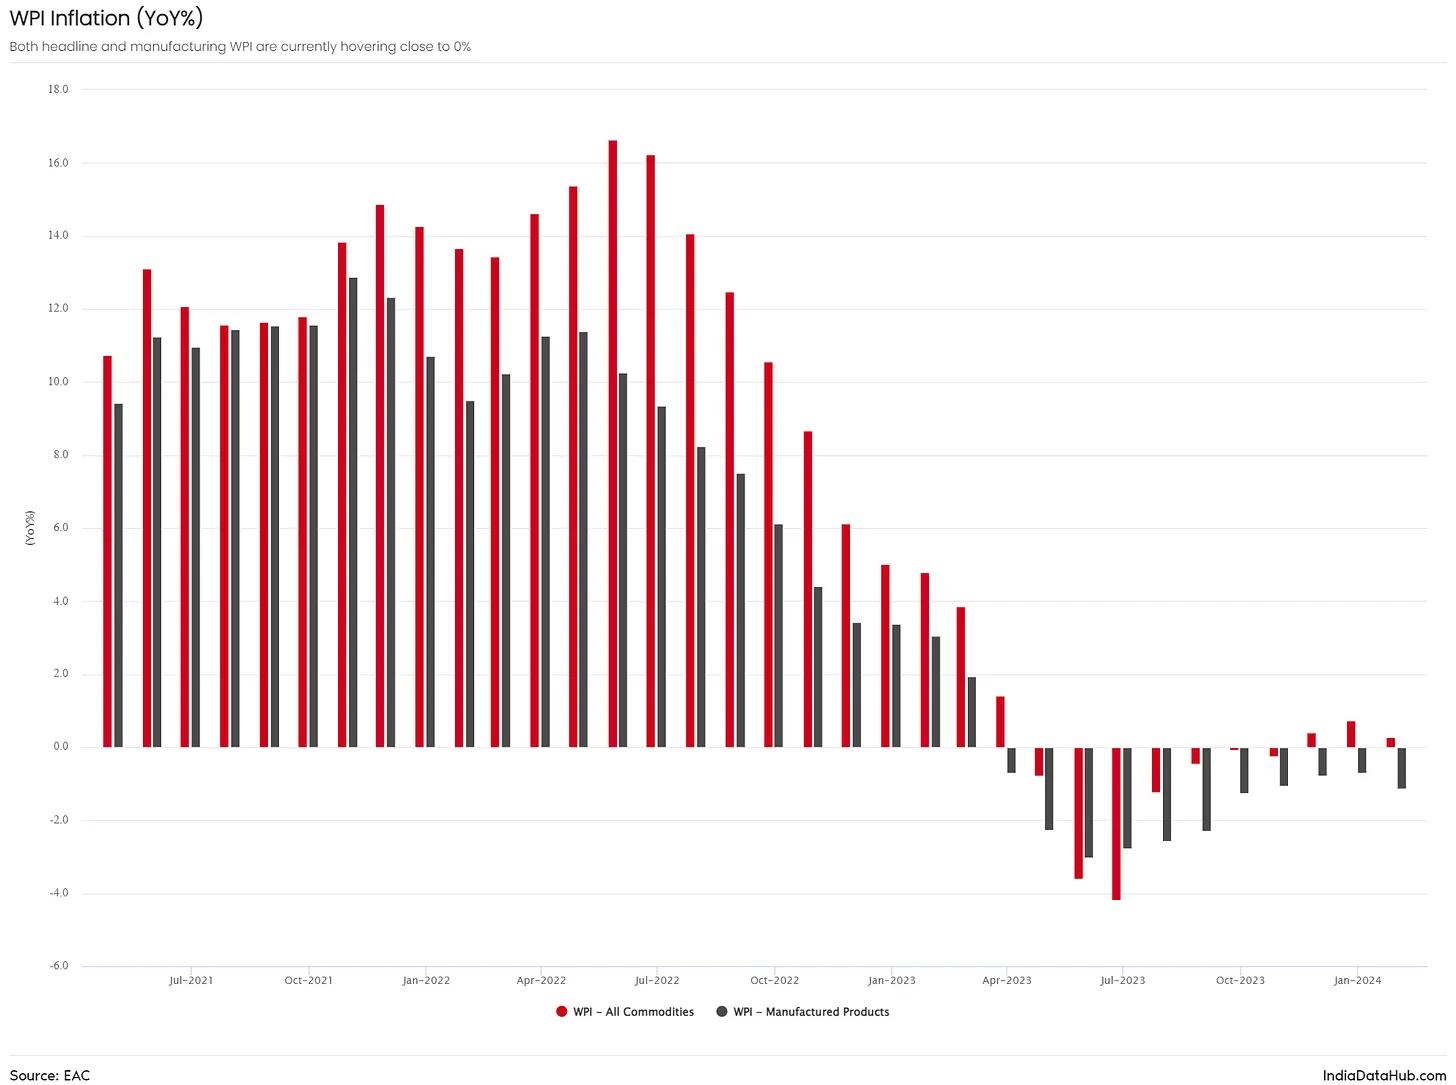
With one caveat. The WPI does give us an inkling of where the CPI will go. What sellers pay today, buyers will pay tomorrow.
There’s some good news on this front. There’s been no wholesale inflation for a few months. The price of manufactured products, too, has hardly moved. Because things look good for producers, one can hope that things stay good for consumers too.
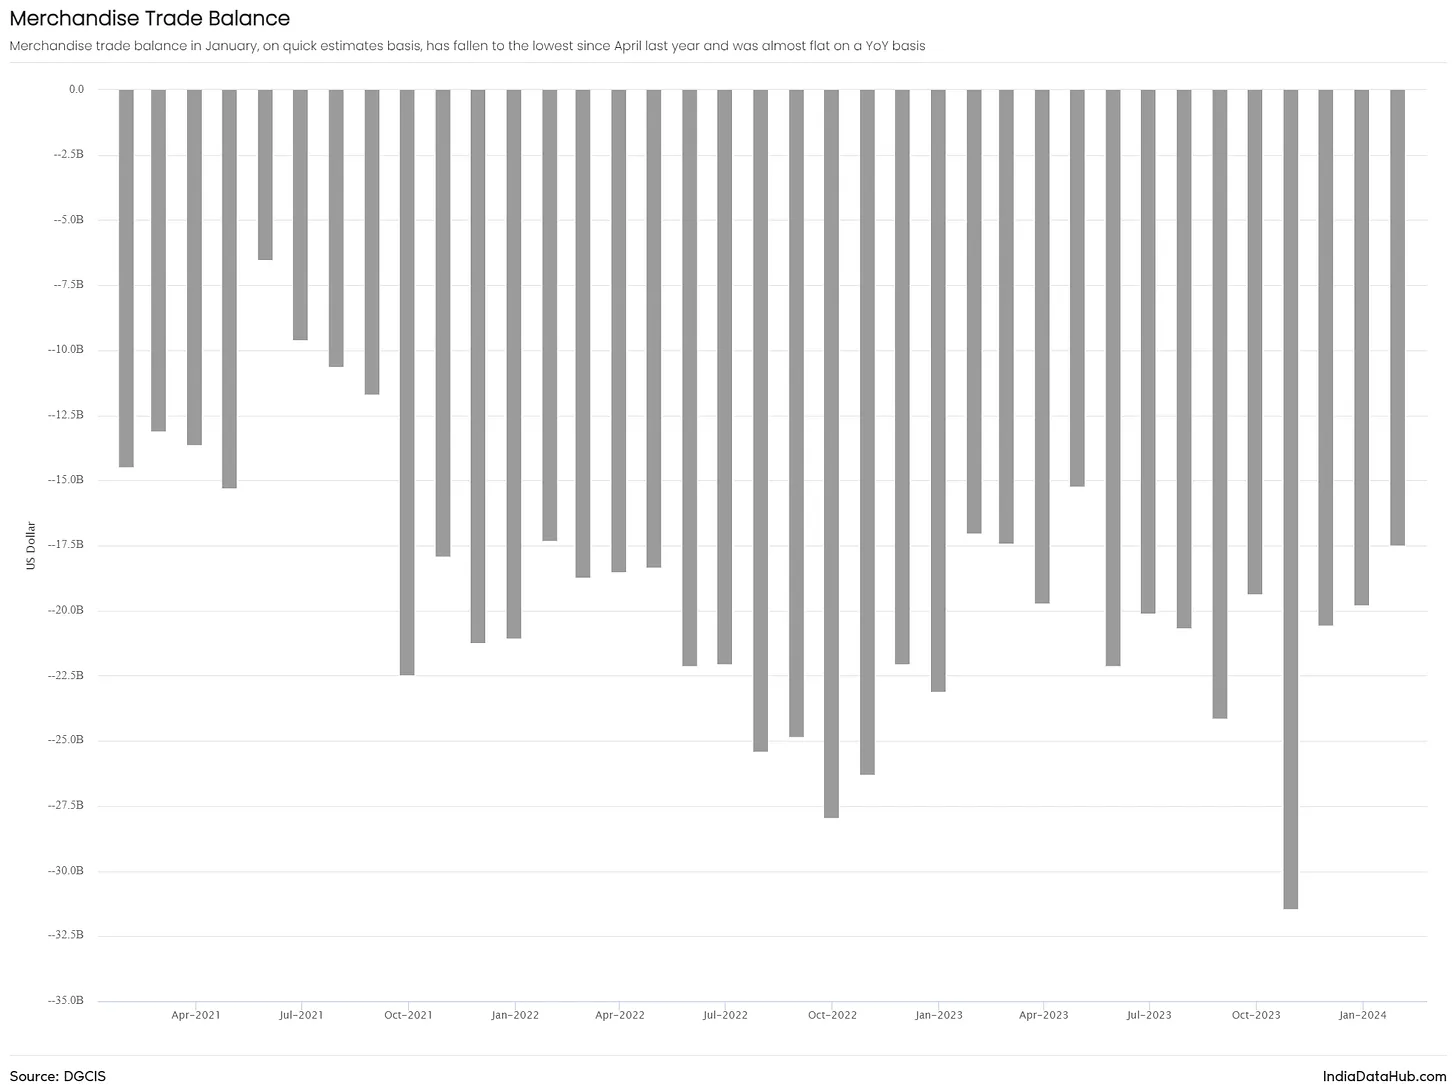
India’s international trade inched upwards last month. Both imports and exports this January, compared to the last, have grown by 3%.
We usually import more than we export. But the difference between the two – our trade deficit – went down this January to US$ 17.5 billion. This is roughly where it was last January. It hasn’t been this low since last April. Here’s how our trade deficit has looked over the last few years:
The Rupee, as a result, will stay strong.
Huh? Why? That’s a bit of a leap.
See, Indians deal in Rupees. Think of what happens to our Rupees when we import or export something.
- When an Indian exports something to someone abroad, that money reaches their bank account in Rupees. The buyer, of course, pays in a foreign currency. That foreign currency, however, is sold in international markets, and Rupees are bought for it.
- When an Indian imports something from abroad, the opposite happens. They pay in Rupees. Those Rupees are sold in exchange for the seller’s currency.
When our imports cross our exports, overall, more Rupees are being sold than are being bought. By how much? That amount is our trade deficit.
When our trade deficit is low, fewer Rupees are being sold. The supply for Rupees, therefore, is lower. The Rupee is more scarce in foreign markets, and therefore, is higher in value.
Uh, sure. Carry on.
A few quick pointers on our exports:
- Our exports have grown, in large part, because we’re exporting far more electronics. That said, at the start of last year, our electronics exports were exploding, and were 40-50% higher than the year before. That growth has dropped to around 9% this January.
- We also saw some growth in our exports of engineering goods, pharmaceuticals and iron ore.
Some points on our imports:
- Our electronics imports have increased massively. Compared to last January, our imports shot up by 25% last month.
- Gold imports have doubled compared to last year.
- Our coal imports were a fifth higher than last January.
- Our imports of machinery, on the other hand, have declined.
Last week, we talked about inflation in the US, and how the US Fed may react. There’s a little more on that front, now.
Oh. What are they up to?
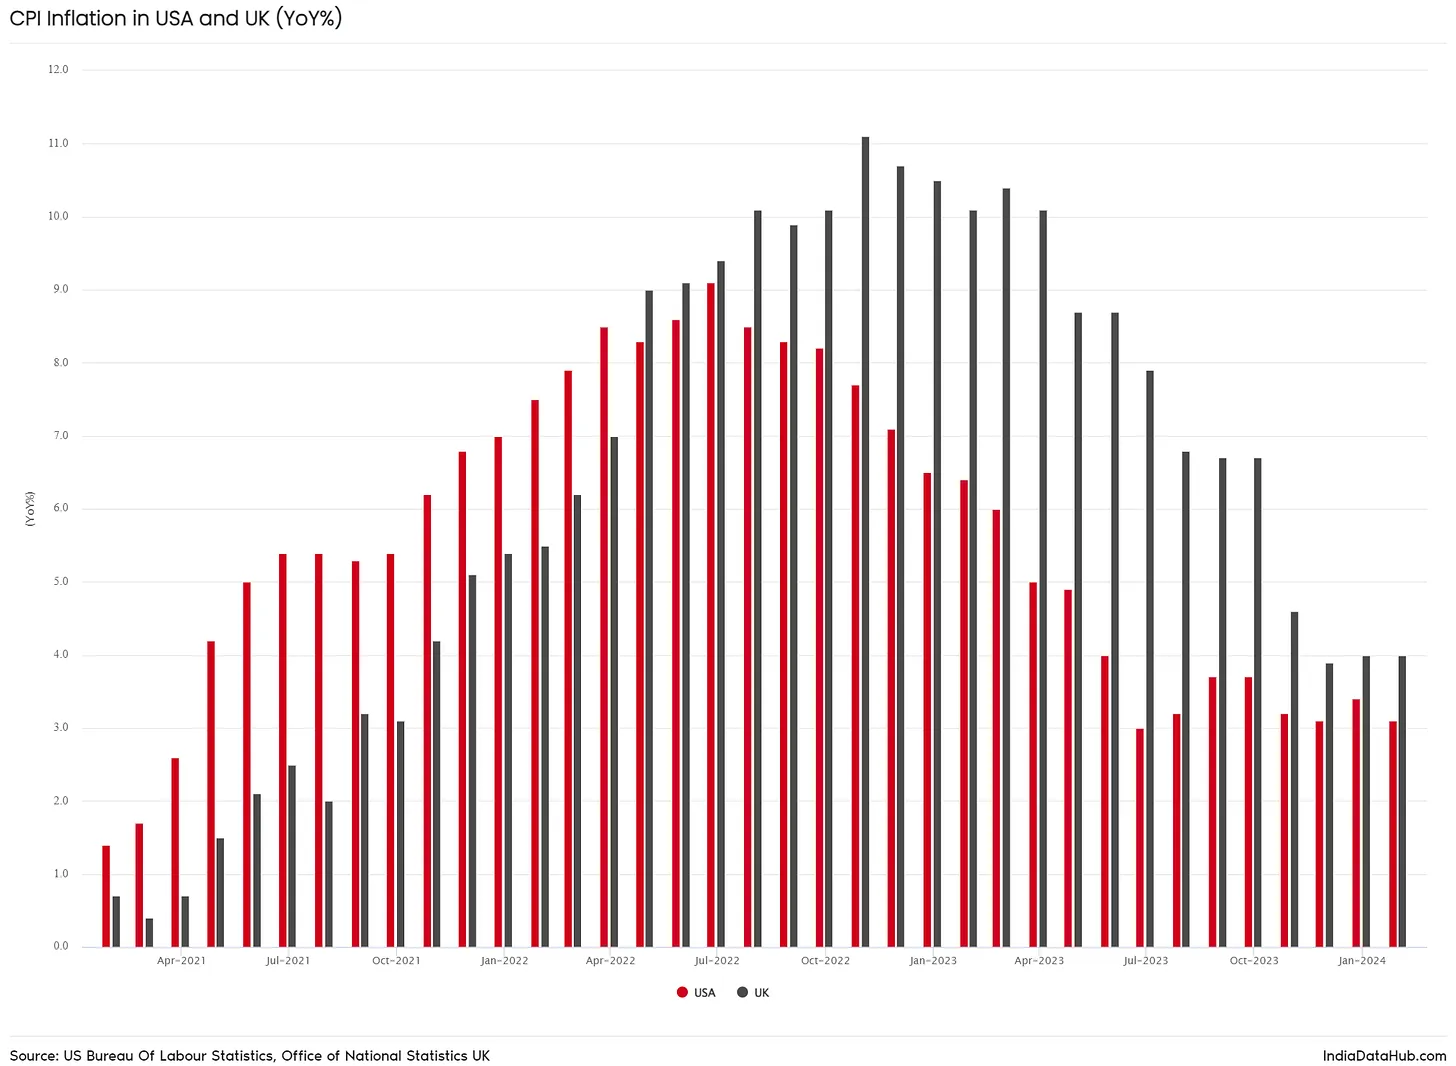
The US CPI fell by 0.3% in January, dropping to 3.1%. This is good and bad news.
The good news: this is well below where US inflation was in early 2023. The bad news: US inflation has now hovered around 3% for over half a year, and is refusing to give way any further. It hasn’t fallen below 3% since March 2021.
There’s similar news from the UK, where inflation is stuck around the 4% mark. This chart should give you a sense of things:
Does this matter to India at all?
It does, it does.
Last week, we saw how US inflation and monetary policy impacts monetary policy in India. Look here for details. But in a nutshell: when the US Fed restricts dollars from entering the economy, it is harder for the RBI to fight inflation.
Because inflation has been stubborn in the US, the US Fed is unlikely to cut interest rates in the near future. This will push the RBI to keep its rates high, even though inflation is coming under control at home.