
It’s the economy, stupid! Sticky inflation, zooming forex and more
We love India Data Hub’s weekly newsletter, ‘This Week in Data’, which neatly wraps up all major macroeconomic data stories for the week. We love it so much, in fact, that we’ve taken it upon ourselves to create a simple, digestible version of their newsletter for those of you that don’t like econ-speak. Think of us as a cover band, reproducing their ideas in our own style. Attribute all insights, here, to India Data Hub. All mistakes, of course, are our own.
Some new inflation data has come in. Before that, do you remember what we went through last month?
Uhh. Things were… No. No clue.
Sigh, a thankless job, this. Check out this post for the details. But we’ll do a quick recap anyway.
To measure inflation – or changes in price – you look at a “consumer price index”. From last month:
“Well, we conjure up an imaginary ‘basket’ with most things you might want to buy. That’s almost 300 things – eggs, milk, kerosene, house rent, school fees, movie tickets, alcohol – all sorts of stuff. We compute the price of the entire basket to come to a ‘consumer price index’ (CPI). Changes in the CPI tell us how much inflation we’ve seen. For instance, if the price of this basket was ₹100 in January 2023 and rose to ₹104 in January 2024, the period in between saw inflation of 4%.”
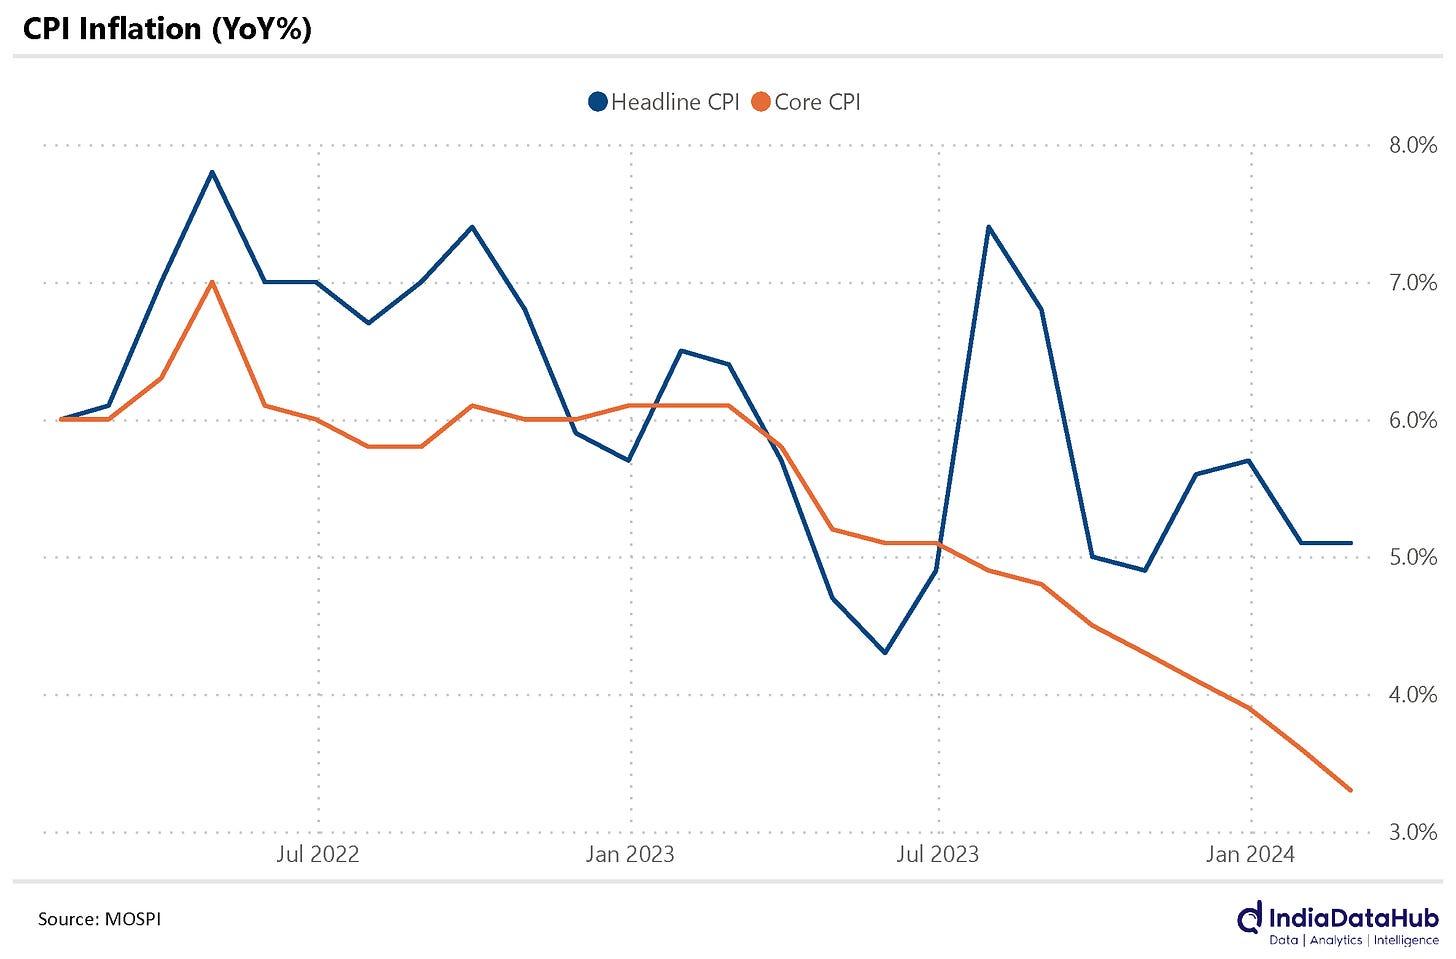
Measured this way, in January, inflation had come to a three-month low of 5.1%. It hasn’t budged in February. It’s been floating around or above 5% for the better part of a year.
Why is it so? Well, there’s more to drill into.
Let me guess… Something about inflation having different parts?
That’s… not bad! Yes. Exactly that. Returning to last week:
“…the CPI basket seems torn in two halves, both of which are moving very differently:
-
- Food has been deeply volatile. In some months, food prices have jumped up by as much as 10%. In others, they have risen by a tame 3%. This has given the year’s inflation figures most of their turbulence. Food inflation fell a little between December and January – from 8.7% to 7.6%.
- The prices of everything else, in comparison, have been fairly predictable. They’ve fallen gently through the last year, and in January, came to 3% – their lowest point in years.”
It’s the same story for February. Food inflation has remained high – at roughly 8%. The prices of other things, however, have only increased by 3% since last year. That’s slower than we have seen in a while.
Of everything one might want to buy, the prices of food are perhaps the hardest to predict. Weather, soil health, water, pests, diseases, spoilage… there are simply too many variables to account for. And it’s food prices that have made the job of taming inflation so frustrating.
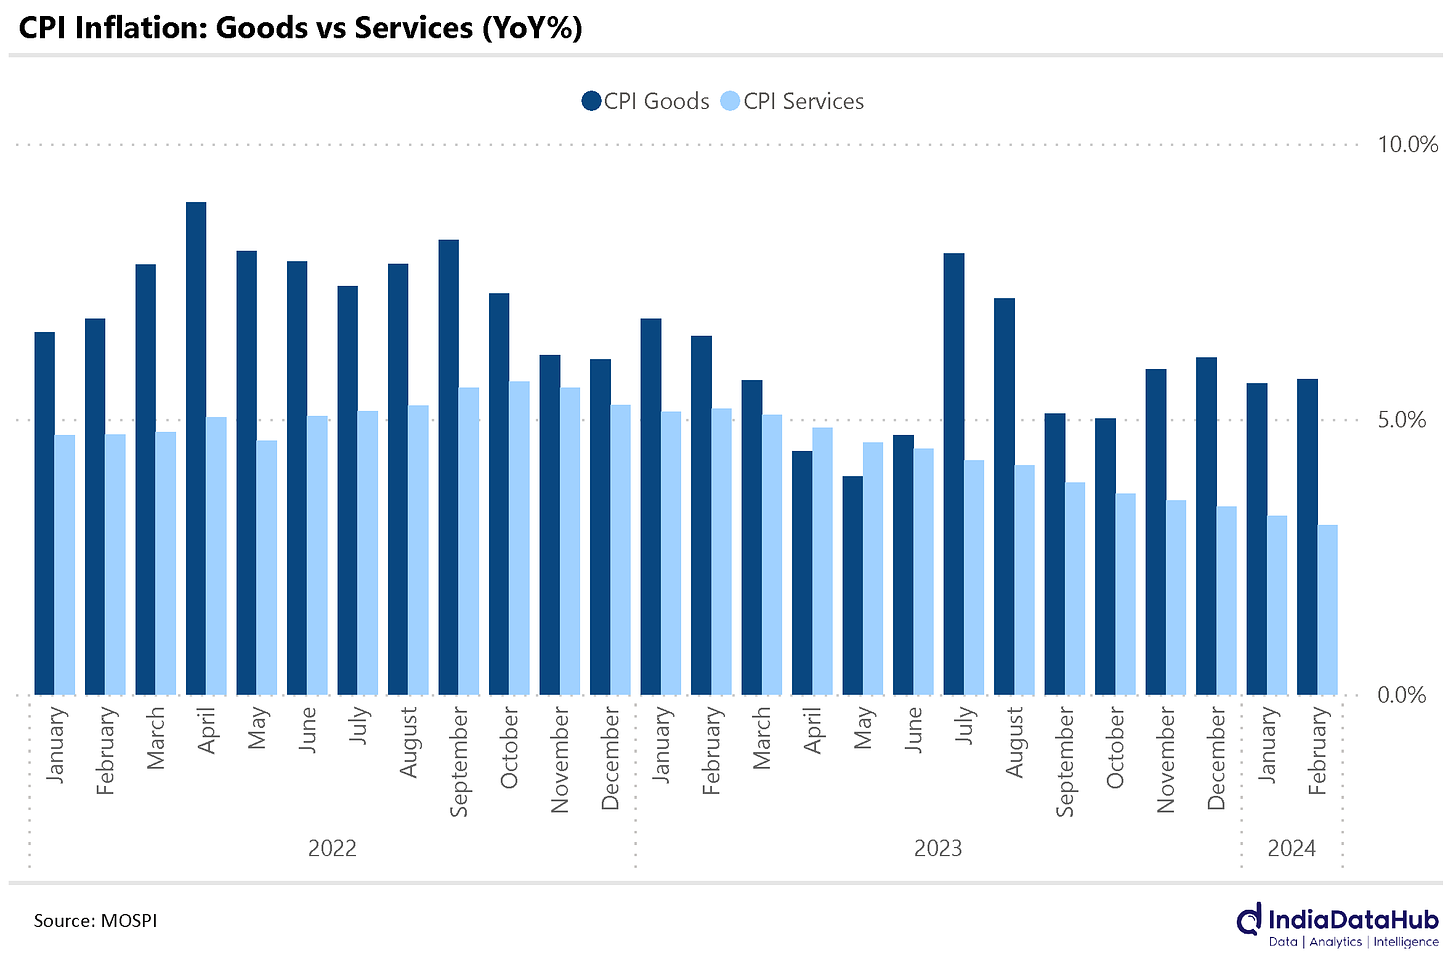
There’s another way to slice the inflation basket: you can divide it between goods and services:
- This February, services inflation was at 3.1% against February last year. That’s the lowest we’ve ever seen in our current series. In ten years, that is! By and large, services are performed by people. Their wages make up the biggest chunk of services inflation. When services inflation hits a ten-year low, it means that wage costs aren’t too high.
- In contrast, goods inflation stayed at a fairly high 5.5% in February. But when you look at goods other than food, it’s only at 2.7%, the lowest in years. Once again, food is driving up our prices.
Rural wages are growing at a mild, gentle pace. In January, they grew by 6% against January last year.
Is that a good number? I have no idea.
Understandable. But we just talked about something that’s a decent benchmark.
Inflation?
Precisely! The amount wages grew by, in isolation, is rather useless information. What you really want to know is whether wages can buy more things. As wages grow, things are becoming more expensive as well. So, the real question is: are wages rising faster than the prices of goods?
For this month, they are, even if only by a little bit.
Look at the chart below for a better sense of things. The graph on the left, below, tells you how much wages have moved up as a whole. The one on the right adjusts this amount for the inflation that took place at the same time.
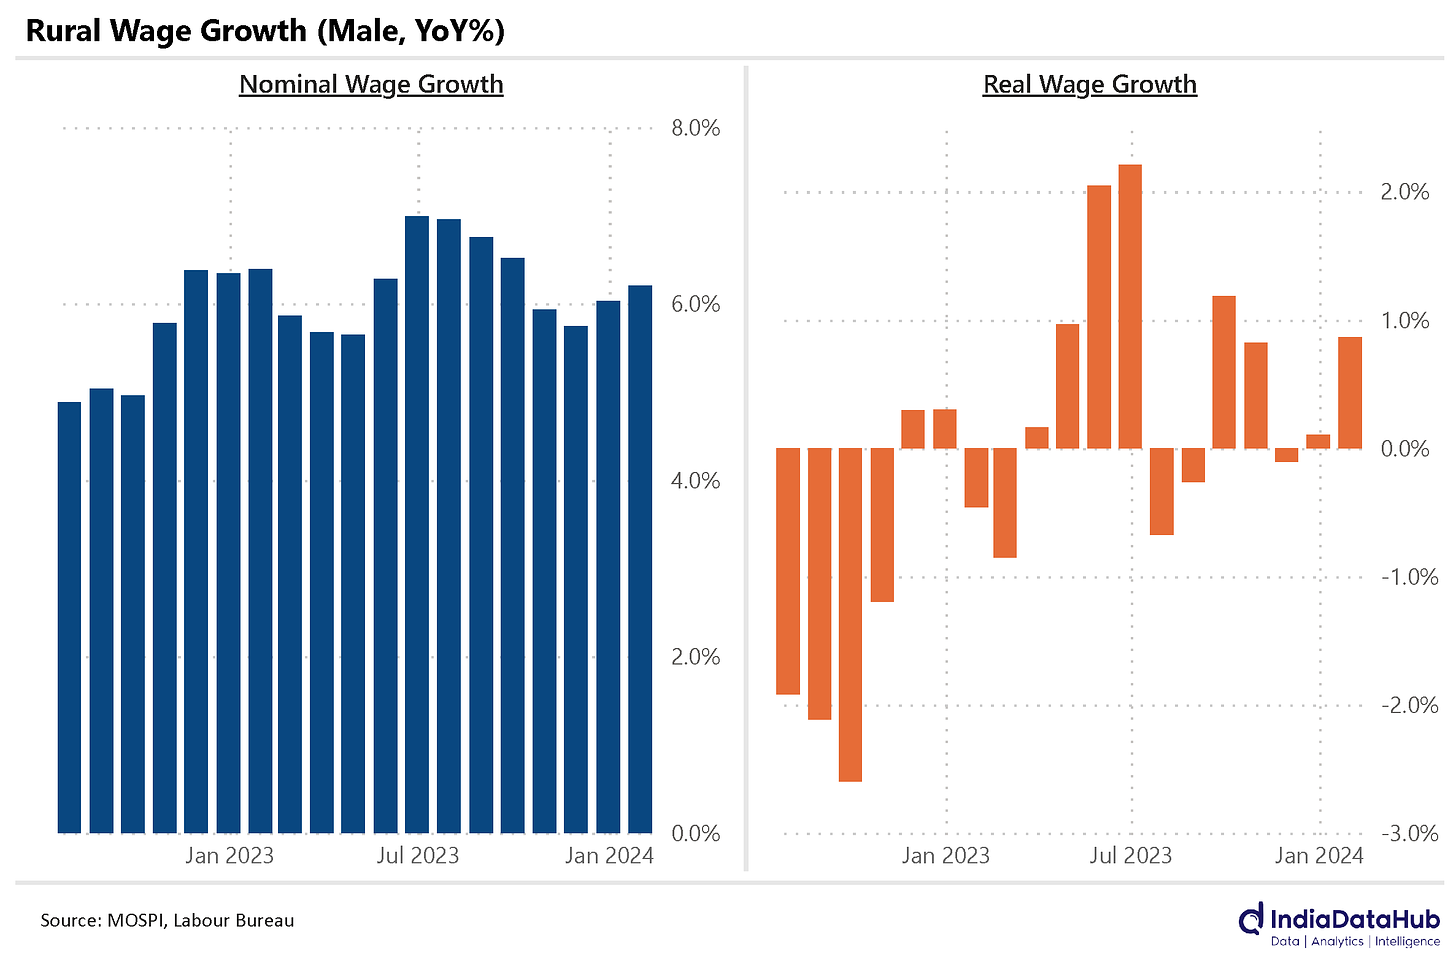
This gentle rate of growth confirms what we talked about before: wages, in themselves, aren’t pushing up prices very much, for now.
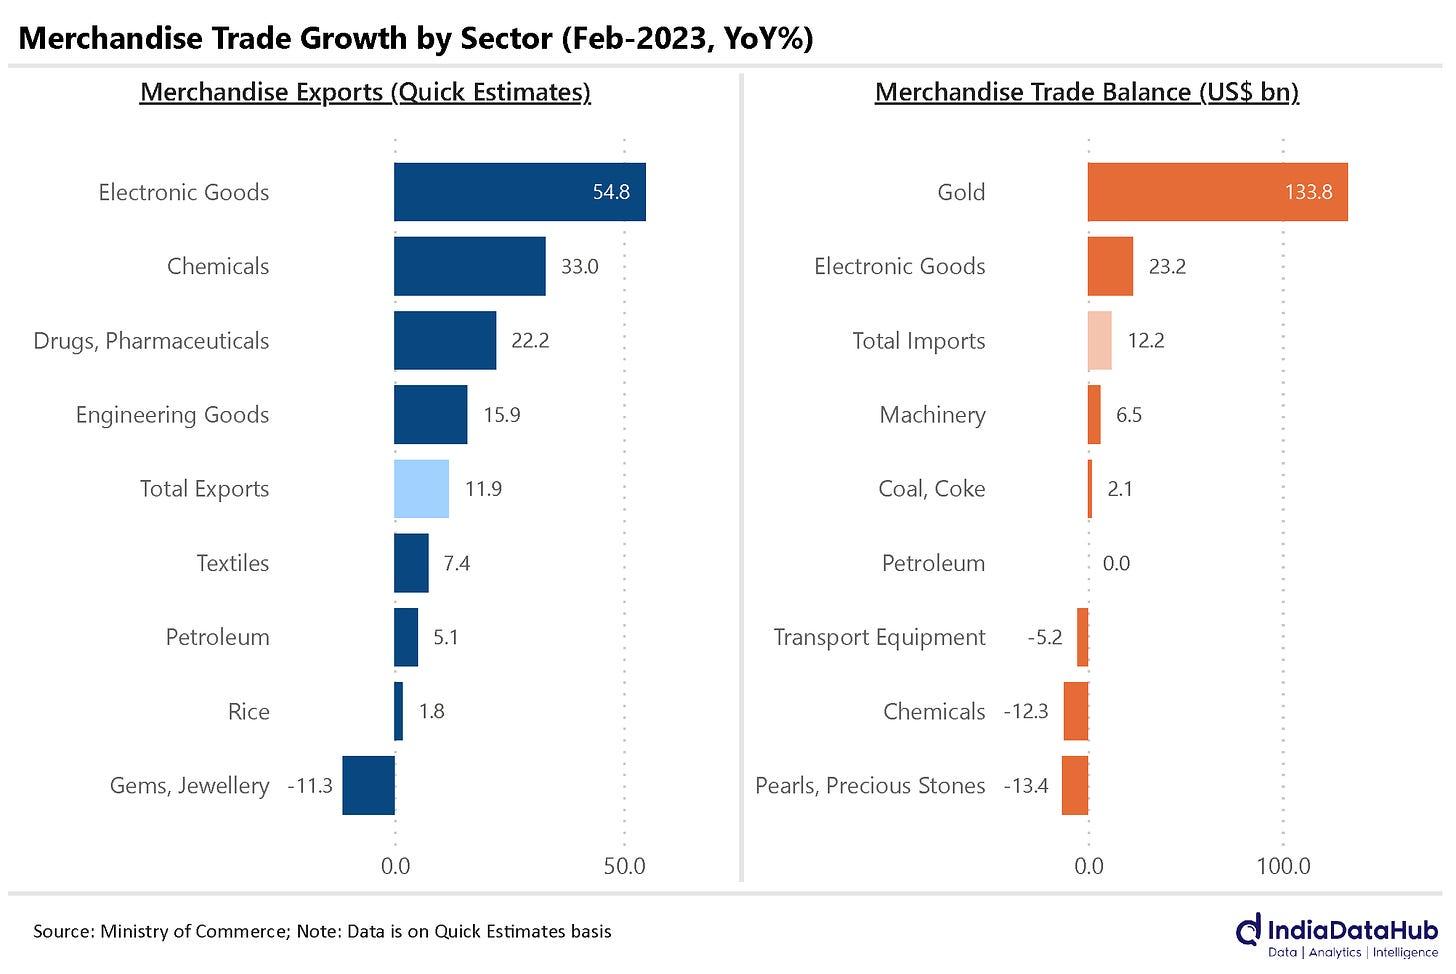
Last week, we looked at our trade balance in services. This time around, we have data on our goods trade balance.
Any surprises?
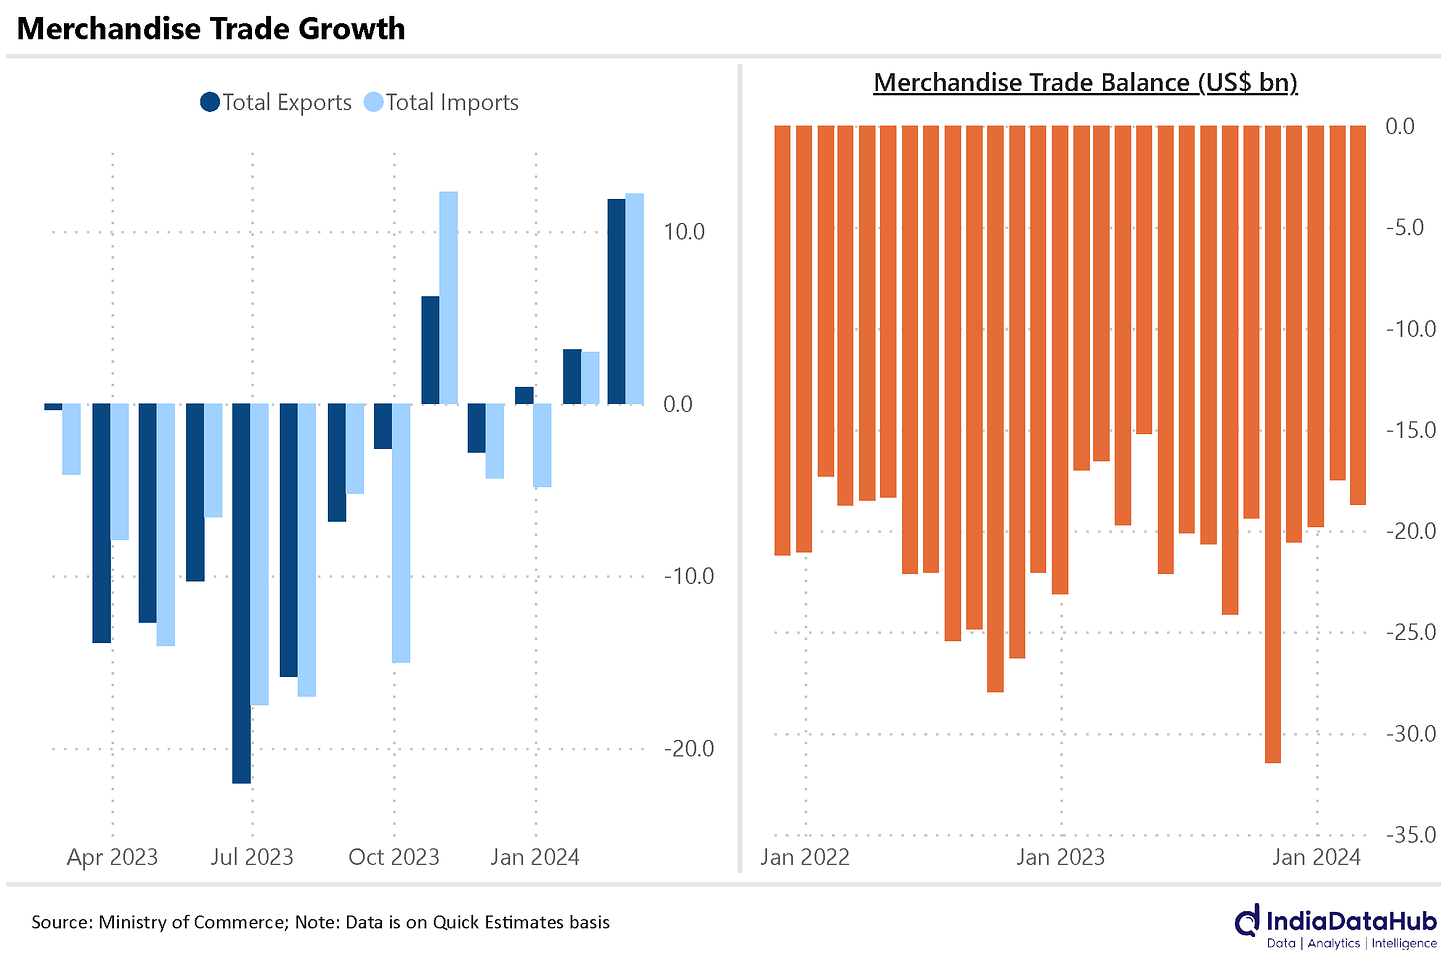
None. Imports went up. Exports went up. Both by 12%. Everything’s hunky dory. Some of this increase has to do with February’s extra day, given that this is a leap year. There’s more on that in last week’s edition.
For the third straight month, our merchandise trade deficit – that is, how much our goods imports exceed our exports – is under US$ 20 billion. Last week, we saw how our trade surplus in services was around the same ball-park. On the whole, we spent about as much money as we earned last month. Perhaps that’s a surprise!
What do we spend on? And how do we earn?
Let’s put down a few quick pointers:
- Electronics were a big part of our export growth – jumping up by 50% from last February, Chemicals and pharmaceuticals, too, did well – growing by 30% and 20% respectively.
- A lot of what the additional imports we made this year were for ordinary people to use, rather than for industry. Gold imports doubled over last February. Electronics, meanwhile, grew by 20%.
This chart should give you some sense of the numbers.
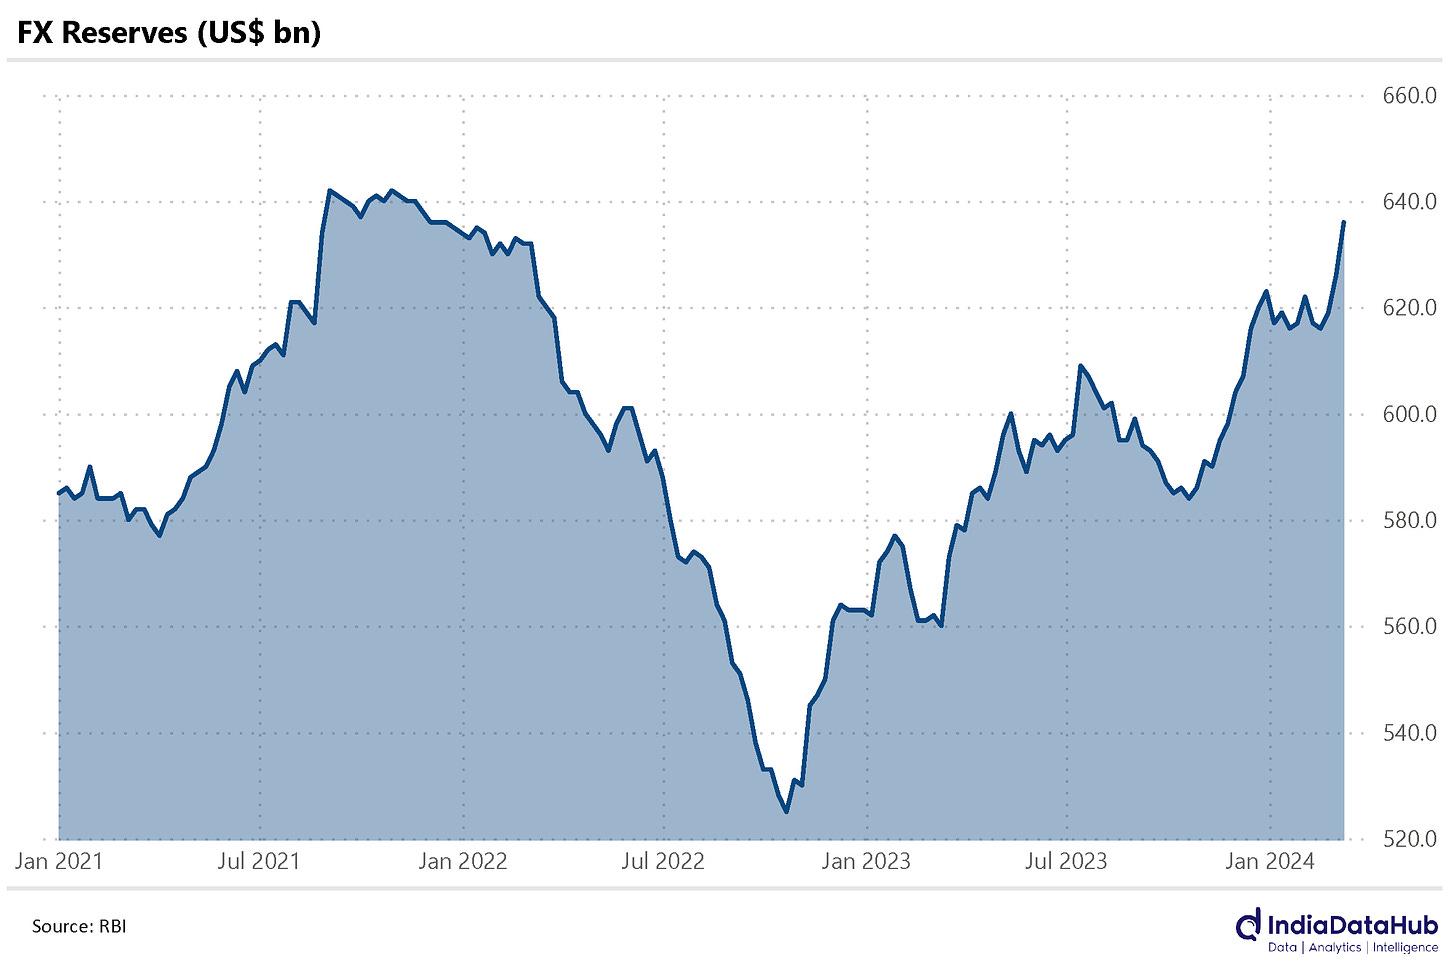
India’s foreign exchange reserves are rising sharply. In the last week of February, they shot up by US$ 6 billion. And then, in the subsequent week, they went up another US$ 10 billion. By March 8, it was at US$ 636 billion. For context, the highest it’s ever been was US$ 642 billion, back in September 2021.
I know I’m supposed to be impressed. And that’s a very impressive number, no doubt. But I don’t get it. Why must we hoard other countries’ currency?
A country’s ‘foreign exchange reserves’ work a little like its savings. Like your personal savings, these reserves can have many uses.
The country can use them to buy its own currency in international markets, to make its value go up. It can use them to pay off debts. If things go seriously wrong, it can use them to import essentials. They don’t have a single, defined purpose – they help a country ride out any monetary shocks it would otherwise face.
Ahh. What do our savings amount to?
They’ll keep us comfortable, for sure. Even in a worst case scenario, they’ll buy us 11 months worth of our imports. That’s 11 months we can survive if our economy were to suddenly break down for some reason.
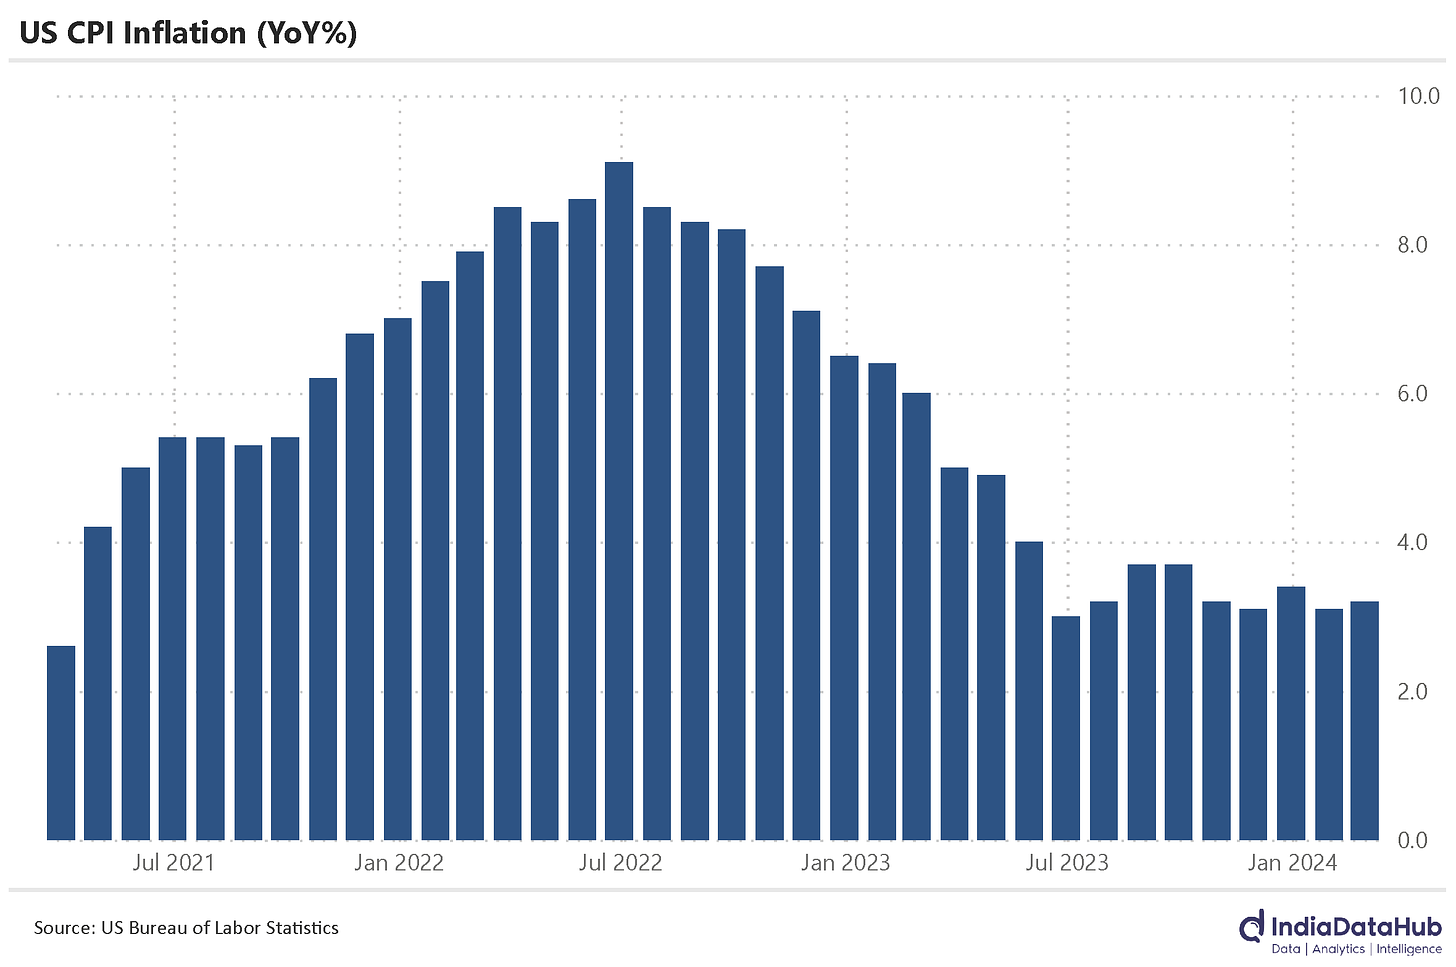
Last month, we’d also spoken of how inflation in the United States has refused to break below 3%, forcing the US Fed to keep interest rates high.
So? Has it come down finally?
No. To the contrary, it’s gone up marginally – it’s now at 3.2%.
Wow.
Yeah! Some pointers:
- Manufacturers have actually seen things get slightly more costly than they were in January – with prices edging up by 1.6%, compared to 1% in the previous month. To be fair, though, that’s well lower than the 4.7% increase they had seen this time last year.
- The least volatile parts of what manufacturers are buying – the “core” inputs – have risen by 2.2% since last year – which is the same as it was in January.
 But that’s the US. Closer home, Indonesia is in a rough patch.
How bad is it?
Quite so. Their exports have dropped for nine straight months. In February, their exports were 9.4% lower than they were last year. That, too, was after some cushioning from selling commodities like oil and gas. Keep them aside, and exports actually shrunk by 10.2%.
Meanwhile, their imports have jumped up too, by 15.8%. Indonesia used to have a pretty neat trade surplus – amounting to US$ 5.4 billion in February 2023. This February, though, this had fallen dramatically, to just US$ 0.9 billion.
What’s keeping them back?
Well, China’s economic misfortunes could be one answer. The country is Indonesia’s biggest trade partner – and usually makes up a quarter of all its international trade. But now that China isn’t doing too well, Indonesia is feeling the pinch. Indonesia’s exports to the country fell by 19.4% in just the last year.
That’s all we have for the week. Thanks for reading!