5.1 – Futures Calendar spread
All else equal, the futures contract is always supposed to trade at a premium to the spot. This, as we know, can be attributed to the interest rate factor (cost of carrying) in the Futures pricing formula. We have discussed this earlier in the Futures module. Any variation in this equation leads to an arbitrage opportunity.
For a quick low-level recap on that, consider this scenario where there is arbitrage opportunity between Spot and Futures –
Futures trade at a lower price – Assume the spot price is at 100, and the fair value of its future is at 105. The fair value of the future can be calculated using the futures pricing formula. The ‘no-arbitrage spread’ is the difference between spot and Future’s fair value, i.e. 105 – 100 = 5
Given this, for whatever reasons (read as market mispricing) assume the future is trading at 98, this leads to a spread of 7 (105-98) between the spot and future, which can be captured.

All one has to do is buy the future at 98, and simultaneously sell the spot at 100. We know upon expiry, the futures and the spot will converge, and therefore the spread gets captured.
If you are unable to understand the above clearly, I will encourage you to read the chapter from the Futures module (link posted above).
Likewise, if the futures trade at a higher price (over and above its fair value), then one can capture the spread by selling the futures and buying the spot.
We have learnt this before, and this is quite straight forward. However, when it comes to the USDINR contract, for practical reasons such as arbitrage trades involving spot and futures cannot be executed. This is because the USDINR spot market is not really accessible to the retail.
So how does one trade the spreads in the currency segment? Well, this is fairly easy – as opposed to spot-future spread, one has to identify the spread between two different futures contracts expiring over two different dates. This is also known as the ‘Calendar Spread’.
In a calendar spread, you decide whether the spread between two futures contract is considered normal or otherwise. All else equal, the long-dated futures contract will always trade at a premium over the ‘short term’ dated futures contract. For example, the August month futures contract is expected to trade at a premium when compared to July month. Therefore a certain amount of spread between these two contracts is deemed ‘normal’. However, there could be situations where the spread goes beyond normal (either higher or lower), and this is when opportunities arise.
As of today the USD INR July Futures is trading at 67.3075, and the August contract is trading at 67.6900.
The spread is calculated as the difference between the two futures contract –
67.6900 – 67.3075
= 0.3825
Now assume, for whatever reason you think this spread of 0.3825 high, and it should ideally be 0.2000 as opposed to 0.3825. This means you have an arbitrage opportunity here, and you stand to make –
0.3825 – 0.2000
= 0.1825
To capture the spread, you are required to buy the July Futures and simultaneously sell the Aug futures –
Long July Futures at 67.3075
Short August Futures at 67.6900
When you set up a trade wherein you are long current expiry and short further term expiry; it is also called a “Future Bull Spread”. Likewise, a ‘Futures Bear spread’ is when you are required to short the current month expiry and go long on the further month expiry.
Anyway, once you set up the ‘Future Bull Spread’, you will have to monitor the trade and close the position when the spread converges to 0.2000 or lower. You will profit when one of the following things happen –
- When the July (long) leg rises and Aug (short) leg falls
- When the long leg raises, and the short leg remains unchanged
- When the long leg raises, and short leg rises, albeit at a lower rate.
- When the short leg falls faster than the long leg
- When the long leg remains unchanged and short leg falls
Will the spread converge? If yes, then when will it converge? Why should it converge? Will one of the above situations really pan out? Well, the answer to this really depends on how well you know the spread, and for you to know the spread really well, you need to backtest it. Techniques of backtesting are perhaps a topic for another day; however, I’d like to show you how easy it is to buy sell the spread from your trading terminal.
5.2 – Executing the spread
How would it be if you could directly buy or sell the spread? For example, in the above case, we concluded 0.3825 is an overpriced spread, to capture this spread you execute two orders, i.e. buy July Futures and sell August futures.
Executing these trades has some inefficiency mainly in terms of execution risk – by the time you buy/sell both the contracts, the prices could move, and thereby the spread may no longer look attractive.
Given this, it would be really convenient to buy the spreads directly and not really deal with two different contracts. If you are a Zerodha customer, you have access to NEST trader, from which you can trade the spread directly. Of course, in the future, this will also be available in both Pi and Kite.
Here is a series of snapshots which will help you trade the spreads directly.
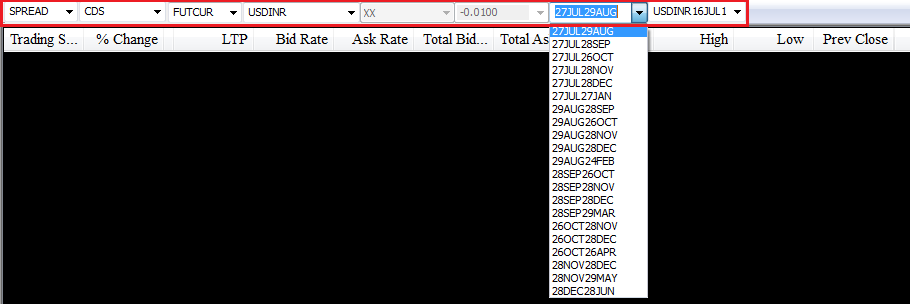
Look at the part highlighted in red, as you may have realized; this snapshot is from the market watch. Starting from the left –
- We select ‘Spread’ from the dropdown, which specifies that we are looking at spread contracts.
- After selecting spreads, we choose CDS from the dropdown to indicate currency derivatives as the segment.
- FUTCUR indicates that within CDS spreads; we are interested in Future contracts.
- USDINR indicates that we are interested in the USDINR contracts.
- The full view of the dropdown menu is visible here, as you can see, there are many different spreads available. However, we are only interested in the July-August spread, which is what we have selected.
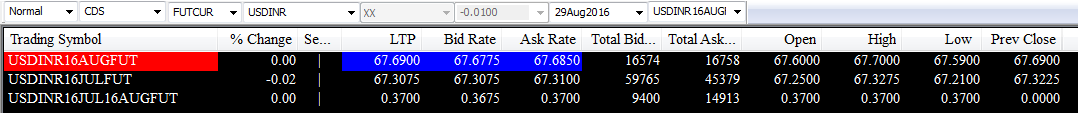
Once we configure the above-market watch, we submit this to load the spread, here is how it looks like –

I’ve highlighted the spread’s last traded price. As you can see, this particular spread instrument denotes the spread between July and August contract.
Note – the spread should be trading at 0.3825 and not really 0.3700 right? Why do you think there is a price difference?
I’ll try and explain this from as per my own understanding, and I could be wrong; therefore, comments are more than welcome! Also, we are digressing a bit here, so try not to lose focus on the main topic, i.e. how to trade the spreads.
Have a look at the snapshot below –
The market watch has July, August and the July-August spread contract loaded.
Forget about the spread contract, for now, assume you want to set up a Future Bull Spread (buy July, sell Aug) contract, then you essentially –
Buy July contract at the Ask Rate – 67.3100
Sell Aug contract at the Bid Rate – 67.6775
Spread = 67.6775 – 67.3100 = 0.3675
Now, if you were to set up a Future Bear Spread, then you essentially –
Buy August contract at Ask Rate – 67.6850
Sell July contract at Bid Rate – 67.3075
Spread = 67.6850 – 67.3075 = 0.3775
As you can see, there are two spreads possible based on what you intend to do, i.e. future bull/bear spread.
Now the question is – which price should the spread reflect? Would it be that of the Future Bull Spread or the Future Bear spread?
I guess that the spread trades close to the average of the two spreads. In this case, the average is 0.3725, and the actual market spread is 0.3700. Why 0.3700 and not really 0.3725? I’d attribute this to one of the two things – the latest quote has not been captured by the terminal or lack of liquidity.
A different explanation here could be that the spread itself is mispriced!
Anyway, back to the main topic, i.e. buying/selling the spread. Once the spread instrument is loaded, all you need to do is select the instrument from your market watch and press F1 or F2 for buying and selling respectively.
This is what you see upon invoking the buy order window –
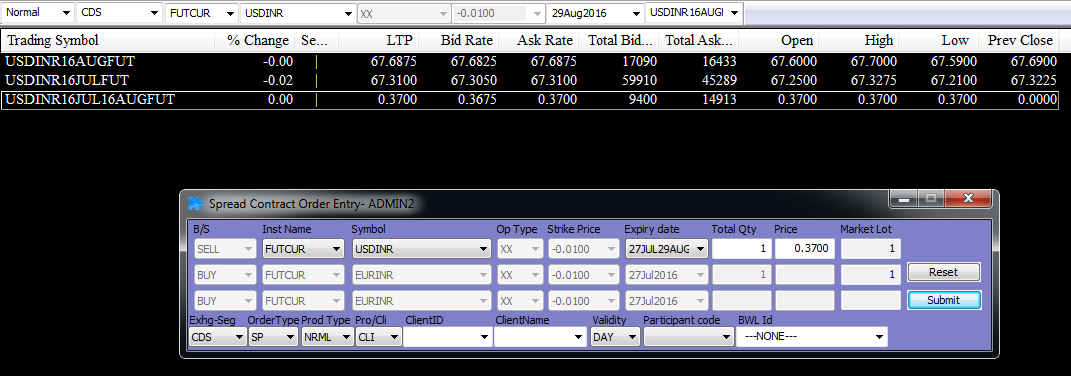
The window is pre-populated with the spread details; you may want to edit the quantity bit to suit your lot size requirement. Press submit to place the order.
As simple as that!
5.3 – USD INR Stats
I thought it would be interesting to study some statistics on the USD INR pair; I downloaded the USD INR spot data from the RBI site.
Let us start by looking at the long term chart of the USD INR over the last 8 years (July 2008 to July 2016) –
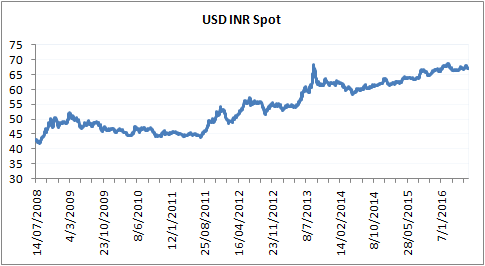
Clearly, the US Dollar has strengthened against the Indian Rupee over the last 8 years. Quite intuitive as our economy has literally stagnated over these years. ☺
Have a look at the daily return plot of the USD INR –
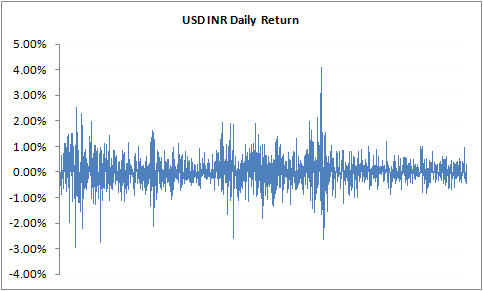
We can observe a few interesting parameters from this –
The average daily return of USD INR is about 0.025%. The maximum and minimum daily return stands at +4.01% and -2.962%, contrast this with Nifty 50’s maximum and minimum daily return of +3.81% and -5.92%, you will realize that the USD INR pair is a lot less volatility compared to Nifty 50 or in fact any other indices. This fact is further manifested in the volatility numbers –
- Daily Standard deviation (last 8 years) – 0.567%
- Daily standard deviation (2015) – 0.311%
- Annualized standard deviation (2015) – 4.94%
These numbers are clearly much lower compared to the Nifty 50’s daily volatility and annualized volatility number of 0.82% and 15.71% respectively.
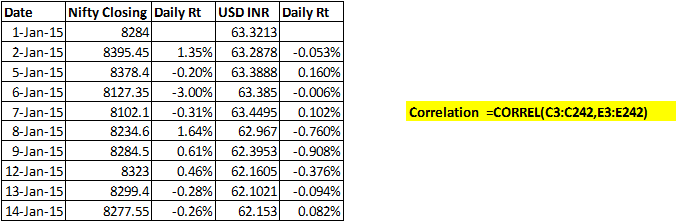
Further, I also ran a correlation function on Nifty 50 and USD INR, before I tell you the answer I want you to guess what this correlation would be like.
For those of you who don’t know what correlation is, here is a quick explanation –
Correlation between two variables gives us a sense of how two variables move concerning each other. Correlation is measured as a number which varies between -1 to +1. For example, if the correlation between the two variables is +0.75, then it tells us two things –
- The plus preceding the number tells us that they both are positively correlated, i.e. they move in the same direction.
- The actual number gives us a sense of the strength of this movement. In a loose sense, the closer it is to +1 (or -1) the higher is the tendency for the two variables to move in tandem.
- A correlation of 0 suggests that the two variables are not related to each other.
From the above, we know a correlation of +0.75 suggests that the two variables move not only in the same direction but also tend to move together closely. Note, the correlation does not suggest the extent of the move; all suggest is that the move in the same direction is likely to happen. For example, if Stock A moves 3%, and the correlation between stock A and stock B is +0.75, then it does not mean that Stock B will also move by 3%, all that the correlation suggests is that Stock B will move up positively, just like Stock A.
But, there is another twist here – suppose stock A and Stock B are correlated at 0.75, and the daily average return of Stock A and Stock B is 0.9% a 1.2%. It can be said that on any given day, if Stock A moves above its daily average return of 0.9%, then stock B is also likely to move higher than its daily average return of 1.2%.
Likewise, a correlation of -0.75 indicates that the two variables move in opposite directions (indicated by the -ve sign). Suppose stock A moves up by +2.5%, then under a correlation, we know that Stock B is likely to come down, but by what degree will it come down isn’t known.
While we are at it, one more point on correlation. This bit is only for those interested in the maths of correlation. The correlation data makes sense only if the data series is ‘stationary around the mean’. What does this mean? – Well, it simply means that the data set should be sticking close to the average values. Take another look at the graph of the daily returns of the USD INR, reposting the same for your convenience –

The daily average return here is 0.025%. If you notice the daily returns, it is mean reverting in nature, meaning even if the returns shoots up, or comes down, it eventually sticks back to the average value. A data series which exhibits such property is said to be “stationary around the mean”. Stock/commodity/currency returns are invariably stationary, but the Stock/commodity/currency prices are not stationary as they tend to trend.
Confusing? Well, the key point that you need to remember here is that when you run a correlation test, make sure you run it on the daily returns (as they are stationary) and not really on the daily prices (as they tend to trend).
Calculating the correlation between two variables is quite easy, in fact, has just 2 steps –
- Calculate the daily returns
- Use the ‘=Correl’ function in excel.
Press enter, and you get the correlation between the two variables.
Remember the correlation between stock A and Stock B is the same as the correlation between Stock B and Stock A.
I hope you’ve had a decent understanding of correlation, its time I repost the question asked earlier.
If you were to guess the correlation between USDINR and Nifty 50, what would it be? Forget about the number, can you at least guess whether they are positively correlated or negatively correlated?
Let us try and deduce this – If the markets (as a representation of the whole economy) are doing good, then the markets tend to attract investments from overseas. This means dollars are coming into the country. The dollars get sold to get converted to Rupee. Essentially this translates to dollars being sold for Rupees, naturally the Rupee strengths. This means the USDINR goes down while the Nifty 50 increases. The same logic can be applied when you look at it from the other way, i.e. market going down while USDINR increases.
This means Nifty 50 and the USDINR should be inversely correlated. In fact, this is true, and the correlation value is -0.12267 (2015 data).
You can download the excel sheet.
In the next chapter, we will briefly look into other currency contracts and the role of Technical Analysis while trading currencies. With this discussion, we will wrap up currencies and start exploring the world oh commodities!
Key takeaways from this chapter
- The classic future – spot arbitrage is not really accessible to the retail market. Hence traders tend to look at calendar spreads.
- In a calendar spread you simultaneously buy and sell contracts belonging to two different expires.
- A future Bull spread is when you buy near month futures and sell the further month expiry.
- Futures bear spread when you sell near month futures and buy the further month expiry.
- You can directly trade the spread from your trading terminal; these are called the ‘Spread contracts’
- The USD INR pair tends to have lower volatility when compared to Nifty 50
- The USD INR and Nifty 50 are inversely correlated
Hi sir, please help me out! I\’m an aspiring trader. I trade in NIFTY. For the past dew days I\’m focusing on currency trading. I came to know that Trading in currency is not permitted by SEBI from 2024. And when i tried placing currecny(USDINR)from ZERODHA KITE, It showed a message saying that I need to use it only for HEDGING with some exposure to currency.
My questions:
1. As an individual trader, Can I trade in currencies?
2. If not, Why are some influencers across social media and promoting and encouraging currency/forex trading?
Thank you in anticipation!!
As per the new norms, you have to give a declaration before you trade currency. Please contact the support desk for this. Most of the influencers are not aware 🙂
Thank you !!
Hey Karthik, did you teach any backtest techniques in any module??
Nope, not really.
why usd inr futures trade in sgx and dcx in 120 range way off from spot price than in india or us where its 80 range closer to spot procr
Ah, not sure and I\’ll have to figure this as well. But I\’m guessing this involves some FX costs and therefore the costs get baked into the price.
sir , as the Nifty 50 and USDINR are inversely corelated , can we make long position when USDINR ID trending downside and vice versa, specially asking for swing trading or trades( 200ponts ) for 1 or 2 days .
You will have to test this behavior Satish. Also, if this is true, then it may not be a leading indicator, but rather a lagging one.
Is there Always a Liquidity problem in USDINR in ZERODHA??
Last time I made a trade in USDINR OPTION which was Around 0.0500 and I tried to sell it at 0.0550 but I was not able to sell it even when the price was On the same level…….In the Volume there were lakhs of trade on the same strike
Was it a Liquidity problem?
No, there is no such issue. Please do call the support desk to verify why your order dint go through.
Sir why do we see different price and charts for different month contracts ?
for example when i sold Sept fut price is 83.2325 but when i saw next month contract i.e. Oct fut the price is 83.3150 and also there is huge gap up in Oct month Fut and no gap in Sept month fut contract.
How to deal with this problem Sir?
Sir,
It is just a couple of days that I started reading currencies. I have no idea where to go to trade the currency. Is it coin in zerodha? Request if you could help here.
Currencies are available in Kite itself. Goto the Marketwatch and type in USDINR or any other currency pair to get the contract.
Sir,
Like currency, is there any opportunity to trade direct spread for equity too?
Nope, dont think so 🙂
Sir,
There has been several previous instances where you have conveyed that we can get previous data (for backtesting) from Sensibull. I don\’t even know about the sensibull platform. However, I would like to know that do I personally need to approach them through emails etc. or can they have the data in their site only?
You can write to Sensibull here – [email protected]
Sir,
Is the direct spread buy feasible in kite?
No, thats not possible Anirban.
Please also confirm the following understanding on the trading time of currency options –
For weekly contracts, you can trade from 9 am to 5pm everyday EXCEPT on the expiry day as it expires on Friday at 12:30 pm instead of usual closing of 5pm for the remaining days.
Yes, that is correct.
Minimum price to buy/sell USDINR option is 0.0025. Say one has 1cr capital, they can sell USDINR option strangle of 5000qty. Say someone sells just 1 min before the expiry every Friday at 12:29 pm and kept the position option for auto square-off at 0 rupees post market by zerodha. Then will they effectively earn risk-free 25000 rupees (0.0025(sell price) x 2 (CE and PE) x 5000 (qty) x 1000 (value)) every Friday with this? This comes to be approx 12% annual returns. Is my understanding correct?
Yes, you can do this. There are freeze quantity limits, so you must split your orders into multiple chunks. But there would be no buyers at that point for you to sell options 🙂
why zerodha don\’t allow to see(or add) the spot chart of currency (usdinr) ?
don\’t say that \”because we cant trade in that. we cant trade in nifty50 & other index also.
There is no retail spot market for forex, Aditya.
Hi Karthik, sorry I didn\’t get you. My question was – Which expiry of futures is considered for currency options? For example, if we are looking at current week expiry USDINR options CE, then what is the underlying futures expiry for the same?
Its monthly only. But let me once again recheck this for you 🙂
Which expiry of futures is considered for currency options? For example, if we are looking at current week expiry USDINR options CE, then what is the underlying futures expiry for the same?
Yes, thats right.
What total value of money required currency option buying…
Depends on the contract.
while trading USDINR futures which charts do we need to considers for technical analysis future or spot?
You can use the futures chart, Deepak.
Where can we get USD INR – CDS Futures historical data ?
Checked in nse website already it did not provide any details on the current year 2022.
I\’d suggest you contact a NSE-approved data vendor for this.
Can we sell next month future(trading at higher premium) and buy current month future(trading at normal premium)
As the expiry comes near does the difference reduce?
If so then we can make profit
You can. The spread can shrink, but there is no guarantee 🙂
Sir,
How to calculate correlation of two stock, indices or stock and indices
Calculate the daily returns and then run the correlation function on the daily return array.
then how to look for the spreads in the market do I have to search it manually or is there any feature on kite
I am referring to NEST trader (which you mentioned above that in future it will be available in kite and Pi also) through which we can trade spreads directly.
by the way what is Pi as you mentioned it above
Ah, these systems are phased out, you can use Kite now. It is a much better system anyway 🙂
is the nest feature still available on kite and if yes how can I access it
Sorry, which feature are you referring to?
pls tell me, whats are other currency arbitrage strategies. how much ROI, wecan expect in currency future spread. also suggest me, is there any website where we can plot payoff (like opestra,for index/stocks).
pls share some other future hedging strategy.
All of this depends on how you identify the opportunities and how you execute the same right? I\’d suggest you try Sensibull.
Maximum loss kitna ho sakta hai??
Sir I got reference data in BSE website
According to your experience what should be ideal spread
Is it 0.20
Is it good to just initiate a trade when spread in more than 0.30 assuming it will comeback to 0.20
Here we can capture 0.10 paise
Hard to conclude which spread is better. I\’d suggest you take this approach – https://zerodha.com/varsity/chapter/calendar-spreads/
I was searching for reference rate data,I couldn\’t find
Where can I get this
If possible share link
Thank you
YOu can look for the contract specs of this particular instrument.
Sir is it closing price which we see on kite for currency pairs or different?
What you see is the curreny\’s future close price.
Since Spot data is not available for currencies,how to calculate Fair Value using future pricing formula? Or
Just assuming that always below 0.20 is normal and above that is a spread opportunity
You can take the previous day\’s reference price for this Bharath.
Then in this case we should sell since the spread should be 0.20 and not 0.37
2) I read now both NEST and PI terminal is not available to new clients,is this true ?
I was looking for Zerodha PI..
Yes, I\’d suggest you look at Kite, it\’s a far better platform to use.
Since we are not buying and selling manually,and executing direct through spreads should we buy or sell spread of 0.3700
Depends on your view on the spread, just like markets you can expect the spread to either go up and go down.
Really helpful information. I have a doubt. I do options on BN and Nifty where they correlate with the Spot price. but when it comes to USD INR i feel they are more in line with the FUT as they premiums are respecting future . Can you clarify on that? and also which website do u prefer to see exact spot as zerodha doesnt have USDINR SPOT scrip
There is no spot price for USDINR, instead futures is taken as a reference price.
Then even it is good trade I need to ignore this,but this is near month contract
And Sir I trading from India should I follow kite chart or trading view chart where the pair trades through out the day
You can look at tradingview, its with Kite anyway.
https://drive.google.com/file/d/1NhYUQ5cr5ktZgkf-XzyVgT0KrYFRBKJL/view?usp=drivesdk
Sir found an opportunity see the file but there is no much data in June contract in kite chart,if I go ahead with trading view spot market chart
Which one to consider but both different prices different chart patterns?
I guess there is no liquidity here, it will be tough for you to implement this.
Sir how to find this opportunities,should I need to manually apply future pricing formula and check whether it\’s fairly valued are trading at premium
Yes. But once you do this for few expiries, then you will get a hang of it.
Why i can\’t see usdinr 75 jun PE in my account?
Hmm, not sure if you are looking for it properly.
In case of option trading of USDINR there are two rates.. One is on NSE Website USDINR REFERENCE rate another is USDINR April Future Rate.. On whose basis I have to trade in Options on the month of April?
You can trade based on the futures price.
My confusion is not cleared! Why future bull spread should ideally be .2000 or lower?
That is to ensure that the spread is captured.
Yes, you have said this above..
\”once you set up the ‘Future Bull Spread’, you will have to monitor the trade and close the position when the spread converges to 0.2000 or lower\”.
I can\’t understand the logic behind this. why we close the trade when the spread converges to 0.20000 or lower?
Would you explain this…
To manage risk right?
Now that Zerodha does not support NEST anymore. Than how execute spread trades
Directly as explained above In NEST
Do check this Dhawal – https://support.zerodha.com/category/trading-and-markets/kite-web-and-mobile/holdings/articles/kite-basket-orders
If NIFTY & USDINR is inversely correlated, then why is USDINR falling nowdays when NIFTY is also falling due to the FII outflows?
Hi Karthik, First thank you very much for all the Varsity content.
1) Can we trade currency futures like spot forex trading. That is can we go long usdinr in uptrend and sell after a few days. Similarly can we short sell usdinr in down trend holding the position for quite sometime.
2) If I wanted to do that which month future contract should I choose. JAN month or later months.
3) Can I analyse the USDINR spot value(chart) to trade in the future contract.
Thanks in advance.
1) Yes, you can
2) Choose the one with max liquidity
3) No spot data for USDINR
Thanks for your views sir. They helped me. I wanted to be double sure about risk involved in it before starting currency futures trading.
Sure, happy reading!
Hello Sir,
I am very new to USD/INR trading. Although I am trading in equity market for some years. I want to ask few doubts regarding currency trading and I hope you clear them.
1) Why almost everyone says USD/INR futures intraday trading is not profitable but instead try positional trading in it..?
2) which is more volatile between Nifty and USD/INR for intraday.?
3) is USD/INR liquid enough to scale up gradually from 10 lots to 1000 lots in intraday ?
4) comparing between usd/inr futures and nifty weekly options which one has more chances of slippage whiling placing orders for many lots..?
5) Have you seen any instance in USD/INR intraday movement where movement was so sudden and huge that even SL-M order remained pending..?
6) in your knowledge have you seen any profitable trader who trades in only currency futures still make enough money for living..?
thanks in advance..!!
1) Note sure, perhaps due to low movement in the price
2) Hmm, I\’d say USD/INR, since Nifty is an index and USD/INR is a single asset
3) Yup
4) USD/INR I guess
5) Yup, happened recently during US elections as well
6) Most of them I know trade multiple assets and not just one.
Is spread available in Zerodha\’s Pi ? I am unable to find it.
I\’d suggest you call the support for this.
Sir,
On expiry, will be able to capture the whole of future spread i.e difference between cuurent month future price and next month future price or only the arbitage difference.
Regards
Arbitrage difference is the spread no?
sir
Thank you for the reply.
but, basically what i mean is
Standard Deviation represents volatility, which in turn represents risk
how can a RISK goes to negetive(-)
If you have a -ve returns for the entire year, this may be possible. How have you calculated the returns? Log method?
sir
Daily Standard deviation (last 8 years) – 0.567%
Daily standard deviation (2015) – 0.311%
Annualized standard deviation (2015) – 4.94%
how can SD be negitive(-)
i\’m getting confused, please help me out sir
Hmm, if the stock has trended down, this is possible. Also, I\’d suggest you use log returns.
hi
i have been reading that as the lending rate decreases the the inflation increases as there is lot of cash flow in the market.but even if the lending rate increases the business would have to increase their product price leading again to inflation. I wanted to know which factor increases or decreases.
There are several moving parts here, Manhar. Inflation leads to tightening of cash flow. Suggest you pick up a basic macroeconomic book and get an understanding of this.
Yes , of course!
I thought you were talking about the relationship between the current and near month futures (not spot). Doesn\’t this usually diverge near expiry?
Yes, the spot and futures always converge. Near and mid-month need not have to converge.
You have mentioned in a reply that \” spread converges and shrinks as and when we approach the expiry\”
I thought ( for especially USDINR) that usually the spread usually becomes wider at expiry of the current month. Please explain
No, remember the futures price converges with the spot price at expiry, this is the fundamental behaviour of the futures contract.
Hello Karthik,
I just found out this article and it\’s really helpful. I have one question, can you please tell me if the USD/INR pair is liquid enough for day trading?
Thanks in advance
Yes, it is quite liquid Sushama.
Dear sir
Your chapter on currency trading are very good
Request you to please suggest the book on currency trading for more better understanding.
I\’m really not sure about the currency trading book. Need to check if there are any latest books on this topic.
Thanks Karthik. 🙂
Dear Karthik,
Greetings !!
I just want to know how Rollover of a Future Contract of USDINR can be done in Kite. Lets say I have sold DEC\’19USDINR Future Contract and at the time of expiry I would want to Rollover it to Jan\’20, so how I can do this in Kite. Thanks.
Raja, to roll over, you initiate the same position in the next month\’s contract. So in this case, you close the dec contract and initiate the same position for Jan.
Hello sir,
I have observed the MIS/NRML margin keeps on changing on the currency as well as other assets for a particular expiry month. On what basis does it change from starting of a contract month to its expiry in kite/zerodha?
It mainly depends on the %change and volatility, although the change is not much.
Is spread trading is similar to index mutual fund. The value will be less will they have same volatility has currency. Will i buy the Spread @ .30 and go down .10 will i end loss. Will they have time value in spread.
If i bought the @ price .30 and the remain Constant and moves down .20 on expire day will i able to roll over to next contract cycle
Ranjan, no both are very very different. Spread trading is essentially arbitrage while index MF is a way to passively invest in the market. One can not compare these two.
Is there any other site where I can find spot chart for TA..? It\’s because as per my strategy I need at least 1 year of chart to take decisions.
You can check the RBI website for information related to the currency spot. Not sure about the commodity spot prices.
How can I find spot chart for currencies and commodities? I need spot chart to do my TA and then trade futures based on it.
Hmm, unfortunately these charts are not available Anitesh as only the futures are traded.
wht is the quantity denotes for currency options
for ex;-
strike price=69
premium=0.0600
qty=1
is this 1=1000?
and how to calculate the amount to be paid?
1 denotes the lot size, which is 1000 USD.
can we trade on VIX ? i
Nope
Dear sir,does \”spread\” decreases as
We move towards expiry day by day and what will happen at expiry?I sold spread USd Dec Jan from .23
Yes, the spread converges and shrinks as and when we approach the expiry.
hi sir,
how to see actual profit and loss in currency segment. In position P&Loss figure is different from console report profit and loss figure. Which one is correct.
hi sir,
i am trading in currency inr usd pair. i find the closing price at 5 pm of this pair differ in the next opening session. I find that both last traded price and average price changed in the next morning session. could you kindly explain.
The opening price will be different from the previous day\’s closing price owing to the overnight news flow.
Can you eloberate how currencies closings price decided? I found this on NSE \” The closing price for a futures contract shall be calculated on the basis of the last half an hour weighted average price of such contract\”
Check this post, Yogesh – https://tradingqna.com/t/how-to-determine-closing-price-in-f-o/584
Another problem is that daily closing different from both spot(reference rate) and 5pm closing. What it is happens? How RBI settled currencies contract daily?
RBI does not settle this, Yogesh. As I mentioned, the spot is mainly an interbank market.
Usdinr trading on October contract down 2 paisa from underlying and November contract 25 paisa higher.why this is happening?
Demand supply factors, Yogesh.
Why zerodha kite not showing underlying currency?
USDINR underlying is not traded on the exchanges neither are retail traders allowed to trade.
RBI only releases the daily references rate of the currencies at 12.30 PM. You can find the rates here.
The spot is not traded in the market, Yogesh.
Yes but I to trade future based on spot(spread or spectacular).how can I find spot currencies?
The spot is mainly an inter-bank market, Yogesh. RBI just releases the reference rate by end of the day. No market as such.
Sir can we trade spread directly on kite now?
Thanks
Not yet on Kite, but its available on NEST Trader.
HI
WHich Indicator will be best for for USDINR future/option trading & where we can get the news for USDINR Related news.. to identify today trend etc.
Really depends on how you intend to trade, Selvaraj. Anyway, I\’d suggest you start looking at MA\’s to begin with.
when FII & FDI will invest in India, the currency will depreciate wrt to other currencies and vice versa,
am i right?
when FII & FDI will invest in India, the currency value will depreciate and vice versa,
am i right?
Depends on which currency you are talking about. When this happens, the Rupee strengths.
How much time it will take to do spread trading in kite ?
By 1 order as explained in chapter.
How can we know spread is overpriced? ie.,0.3770 and 0.2000
Is spread here is just an assessment whether it is overpriced or underpriced? Have we, had to buy and sell orders individually?
Little confusing… Kindly reply me
Thank you
Will be discussing the spread in greater detail in the ongoing module on Trading Systems. Suggest you keep a track on the progress here – https://zerodha.com/varsity/module/trading-systems/
Thank you..You are making it easy to understand.
Cheers!
Is the leverage in forex futures ,applicable to intraday and cnc also? or do I need the full amount to carry forward?Can a short position for intraday,be carried forward to next days ?
To carry forward you need NRML margins. You can carry forward the short position in futures and options.
Karthik,
Excellent excellent stuff as always……..A query……How do i use (or before that can i even use?) the daily standard deviation to determine what kind of overnight risk i should factor in my position sizing? Basically i need to be able to sleep knowing what amount of overnight risk i can expect on a regular day based on historical data? can daily standard deviation be used? if yes, how?
Of course, you can Prashant. As a quicker alternative, you can even use the ATR.
Wat about 1min or 2min daily chart for Currency futures its too short a tine
Why there sudden increase & decrease in market of currency future at 9 00 am ,
Can we trade at 9.00 am for currency future ?
9:00 AM to 5:00 PM.
Yes, I think its too short. But, yeah, you can apply TA on it as well.
Why can\’t we buy and sell at the market price , why there is always a Difference in buy price and market price and sell price and market price ? Can we apply TA for 5 min daily chart of currency futures?
Buyers always want lower price and sellers always want a lesser price, hence the difference.
Yes, you can.
So what expect profit ?
Sell July contract at Bid Rate – 67.3075
Spread = 67.6850 – 67.3075 = 0.3775
SpanRs: 403
Exposure marginRs: 1,293
Spread benefit ?Rs: 1,078
Total margin ?Rs: 618
Margin benefit Rs: 1,960
0.3775*1000=Profit377 . Am I right ?
You get a margin benefit when you hedge your position, in the example you\’ve mentioned you need to buy an August contract to hedge it so as to avail margin benefit.
Ive noticed the prices to be different in the zerodha terminal and few other websites . I\’m assuming this is the difference between the spot and the future . Do i trade options using the future price or the spot price ?
Thank you .
If you are talking about the difference between spot and futures, then it is the same across every broker. For options you need to look at the spot price.
Thank you … Where can i find the spot price chart ? I get only the futures price chart .
You can get the spot data here – https://www.rbi.org.in/scripts/ReferenceRateArchive.aspx
available in gujrati language is comfort for me
We will try our best to translate 🙂
Hello sir, can we trade in usdinr Aug , usdinr Dec pairs contract. If the traded month is March . And if not why
Yes, far dated futures contracts is available.
sir, while trading currency if i m using BO , then what value should i place incase i choose Absolute option OR Tick option for 1Pip movement?
You could opt for ticks. 400 ticks make up for 1 Rupee.
i have read all the modules so far. when are u guys uploading the rest? eagerly waiting ..excellent stuff gr8 explanation..
Thanks Aksash. 2 more chapters in the module and we will be done with it.
Hi Karthik,
I have one technical query:
The spread order put by one Trader(Buy Near, Sell Mid) is matched with the opposite order(Sell Near, Buy Mid) in the spread book in exchange.
1) If match happens then will there be 2 trades sent to each party, 1 for each series ?
2) If above is true, at what price the trades are generated when match happens? For eg, If the match has happened at 0.5 then will the near & mid series individual trade prices have this difference ensured, if yes how is that possible given the different demand/supply scenario in individual series?
Shailesh – technically this should go as a spread order. However, I\’m really not clear about this…I\’m guessing it goes out as two separate orders. Its just that at the order entry level, it simulates a spread environment.
Hi karthik, thanks for prompt response.
Can you pls suggest where can I get this info..I need it as part of my project and the API doc provided by exchange doesn\’t say much about it.
Can you please drop in an email to my colleague Siva – [email protected] ? Thanks.
karthik sir
since spot forex is 24 hours market globally , what to be taken as closing & opening price while trading usdinr futures in NSE india ? for calculating pivot points & other techinicals. should we apply same techincal analysis as we do in spot market ( as there are are factors like time decay in futures market ) ?
2. how to carry a position next day , since stop loss is not applicable for overnight positions ?
1) Everyday RBI gives out the reference rate for USD INR, this is the spot price. Yes, the same technicals will apply.
2) You will have to place a new stoploss the next day.
thanks karthik sir
so we have do techincal analysis of underlying i.e. spot price ?
Yes.
thanks karthik sir
Welcome!
I feel topic on US Dollar index should be consider as a chapter w.r.t explaining the significance of Dollar Index and how it is crucial for Indian and Global Markets.. Just a suggestion.. 🙂
In fact US Index is pegged against all commodities. Maybe it will be worth the efforts 🙂
can you please explain about USDINR Option contract in depth.
Works very similar to equity options. Do you have any specific question?
Hi Karthik,
what is the reason behind considering RBI reference rate instead of underlying spot rate in USD/INR futures trading.
RBI Ref rate is the spot rate! Few website publish the same RBI rates as spot.
Sir, please teach us commodity too!!! eagerly awaiting!!!! got few doubts too.
Commodities are starting ery very soon :). Just one more chapter on currencies and then we start commodities.
Oki sir, would you be able to cover Supply & Demand zone, factors affecting the commodity market, how to use wti chart in correspondence with our mcx chart, candle stick divergence, few examples with evening star and things that you feel will help us to learn more.
Yes, will try and cover as many aspects as possible.
Oki SIr, thank you
Welcome!
Hi Karthik. Thanks for the chapter.
I have been trying to collect historical data of major economic indicators, viz.: CPI, WPI, IIP, GDP, CAD, Non farm payroll, etc for both USA and India and I am facing few problems.
Firstly the sources for the data seem to be scattered all around the place. I haven\’t found sources for a few of the indicators mentioned above.
Secondly for a given indicator, say for example-CPI, there are different categories of it(http://www.bls.gov/cpi/#data). How to know which categories of this indicator for a given pair of countries is best suited for comparison with each other.
I request you to firstly help me the data sources of the indicators.
I hope my queries are not a waste of your time.
Thanks again.
Yup, I understand the issue. Why don\’t you give http://www.tradingeconomics.com/ a try?
Chapter 5.3 USD INR STATS
A
Got it.
We have made an assumption in the previous chapter – http://zerodha.com/varsity/chapter/the-usd-inr-pair/ that you are familiar with the terminologies. I\’d request you to read the earlier modules before starting this one.
Guru,
This module is not easy. Plz make it more simple. All students r not scholars there r average students like me.
Request you to kindly point out which part is difficult, will work towards making it simpler! Thanks.
In module 8 \”Commodities, Currency and Interest Rate Futures\” in chapter 5 \”The USD INR Pair (Part 2)\” you have written under 5.1] \”All one has to do is buy the future at 98, and simultaneously sell the spot at 100. We know upon expiry, the futures and the spot will converge and therefore the spread gets captured.\”. my question is how can we hold the spot short position till expiry ????
We cannot, hence we do a calendar spread between 2 futures.
Wow, what an informative chapter. However mathematical part of correlation need more understanding from my side. Still i have queries…
1. Is This info applicable to other currency futures as well?
2. How much margin is required for 1 such spread? And how brokerage is calculated?
3. How to exit from spread? At one go or can be on individual basis?
4. How to add such spread contract in kite? I tried in kite app but could not found the way to do so.
I could not tried equity spread due to lack of margin requirements but currencies suited me well due to very low margin requirements. I would like to try it definitely.
Yes, but you will have to crunch the numbers yourself. I\’d suggest you look at the excel to get an idea on how to do it. Margin required is roughly 1%. You can exit the spread by squaring off the regular way…just like you\’d square off a stock.
Spreads are not available on Kite/Pi, will be featured soon I guess.
is that Kabali? 🙂
Yup 🙂
Very nice modules, eagerly awaiting for next chapters. When will the spreads, 2L, 3L, BSE index, VIX available in kite, any timelines please?
Just like calendar spreads for currency are there any credit/debit option spreads also available in any product. What about U.S. market?.
It\’s very painful that I can\’t write the stock/index options due to high margins and no margin benefits are there for manual spread order.
Cant comment on a timeline for this, but I know this will happen sometime soon. I\’m certain option spreads are available in US.
contrast this with Nifty 50’s maximum and minimum return of +3.81% and +5.92%, It should be -5.92% I think.
Thanks, will make the correction.
Dear Karthik, Just like USDINR is traded on NSE, does the same pair get traded in some other international exchange like US/UK etc. If yes, can one look at the same data and see whether the market is viewing the pair in the same way across various markets ? Thanks
They do, outside India its largely a \’Market making\’ environment. But the spreads outside India mimic the contract that gets traded on NSE.
Futures bear spread is when you sell near month futures and sell the further month expiry. – Is this statement correct ?
Sell near month and buy further month.
Please get this changed under \’\’ Key takeaways from this chapter \’\’ -:)
All done! Thanks 🙂