

8.1 – The London fix
In the previous chapter, we discussed the various Gold contracts that are available on MCX. I want to begin this chapter by discussing how the prices of Gold in the spot market are arrived at internationally and in India. However, I have to mention this – this method to ‘fix’ gold prices is merely symbolic and holds very little relevance to trading gold futures at MCX. I’m discussing this simply because it is an interesting thing to know. J
Internationally, the price of Gold is fixed in London daily, twice a day in two different sessions. The morning session at 10:30 AM is referred to as ‘AM Fix’ and the evening session at 3:00 PM is called the ‘PM Fix’. The prices are fixed by the gold dealers from London’s biggest bullion desk. The whole process is facilitated by Nathan Mayer Rothschild & Sons.
There are about 10-11 participating banks, which include names like JP Morgan, Standard Chartered, ScotiaMocatta (Scotiabank), Société Générale etc. Do note, the general public and other banks are not permitted to participate in this process. The dealers from these banks call the dedicated conference line at the designated time and submit their bids to buy and sell gold. From all the bids and offers an average price is arrived at, and the same price is relayed to the market, which then becomes the benchmark for gold trading. The whole process lasts for about 10-15 minutes. The process is again repeated in the ‘PM session’, and the gold prices are again discovered and relayed to the markets.
The gold price that is fixed by the AM and PM sessions is very close to the actual price of gold that is traded in London and other international markets. So in a sense, the price that is relayed holds no surprise to traders or bullion dealers, in fact, some participants even believe that like many things in England, even this is conducted more to keep up with tradition.
India too follows a somewhat similar practice, but less elaborate. India, being one of the biggest consumers of Gold, imports the yellow metal. The gold is imported by designated banks and the banks in turn supply this gold to bullion dealers (after adding the necessary charges; more on this a little later). The Indian Bullion Association then bids for the gold through its network of bullion dealers. These dealers mainly base their quotes on how much gold they would like to buy or sell at a given price, the rates are averaged out, and this roughly sets the floor for the Gold prices in India. In fact, there is some circularity here because dealers tend to look at the Gold futures price traded on MCX before placing their bids with the Indian bullion association. Anyway, this price is relayed to the dealers’ and jewellers’ network, and the price for the day is set.
8.2 – Gold price disparity
Traders tend to compare the Gold futures rate in Chicago Mercantile Exchange (CME) and the Gold Futures rate on MCX and assume there is an arbitrage opportunity lurking around. The rationale for this is that Gold being an international commodity should often trade at around the same price, in the absence of which an arbitrage opportunity arises. So for example, if 10 grams of 995 purity Gold in CME is quoted at $430, then on MCX the price of 10 grams of 995 purity should be in and around $ 430.
But this is often not the case, they trade at a significantly different price, and due to this a disparity between gold futures in CME and MCX always exists. The question however is, why does this disparity between the two gold futures contracts exist?
Let us figure this out –
To understand the disparity between the two futures contracts, one should understand how the Gold spot rate evolves in India.
Remember, India is a net importer of gold. In the international markets, US especially, Gold is quoted on a per troy ounce basis. One troy ounce is approximately 31.1035 grams. Assume Gold in the US spot market is traded at $1320 per troy ounce – given this, what do you think should be the spot price of gold in India. Assume $ 1 = Rs 65.
The general tendency is to identify the cost for 10 gram of gold in USD and multiply the same with the current USD INR rate and figure out the price. Let us do this math quickly –
31.1 Grams = $1320, therefore 10 grams = $424.43. Since USD INR is at 65, the price of Gold in India should be approximate = Rs.27,588/-.
Unfortunately, in reality, this is not so straightforward. Gold when imported (remember it is the banks which import gold) attracts duties and taxes. The spot price of Gold in India should include all these charges. In fact, let me list down all the costs that are applicable when a bank imports gold –
- CIF applicable in Dollars (CIF stands for cost, insurance, and freight)
- Custom duty
- Cess
- Bank cost
With all these charges, the landed price of Gold tends to increase. In fact, this post on TradingQ&A beautifully illustrates how the cost adds up.
So for example, if the rate of spot Gold in the US is $420 per 10 grams, then in India after adding all the additional costs, the spot rate will be much higher. For the sake of this discussion, let us assume the rate in India is $435 – leading to a $15 disparity in spot rates.
Now, this explains the disparity in spot rates, but what about the futures price? Remember the futures prices is a derived from spot rates, the formula linking futures price with spot price is –
F = S*e(rt)
You can read more on futures pricing.
So in the US markets, the basis for the future pricing will be the spot price of Gold in the US, i.e. $420, while at the same time the basis for the future price in India will be the spot price of gold in India, i.e. $435. Given this, naturally, the futures price of gold in CME and MCX will differ. This difference should not be mistaken for an arbitrage opportunity.
8.3 – What drives the gold price?
Investors across the world have this strange, but predictable behaviour – at times of uncertainties, well at least economic uncertainties, they are all in a hurry to buy gold. Gold has always been considered a haven capable of safeguarding investments against any economic meltdown.
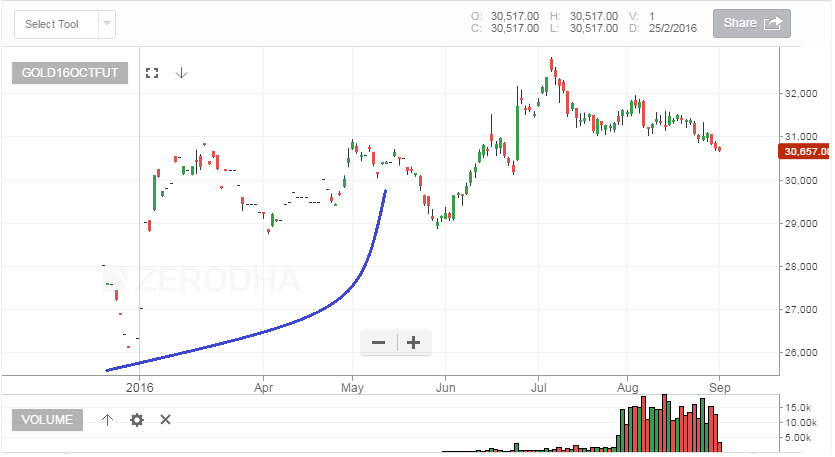
Consider the Brexit (June 2016) event, the most recent event which kind of shook the world, and here is how Gold behaved before and after the event –
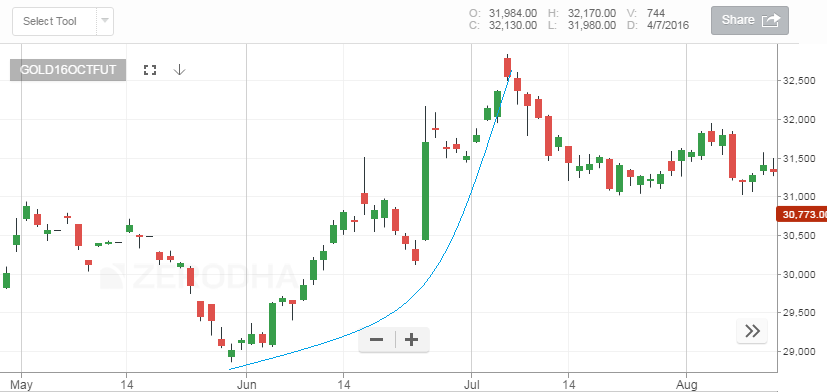
There was a clear run-up in Gold before the event and post the event, in fact, the big candle that you see during this period is on 24th June, the day after the Brexit verdict was out. Naturally, gold rallied owing to the outcome of Brexit. In fact, every time there is any global/domestic uncertainty, investors flock to buy gold. This is mainly driven by the fact that Gold is considered a haven, capable of preserving your wealth.
Almost all the major events in the past have had an impact on Gold, think about it – Oil crisis, middle eastern uprising, Israel-Palestine, EU migrant crisis, Greek economy, Euro crisis, Lehman Brothers; the list is never-ending. But the point to note is that every world event impacts the prices of gold.
This leads us to an important conclusion – Gold tends to increase in value in the backdrop of economic uncertainties. In fact, in the backdrop of economic uncertainties, demand for risky assets such as equities goes down, and the demand for safe-haven assets such as Gold tends to increase.
Now besides the uncertain events, even on a day to day basis, investors tend to buy gold considering it a safe hedge against inflation. They believe, in the long run, the value of gold will continue to rise. This perception is justified if you look at a very long term chart of gold –
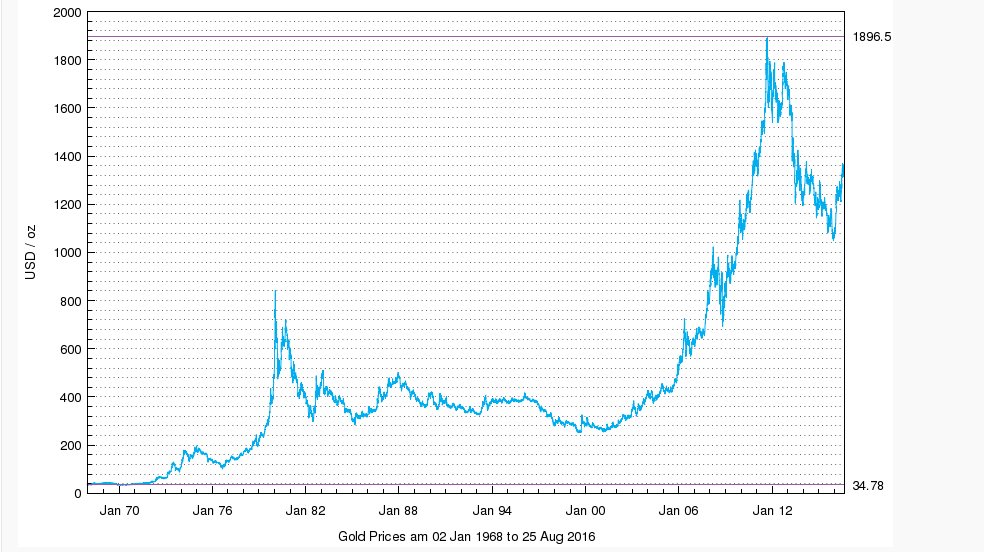
Source: http://www.lbma.org.uk/pricing-and-statistics
Take a look at the chart above, in 1970 Gold was at roughly $35 and today in 2016, Gold is at $1360, translating to a 37x return. However, when you look at it from a CARG perspective, this translates to about 8% year on year growth. The world average inflation is roughly between 5-6%. This means if you are an investor in gold, on the one hand, you are expected to make 8%, and on the other, you lose about 6% (owing to inflation) netting you with an outperformance of 2%. However, in countries such as India where inflation is high, investment in Gold does not really fetch much.
8.4 – Gold, Dollar, Rupee, and Interest rates
The movement in gold is also related to how the currencies and interest rate of the economy moves. So if you are a trader in Gold, then it is not only important to keep track of world economics, but also important to keep track of currencies and interest rates. The equations are simple; let us start with the dollar and build on it.
Have a look at this graph below –
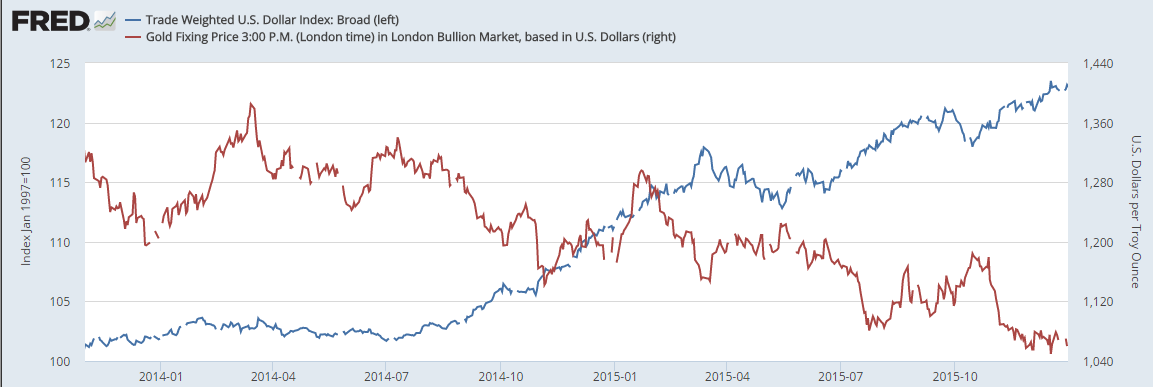
Source: https://fred.stlouisfed.org/graph/?g=33vD
This is the graph of USD versus Gold. The inverse relation between the two is quite evident. This inverse relation can broadly be attributed to two reasons –
- When the dollar decreases in values concerning another currency, then the value of the other currency increases. With the increase in the currency value, the demand for commodities, including Gold tends to increase. As the demand for gold increases, the prices too tend to increase.
- A falling US dollar becomes less attractive to investors; the investors tend to look at parking their money in safer havens such as gold.
Having said this, one should be aware that this may not always be true. There could be instances when both gold and USD tends to increase. For example, think about a crisis in Saudi Arabia (declining oil prices), domestic investors may want to move away from investments in Saudi and park it in safer assets such as Gold and USD, thereby increasing the value of both these assets.
Either way, it must be clear to you now that USD has a role to play in the directional movement of Gold. Having said, one must study the correlations between various variables and gold to see if any correlations actually exist. For example, an increase in the US federal rates tends to strengthen the US Dollar. Under this Gold, price should reduce. But this does not necessarily happen all the time, and if I’m right, the correlation between Gold and Federal rates is just under 0.3.
I understand the discussion above is counter-intuitive, as in earlier I mentioned a strong dollar tends to push gold prices down. Still, the factors that influence USD may not actually have a strong bearing on Gold itself.
Confusing? Yes, it is, I agree.
So how would one actually trade gold? One of the best ways to trade gold is by studying its demand and supply. Demand and supply factors are many and complex, especially for an international commodity such as Gold. However, the demand and supply pressures reflect themselves in prices and a sense manifest themselves in the form of charts, and charts can be read using ‘Technical Analysis’, and this is how you can develop trading insights in gold.
I’m a huge fan of Fundamental Analysis when it comes equities, but when it comes to commodities and currencies, I resort to charts.
8.5 – Technical Analysis of Gold
If you are not familiar with Technical Analysis (TA), then I’d suggest you read the module on TA.
One of the key attributes of TA is that TA can be applied to any asset class, including currencies and commodities. Let me develop some trading notes on Gold by employing TA. Hopefully, this will give you a sense of how to apply TA on Gold.
When I trade Gold, the objective is obvious – it is a short term trade, and there are no intentions to carry the trade for say more than a few days.
The very first thing that I do when developing a trading view is to look at the long term chart of the asset; by long term, I mean at least 2 years. I’ll do the same here; I’ll look at the end of day Gold Bees (ETF) chart for this. Do note, and I will use this chart to develop a rough idea on the primary trend of Gold and also observe critical price points if any.
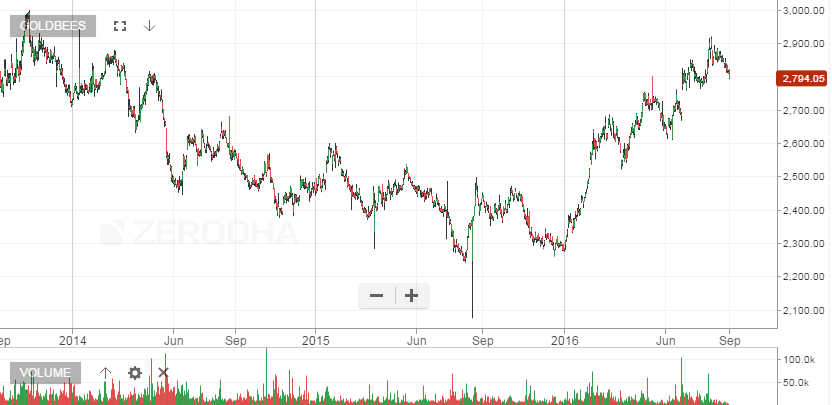
From the chart above, I note the following points –
- Gold declined to start from late 2013, all the way to late 2015.
- Prices bottomed over the last few months of 2015.
- Gold in fact formed a double bottom between Sept-Dec 2015.
- Prices have been trending up since early 2016.
- Traders have bought Gold at every decline starting from early 2016.
- Clearly, the bearishness in gold is no longer there, and this is evident given the fact that gold has scaled back to 2013 prices.
With all this, I can conclude that I’d be more comfortable with long trades than short, but this does not mean that I will not short Gold. I would if the risk to reward is enticing enough. However, if I short Gold, I will always be aware that traders out there are looking for opportunities to buy gold at every dip; hence I will be quick to cover my short position. I was hoping you could do note, until this stage, I have only developed a broad-based view on Gold and have not ventured into any specific price levels.
I would now be interested in looking at a short term chart of Gold, in identifying trading opportunities if any. Please have a look at the chart below, before we get into identifying trading opportunities (for which we will have to look at the right side of the chart), let’s spend a little time on the left side of the chart.
The starting point of this chart is sometime in late 2015, and till about the end of June 2016; there is pretty much no activity. This is evident when you look at both the price and volume. The volume is almost non-existent, and the prices tend to gap up and down. Can you guess why?
Well, remember Gold contracts are introduced almost a year in advance, for example, the Oct 2016 contract (which we are looking at), would have been introduced around Oct 2015. However, this contract does not attract any liquidity till it nears its actual expiry, i.e. October 2016. If on the other hand, our markets were very vibrant with lots of liquidity, then probably this contract would have attracted liquidity much earlier.
Anyway, let us now look into the left side of the chart and identify trading opportunities if any. I’ll repost the chart emphasizing the recent candles; I have overlaid 9 and 21-day exponential moving averages on the prices –
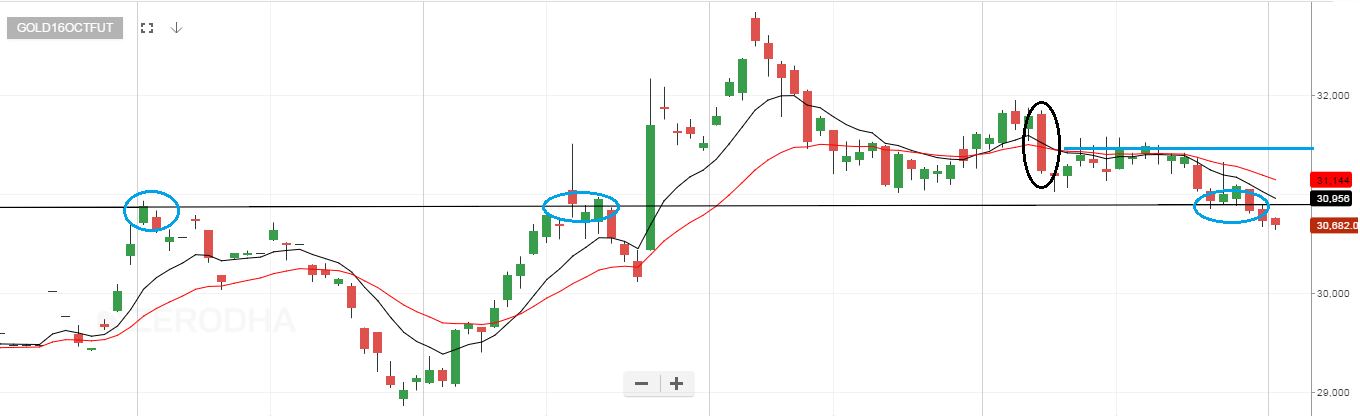
- The current market price is below both the short term averages.
- There are three price action zones in the recent past at around 30956 (I’ve encircled the same in blue circles), and since the current market price is below this level, 30956 becomes an immediate resistance.
- In the recent past, we can see a Bearish Marubuzo formed (circled in black), which has played out well. Traders may be booking profits on this one.
Considering all the above, I would be looking at buying opportunities in Gold, the moment it crosses the resistance level of 30956. Notice, this also coincides with the two short term moving averages, which further encourages me to go long. However, if the price of gold stays below the resistance level, I would hesitate to short for reasons we discussed earlier. So, in summary, my trade would be something like this –
- Position: Long
- Price: Above 30956
- Target: 31418 (have placed a short blue line)
- Stoploss: 30700 (current market price)
- Reward to risk assuming I’m going long at 30956: 1.8
- % move from entry – 1.5%
Not a bad trade from a reward to risk perspective I’d think. Also, since we are looking a 1.5% move, this may pretty much happen in a single day.
Anyway, the whole point here is to elaborately explain to you that TA can easily be applied to commodities such as Gold.
I hope the last two chapters have given you enough information on Gold, this, in my opinion, is put you in a good spot to get started in trading Gold.
Onwards to Silver!
Key takeaways from this chapter
- The price of Gold if fixed twice a day in the AM & PM session in London
- Only designated banks can participate in the London fix.
- India too has a gold fix, similar to London fix – however, there is some circularity here as traders tend to look at the prices of MCX.
- The spot price of gold in US and India differs mainly owing to the additions duties, taxes, and charges that get added in India.
- Since spot prices vary, so does futures price.
- Dollar and Gold are inversely related.
- Commodity fundamentals are complex to understand. Hence traders tend to look at demand and supply.
- Demand & supply reflects in the current price, and also manifests itself in charts.
- You can apply technical analysis on Gold and other commodities
Hi Karthik !
I am going through your content on Commodity trading in Zerodha varsity. Apparently it was written around 10 years back and most examples are given from 2015-16. You need to update this content as per the current practices availabe for trading at MCX as well as NSE so that we can appreciate the content better.
Although most concepts may still be same, but people can relate better if you at least change the examples, prices, Lot sizes of current dates , say in March, 2026.
Thanks
Pranay Sharma
Understandable, will do. But we are doing better – https://varsitylive.zerodha.com/home , we run live classes on commodities and multiple other topics here.
Hi Sir.. I am trading in goldpetal futures for the first time.. Will there be a nudge or notification in zerodha to close current month contract(when it\’s due) to avoid physical delivery so that I can rollover to next month contract?
As far as I know there is no such nudge. Its best if you can keep track whenever there is an open position.
Hi karthik sir,
Sir I don\’t want to trade gold on F&O as of now but rather i am planning to make Investments in gold on monthly basis for around 10 – 15 years. Kindly disclose any option from below or apart from that based on LTCG, taxes etc….
1. Can I put it in Gold Mutual funds?
2. Can I invest in Goldbees on ETF?
3. Can I invest on Physical gold?
I\’d choose Goldbees, Prashanth.
1) For the last couple of days Gold is Falling drastically…The reasons for this was cited as US Dollar strength and a possibility of further rate Hike…But i have a doubt weather these are the reasons or if there was any other reason considering the fall was deep…or Weather this unclear rate hike view by fed had created a panic or say created who is 1st to book ptrofit mindset before some others book hence making prices fall???
2) Also I want to know where does all this money will move weather to US Bonds??? If so Bond yield must have gone up considering the demand but yields actually fell…Please correct me if im wrong in any assumptions…
1) That could be the larger reason as gold is an international commodity. Apart from that, locan demand and supply situation also matters.
2) It will chase higher yeilding assets, Siva. Maybe US bonds, US tressuries, or even stocks (based on risk appetite).
Sure Sir, thank you for your consideration!
Also had 2 more things to ask you –
1) Are Sovereign Gold Bonds really gold backed? Does RBI hold physical gold for every unit of SGBs? – As per my research, most of the blogs over internet said that \’YES\’ they are gold backed. But I really doubt this, because basically RBI introduced SGBs in order to cover up the trade deficit caused due to gold imports, so why would RBI have physical gold backed for SGBs when it won\’t make any difference on trade deficit. I think SGBs unfortunately are more like Rs 500 notes ie., not gold backed, just paper with RBI backing! 😂
2) Are there any active Inflation Indexed Bonds in India, which can be bought by Retails Investions over RBI NDS-OM for Retail – As per my research, I searched for them over RBI NDS-OM but could only found T-Bills, Fixed Rate Bonds and STRIPS.
1) No, its not backed by physical gold. Its backed by Govt of India 🙂
2) This option is there – https://m.rbi.org.in/scripts/FAQView.aspx?Id=91 don\’t know how liquid these are.
Sir I contacted Nippon Fund Manager over LinkedIn, the conversation had 2 key takeaways:
1) He said “….Yes the retail physical bars are at a premium”
2) He said “…. 1 unit = 0.01g less expenses”
Although he was kind enough to reply, I didn’t got much information about the technicalities, like he was very brief with answers, so couldn’t understand why the arbitrage isn’t possible. You got any information sir?
And yes, nothing is free in the market, my main objective with this study was to just get a reference price to compare whenever I purchase physical gold in future from jewellery shops 🙂
Hey Shubham, not really. But I\’m so happy to see your perseverance to find the answers 🙂
I\’ll take this up a topic and do a Social media post on Instagram. Can you please keep an eye there?
Sir, the NAV of Rs 50.16 which I considered in my question above is after considering all these charges. Here is an extract from Scheme Information Document-
“NAV of Units under the Scheme shall be calculated as shown below:
NAV ( Rs.) =
[Market or fair value of Scheme’s investments + Current assets – current
liabilities and provision (including accrued expenses)] divided by
No. of Units outstanding under Scheme on the valuation date”
I need to dig up this as well. But being in markets for so long, all I understand is that there is no free money 🙂
Not everyone can request for physical gold, but once you have 1,15,000 units (called \”creation unit size\”) of GoldBees you can place a request at AMC for redemption in physical gold (In the arbitrage opportunity above I have assumed having 1,15,000 units). Here is an extract from the Nippon GoldBees Scheme Information Document on how to redeem in Physical Gold directly from AMC, instead of selling the GoldBees at NSE –
\”Procedure for Redemption in Creation Unit size
The requisite number of Units of Nippon India ETF Gold BeES equaling the Creation Unit has to be transferred
to the Fund’s Depositary Participant account and the Cash Component, if applicable to be paid to the AMC/
Custodian. On confirmation of the same by the AMC, the Custodian will transfer the Portfolio Deposit by handing
over the physical gold of the predefined purity and quantity to the Investor and pay the Cash Component, if
applicable.
The AMC may Redeem Creation Unit prior to receipt of all or portion of the relevant number of Units of Nippon
India ETF Gold BeES in certain circumstances where the Unit holder, among other things, posts collateral to
secure its obligation to deliver such outstanding Units of the Scheme.
Also, the Fund may allow cash Redemption of Nippon India ETF Gold BeES in Creation Unit size by Large
Investors and Authorised Participants. Such Investors shall make Redemption request to the Fund/AMC
whereupon the Fund/AMC will arrange to sell physical gold on behalf of the Investor. Accordingly the sale
proceeds of physical gold after adjusting necessary charges/costs and prevailing Exit Load will be remitted to the
Investor. The minimum number of Nippon India ETF Gold BeES that can be Redeemed for cash directly with the
Fund will be announced by the Fund from time to time.
The Portfolio Deposit and Cash Component for the Units of the Scheme may change from time to time due to
change in NAV. The Fund may from time to time change the size of Creation Unit size in order to equate it with
marketable lot of underlying physical gold and instruments.
The Redemption request can be made to the Fund in a duly filled Redemption form. Redemption Forms for
Redeeming the Units of Nippon India ETF Gold BeES can be obtained from the office of AMC and Registrar and
Transfer Agents.\”
Sure, but that also means there are custodian, warehousing, safe transportation, and transfer agent changes I guess? That will add to the costs too.
Since I am taking Gold Bars from GoldBees and then selling those same gold bars to Jewellery shop, why would there be any making charges? Since making charges are only incurred when you make necklaces, rings or other ornaments from the gold bars, which I won’t do, I will simply buy gold bars from GoldBees and sell them shopkeeper to get the arbitrage profit!
I asked one my friend who does stock market the same question, what he advised me was that 1 unit of Goldbees is not ‘exactly’ 0.01 grams it’s ‘approximately’ . And he said 0.01 is a rounded up number for 0.008 grams of gold per unit of Gold Bees, if we use 0.008 instead of 0.01 there won’t be much arbitrage left! What are your views on this sir?
I\’m not aware of the 0.008 grams bit. But, how will you take gold bars from Goldbees?
But sir isn\’ there an arbitrage opportunity here, if I buy 1,15,000 units of Gold ETF (which is the creation unit size for GoldBeez) for 1,15,000* Rs 50.16 [Gold Bee ETF Price] = Rs 57,68,400 and ask Nippon to redeem my 1,15,000 units in physical gold, then I will get 1,15,000*0.01 grams per unit = 1150 grams of physical gold. Now I can take these gold bars to Jeweller Shop near by and sell them for Rs 60,000 per 10 grams which will amount to Rs 60,000 into 115 tola = Rs 69,00,000, my arbitrage profit here would be Rs 11,31,600 without considering taxes as in both cases gains will be taxed as per slab rates. Why this won\’t be possible sir?
But if you end up giving gold bars to the jeweler, he will still levy making charges right? Maybe you should check with the local jeweler and figure out what would be the making charge + wastage to get the exact idea.
Sir why is GoldBees prices and Gold Shop prices are different?
I went to a gold shop today and asked for the gold price, he quoted Rs 60,000 per 10g.
So I just wanted to cross check price of gold ETFs on NSE, so I went for GoldBees scrip which quoted Rs 50.16, was surprised, how it can be so low, so i went to Nippon Site and found that 1 unit of GoldBees ETF is approximately equal to 0.01 grams of gold. Using this information if we calculate gold price it would come to Rs 50,160 per 10g [Rs 50.16/0.01*10].
My obvious question here is why there is such a huge difference in price in gold at nearbuy shops and at NSE, like the difference is Rs 60,000 – Rs 50,160 = Rs 9,840 per 10g, why so????
Shubham, the shop keeper, would have added his making charge, expenses, and profit margin, hence the prices are higher 🙂
Greetings Sir,
Does Dow theory apply to Gold(commodities)
As well?
Thanks!
Yes, you can use the concepts of Dow theory (of for that matter any other aspects of TA) on any asset, be it equity, forex, or commodities.
both the contracts gold and gold mini have same expiries. So is it possible that they don\’t converge on expiry
Ah ok. I thought you were talking about calendar spreads. If they have the same expiry, they will converge.
so is it possible that both the contracts don\’t converge at the expiry
Yes, given both contracts have different expiries.
why there is still a difference of about 150 points in the gold and gold mini contracts Feb expiry the difference has been there since December and I have been watching them since then and closest they converged was for 50 points which was about a week ago and now close to the expiry dates of both the contracts they have again diverged by 150 pints.
Why is it so?
This can happen due to the individual contract\’s demand and supply situation, Shivansh.
Sir, there is also a kind of spinning top candle before the rally in the first chart 🙂
I guess so 🙂
Why price of gold futures varies with month of delivery ie aug less than sept etc
Because the near month is more liquid compared to far and mid-month.
Hi Karthik,
For Every share, there is spot chart and future chart. Gold futures I understood from your chapters but which chart to refer for Gold Spot price analysis (in INR)
Thanks
For Gold spot you will have to track the international prices.
Sir do you trade forex and commodities
Yup, at one point I traded everything that moved 🙂
Commodity segment is not active aisa dikha raha last six months ka bank statement upload kiya hai track karne ke bad segment active dikha rahaa lekin commodity me fund add karate samay segment is not active dikha raha
Please contact the support desk for this Santosh.
Hello Sir,
I\’m really confused with this, please help me out.
So, basically there are 3 different prices for gold.
1. Spot (Price which bullion markets decide)
2. Market (Price at Jewellery stores set by spot price)
3. Derivatives (Futures/Options)
So, here spot price is decided by various macro/micro economic factors and then market price is decided and derivatives have underlying price of spot market.
As of today i.e. 18th may, 2020
1. Spot price available on MCX – INR 40,989
2. Market – INR 48,880
So, Jewellery owners purchase gold at spot price and then decide market price.
Sir, please correct me if I\’m wrong, I\’m really confused by seeing different prices.
Sort of. MCX price acts as a reference price here.
Hello Sir,
Which is the best source to acquire spot price of gold in india?
As of today i.e. 12th may, 2020 –
Spot price of Gold (big) Ahmedabad on MCX is INR 40989/- but on Google it is 47525/-
Why is this huge difference?
I\’d suggest you stick to the MCX price.
if i have bought gold from the mcx in delivery how can i resale it and what is the procedure
We do not support the physical delivery of commodities, unfortunately I won\’t be able to help you with this.
In fact, each and every time there is any sort of global/domestic uncertainty, investors flock to buy gold. – Kartik Sir
Your words stands 100 % true in this corona crisis.
When shares were dropping down everyone went for safe heaven.
Thank you
Yeah, Gold has that safe heaven perception.
Hi sir, that for the explanation 🙏
Btw, who standardise these formula? Is it SEBI?
Does every country uses same formula to find the fair value of the future contract?
Thanks
It is a standard pricing formula which is globally used.
Sir, I have doubts reg the future price
For equity, I can easily understand the future price.
Futures Price = Spot price *(1+ Risk free rate – dividend)
But for commodity, what does the term e(rt) refers to
Future Price = Spot price*e(rt)
Can we please explain in detail, or kindly point me to a link where I can learn more about this.
Thanks🙏
e = mathematical constant
r = risk free interest rate
t = time.
Sir how many time this notes available in \”HINDI\”
Hi
I want to ask that at present zerodha doesn\’t allow to trade in gold petal March 2020 future. But on charts there are fluctuations on the prices.
Moreover even after market closes the prices continue to fluctuate.
How can the price fluctuate after market hrs??
Any other broker allow to trade in far month gold future??
I guess Gold Petal is active. Maybe your order is not going through for insufficient margins? Can you please double-check?
why there is no option contract in gold ?
Gold options are there on MCX.
Hi Karthik,
That\’s what I am trying to understand \”the technicalities\”, Are there any restrictions imposed by exchange about this? Gold has physical delivery model I believe, Could that affect it in any way? Are there any other gotchas like this to watch out? I am looking for information about Gold/Crude Oil/USDINR on the same topic if you could help out. Most importantly Margin Calculator for Gold options is not working, it doesn\’t show the margin required, Can you please check that too?
Are covered calls possible with Gold futures and options? Is there any catch to it?
Hmm, I\’m not sure Vibhore. You will have to buy futures and sell the OTM options I guess. Will check the technicalities.
Are the Gold and Silver contracts that have been made available in NSE and BSE tradable in Zerodha. I am unable to add them to watch list. thx
Not for now, Priya. But soon yes.
If I am a long term investor with time horizon of 5 to 10 years and I want to protect my assets during bear market than in case of nifty 50, when 50 SMA crosses below 200 SMA I sell all my securities and invest in gold etf until 50 SMA again comes above the 200 SMA. Is it a good strategy sir?
Yes, however, if you are a truly long-term, then I guess this exercise is not required. I\’d suggest you invest and forget about it. But do make sure you are investing in a solid business.
can i carry forward my position in gold till next expiry date. If i want to invest in gold for 6 months to one year, what is the option? is there enough liquidity in Gold ETF\’s.
Yes, Gold ETFs are the best way to carry the position forward.
why we dont have dmat trading form like equities in gold contracts? i dont understand the reason. paying full margin/value and holding co like ETF in gold is the requirement. please explain?
ETF is like a share, Ashok. Just like the way you pay full cash while paying for a share, you pay full cash for ETF.
What is the procedure to take physical delivery of gold ? I have read somewhere to contact one\’s own broker to request him to take physical delivery. Is it true? Please suggest solution for physical delivery of gold of a contract purchased on MCX.
We do not support physical delivery of any Commodities. Usually, the process involves you to intimate your broker about this and carrying forward the contract to expiry.
Hi Karthik,
I wanted to check on TA that in case of commodities or currencies, only candlestick patterns come in use, not the S&R or other indicators. I believe so. What are your views?
All TA techniques are applicable to assets which have organised time series data like stocks, currencies, and commodities. This is also applicable across all time frames – intraday, daily, weekly etc.
hi, i want to know that if i have different arbitrage ideas with different exchanges in the world, do you provide me the account for arbitrage ??
No, we are just trading members across leading Indian exchanges.
Again excellent effort towards spreading knowledge on commodity part as well ……. this is a great thing from you and team zerodha …..though I am trading commodity since more than a year … now able to understand and relate mistakes have done in past …….
just one request …. as kite or pi dont have base commodity charts ( like default nifty50 ) but have only futures charts resulting unable to see long term charts of commodities , is there any plan of adding base prices in terms of charts ?
If the spot rates are available with MCX, then we would be able to show it on Kite. By the way, we do have Nifty 50 spot chart on Kite.
Hi Karthik
Where else can we obtain chart of historical spot prices of commodities …. I would like to see long term price chart of spot prices of metals like gold, silver etc. for the purpose of technical analysis ….. Could you pls suggest a source ….
Hi Karthik,
1. Why the prices are different for GOLD and GOLDMini contracts for same expiry?
2. Why Goldpetal prices are too much different from GOLD?
3. Why Goldpetal roll over premium is so low comparing to GoldMini?
1) Attributable to demand and supply
2) Same underlying, different contract sizes
3) Not sure, need to check this.
Why this module is not available for download like other modules?
Takes time. We are working on it. Thanks for your patience.
Hi sir,
I want to know about the factor which effect the gold prices specific to indian market?
There was a news regarding option feature in gold trading? Do you know from when it will start?
Thanks in advance
No options on commodities yet. Gold is an international commodity, hence its prices depend on international demand supply dynamics.
Hi Karthik,
what is meant by gold bees(ETF)
Thanks&Regards
It is an Exchange Traded Fund (ETF), whose value depends upon the price of Gold\’s spot price. In fact all ETF;s have and underlying theme, whose value depends upon the price of underlying.
Dear Sir,
I would like to thank you for effort you have put in to teach us here. It is great sir. Hats off to you.
Sir we will be more glad if you put these lesson in Video form if possible. Thanks a ton in advance
Thanks for the kind words Ajay. Videos take in a lot more efforts and bandwidth, something we cannot afford at this stage. You will have to make do with this format for now 🙂
New chapter >.< we want new chapter
Today, by end of day today!
Sir, very much thank you for this chapter.
Sir in the last chart price is below the line joining three price points and acts as a resistance to price, the price is below the resistance line then why not we short rather than waiting for price to cross line to go long.
Please explain this.
Well, you certainly can do that, really depends on your conviction and the way you develop the trade thesis.
Hello sir, please let me know about trading with use of Excel sheets.. I have no idea about this tool so pls suggest me if any module u covered on this or where i can get knowledge about this. Thanks.
No, we do not have a module on excel as of now.
Appreciate your efforts in explaining the markets in such a easy to grasp way. Varsity is by far the best as far as understanding the markets and its technicalities is concerned. Sir, with the introduction of options in commodities recently, will you please include a topic on the same? Thanks.
Thanks for the kind words Manoj.
Options on commodities will work exactly the same as that in Equities. Suggest you read through this module once – http://zerodha.com/varsity/module/option-theory/
Sir we are waiting for next chapter..
Next chapter on Silver will be delayed a bit, maybe 1st week on Oct. Couple of things have come up, which I need to finish before I can put up the chapter on Silver. Thanks for you patience.
Sir is there anyway to get 10 or 15 min. IEOD data for past 6 months of gold, as to backtest my strategy on Pi.
Can you please email – [email protected] for this? Thanks
Dear Karthik.
I want to analyse the EOD Gold charts for last 2 years. But if I go to the latest contract in Gold on PI or Kite, I cannot get the historical data. The workaround to study the trend is to use Goldbees . But there is no such ETF in case of Crudeoil.
1) Where can I get the historical data time series (continuous futures) for Gold with price shown in INR ?
2) If I have last few contracts data, how can I create a continuous time series data with this ?
Thank You.
Can you please email – [email protected] for this? Thanks.
Which timeframe should be used to trade gold for short term trading
If you are trading intraday, you could look at 10 or 15 mins candles.
Hi Karthik,
Gold bee charts : from where we can get these ?
Regards,
Madhusudan
You can get it from Kite – https://kite.trade/docs/kite/#charting
pls include a topic on how to make profit by hedging commodities. Tx
Calendar spreads is one way for this.