 5.1 – Correlation Matrix
In the previous chapter, we successfully calculated the variance-covariance matrix. As we discussed, these numbers are too small for us to make any sense. Hence, as a practice, it always makes sense to calculate the correlation matrix when we calculate the variance-covariance matrix.
So let us go ahead and do this.
How is the correlation between two stocks calculated? Well, hopefully from the previous chapter, you will recall the formula for correlation –
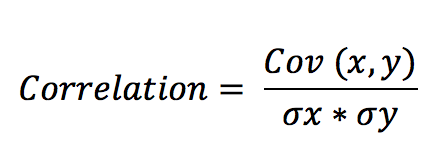
Where,
Cov (x,y) is the covariance between the two stocks
σx = Standard deviation of stock x
σy = Standard deviation of stock y
This works fine if we have 2 stocks in the portfolio, but since we have 5 stocks in the portfolio, we need to resort to matrix operation to find correlations. So, when we have multiple stocks in the portfolio, the correlations between stocks are all stacked up in a n x n (read it as n by n) matrix. For example, if it is a 5 stock portfolio (5 being the n here), then we need to create a 5 x 5 matrix.
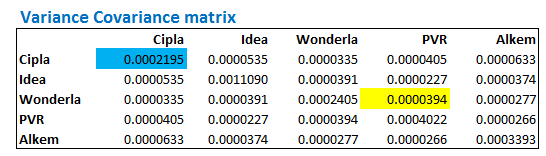
The formula for calculating the correlation remains the same. Recall, from the previous chapter, we have the variance-covariance matrix. For the sake of convenience, I’ll paste the image again here –

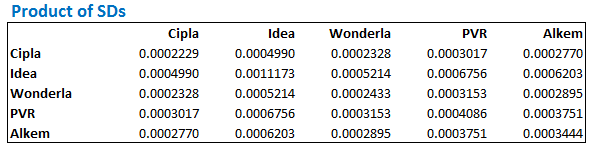
This takes care of the numerator part of the formula. We need to now calculate the denominator, which is simply the product of the standard deviation of stock A with the standard deviation of stock B. If the portfolio has 5 stock, then we need the product of the standard deviation of all possible combination between the stocks in the portfolio.
Let’s go ahead and set this up.
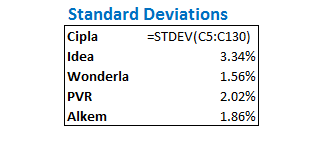
We first need to calculate the standard deviations of each of the stocks in the portfolio. I’m assuming you are familiar with how to do this. You just need to use the ‘=Stdev()’ function on the daily returns array to get the standard deviations.
I’ve calculated the same on excel used in the previous chapter. Here is the image –
Given that we have the stock-specific standard deviations, we now need to get the product of the standard deviation of all possible portfolio combination. We resort to matrix multiplication for this. This can be easily achieved by multiply the standard deviation array with the transpose of itself.
We first create the matrix skeleton and keep all the cells highlighted –
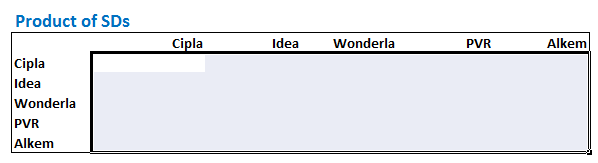
Now, without deselecting the cells, we apply the matrix multiplication function. Note, we are multiplying the standard deviation array with the transpose of itself. The image below should give you an idea, do look at the formula used –
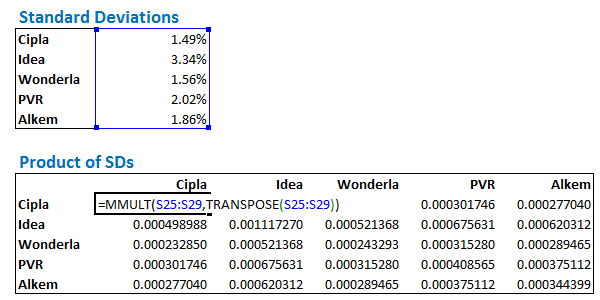
As I mentioned in the previous chapter, whenever you use matrix or array function in excel, always hold the ‘ctrl+shift+enter’ combo. The resulting matrix looks like this –
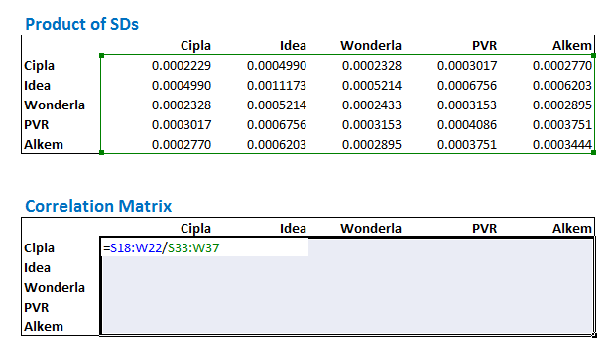
At this point let me paste the formula for the correlation again –
The numerator is the variance-covariance matrix as seen below, and the denominator is the product of the standard deviations which we have just calculated above –
Dividing the variance-covariance matrix by the product of the standard deviations should result in the correlation matrix. Do note, this is an element by element division, which is still an array function, so the use of ‘ctrl+shift+enter’ is necessary.
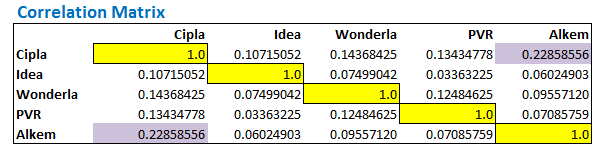
The resulting correlation matrix looks like this –
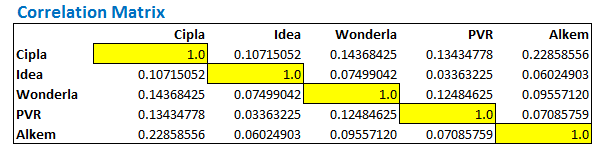
The correlation matrix gives us the correlation between any two stocks. For example, if I have to know the correlation between Cipla and Alkem, I simply have to look under the intersecting cell between Cipla and Alkem. There are two ways you can do this –
- Look at the row belonging to Cipla and scroll till the Alkem column
- Look at the row belonging to Alkem and scroll till the Cipla column
Both these should reflect the same result i.e 0.2285. This is quite obvious since the correlation between stock A with Stock B is similar to the correlation of Stock B with Stock A. For this reason, the matrix displays symmetrically similar values above and below the diagonal. Check this image below, I have highlighted the correlation between Cipla and Alkem and Alkem and Cipla –
The correlations along the diagonal represent the correlation of certain stock with itself. Do note, the correlation numbers above the diagonal are symmetrically similar to the correlation numbers below the diagonal.
Needless to say, correlation of Stock A with Stock A is always 1, which is what we have got in the diagonal and the same is highlighted in yellow boxes.
5.2 – Portfolio Variance
We are just a few steps away from calculating the Portfolio Variance. As I have discussed earlier, we need the portfolio variance to identify the extent of risk my portfolio is exposed to. With this information, I’m no longer driving blind. One can develop many other insights based on this. Of course, we will talk about this going forward.
The first step in calculating portfolio variance is to assign weights to the stocks. Weights are simply the amount of cash we decide to invest in each stock. For example, if I have Rs.100, and I decide to invest all of that money in Stock A, then the weight in stock A is 100%. Likewise, if I decide to invest Rs.50 in A, Rs.20 in B and Rs.30 in C, the weights in A, B, and C would be 50%, 20%, and 30% respectively.
I have arbitrarily assigned weights to the 5 stocks in the portfolio –
- Cipla @ 7%
- Idea @ 16%
- Wonderla @ 25%
- PVR @ 30%
- Alkem @ 22%
There is no science to assigning weights at this stage. However, at a later point in the module, I will discuss more this part.
The next step is to calculate the weighted standard deviation. The Weighted standard deviation is simply the weight of a stock multiplied by its respective standard deviation. For example, Cipla’s standard deviation is 1.49%, hence its weighted standard deviation would be 7% * 1.49% = 0.10%
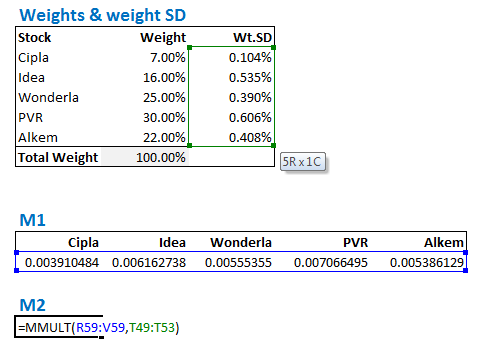
Here are the weights and the weighted standard deviation of 5 stocks in the portfolio –
Do note, the total weight should add up to 100% i.e the sum of the individual weights in stocks should add up to 100%.
At this stage, we have all the individual components needed to calculate the ‘Portfolio Variance’. The formula to calculate the Portfolio Variance is as shown below –
Portfolio Variance = Sqrt (Transpose (Wt.SD) * Correlation Matrix * Wt. SD)
Where,
Wt.SD is the weights standard deviation array.
We will implement the above formula in 3 steps –
- Calculate the product of Transpose of Wt.SD with correlation matrix. This will result in a row matrix with 5 elements
- Multiply the result obtained above (row matrix) with the weighted standard deviation array. This will result in a single number
- Take the square root of the result obtained above to get the portfolio variance
So, let’s jump straight ahead and solve for portfolio variance in the same order –
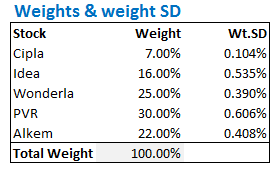
I will create a row matrix called ‘M1’ with 5 elements. This will contain the product of the Transpose of Wt.SD with correlation matrix.
Do note, you will have to select the empty array space and hold down the ctrl+shift+enter keys simultaneously.
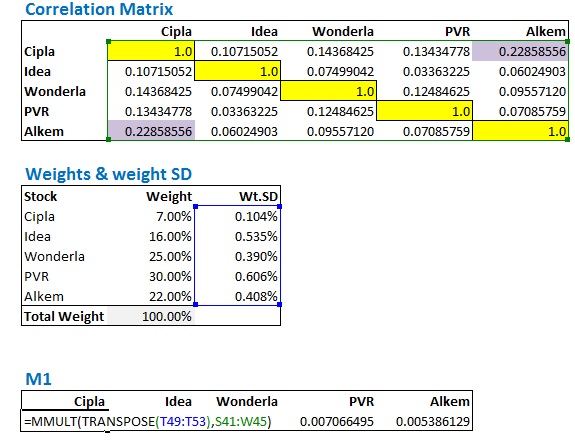
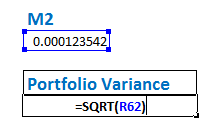
We now create another value called ‘M2’, which contains the product of M1 and weighted standard deviation –
We obtain the value of M2 as 0.000123542, the square root of this value is the portfolio variance.
The result for the above operation yields a value of 1.11%, which is the portfolio variance of the 5 stocks portfolio.
Phew!!
I need a break at this. Let’s figure out the next steps in the next chapter J
Download the excel sheet used in this chapter.
Key takeaways from this chapter –
- Correlation matrix gives out the correlation between any two stocks in a portfolio
- Correlation between stock A with stock B is the same as the correlation between stock B with stock A
- Correlation of stock with itself is always 1
- The diagonals of a correlation matrix should represent the correlation of stock A with itself
- The correlation matrix contains symmetrical values above and below the diagonals
Hello Karthik,
Thank you so much for your classes! I am a regular Varsity reader, and I truly appreciate the way you simplify complex ideas. Your explanations make even intricate concepts in math and statistics digestible for someone without much prior exposure. It’s remarkable, and I am grateful for the effort you put into ensuring clarity.
I’d also like to extend my gratitude to the Zerodha leadership team for their relentless efforts in educating the common man about trading in a simple and accessible manner—without imposing any costs. This approach is rare in the Indian financial landscape, and it reflects the same ethics Zerodha practices with brokerage fees. Kudos to the team for maintaining such integrity!
I wanted to share a point regarding the calculation of portfolio variance (or portfolio standard deviation, whichever term we use). While working through the calculations, I noticed that we can arrive at the same result if we directly calculate: Transpose(weights of each stock) × Variance-Covariance Matrix × weights of each stock, rather than calculating the weighted standard deviation and correlation matrix separately.
I completely understand why you\’ve included all the intermediate steps—to ensure there’s no confusion for readers—but I thought this alternative approach might be worth mentioning as an observation.
Thank you once again for the incredible work you\’re doing!
Thanks for all the kind words, Sreejith. Means a lot to all of us 🙂
The steps is to ensure everyone is clear 🙂
Hello Karthik,
I read the technical, psychology and risk management…My technical knowledge got strong and in last 10 trades ,I won 7 trades which made 30k to 38k…Thanks for all the knowledge shared…but here the actual issues comes into picture.
1.After taking a trade, I feel tense that I may loose profit.
2. After I exit, if rally or fall continues, I am thinking to enter again with new lot…because of I want to be part of complete ralley.This makes me impact on next trades too because this time I should not loose trade like earlier.
3. If I get lose, tries to cover or atleast minimize the lose..first few trades I am completely on control but later messed up.
Actually 3 trades which I loose,made everything changed my winning streak…it made 38k to 26k…so till now how much I gained and includes capital I lost..ofcourse overall 4k from capital rest is profit…how to overcome??? Please give me tip to come out of it…as of now ,I stopped trading ..even I am ready with technical,I need to workout with psychology and risk management….
One last thing, when I trade nifty options, I see stoploss around 18 to 20 approx, but target could be too close and it makes difficulty to spot 27to 30 points as targetby considering 1.5x rule, because I see immediate resistance or support…so probably I m able to book just 10 to12 points , besides fear I am booking just 4 or 5 points only, even I\’m booking profits,I\’m not happy with these results because I know that how professional do…I want to change this complete setup …I feel technical sounds good, but rest too I want to be same position..please help me out…I read psychology and risk management..still I need help:-(
Hello Karthik
Please suggest me
Been there, felt that 🙂
I totally understand what you are saying and I can relate to it as well. The only way to deal with this is to endure it (hopefully with small amounts), and learn from mistakes. There is no other way to do this 🙂
For placing SL, you can refine this based on S&R techniques or even volatility based SL.
Thanks for the reply, but caught my mistake did not do (n-1) while calculating covariance matrix
Got it. Good luck and happy number crunching 🙂
Hello sir, thanks for the great content.I tried the calculations on excel myself(using different stocks) and while calculating the correlation matrix my diagonals are coming out to be equal to 0.99596774, is this acceptable or have i made some error on my end. I have used previous 1 year data of all the 5 stocks.
Thats ok. Its near 1 🙂
Your division is wrong, if you use 125 you won\’t need to force the yellow 1s. You should count the number of excess returns and subtract 1. 125
Thanks, let me recheck this.
Excel sheet did not downloaded
Please try downloading from another browser?
sir, is portfolio variance and portfolio SD same thing ?
Yup, thats right. They both are the same.
Simple, however maybe a silly question. How do I deal with the case where the product of the standard deviations is zero, introducing a zero denominator.
Hmm, its unlikely a zero, could be a small decimal number. Can you try expanding the decimals in the cells and check?
I can see comments feed updating on Varsity home page. Is there any way to get a feed of changes happening to the module chapters so that we are updated for any corrections or latest updates?
Will share that feedback with the team, Amit. Thanks.
Hi
Unable to download excel sheet, please check is it sill available?
Can you please try another browser, Vicky?
Hello Sir, This question was already answered earlier but I was not able to understand it….
So, we have calculated the portfolio variance to be 1.11%…. Let\’s say, my portfolio has an expected return of 20%
Does that mean I will have a deviation of 1.11% in the expected return that is 20% in my portfolio on a yearly basis?
Yes, thats what it means. The variance from the expected return.
Hello Sir!
Great work by you sir! I had doubt regarding the no. of observations we should take for calculation. What amount of historical data is considered to be considered good for all these calculations? 1 year, 2 years, or 5 years? I am trying to apply all these concepts to my own portfolio.
Thanks & Regards,
Omkar
At least a year, I\’d say 🙂
UNABLE TO DOWNLOAD EXCEL File
Can you try another browser, please?
Hi, I\’m a finance student and I\’m trying to implement this to make a variance covariance matrix. I think I completed it correctly; it it possible to review mine for me? If so, how can I send the excel attachment? If it\’s more comfortable for you, I can send a OneDrive link (no download required of the attachment) and it can be viewed via the web.
Thank you!
Jay, I\’m really pressed for time, not sure if I can review individual worksheets. Sorry, but I hope you understand.
I am not getting it sir, what seems off?
no sir, weekly pnls of intraday BNF trend following system and BNF intraday option writing system.
Sure, please do check the calculations again. Something seems off to me.
I did a weekly correlation test on two of my systems and I got -0.22.
Is the negative correlation significant enough?
Is there any other metrics I have to look at?
-ve indicates that the assets move in opposite directions. Are these just stocks in the portfolio?
I was thinking to convert my returns to weekly and find correlation between them.
You can, Mani. Ensure the number of data points match.
sir, how to find correlation between two set of values with different lengths. I am trying to find correlation between backtest values of two systems.
That would be tough. To correlate, one of the key assumptions is to ensure both series has the same number of data sets.
Thank you for the excellent articles.
In the resulting correlation matrix the values in the diagonals representing correlation between the same stocks does not actually equal 1.0 as shown in the screenshot, but is close to one and formatted to display to 1 decimal place in Excel.
Is this an artefact of rounding/truncation through the multiple steps or is something else at play?
Kind regards.
Its actually rounded off by 1/1000th, so its ok, I guess.
Hi,
why does portfolio variance = sqrt (….)? If we are taking the sqrt(..) , it means the portfolio standard deviation, no?
Yes, the square root of the variance is the standard deviation.
Hey Kartik,
Thanks a lot man for sharing your work with us, Actually after getting inspired of uhh I did created a portfolio for Crypto and the Portfolio variance turned out to be =4.859% and later when I did the same thing with your 2nd alternate way then that portfolio variance was completely different which is = 0.344% I don\’t know what mistake I made……can uhh help me out in this?
Thanks
Very tough to analyze this without actually looking at the steps 🙂
Nice Articles, easy to understand for novice investor. Was wondering if these kind of calculation are readily available in Zerodha console/back office?
No Gaurav, you need to calculate these.
Hi sir , thank you for the streamlined content. Never found such clear explanation anywhere. I would like to point out a typo error here. In this chapter , in place of shift – it got printed as shit. You might want to correct this.
Thanks, Yashwanth. That\’s an embarrassing typo, thanks for pointing that out. Will fix it 🙂
ive done it by different method,by calculating overall portfolio return , then applying [=var(……..)] on portfolio return column,
and variance is coming 0.01235% and by sqroot(variance) to calculate standard deviation SD is comin 1.11%.
Ok. Do the values match?
By calculating portfolio return of same cipla,idea,wonderl,pvr and alkem by,w1r1+w2r2+w3r3+w4r4+w5r5
and then portfolio variance on excel by; =var(number1………), (on portfolio returns)
portfolio variance is coming 0.01235%
why is it so?
Do you mean to say that it does not match with the calculations shown in the chapter? Can you try looking at the excel and matching the steps?
Is 1.1% daily variance? How to we find annualized standard deviation from this ?
Multiply this ith square root of time to get the annualized SD.
Sir can you elaborate the meaning of 1.11% portfolio variance?
Think of the entire portfolio as a single stock. The volatility of that being 1.11%.
Hey Karthik,
Did you maintain a trading journal when you started trading? If so can give some tips on how to keep one myself?
Unfortunately no, I never maintained one 🙁
No but when the stock split happens as the per share cost reduces to 1/10th of the pre split amount, hence the daily return shows as -90%. How to cater for this error. Should I change the previous price also by a factor of 1/10 to avoid this error?
Sorry for pestering, but I am really stuck at this stage. Thanks again.
True, hence you need to replace the entire column with the adjusted data. You won\’t have this problem then.
OK, guess we can include that in the portfolio once it\’s built an year of history. But what about the stock split. How do we cater for that?
Yes.
Nothing really changes in a stock split, except that you will have to replace the data with the new adjusted values.
Thanks a ton for such wonderful content. The real beauty is the ease with which the concepts have been explained. Truly a gem for all learners. Two quick queries please, if you could throw some light.
If my data range of the data is from 01 Jan 2017 till 31 Dec 2019, what happens when I add an IPO to my portfolio which launched on 01 Apr 2019. In this case the historical data (prior Apr 2019) will not be there. If i put blank in the daily return column, the matrix throws up an error. Other option is to keep daily return at 0% till the date IPO was issued (avg return will be calculated for the number of days since IPO only). Excess return matrix will also have to be manually set to 0% till IPO date. But will that affect he overall calculation?
Second query is that one of my stocks had a stock split six months back. the face value changed from Rs 10 to Re 1. As the share price reduced the daily return will be erroneous. So how do I cater for that.
It would be great if you could please throw some light on these issue. Thanks a ton!
Agreed. Hence it is best to consider the portfolio without the IPO stock. I know this is not the right thing, but unfortunately, you can\’t help it. Another practice is to only buy stocks which have at least 2 years of trading history.
shouldn\’t it be a standard deviation from the portfolio instead of variance? = sqrt(portfolio variance)
Hmm, unable to get that. Can you please shed more context to this? Thanks.
Sir if I have invested in stock at different period for eg. invested in stock A on 24thdec 2019 in stock B on 1st jan 19, Stock C on 20th feb 19 and stock D and E on 31st march 19.Then to find portfolio variance how many data points should I considered.Should I considered from the date of investment of first stock A or past 1 year data?
Yes Rajat, the idea is to have the data for the stock for at least 1 year.
So Sir inorder to find out portfolio variance that I have invested from 24th dec 2018 onwards I have to consider data of past 1 year from the date of first investment in stock that is on 24th dec 2018.
Yeah, also ensure you have the data for the same period for all the stocks.
how to find portfolio variance if stock invested at different period for eg invested in stock A on 1st april and invested in B on 28th april.
It would still be the same procedure.
Hi, I\’m trying this with a portfolio of over 100 holdings. My correlation matrix is only yielding perfect correlation for the first security, all others are in the ranges of 98%-103%. I have a few outliers, like 106% and 183%. I\’ve followed the guide the best I can and have tried recreating many times. Any idea why this is the case?
How are you doing this, Alyn? Is it on excel?
One of the best checks for the correlation matrix is to see the values at the diagonal. If its near to 1, then probably you are on the right track.
Dear Karthik Sir,
I have been repeatedly trying following all steps very carefully, but unable to get \”1\” value along the diagonal of correlation matrix. Kindly help. what do u think, might be the possible issue with this
Simranjeet, it would be hard to figure out what is going wrong with your excel as there are multiple steps involved. I\’d suggest you retract it or best try rebuilding (if time permits).
Just figured it out man . It was a very fundamental problem. Kindly tell me weather \”MMULT(A,B)\” is equal to \”MMULT(B,A)\” or not. U must be laughing but i was afraid of matrix algebra in school. Anyway Cheers..
I\’m still afraid of Matrix algebra 🙂
Anyway, these two are not the same. You can experiment on excel actually. Btw, check this – https://math.stackexchange.com/questions/2853239/when-is-axb-equal-to-bxa-in-the-case-of-square-matrices
The excel file is wrong. Correlation for same asset should be exactly 1 (even not 0.99999)
Errors:
Average returns
number of data (N=126, not 127)
number of data for variance – co-variance should be N-1 N-1 = 125 to be used to compute variance – co-variance.
Then, correlation matrix will be correct and will give exactly 1 on the diagonal.
My friend, check your results before publishing.
Thanks for pointing that out, Fred. Will go through the sheet again.
Why is portfolio variance a square root of the matrix multiplication? the matrix multiplication should yield a result in the unit of variance, so a square root of that result should yield portfolio standard deviation. Did I miss something?
Reference to your article:
Portfolio Variance = Sqrt (Transpose (Wt.SD) * Correlation Matrix * Wt. SD)
Thanks for the detailed walkthrough!
Yeah, maybe I should have specified –
Portfolio Standard Deviation = Sqrt (Transpose (Wt.SD) * Correlation Matrix * Wt. SD)
Thanks for point out 🙂
Dear Karthik,
I appriciate your effort for providing such a wonderful material on Risk Management. However, there is a thing I would like to clarify from you. As mentioned in the chapter, calculation of portfolio variance can be calculated as,
\”We will implement the above formula in 3 steps –
1- Calculate the product of Transpose of Wt.SD with correlation matrix. This will result in a row matrix with 5 elements
2- Multiply the result obtained above (row matrix) with the weighted standard deviation array. This will result in a single number
3- Take the square root of the result obtained above to get the portfolio variance\”
As per my understanding, #Step 2 should give me the Portfolio variance. If I use the step 3, it will give Standard Deviation of Portfolio.
Please help me understanding the same.
With Regards,
Niteesh Sharma
Yes, that\’s absolutely correct, Niteesh.
Do you have any part talking about correlation between portfolio and benchmark?
I\’m not sure if I\’ve touched that topic, but you can run a correlation between the portfolio\’s equity curve and the desired benchmark. This will help you get started.
Dear K,
If portfolio variance is 1.11, means that portfolio Standard deviation is 10.54%? is this daily STDV of a portfolio???
It means the standard deviation is 1.11%…which is the measure of volatility. Yes, in this case, it is for the entire portfolio and not just a single stock.
Many thanks
Welcome!
Many thanks and much appreciated your response. With the risk of not bugging you would like to ask two more question for the time being
1) If, I use daily adjusted closed price as published on yahoo finance it should be ok?
2) The portfolio variance (for my portfolio) calculated by Equity curve comes to 0.99545% however, the one calculated by the variance / co-variance & correlation method comes to 0.95332% for same set of data. Is it possible?
1) Yes, last time when I was using Yahoo, I remember they were putting up clean data. Not sure if they still do that
2) Possible. I always take the EQ curve one – helps me a quick and dirty estimate and I\’m absolutely fine with it 🙂
Thank you very much sir… You guys are doing a great job. Will bother you when I read the next module 🙂
Yes, please! Looking forward to it 🙂
Hi Karthik – How do we account for dividend / bonus share in the excel sheet while calculating daily return. For Ex. BPCL gave 1:2 bonus which resulted in price falling from 683.70 to 485.55 on 14th July. Should we take this (485.55) price / adjust 13th July price or just ignore this data as one day noise?
Would assume removing one day will not really affect the average but, need your guidance before doing the same.
Yes, you always take the price adjusted for corporate actions. Else, the data will be skewed.
Hi Karthik,
Thanks a lot for your explanation in detail. You have made the difficult subject of statistics very easy.
While calculating the correlation:
\”The correlations along the diagonal represents the correlation of certain stock with itself \”
In your example, it is showing as \”1\”. However, when I do it, I am getting 0.99 and 0.98 values. Not exactly 1. Is it fine?
Glad you thought so, Ruban 🙂
The correlation of a stock with itself is 1, but 0.9999 is also an acceptable value 🙂
Thanks Karthik,
I am getting the values not as \’0.9999\’ but as :
0.9861562
0.9906857
0.9863188
0.9940448
0.9865632
Is this fine too?
Yes, this should be ok.
Hi,
Can you please explain what is the meaning of Portfolio Variance value=1.11%? What does 1.11% indicate here? Does it mean that total portfolio value can move 1.11% up or down when the market goes up or down?.
Yes, that is the risk of an overall portfolio.
Hi Karthik,
Thanks a lot for all your great articles. It\’s simple and very elegant. I have a slight clarification in the portfolio variance formula. Since there is Sqrt, shouldn\’t it be portfolio standard deviation instead of portfolio variance.
Thanks
Interesting, I use both Portfolio variance and portfolio SD interchangeably. But yes, what you\’ve said is technically correct.
Karthik
Now that we have calculated the Portfolio Variance to be 1.11%, what do we understand from the same? Is it good or bad? What should be an ideal variance figure?
Thanks
There is nothing like an ideal variance figure. However, you need to watch out for higher numbers like 2.5-3%. Estimating variance gives you a sense of the risk associated with it.
Thank you for the detailed steps , I have few questions
1. How do we add new stock to already existing portfolio , for example a stock from IPO since it doesn\’t have enough data points
2. Do we wait for enough data points to calculate ? is there a minimum no of data points we should have for calculation ?
3. Can portfolio variance be used to decide to buy or sell a stock , and decide on the weight-age allocation of stock ?
1) That would be tough. We need enough data points to do this
2) No minimum as such, I personally prefer at least 6 months of data
3) Yes you can. Watch out for chapter 7 for more details on this.
Hello sir
In next module would you teach us about algo trading. This just a guess by name \”Trading strategies and systems\”
As on now yes, but there is a lot of demand for a personal finance module as well 🙂