
13.1 – Choose your path
We addressed a very crucial concept in the previous chapter. We looked at how one can determine equity based on 3 different models. Each of these three models on its own merit imposes some sort of position sizing discipline, but clearly that’s not enough. We still need a standalone method to position size. Given this, we will move forward to discuss some of Van Tharp’s techniques on position sizing.
I’d like to talk about three core position sizing techniques at this point, they are –
- Unit per fixed amount
- Percentage margin
- Percentage of volatility
Do note, these models are asset independent and time frame independent. What do I mean by this? This means that you can apply these position sizing techniques to any asset you want. It could be stocks, stock futures, commodity futures, or currency futures. Further you can apply them across any time frame – intraday, few trading session, or even trades extending for over few months.
To understand this really well, I’d suggest you pick a trading system, it could be as basic as a moving average crossover system. Identify entry and exit rules and evaluate the returns you would generated for the given time period. Now for the same set of data, apply one of the position sizing technique (which we will shortly discuss) and evaluate the performance. I’m sure, you will observe a huge improvement not just in terms of P&L but also the stability of the system.
Just to throw some light into how complex this can get –
- Assume you have a trading system – a simple moving average cross over system
- You intend to deploy cash on this and start trading every signal that the system generates
- There are 3 models to define equity and there are at least 3 basic models to define position sizing techniques
- This means you can position size in 3 x 3 = 9 different ways to deploy cash for the same opportunity (signal)
- The P&L for each will be different
However, from my experience, I would suggest you stick one method to estimate equity and maybe 1 or at the most 2 (meaningful) techniques to position size. Anything more may not be a great, in the sense, it would induce complexity, and complex does not necessarily mean better.
So you as a trader need to assess which path to follow based on your temperament. Anyway, let’s get started on the core position sizing techniques.
13.2 – Unit per fixed amount
Let’s discuss the ‘Unit per fixed amount’ model first. This is a fairly simple model. Any trader who has a slight inkling towards position sizing would have explored this model in the initial days. I like and dislike this model for the same reason – its simplicity.
The model requires you to simply state how many shares or lots (in case of futures) you will trade for a given amount. For example, assume you have Rs.200,000 in your trading account and you have the following 5 assets (futures) as your opportunity universe –
- Nifty
- SBI
- HDFC
- Tata Motors
- Infosys
You could simply state that you would not want to trade more than 1 lot of futures per 100,000 of any asset at any given point. Given this, assume you get a signal to buy Nifty, now since there is 2L in the account, you can choose to buy one or 2 lots.
The best part about this model is that it does not complicate the decision-making process. However, there are few problems with this model.
Consider this – the trading system that you follow generates a signal to buy Nifty Futures and at the same time the system signals you to buy Tata Motors. Since you have 2L in your account, you decide to buy 1 lot each. Do note at the point of writing this article, Nifty Futures requires a margin of about 60K and Tata Motors around 72K.
Irrespective of the margin, the rule simply states, 1 lot per 1L. This means, position sizing rule is assigning an equal weight to both the contracts, ignoring the implicit ‘riskiness’ of the asset. To give you a perspective, Nifty Futures has an annualized volatility of around 14% and Tata Motors has an annualized volatility of over 40%. So essentially, you are exposing yourself to a higher risk at the portfolio level.
This in fact, is both good and bad at the same time. Good in the sense that it does not reject a trade based on the riskiness and bad in the sense it does not really factor in risk.
There is another angle here – think about this, consider you are following a trading system to which you apply the 1 lot per 100,000 position size rule. Assume you have a 2 lac capital. Now, further assume that the system performs really well and you are bestowed with multiple winning trades. Now, for each signal, the maximum number of lots you can buy is restricted to just 2. For you to increase another lot or 2, you really need to double your capital or wait for your profits to double up you capital. So in a sense this particular position sizing technique limits the scalability of a system. The only antidote to this is to bring in a much larger account size.
For these reasons, I kind of don’t prefer the ‘unit per fixed amount’ position sizing technique. However, please don’t take my word, I’d suggest you work around and figure out your comfort level with this technique before deciding to adopt or not adopt this as your core position sizing technique.
13.3 – Percentage Margin
The percentage margin is an interesting position sizing technique. I personally think this technique is far more structured than the ‘unit per fixed amount’, technique especially for intraday traders. The percentage margin technique requires you to position size based on the margins.
Here you essentially fix a ‘X’ percentage of your capital as margin amount to any particular trade. Let’s work with an example to understand this better.
Assume you have a capital of Rs.500,000/-, with this you decide that you will not expose more than 20% as margin amount to a particular trade. This translates to a capital of Rs.100,000/- per trade.
Assume you spot an opportunity to trade Nifty Futures, you can easily take this position as the margins for this is roughly around 60K. However, let’s say you spot an opportunity in ICICI, you will be forced to let go of this as the margin for this is close to Rs.105,000/-. This means, ICICI will be out of your trading universe until and unless you increase your capital. Obviously, one should not randomly increase the capital just to accommodate opportunities. Capital should increase as an outcome on profits accumulating in your account.
Anyway, after you initiate the position in Nifty, assume you spot an opportunity in ACC, the margin for this is 90K.
Will you take this position?
The answer to this really depends on the way you estimate equity.
If you consider the total equity model, then you will still consider your capital to be 5L, 20% of which is 1L, hence you can safely take the position in ACC.
However, if you consider the reduced total equity model, then this is how it would work (assuming 20% position sizing rule) –
Starting Capital = 5L
Margin blocked = 60K
New capital = 4.4L
Margin @ 20% = 88K
Given this, you’d fall short by (just) 2K for a 90K position, hence you would have to let go…and as you realize, equity estimation plays very crucial role here.
Lastly, assume, you spot an opportunity which requires a margin of 40K, since you have 88K, you can comfortably take up 2 lots of this position.
So on and so forth.
The percentage margin rule ensures you pay roughly the same margin to all positions. However, the volatility from each position could vary. You could end up with risky bets and therefore altering the entire risk profile of your account.
This exposure to risk is overcome by next position sizing model.
13.4 – Percentage Volatility
The percentage volatility rule accounts for volatility of the underlying asset. The volatility as per this technique is not really the ‘standard deviation’, but rather the daily expected movement in the underlying.
For example, if SBI’s OHLC is 276, 279, 274, and 278, then the volatility for the day is simply the difference between low and high i.e
279 – 274
= 5
To get a sense of the generic volatility measured this way, I can look at the difference between low and high for last ‘n’ days and take an average. However, the only problem here would be that I would be ignoring the gap up and gap down openings. For this reason, Van Tharp suggest the use of ‘Average True Range’ to measure the stock’s volatility.
The ‘Percentage Volatility’ method of position sizing requires us to define the maximum amount of volatility exposure one can assume for the given equity capital.
For example, if the equity capital is Rs.500,000/- then I could make a rule saying that I do not want to expose more than 2% of the capital to volatility.
Let’s work with an example. Here is the chart of Piramal Enterprises Limited (PEL) –
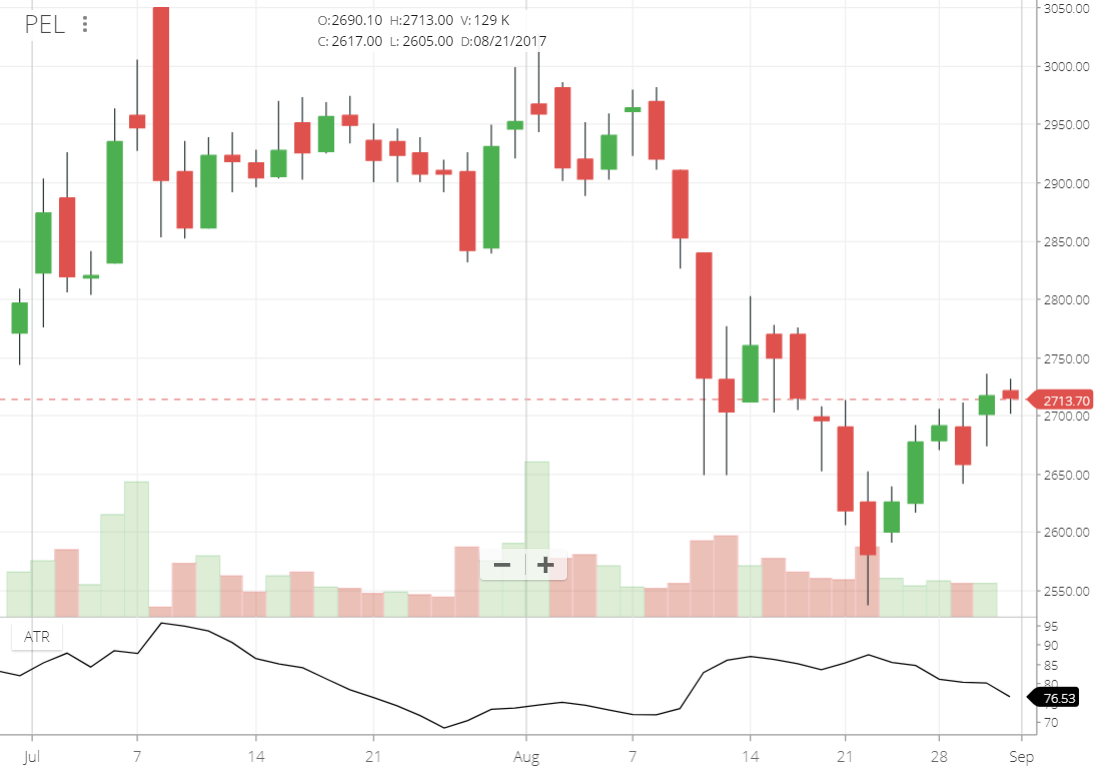
The 14-day ATR is 76. This means each share of PEL contributes to a fluctuation (volatility) of Rs.76/- to my equity capital.
Now assume I spot an opportunity to trade PEL, the question is how many share should I buy considering my equity is 5L and I’ve capped volatility exposure as not more than 2%.
2% of 5L is 10,000/-. This means I should only so many number of shares of PEL, such that the overall volatility caused by PEL is not more than 10k.
Given this, I simply have to divide 10,000 by 76 to find out the number of shares that I can buy –
10,000/76
= 131.57 or about 131 shares.
PEL is currently trading around 2700, which means to say, your overall exposure would be –
131 * 2700
=Rs.353,700/-
I’d suggest you stick to the reduced total equity model for estimating equity here. This means, the capital available for the next trade would be –
500,000 – 353,700
=146,300
Now @ 2% volatility, the capital exposure reduced to Rs.2929/-. Clearly the capital exposure to the next trade would reduce, but the exposure to volatility would remain the same.
Here is an advice (from Van Tharp, of course) if you are inclined to follow percentage volatility technique – the do estimate the total amount of volatility you want to expose your portfolio too. If the number is say 15% then on a 5L capital this works out to Rs.75,000/-.
Think about it, if every position goes against you, then you stand to lose 75k on a capital of 5L on a single day. How does that feel? If your stomach churns, then 15% portfolio volatility maybe a bit high for you.
In the next chapter, we will explore few more concepts before we proceed to understanding ‘Trading biases’.
Key takeaways from this chapter
- Estimating equity plays an important part in position sizing
- Suppose you have 3 ways to estimate equity and 4 ways to position size, then essentially you have a 4 x 3 = 12 position sizing technique
- Unit fixed model requires you to ascertain how many shares or lots you will trade for every ‘x’ amount of capital in your account
- Unit fixed model does not consider risk
- Percentage margin method requires you to define the maximum margin amount you will expose your capital to. You ideally should club this with total reduced equity model
- Percentage volatility measures volatility in term or ATR.
- Percentage volatility equal weights ‘volatility’ exposure to each position
sir , ATR, that you have measured in PEL in what time frame ? WHAT is the ideal time frame for future as i am a swing trader in future .
I\’d suggest you look at end of day charts, Satish. Works best for swing trading.
it\’s really helpfull
Happy learning 🙂
What is that 2929 how we get it can someone explain. Please
Guess that is the indicator value?
I have read it many times about Risk management and money management. I also know the difference theoretically but not sure what that actually means.
My question is what should I learn first? Money management or risk management? Because when I looked up for it, I got lot of different books on both topics. What to go first for?
Start with either as both these are super important. At some stage, topics will overlap.
Thank you so much for sharing this knowledge with the world.. My question is in regard to the section 9. Risk Management for active traders, part 3. In that section you make the statement the models are time frame independent, which I am happy to hear. I am looking into day trading and I am trying to the real life mechanics of the process. So let\’s say that my capital base is 5,000 dollars US. Putting aside the variants of what account value to use for the sizing calculation, let\’s say I just look at my total current account value (equity) today at this hour, or what some call net liquidation value. So assume that the value is currently $5,200, If I use a 1% risk per trade position sizing, my next trade should carry only $52.00 of risk to stop, correct ?? Then my next question is how many of such trades should I have on at the same time ?? Should I put only 1 on at a time ?? Please help. Thanks, AL
AL, I hope you found the content useful.
Yes, that\’s right. It works to 1 trade. But the answer really depends on your overall trading strategy as well.. If for example, you decided to use 50% of your capital for active trade (with positions held for the day or few days) and the other 50% for swing positions (position held for few weeks to months). In this case, its $2.5K for both segments. 1% is about $25.
Then I will first go-ahead with NISM certification Sir
Cool, good luck, Avi!
Sir looking to take up a NISM equity research analyst exam,would it be a preferred choice or Is there any other better choice.
I\’m also looking for CFA once my UG is completed
I think it\’s a good certification from a learning perspective.
Sir I\’m a newbie if I start with 3000 as a initial capital can I apply above techniques
Sir can one start journey with just 3k
And for ex if I make 300 as profits does STCG of 15% is calculated on this
Thank you sir😊
Thats right. These work better with slightly larger capital, Chandu.
Hi Karthik,
I Learned position sizing from a youtube channel, where idea is that we expose a maximum capital loss of 3%.
so now if on any trade my stop loss is of assuming 5 points and my total capital is 50000. number of quantity I buy is = 3% of 50000 / 5 = 500 shares.
can you explain if according to you this is a pros and cons of this method? or what position size method small traders(capital below 1L) should use?
Thanks 🙂
I\’m assuming this is trading capital.
3% of 50K is 1.5K. The Number of shares that you\’d buy is dependent on the share price.
The only issue is that exposure to stock will be very low. So instead, look at it as a max loss of 1500 on the trade. So I\’d risk a max of 1500 on this trade by not exposing more than 10-15% of the entire capital per trade.
Can we apply these methods for trading options, Karthik?
Yup, you can Arvind.
Suppose, If I choose a maximum of 5% volatality for a particular trade for 1 Lakh trading capital ,that means i would risk no more than 5,000. And if ATR indicator for particular stock shows 50, thus allowing me to buy maximum of 100 shares. And suppose if market price of stock is 1,200.
So total money required to go long would be =1,200*100 = 1,20,000.
Which is greater than my trading account money(1Lakh).
What does this scenario, is trying to convey me ? Is there anything need to be restructured other than my risk capacity ?
Vaishak, it just means that you will have to look for trades which fit within your capital available.
Hi Karthik,
I was going through Module 5 (Options Theory for Professional Trading) and I am stuck at one of your calculations for generating the volatility cone (sec 20.2). I am calculating the annualized realized volatility (by calculating the Log normal returns over 10/20/30…./90 days) and the value I am getting is far lower than the value shown in the material for the annualized realized volatility. Can you elaborate on how you got the Annualized Realized Volatility of 41% for Jun-14 (Annualized volatility of Nifty for values 10 days before Nifty expiry). Below I have reproduced my calculation for Jun-14 for calculating the SD and the annualized value for 10 day period before Nifty expiry.
In case I am doing something wrong then do point out.
Date Close Return {Ln(Todays Close/Prior day\’s Close)%}
12-Jun-14 7649.9 0.3%
13-Jun-14 7542.1 -1.42%
16-Jun-14 7533.55 -0.11%
17-Jun-14 7631.7 1.29%
18-Jun-14 7558.2 -0.97%
19-Jun-14 7540.7 -0.23%
20-Jun-14 7511.45 -0.39%
23-Jun-14 7493.35 -0.24%
24-Jun-14 7580.2 1.15%
25-Jun-14 7569.25 -0.14%
Nifty Expiry 26th Jun.
SD 0.88%
Annualised 13.89% (Used 252 days as number of trading days in year 2014)
Amir, the calculations for volatility cone was done by someone else. I need to cross-reference this with him. Let me do that.
what is the margin/capital required for CO ORDER for reliance.explain with example.THANKS
Check this – https://zerodha.com/margin-calculator/SPAN/
Intriguing read on position sizing there, Karthik.
The one thing I\’ve always wanted to know:
Say I want my risk to be constant in every trade, eg: Rs.2000. Now I know in the cash segment, I can always increase/decrease the position size according to the varying stop losses to still keep the risk constant at Rs.2000 in every trade. But can I do this in F & O?
Yes, you can do this by adjusting the limit price.
unit per fixed amount
i think its best one because u really allot the amount which needed to trade a particular stock u added all nrml margin not mis
and it doesn\’t allow to take trade on new opportunity arises but i think from the beginning it was clear that i will only allow limited amount to particular stock .
percentage margin what if other require more margin to trade u just stick 20% so we cant trade
i hated percentage volatility one
the other thing which i want to point out let say we lost from 2 lot now according to %tage margin it allows 1 lot to trade and now u remember odd one u reduced the lot and profit may come. what do u think about my conclusion???????????
Fair enough, Gautam. These techniques help you imbibe risk management discipline and ensures you only trade with the money you have and not over-leverage. If you see, all the techniques kind of imbibe the same philosophy.
Dear Karthik,
I follow S&R strategy. Some stocks give expected returns in a day and most of them in multiple days. So in a sense, i m an active trader as well as portfolio manager. How shall I position size in such a case as daily I m squaring of some stock and adding new stocks? Hope I m making myself clear.
One of the things that you can do is to trail your stop-loss to carry forward your daily positions. This will allow you to maximize and ride on winners.
Firstly i am a great fan of Zerodha Universe products.
Can you please explain how the Percentage volatilty will work in intraday ?? I mean should i take ATR of 14 DAY or ATR of 14 (5-minute Candles), i use 5 Minute candles it s a simple crossover strategy for intraday .
Big Thanks in Advance.
Sourabh
Glad to hear that, Sourabh!
You can take the 14 periods on 5 minutes candle for intraday. This would make more sense.
Hi Karthik,
Any advise on the ideal capital for a comfortable trading for a living? (please take into account indias current cost of living for a middle income family with kids and iam from Chennai)
Hameed – I\’ll be brutally honest here. Assuming you are one of the best trader, you can at the most generate 3-4% ROI in your capital \”consistently\” every month. The key word here is \”consistently\”. So I don\’t know what your lifestyle, assuming you need 50K per month, that means you need about 12-15L capital. I\’m not accounting for taxes.
thank you sir,
i assumed a 30L capital to generate 50k/month with 2-3% return. i dont trade F&O- only cash with TA trend following.
That\’s a very fair assumption, Hameed!
Good luck and stay profitable.
Text correction in below line – 3 x 3 = 9
This means you can position size in 3 x 3 = 6 different ways to deploy cash for the same opportunity (signal).
Oops, will fix this 🙂
Dear Karthik, thanks a lot for this lovely series. I have been in the market for many years mostly as med/long term investor and was not following any position sizing &results were that p&l was never optimized. Now after going through the whole series I can truly appreciate how we need to bring discipline to the trading/investing approach. however I do have a queries specially from investment point of view
– Should we take a leeway in terms of position sizing while investing in a profitable trade. for example, I am seeing a stock is moving north in my portfolio and I am a med to long term investor. Should I forgo position sizing and invest higher %age of my portfolio?
– Also portfolio size should only be increased from profits or should we keep on adding depending on If there is a winning stock or averaging a losing one. (I am committing mistakes here while averaging out on losers or allocating higher position to stocks which I later realized are not performing well)
– Would you suggest some model portfolio spread, let\’s say out of every 100 rs, 20 rs for trading, 30 for value investing in growth stocks, 30 for large caps, 20 for mid caps etc. i understand it can be done based on risk/portfolio variance but calculating risk for small caps/mid caps is a complex & error prone process. any guidance here?
1) Sumit, no harm doing this, especially since you are adding to a winning position. However, please be aware not to do this for trades that are going against you. You don\’t want to be adding more to a losing position
2) I\’m not sure if I understand your query completely, but I guess its best to plow back to the extent of profits made
3) Here is my personal spread – 50 in MF, 30 in Direct stocks, 20 for derivative trades.
Your way of teaching is good. Please provide pdf for this module also… so that we can prepare offline also
Thank you
PDF is available towards the end of this page – https://zerodha.com/varsity/module/risk-management/
Pl publish something on how to identify entry and exit levels in intraday trade
Have you checked the module on TA, specifically the one on Support & Resistance? – https://zerodha.com/varsity/chapter/support-resistance/
@karthik – is it possible to provide excel sheet with sample calculation of the three methods of position sizing?
Will try and do that. However, they are quite straightforward. Do check the latest chapter on Kelly\’s Criterion, it has the Percentage Risk technique.
Is \”trading strategies\” going to be the next module?
Debating between Personal Finance and Trading Stratergies.
Trading strategies please 🙂
Yet to decide 🙂
Correction, I meant module 9
I am not able to download chapter 9 as PDF, kindly fix it up
Work in progress, will be uploaded when the module is complete.
Hi Karthik,
First, I like to appreciate you guys for your effort in making this financial knowledge easily available.
Secondly, regarding this position sizing, I came across this youtube video by Adam Khoo(https://www.youtube.com/watch?v=pFHTccTf3QM) about fixed risk percentage. It would be great if you had a chapter explaining with examples about this concept.
The next chapter is on this topic 🙂
how many chapters are left in this module?????
Maybe 3-4 more.
Karthik – I see pdf download copy for all the modules except for \”trading-psychology-and-risk-management\”, why\’s that? could you please add that download feature for this too? Cheers.
This is work in progress Ash, more chapters to add. Once its done PDF will be up.
As the mind so the man.
it helps to go thro time and again on your modules.
See what can be., not just what is
look forward to new chapters.
thanks n best
Cheers! The next one should be up next week. Thanks.
Please provide download pdf option for this module 9 also.Appreciate past helps.
Thanks
This module is work in progress. PDF will be uploaded once done.
Thank you sir.
Welcome!
what I am thinking to do now a days is suppose I have 10k capital and on this I can get margin upto 3 lakhs in intraday but I am taking 4 times margin n my stoploss is 2% so max loss will be 8% on my original capital. I can take position of 40k and be in the game using the extra margins unless n untill I hit 10 consecutive stoplosses (If this happens all the capital gets vanish) which is quite hard if my system is working with 50% to 60% winning ratio n generating average 5% to 8% positive returns monthly. Need your opinion on this and always thankful to you for the best quality of stock market content in India.
8% hit on capital is quite intense. Also, your system could be 60% accurate…but there is a chance that the losing streak could occur first before you start experiencing winners. So do think about this.
Hello Sir,
thanks for this wonderful series, I actually understood mistakes I was doing while trading and always end up in not having capital for next calls.
but does this mean that if I have a capital of 200000 and my percentage margin is say 10%, I could not take any F&O calls? or is there a way I still take F&O.
Maybe not futures, but I\’m sure you can take up few option trades.
Long back I had urged zerodha the \”game changer\” feature in the trading platform or say system features.
I want to trade my whole life with say 2% risk per trade model.
This 2% will be user set. Someone may set it 5% or 0.5% and so on. Someone may keep it blank.
But for the ones who want to trade this fix % risk model, we want the platform/system auto square off a given position if it goes more than 2% of my capital — and in loss.
If this happens Me and intraday traders like me who can\’t follow a Risk Discipline due to inertia or laziness or something else. Because there will be always a stop loss set in a system based on the %amount I mention there.
So even if I take big position size small position size the SL will be altered accordingly and eventually, I will achieve a discipline in losing or say discipline in drawdown.
I don\’t know why Zerodha Guyz have taken this request lightly.
They have ignored it I guess.
Had they implemented this, thousands like me would have benefitted.
Thousands intelligent but nondisciplined traders might have actually ended in nice Profits!!
Vishal, discipline in markets is an integral part. This is very similar to being disciplined in the army. There are no two ways about it. However, I will share your feedback with the team. Thanks.
3×3 = 9? or did you mean 3+3 = 6?
Also, you missed discussing risking a certain percentage(I believe one of the most important styles) of your equity.
In that, for example, you only risk a fixed percentage of your account. for example, if you decide to only risk 1% of your equity. So with Rs 500,000 account, you would only risk around Rs 5,000 per trade, regardless of the instrument you are trading.
Best
Excuse my bad math, its 9 🙂
Will discuss this in the next chapter.
I think the percentage volatility resembles closely to what you say. In the chapter, 2% of total capital is taken as the volatility which is the risk. How you calculate the risk may be different like Average True Range in the chapter or it may be the swing high where you place the SL.
when are you posting next chapters
Another 10 days max.
Come on, don\’t be mean and ask for next chapter. Let Karthik work on it and post when it is feasible. It is disrespectful to ask for ETA.
Lol 🙂
I at least know that someone is reading the chapter and looking forward to the next, its actually encouraging 🙂
Karthik really you have great knowledge in the stock market I must say. will u suggest me which course and books to read for getting expertise in this area apart from this material? As this material also so useful for me. Thanks a lot for this
The only course (certification) worth pursuing would be the CFA from the CFA institute, Harman.
Sir how big is this field
It is quite vast, Harman.