
8.1 – A tale of 2 stocks
We have spent a great deal of time and efforts towards understanding risk associated with a portfolio. Our discussion has brought us to a very important stage – it’s time we discuss portfolio optimization. Perhaps, a good start to this discussion would be to understand what portfolio optimization is all about and why it makes sense to optimize a given portfolio.
Before we proceed, let me ask you a question – what do you think is the overall portfolio return, considering a portfolio consists investment in Infosys and Biocon (equally weighted). Assume the expected return of Infosys is 22% and Biocon is 15%.
I know it sounds like a typical MBA class question, but this is an important question and you should know how to answer this question at this stage J
Since the portfolio is equally weighted across two stocks, it implies we invest 50% in Infosys and 50% in Biocon. Given this, the expected portfolio return would be –
= Weight of investment in Infosys * Expected return of Infosys + Weight of investment in Biocon * Expected return of Biocon
Do recall, in the previous chapter we did discuss “Expected Return of a stock” in detail. Anyway, let us work out the answer –
50% * 22% + 50% * 15%
=11% + 7.5%
= 18.5%
So, the portfolio is expected to yield a return of 18.5% annually.
Great, now what if we change the weights? What if invest 30% in Infosys and 70% in Biocon? Or let us say 70% in Infosys and 30% in Biocon?
Let’s figure this out, Case 1 –
30% * 22% + 70% * 15%
= 6.6% + 10.5%
17.1%
Case 2 –
70% * 22% + 30% * 15%
=15.4% + 4.5%
=19.9%
Needless to say, we can do this for multiple combinations of weights. In fact, here is the table with few of the other combinations possible –
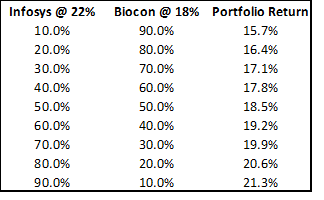
As you can notice, as the investment weight varies, the returns also varies. For example if I had decided to invest just 40% in Infy and 60% in Biocon, I’d have enjoyed a return of 17.8%. However, if I had reversed it by investing 60% in Infy and 40% in Biocon, I’d have enjoyed a return of 19.2%, which is an additional 2% return.
This leads us to a super important conclusion – as the investment weights vary, the returns vary. In fact, each return has an associated risk profile, so it is prudent to state – as the weights vary, both the risk and return characteristics vary.
Now imagine this – for a given portfolio with ‘n’ number of stocks, wouldn’t it be awesome if you were to look at the past data and intelligently identify how much to invest in each stock, so that the portfolio yields the best possible returns?
This is exactly what happens when you optimize your portfolio. Generally speaking, you can adjust the weights (or optimize your portfolio) such that, for the given set of stocks –
- You identify the investment weights to achieve the best possible return or
- You identify the investment weights to achieve the least possible risk
Sounds confusing? Fear not, just read ahead!
8.2 – Caution! Jargons ahead
Hopefully by now, you fully appreciate the reason why one should optimize the portfolio. So, I won’t spend more time convincing you ☺
Let us go ahead and optimize the portfolio we have been working with. However, there are few important terms I want you to be familiar with at this stage –
Minimum variance portfolio – Assume you have a portfolio of 10 stocks. It must be quite obvious by now that you can play around with the weights of each stock to achieve different results. When I say results, I’m talking about the risk and return characteristics. Each unique set of weights represents a unique portfolio. For example an equally weighted portfolio (10 stocks, 10% weight in each) is a unique portfolio. A portfolio where you invest 30% in stock 1 and 7.8% each across the remaining 9 stocks is another unique portfolio. The number of combination possible are many and each combination of weights results in a unique risk and return characteristics.
Given this, there should be that one set of combination of stock weights possible, such that the risk for the portfolio is the least possible. More technically, there should be combination of weights possible such that the variance of the portfolio is minimum. This particular portfolio is also referred to as the “Minimum Variance Portfolio”. The minimum variance portfolio represents the least amount of risk you can take. So if you are a highly risk averse investor, you should aim to create a minimum variance portfolio.
Maximum Return portfolio – This is somewhat the opposite of a minimum variance portfolio. Just like a minimum variance portfolio, there should be a combination of weights such that we can achieve a portfolio with maximum return possible. This also means that for a maximum return portfolio, the risk too will be on the higher side.
Fixed variance, multiple portfolios – This is not really a jargon, but a concept that you need to be aware of at this stage. It may come across as a little confusing at this point, but I’m certain, later on in this chapter (or maybe next) you will understand this much better, especially when we perform portfolio optimization.
For a given level of risk or variance of a portfolio, you can create at least two unique portfolios. One of such portfolio will yield the highest possible return and the other portfolio will yield the lowest return for the same given level of risk.
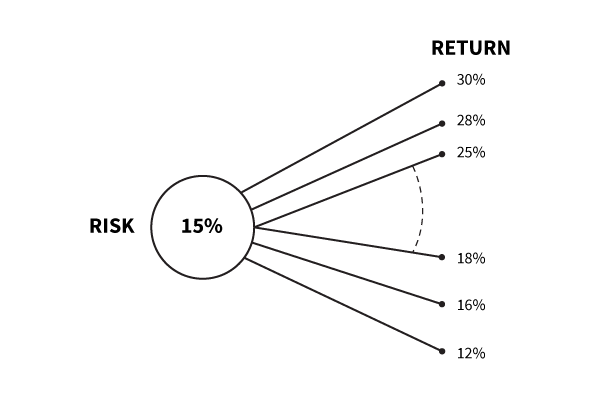
Here is an example on a completely arbitrary basis – let us say the risk or variance of a portfolio is 15%, given this, there will be a portfolio which can yield 30% return (highest possible return) and another portfolio which can yield 12% return (lowest possible return). Do note, for both these portfolios, the risk is fixed to 15% but the returns vary.
Between these two portfolios there could be multiple other (unique) portfolios with varying return profile. In super simple terms – for a fixed amount of risk, there could be multiple portfolio combinations, and within these possible combinations, there will be a portfolio with maximum return and another with minimum return.
We will revisit this concept a little later in the chapter, but for now, just keep this thought at the back of your mind.
8.3 – Portfolio optimization (steps)
Let us recall the portfolio that we have – the stock names and the associated weights are as follows. Do note, this is a continuation of the portfolio we have been working with over the previous few chapters.
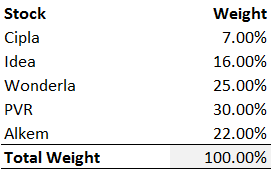
Do remember, the weights assigned are all random, there was no thought process to it. For this portfolio with these combination of weights, the annual portfolio variance was estimated at 17.64% and expected return as 55.14%.
Our objective now is to optimize this portfolio to achieve a desired outcome. To optimize a portfolio in excel, we need the ‘Solver Tool’ in excel. You will find the solver tool under the ‘Data ribbon’.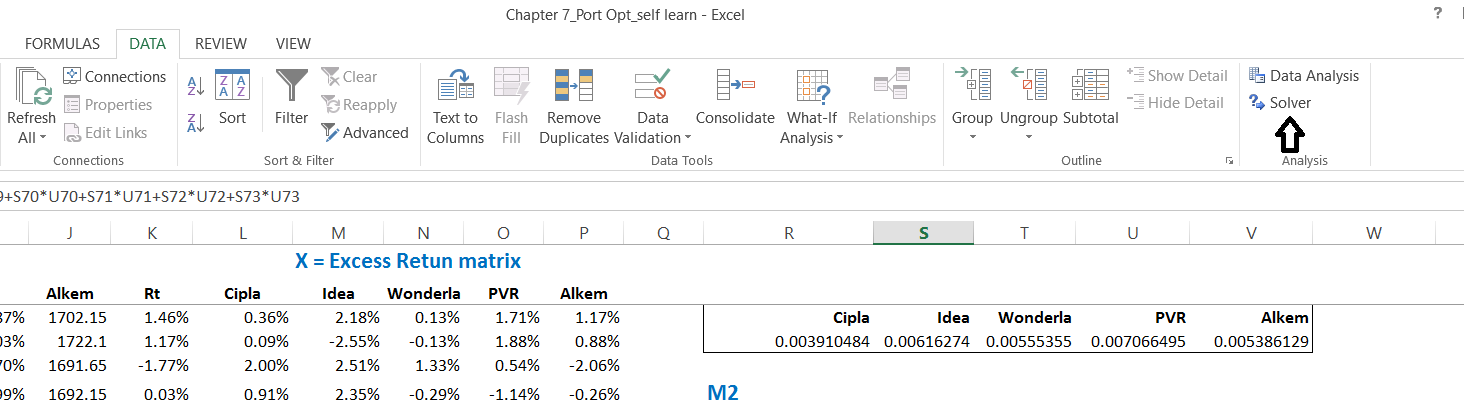
Many of you may not find the ‘solver’ tool under the data ribbon. This is because you’ve not added it from the excel add ins. To add solver, follow these simple steps –
- Click on Files on the opened excel sheet
- Select Options
- Select Add-ins (last but one option)
- Click on ‘Solver Add Ins’
- Click on “Go”
- Check on “Solved Add ins” once again
- Click Ok and close
- Close the excel sheet, if required restart your system
- Check under data ribbon – you should be able to find the solver tool
To begin with, let us optimize the portfolio to get the “Minimum Variance portfolio”. Here are few simple steps that you can follow to achieve this.
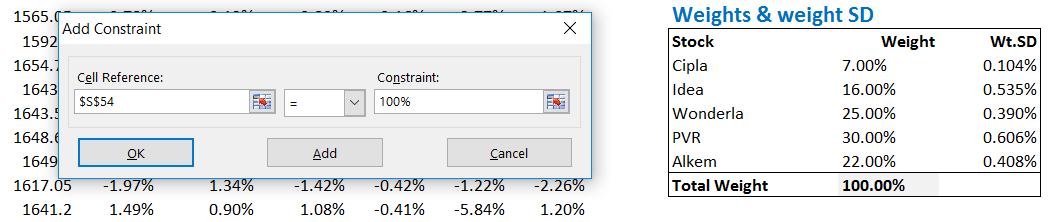
Step 1 – Organize your data. This is the key to using solver. Your cells should be linked, data should be neatly organized. No hard coding of data. Here is how the data on excel sheet looks at this stage.
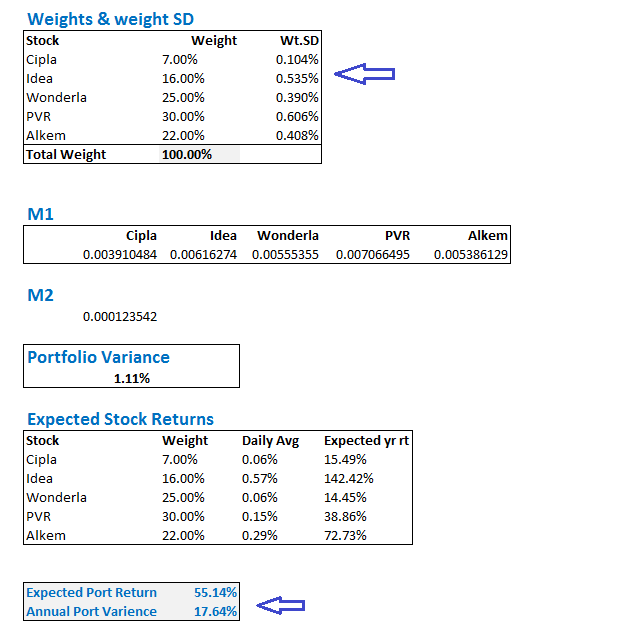
I’ve highlight two important parts, which we will use for optimizing. The top most part has the weights assigned to each stock. Needless to say, this will change once the portfolio is optimized. The 2nd part has the expected return and annual portfolio variance calculation, which will also change when we optimize the portfolio.
Step 2 – Use the solver tool in excel to optimize the weights. I’m assuming you may be new to solver, hence will give you a quick overview of this tool. You can use solver to work with something called as an ‘objective’. An objective, according to solver is essentially a data point, derived by set of formulas. You can minimize the objective’s value or maximize the objective’s value or set the value of an objective to a certain desired value. You can do this while changing certain variables. The variables, according to solver are the elements of the formulas used in deriving the objective. For example, I can choose to minimize the variance of the portfolio by changing the weights of each stock. Here, the variance is the objective and the weights are the variable.
When we command the solver to minimize the objective (variance in this case), then in the background, excel’s solver will quickly check the formulas used and works around it in such a way that the objective’s value is least minimum.
Look at the image below, I’m invoking the solver tool and will soon ask it to minimize the variance.
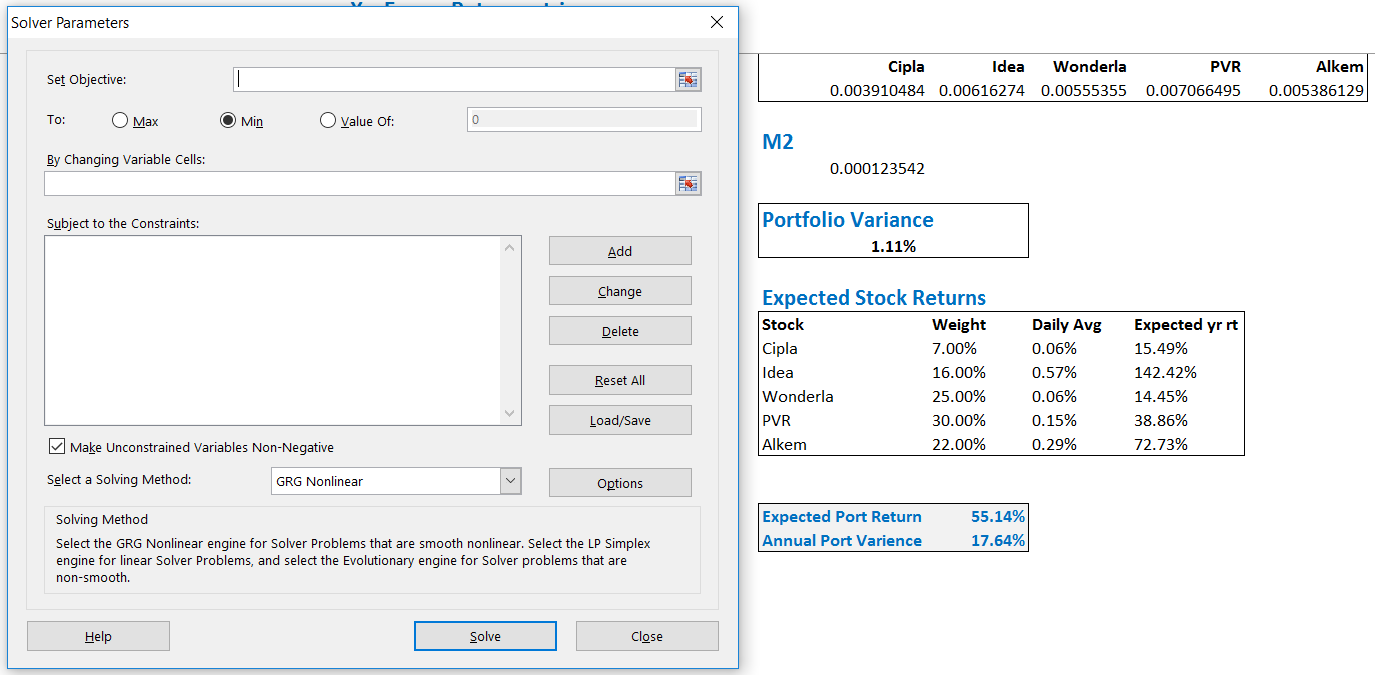
When you click on the data ribbon and click on solver, you will see the solver tool open up, as seen above. We need to set the objective here. Objective as I mentioned earlier, is the annual portfolio variance. Remember, we are working towards finding the minimum variance portfolio here.
Check the image below –
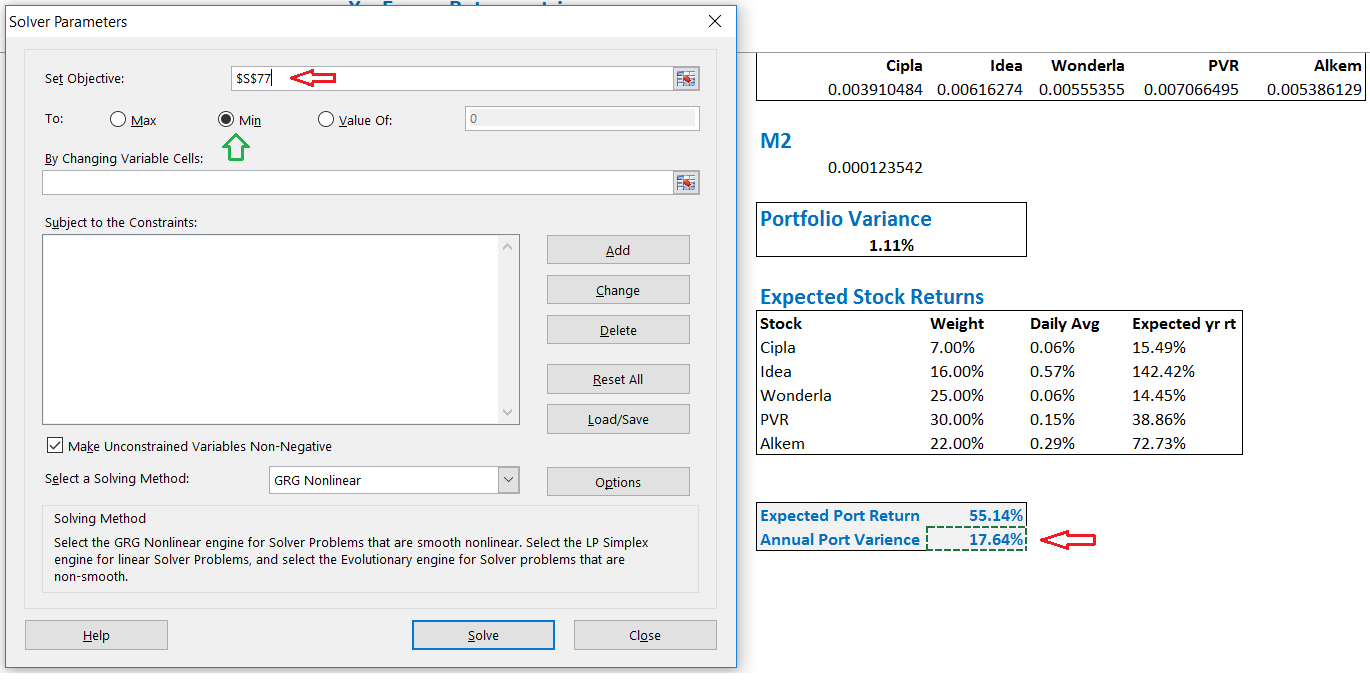
Objective is set to ‘Annual portfolio variance’ – you can notice the cell address is highlighted in the ‘set objective’ field. The cell containing the annual portfolio variance itself is highlighted below, you will find another red arrow here. We are minimizing the objective here, the same is highlighted by the green arrow.
Once this is set, the next step is to inform the solver tool that we need minimize the objective by changing the variables. In this case, the variable happens to be the weights assigned to each stock.
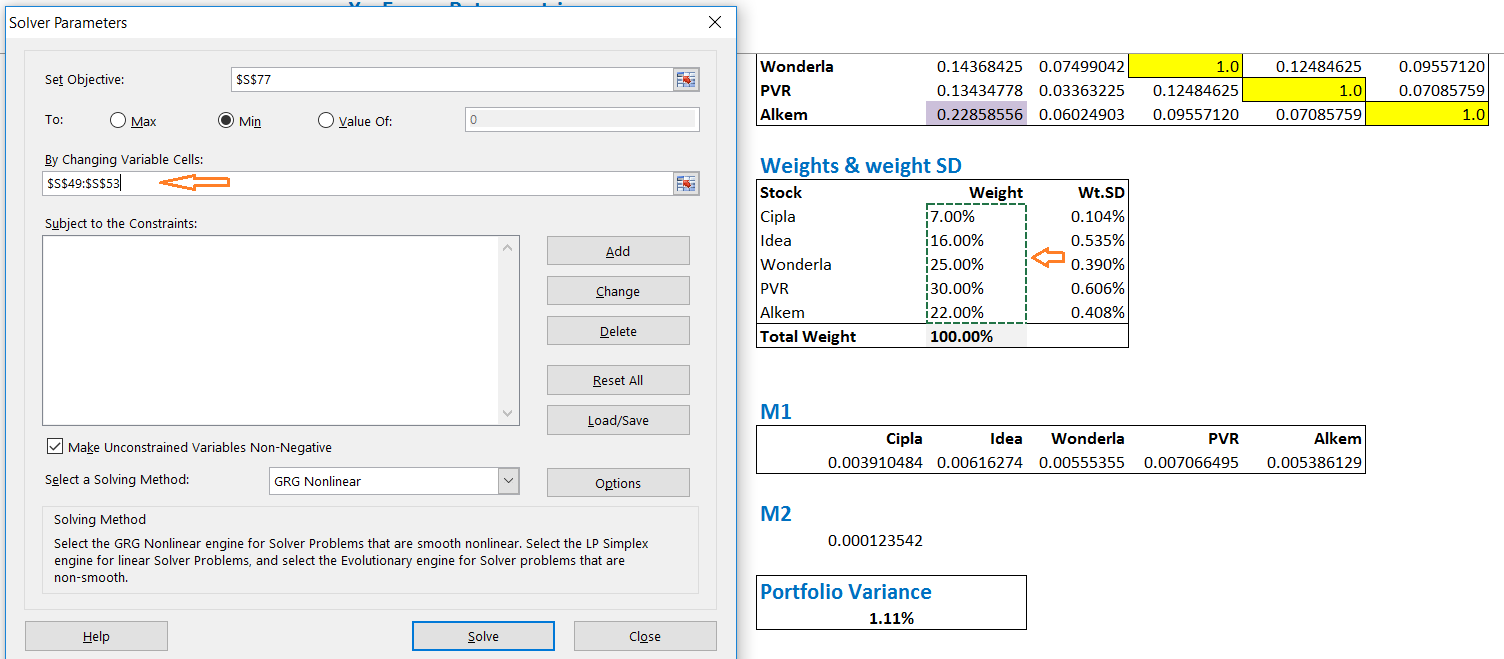
As you can see, in the “By changing variable cells” field, I’ve highlighted the weights assigned to each stocks.
You can also find “subject to constraints”, field. This essentially means, that solver will minimize the variance, by change the weights of each stock, and at this stage, it is also asking us if there are any constraints it needs to keep in mind while solving to minimize the variance.
One constraint that I can think of at this stage is that the total weight of all stocks put together should be 100%. This essentially means that my capital is 100% deployed across all the 5 stocks. If I do not specific this, then there is a chance that solver may suggest to skip investments across few stock altogether. Remember, solver is an excel tool, and it does not appreciate stock picking
To add a constraint, click on ‘add’. When you do so the following window opens up –
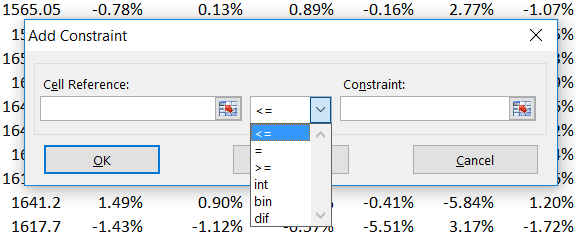
Under Cell reference, I will give the sum of weights of stocks – which needs to be equal to 100%. Next to this, you can see a drop down menu with multiple options, I’d pick ‘=’ here. Finally, the constraint itself will be 100%. Note, I’ve typed out 100% here.
In simple words, I’m asking solver to optimize for minimum variance, keeping the weight of all stock to 100%. The window now looks like this –
The solver is completely set up now. The final screen before pressing “Solve” looks like this –
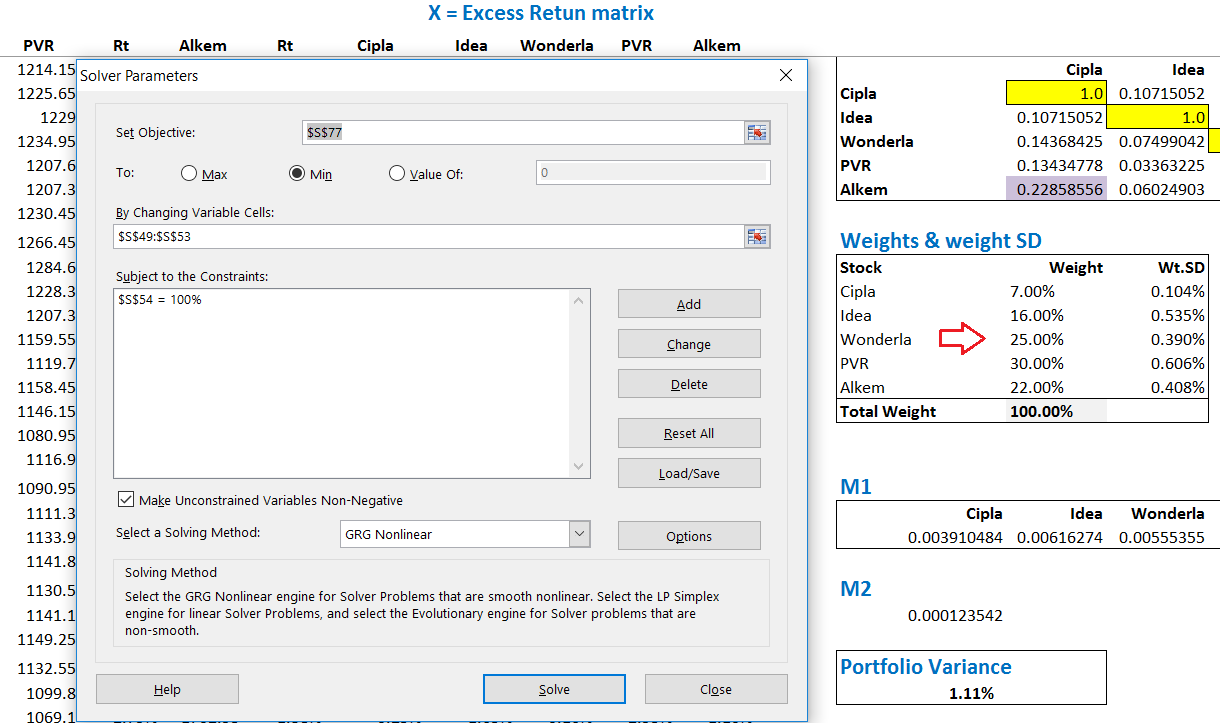
I’ve highlighted the weights of each stock for reference. Remember, these are pre optimized weights that we randomly assigned at the beginning of this discussion. Post optimizing, the weights will be changed such that the variance is least possible for these set of stocks. Let us go ahead and press ‘solve’ and check what solver has for us.
And here you go –
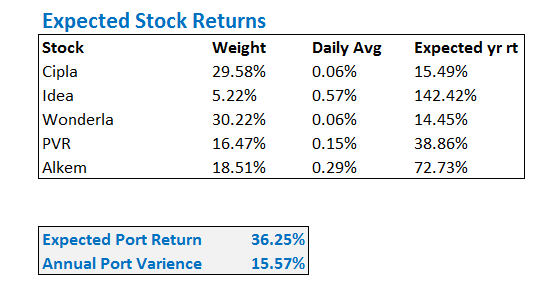
Solver has solved for the ‘minimum variance’ portfolio and accordingly it has worked out the weights for each stock.
For example, it wants us to increase the weight in Cipla from current 7% to 29.58%, while it wants us to reduce the weight in Idea to 5.22% from 16%. So on and so forth. Further, it is also telling us that the least possible variance with this portfolio is 15.57% (remember, the variance was earlier at 17.64%). Along with this, the portfolio’s expected return too seem to have dropped to 36.25% from the earlier 55.14%.
So, no matter what you do, the variance cannot be lowered below 15.57%. In other words, if these are the 5 stocks that you want to invest in, then the least amount of risk you will be exposed to is 15.57% and absolutely nothing below that!
I’ll leave you at this. In the next chapter, we will optimize the same portfolio for few more scenarios and work towards building something called as an ‘Efficient Frontier’.
You can download the excel sheet used in this chapter. Do note, the excel contains the optimized weights for the minimum variance portfolio.
Key takeaways from this chapter
- The returns of the portfolio is dependent on the weights assigned to each stock
- Minimum variance portfolio is that portfolio where the variance or risk is least possible for the given set of stocks
- Maximum return portfolio is that portfolio where the expected portfolio returns are maximized for the given set of stocks
- When we fix the variance of a portfolio we can achieve at least two portfolios where the expected portfolio returns can be maximum or least
- One can optimize a given portfolio with ‘n’ number of stocks on excel, by using the solver tool
- One of the most important points to remember while using solver is to ensure the data is well organized. One can do this by linking all the relevant cells and avoiding hard coding of values
- You can optimize the portfolio by subjecting the variable to constrains
I keep getting stuck at the solver step. I have done exactly as shown,but the solver gives no result. I have tried it using LibreCalc too, no result.
Ah not sure. Usually, the problem would be very small, and most likely you\’d have overlooked something small. Please trace back all the steps again carefully 🙂
Sir,
I have used Solver tool but at some stocks it is giving 0% weightage while reducing it into 0% annual portfolia variance.
please help
Try to set the minimum investment as 2-5%.
using solver for the minimum variance portfolio, the expected annual portfolio returns remain unchanged even though the variance and weights change. what could be the reason? any suggestions, Karthik?
Maybe you solved for low variance and low returns? Not sure, can you check the steps again?
when we apply the constraint the value in the gets multiplied by the total weight i.e. 100 and the total weight after solver completes process becomes 10000% I tried putting it equal to 1 and 10 and the result was same i think there\’s a catch which i am not getting but in your sheet it has worked with 100 but in mine it is multiplying to make it 10000%
Ah, I\’m not sure. Did you give the constraint that the sum of all weights should add up to 100?
Sorry sir, my bad. Portfolio variance is dependent on weight SD. Got it
Yup 🙂
End result of all optimization is a change in portfolio weights.
Hi Sir, Thanks a lot for this valuable lesson. I have a doubt, probably a dumb question.
We are selecting objective as Annual portfolio variance which is derived from portfolio variance. And the weights as a variable that is independent of portfolio variance. The weights only affect the expected annual return if I change them manually. But how solver is modifying the portfolio variance with respect to weights?
Gautam, you can optimize for variance or return, but not both. I guess, I have described this in the chapter itself.
Hi again, karthik.
I tried setting the constraints to >=1%. But still it\’s not working and is showing negative value for IT sector stocks
Surprising, when you set a constraint excel will workaround and ensure it sticks to the boundary conditions.
After solving, Excel is asking me to have one of my investments at -5%. Is it a mistake? How do I correct it?
Its not. Please set a constraint saying minimum investment per stock at 1% or something like that.
Hi Karthik,
I am getting negative weights in some instances , how do I make sure the weights are positive in every instance.
even after putting the constraint to be equal to 100. lit is showing one of the stock of 5 stock portfolio to be zero. why this happening.
Zero is fine right?
Could you see it at your end ?
Using the Solver as it is — just changing the objective to \’max\’ and the corresponding variable to the return cell. If you could check at your end, that\’d be great.
I Will do that, let me check.
Karthik, I tried using the spreadsheet provided to calculate the Maximum Portfolio Return. The Solver throws up a weight of 100% for Idea. I am not sure if that\’d be right.
I don\’t think so, maybe you are missing out on some parameter?
Hi Karthik,
Do you take any courses related to technical analysis and trading philosophy what you explained above
Not really, everything is made available in this portal.
Hello Sir,
1) How we will get to know the expected returns for each stocks?
2) Also in OPTIONS chapter there was a topic that you expect returns in N number of days.( at start of contract , mid , at expiry ). How we get to know these data ?
hope u get my doubt.
thank u
1) The historical average daily return expressed annually is the expected return.
2) Same as above.
Hey ,
Could you please assist after using the solver, the results are overwritten on the same cells.
Do we need to manually copy paste the results or how is it supposed to be done? I tried everything possible.
Yes, the cells are overwritten Nikhil.
thank you sir ,
and kite trading terminal is not working properly , what would be the reason ?
Koushik, it is. We had a small issue for about 5-8 min towards the closing. Apart from that, there were no other issues.
sir ,
after applying every step that you said step by step, at last I\’m no getting the new expected returns data.
please help me through this sir .
Ah, Koushik…it will be difficult to pinpoint the error given that there are so many steps. I\’d suggest you carefully evaluate each step. Work with the same data set first so that you get the right values. Once you do, maybe explore other data sets.
sir ,
in solver tool final solution isnt coming sir,please help me with that .
Where are you getting stuck, Koushik?
sir please check
https://docs.zoho.com/sheet/open/b9lpmf3f2f11506ee4571a613df473a2661fa/sheets/HDFCBANK_NS/ranges/AH13
sir ,
do share how to upload my excel worksheet ,so that you can go through it and guide me, please sir .
You can upload on Google drive and share the link.
1) For Point 1 …My age is 46 Years old, please suggest some more portfolio Mix with Gold and ETF etc.
2) For Point No….For momentum strategy what shall be SL option like ATR or SMA or any other? This shall help me a lot.
1) Rajeev, frankly this depends on your overall risk profile. However, generally speaking, you\’d have to target 50-50 mix between EQ and debt. I\’d suggest you speak to a financial adviser for this
2) SMA or EMA system has inbuilt SL mechanisms, suggest you stick to the system prescribed SL mechanism rather than a fixed %.
Hi Kartik,
Tons of thanks for valuable insights provided in vast range of Varsity contents…..I have few queries,
1) What should be ideal Port folio allocation i.e Equity, MF, ETF and Gold etc……presently my portfolio is squeezed Towards 75% MF and 20% Direct Equity.
2. In Momentum strategy whether one should put Stop loss to avoid very bearish events (if any) presently my momentum strategy got bad hit by 2 big events first 2-3 days on budget & before budget day and recently last two week fall due to Global Market fall due to Crona Virus….( all profits made converted into big losses)
3) I am trying to do chart based Trading breakout based on Flags, peanut, resistance or Triangle Breakput Trading in Future contracts but to high stocks volatility not able to positions which eventually turn into losses…could you please suggest some better way to handle this situations some where you mentioned please hedge it with Deep (ITM) put option….please elaborate more and also advise few more options if any.
1) This depends on your age Rajeev. Assuming you are sub 40\’s, this is a good mix.
2) Yes, all strategies need a SL, at which point you exit no matter what
3) Yes, one of the better ways to trade the breakout is to trade via the options, where the downside is protected. I\’ve explained many spread strategies here – https://zerodha.com/varsity/module/option-strategies/ , suggest you read through and find the best which suits your trading situation.
Good luck!
in your excel, you calculated the annual portfolio variance with =portfolioVariance*SQRT(252), what is that \”252\”??
252 is the number of trading days in a year.
Hi,
I am very much impressed the way you explain complicate stuff in very easy to understand language. Thank you for posting this valuable informations and methods for small investors like us. I preffer value investor strategy for investemnt. However this article is good for trading. Are there any portfolio optimisation method for long time investing ? How to perform the same? Please share your comments. Thankyou.
Best Regards,
Himanshu
Himanshu, thanks for the kind words. If you are a long term investor, you\’d not want to think about optimizing. Its best if you can keep the investment simple and basic.
Hi Karthik,
I am not able to find any solution through Solver. where can i find it? my weights of stocks are also not changing. I am stuck with a huge portfolio of 102 stocks with heavy losses. can i filter my stocks which are not needed in my portfolio. kindly help and give a solution for this. Also please guide on minimizing my loss.
Looking forward for your reply,
Thank you
Priya, a portfolio of 102 stocks can be a very heavy portfolio to deal with. You have no option but to mercilessly chop off the laggards, even if it means you are taking a hit. A good stock portfolio should have at best 12-15 stocks, albeit this is a personal opinion. Btw, it is quite tedious to work on an excel for 102 stocks, so I\’d suggest you filter out first based on quality before moving to excel.
Thank you so much Karthik. I have worked out with entire procedure for all 102 stocks. But at last Iam not able to filter through solver. What will be the maximum stock limit for solver to screen? Why is there no change in my stock weights? Alternatively I have calculated returns, Std, and ranges for next 1 year. Hopefully I can filter few.
I also request you to make a module on intraday, swing, Pivot, and Fibonacci . Is there any means to get regular updates from varisity?
Thank you.
Priya, I\’m really not sure about the limits on solver. I\’ve always worked with few stocks and never really tried a large number of stocks. I will try and make a supplementary note on the topics you\’ve mentioned.
The best way to keep track of major updates from Varsity is to follow us on Twitter, our official handle is @zerodhavarsity. Thanks.
You have minimized the variance assuming that return on stocks are independent, as you did not consider the covariance.
for example in 2 stock
variance of portfolio = w1^2 *s1^2 + w2^2 s2^2 + 2 w1* w2 * Cov(1,2) , here you did not consider 2 w1* w2 * Cov(1,2)
Fantastic job, Karthik.
You\’re making it so so simple for end users to understand. I know its not at all easy, involves so much of hard work.
Thank you very much!
Glad you really appreciate this 🙂
Happy learning!
Hi Karthik,
I had few queries on Portfolio Optimisation –
1. When you are calculating Expected Returns, it may come negative [=LN(TO/YE)*100]. Is that alright?
2. The correlation Matrix you have described herein – Is this the same as “Pearson’s Correlation Coefficient (r)”? Can this be negative as well?
Will greatly appreciate your guidance …
Regards,
Risk.Money
1) Yes, but the point is, would you really want to invest in a stock with -ve expected returns?
2) Yes for both.
Hi Karthik,
Thanks for the reply.
I got your point. Its just that I was hoping that even if the returns are negative for a given stock the \”Portfolio Optimization\” would have assigned the new weight as 0% to the one giving negative returns. But I have done way too many iterations to realize that – that does not seem to be the case.
I think I understand the calculation but this is more of a workflow problem concerning what portfolio managers do on day to day basis and how do they set their return expectations. If a stock has given negative returns how will one set the return expectation. Do they assume that the stock will make a V-shaped recovery in which case returns can be simply absolute value of the negative returns and hence positive. But then the StdDev calculations go for a toss and the correlation matrix will still have negative correlation. Or is it safe to simply remove this stock giving negative returns from the portfolio and calculate variance / returns of the remaining positive.
Will greatly appreciate your inputs …
In fact, if the returns are -ve, it will suggest you go short on the stock, which does not make sense in the Indian context. So best to avoid it. But portfolio managers running long-short funds actually go short in the SLBM market (Helion Fund etc).
So yeah, best to avoid, unless you are convinced about recovery. In yes, then you optimize with a constraint saying that you will invest x% in this stock, and optimize for \”1 – x\”.
So the right questions are –
1. Why the portfolio optimization technique does not assign 0% to the stock giving negative returns?
2. If a stock is giving -ve annual returns and is in the portfolio, how do the portfolio managers set expected returns / stddev for portfolio return and portfolio variance calculations?
Cheers!
Hopefully, I\’ve answered this in the previous comment 🙂
This is using historical data to calculate the volatility and returns. But there might be changes in volatility or risk or correlations in future. So how can we improve our accuracy? Also the numbers maybe change (expected returns and volatility) if we consider the 2007-08 data which is high volatility and if we don\’t consider it may give a lower annualized volatility so what should we do in such cases?
The only way is to run the calculation on a daily basis, Harsh!
I aspire to be an independent financial adviser. Hence, I\’d like to know of various other streams of study available besides CFP; few recommendations on the side courses and few on options avaiable for post graduation study.
CFP is by far the best-structured course for financial planning, Kushal.
Hi Karthik,
I just want to know one thing. 🙂
After I read your modules and internalize them a little, I feel as though I am deriving perspectives and strategies that can definitely help make profitable portfolios.
What I want to know is if this is available for all the world why would people make losses still? Even after internalizing the concepts you have given (that seem to be very comprehensive) what other hidden aspects would an average person like me miss out?
Can you advise please? 🙂
Rgdz,
Arun
The difference in practising what you learn 🙂
Not many people do that!.
Lucid and engaging modules. Well written and immensely useful. You might want to drop the \’s\’ that appears after \’jargon\’.
Thanks for pointing that, Prashant 🙂
Hi Kartik, Thanks for the world of wisdom n knowledge provided by Varsity. It\’s really awesome. Can you please help me to get the correct value of weights through solver as i\’m facing some errors.
Where are you facing a problem, can you kindly elaborate? Thanks.
After running the query, it says that Solver encountered an error value in the objective cell or a constraint cell. I tried to resolve many times but it always gives the same result. In objective cell, i have mentioned to min the annual portfolio variance as calculated and in the constraint, i mentioned the total weight = 100%. I have done the same thing as guided by your example but still facing the problem. Kindly help
I know Excel can act funny at times. I usually try restarting Excel and sometimes even my system. I know this is a not the direct solution, but it works. Additionally, just make sure your excel cells are all properly linked.
hi Karthik,
we are not able to see module 7 and 8 in the dropdown.
I\’m able to see, can you please do a hard refresh and check again? Thanks.
Hi karthik,
from where should I collect the data of stocks closing price for last 6 months to find out variance of my portfolio. Is it available on zerodha platform? Really you people are doing great job by educating people and responding promptly keep it up.
You can download it from NSE directly. Check this – https://www.nseindia.com/products/content/equities/equities/eq_security.htm
Hi Karthik,
I am finding it quiet cumbersome to calculate my portfolio variance and risk profile using your sample excel sheet and downloading data from NSE website. Does zerodha provides the facility for the same to its customer for the portfolio holding?
Not as of now. The trick is to make sure that the data is neatly organized on excel.
thanks for this great tutorials
Cheers!
Thanks for all the tutorials Karthik Sir.
I wanted a overview on what topics/content are you going to cover in Trading strategies and systems.
We are yet to finalize them, Varun. We are currently focused on delivering a good module on Risk Management and trading psychology.
Dear Karthik,
Wow, that\’s Awesome! Simply Awesome!
Have a question, In our example, we used solver for Minimum Variance and the result was approx 2% reduction in exposure to risk, but at the same time Expected return has also reduced drastically from 55.14% to 36.25%.
So on excel sheet provided by you, I tried something i.e. I added one more constraint where I restricted Expected Returns equal to our original 55.14% and as a result annual Portfolio variance came to 16.9% which is greater than 15.57% but still lower than original 17.64%.
Is this approach, in a right direction? Waiting for your valuable feedback.
Thanks & Regards
Santosh Shetti 🙂
Of course! Optimization is all about this. Remember, you can either work with the variance or returns, given this your approach is perfectly valid.
Thanks a lot.
I have one more question, which pertains to historical data. Like if I decided to take past one year closing price into consideration while calculating port portfolio variance, but what if couple of stocks in portfolio doesn\’t have adequate historical data (as those stocks have been recently listed), can we go with whatever little data is available or we do need to make some adjustments?
Thanks & regards ☺
That would be a problem :).
For example, if I have a recently listed stock in my portfolio, say 6 months, then I\’d take the historical data for 6 month for all the other stocks as well. Alternatively, I wont hesitate to keep this one stock aside and optimize the rest of the portfolio.
Ok got it. Thanks a lot Karthik. 🙂
Cheers!