
9.1 – Working with the weights
In the previous chapter we introduced the concept of portfolio optimization using excel’s solver tool. We will build on the same concept in this chapter and proceed to understand an important portfolio concept, often referred to as the ‘Efficient Frontier’.
Recall in the previous chapter, we discussed how a portfolio can produce multiple return series for a fixed portfolio variance. We will now go ahead and see how this works. This concept will eventually lead us to understanding portfolio optimization better.
In the previous chapter, we optimized the portfolio to produce the minimum variance portfolio. The results, in terms of weights of individual stocks were as follows –
| Sl No | Stock name | Pre optimized weight | Optimized for minimum variance |
|---|---|---|---|
| 01 | Cipla | 7% | 29.58% |
| 02 | Idea | 16% | 5.22% |
| 03 | Wonderla | 25% | 30.22% |
| 04 | PVR | 30% | 16.47% |
| 05 | Alkem | 22% | 18.51% |
And the expected portfolio return and the portfolio variance is as follows –
| Pre optimized | Optimized for minimum variance | |
|---|---|---|
| Expected Portfolio return | 55.14% | 36.35% |
| Portfolio Variance | 17.64% | 15.57% |
Here is where things start to get a little interesting. So far what we have achieved in terms of portfolio optimization is merely a minimum variance portfolio. Like we discussed in the previous chapter, for every fixed risk level, there could be multiple unique portfolio with varying return characteristics. We will now go ahead and explore this in greater detail.
We know at 15.57% portfolio variance, the return expected is 36.35%. We will now go ahead and increase the risk maybe to 17%, and calculate the highest and lowest possible returns for this. In other words, we are essentially trying to identify the highest and lowest possible return for a fixed portfolio variance of 17%. Also, do pay attention here – when I say increase the risk, we are essentially fixing the risk to certain desired level. 17% for now.
9.2 – More optimization
The general direction we are headed is this – we know the minimum risk possible for this portfolio is 15.57%. We have also noted the return achievable at this level of risk i.e – 36.35%. Like I mentioned earlier, we will now increase the risk a notch higher and note down the maximum and minimum return for this risk. Along with the return, we will also note the investment weights. We will then increase the risk another notch higher and again note the max and min return along with the weights. We will do few such iterations and note down all the observation.
Eventually, I would like to plot a scatter plot of fixed risk along with its respective max return and min return data points and study this scatter plot in greater detail. This scatter plot will help us understand portfolio optimization.
So let us get started by fixing the risk at 17%. Please note, I’ve opted 17% just like that, it could very well have been 16% or 18%.
Step 1 – Invoke the solver
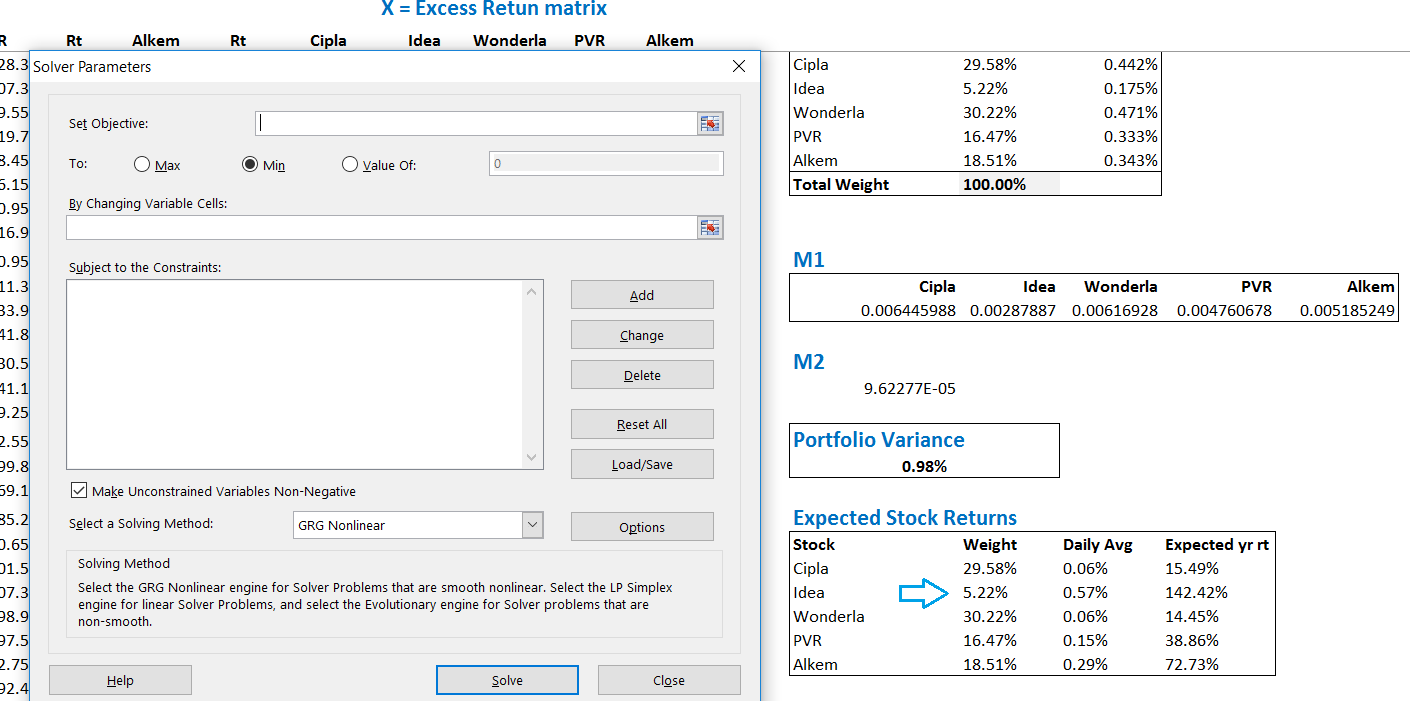
As I explained in the previous chapter, I’ve invoked the solver calculator by clicking on the data ribbon. I’ve highlighted the optimized weights for the minimum variance portfolio, this is just for your reference.
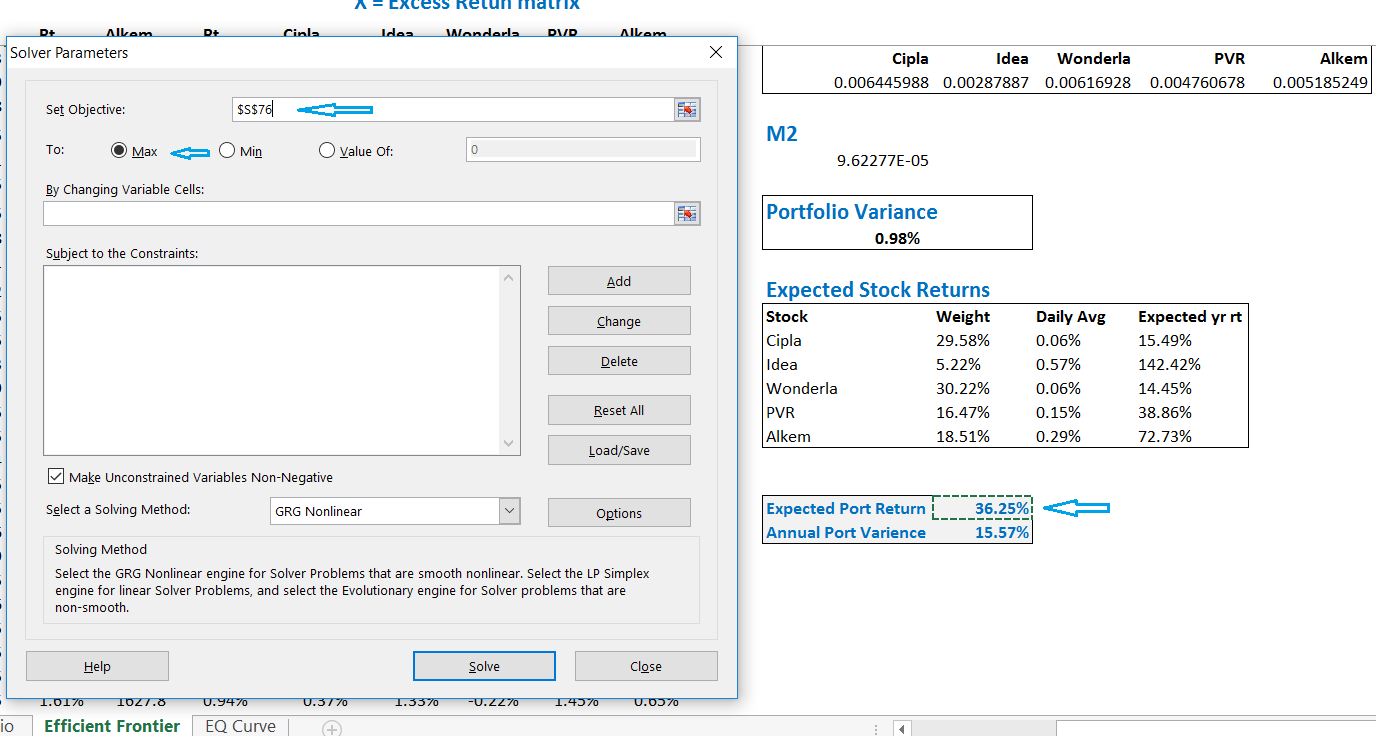
Step 2 – Set the parameters
To begin with let us find out the maximum return one can achieve for a fixed 17% risk. For this, we need to set the objective to maximize the ‘expected portfolio return’. The same is highlighted as shown below –
Step 3 – Select the weights
The next step is to ensure that we tell the solver tool that we want to optimize the portfolio for maximum return by varying the weights. This is very similar to what we did in the previous chapter.
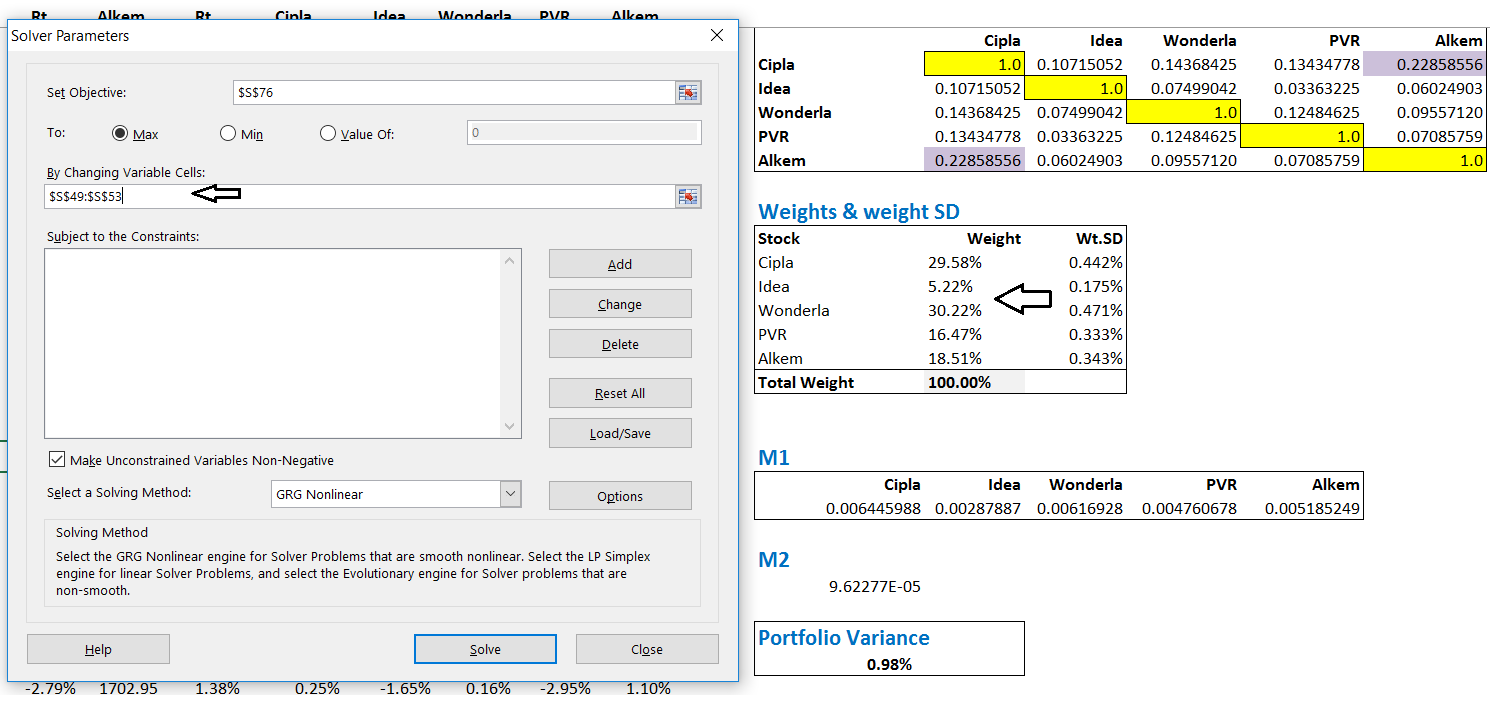
Do note, the weights here are the variable cells.
Step 4 – Set the constraints
Now, here is the important part of the optimization where we set the constraints. We now tell solver that we need to maximize the returns @ 17% risk, by varying the investment weights. We do these while keeping the following two constraints –
- The total weights add up to 100%
- The Portfolio risk is fixed to 17%
The constraints section now looks like this –
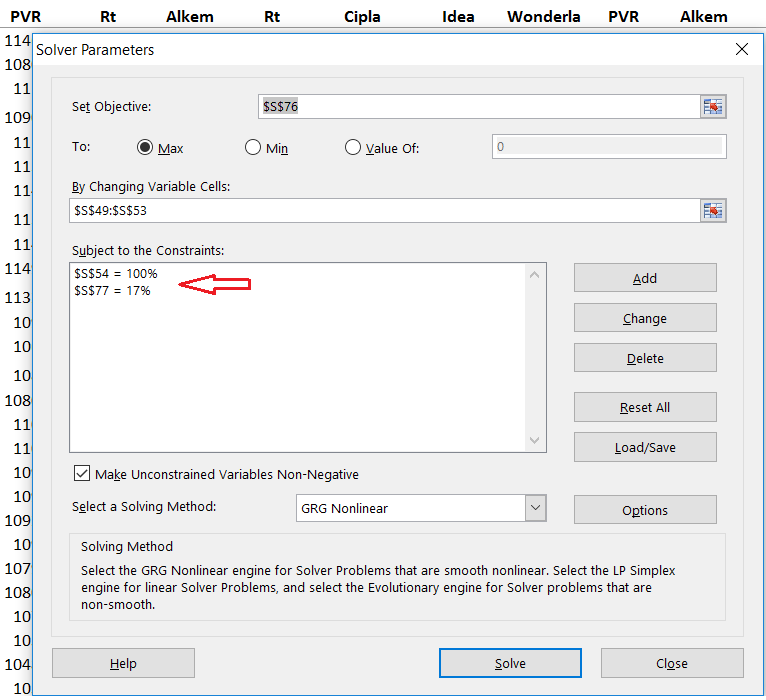
With these constraints loaded and rest of the parameters specified, we can go ahead and click on ‘solve’ to figure out the maximum return possible @ 17%, along with the respective weights.
The result upon optimization is as follows –
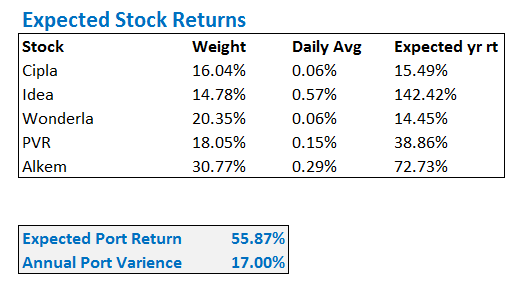
The maximum possible returns @17% portfolio variance happens to be 55.87%. However, to achieve this, the weights are as show above. Notice how the weights for this portfolio has changes when compared to the minimum variance portfolio.
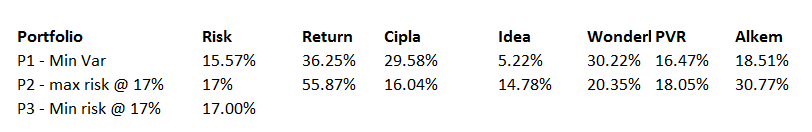
We will now proceed to figure out the minimum return possible for the same fixed amount of risk, which is 17% in our case. Before we proceed, here is a table that I’m compiling of all the various portfolios that we are building, along with its respective weights and risk return characteristics.
We are now working on portfolio 3 (P3), which is the minimum risk possible for a fixed risk of 17%. Here is the solver tool, fully loaded and ready to be optimized.
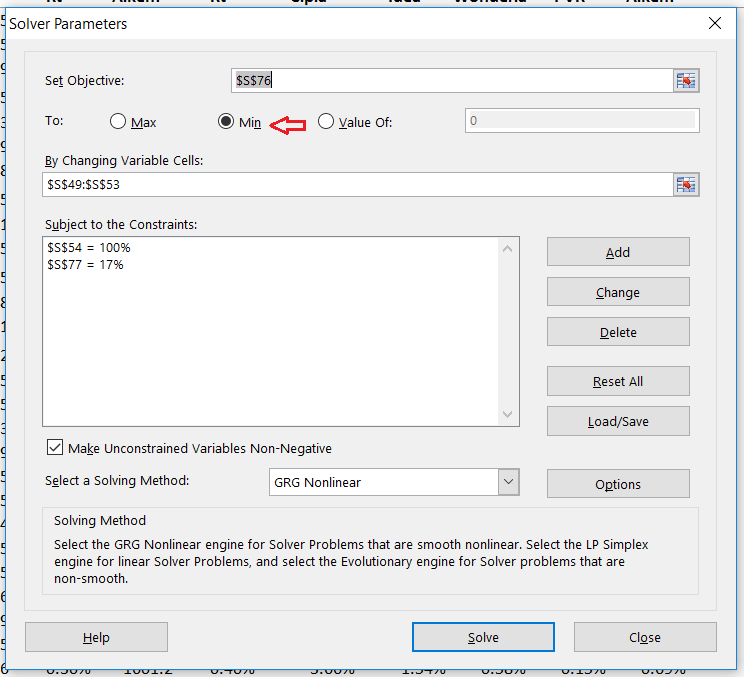
Notice, while other variables remain the same, the objective is shifted to minimize from maximize. Upon optimization, the return is now minimized to 18.35%. Clearly, for the same given risk, we have now established two unique portfolios with different possible return characteristics, all these while just changing the investment weights in the stocks.
Here are the three unique portfolios that we have generated so far –
Just to recall – P1 is the minimum variance portfolio, P2 max risk @17%, and P3 is min risk at 17%.
9.3 – Efficient Frontier
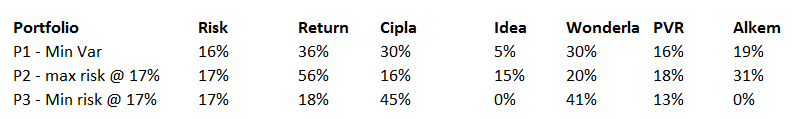
As discussed earlier, we can now increase the risk a notch higher to maybe 18%, 19%, and 21% and identify the maximum and minimum risk at both these risk levels. Remember, our end objective is attain a scatter plot of the risk and return profile and study its characteristics. I’ve gone ahead and optimized the portfolios for all the risk points, and at each point, I’ve identified the maximum and minimum return possible. Please note, I’ve rounded off the decimal values here, just so that the table looks pretty ☺
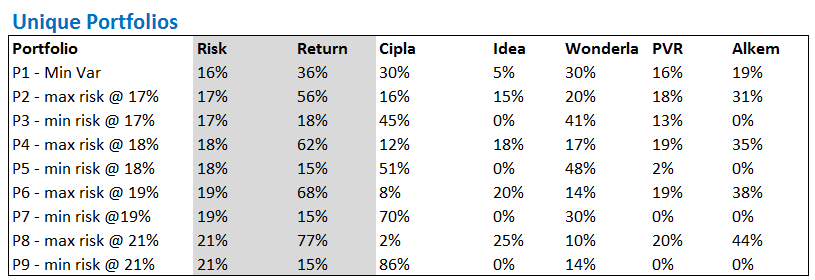
If you notice, I’ve highlighted the risk and return values of each portfolios. I’ll now go ahead and plot a scatter plot of these data points and see, what I can see.
To plot a scatter plot, simply select the data points and opt for the scatter plot under the insert ribbon. This is how it looks –
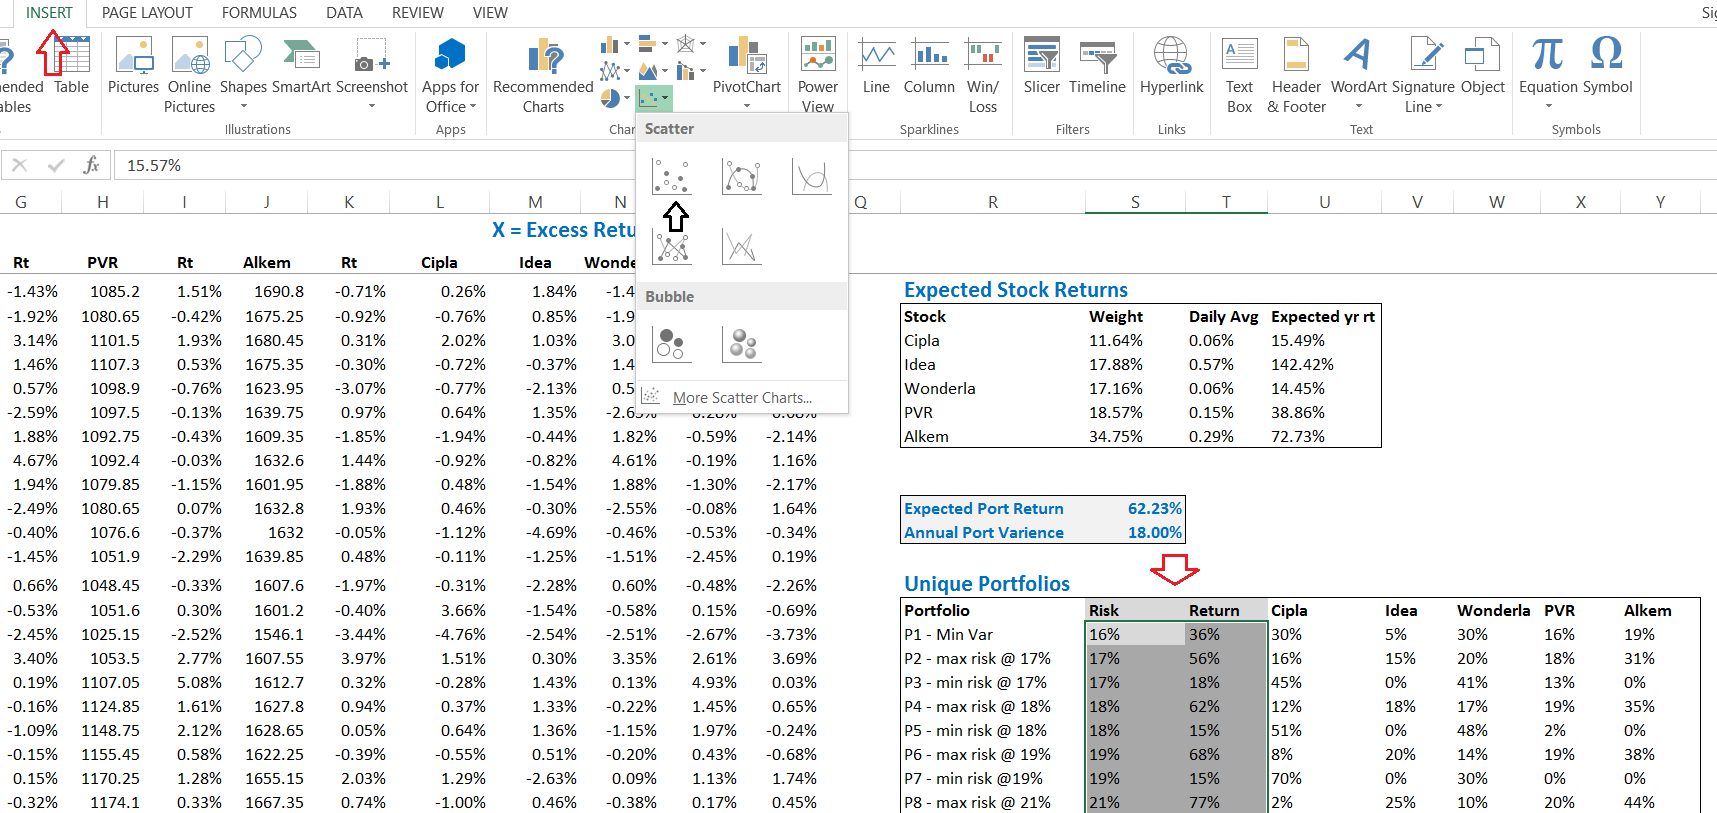
Once you click on the scatter plot, you will be able to see the how the plot appears. Here is how it looks, of course, I’ve tried to format the graph to make it look more presentable.
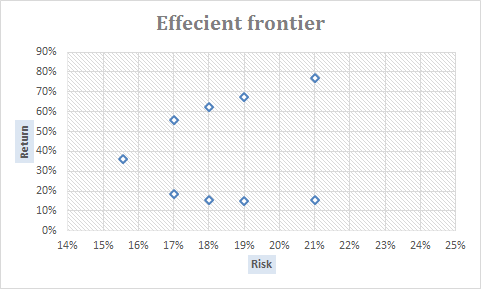 This curve that you see above my friend, is called the ‘efficient frontier’ of this portfolio. So what do we understand from this curve and why is it so important? Well, quite a few things, lets deal with it one by one –
- As you can see, the X-axis represents risk and the Y-axis represents returns
- Starting from the left most point, the one which seems to be a little isolated from the rest, represents the minimum variance portfolio. We know this portfolio has a risk of 15.57% with a return of 36.25%.
- We now move focus to 17% risk (notice the x axis), you can find two plots, one at 18.35% and another at 55.87% – what does this tell you?
- It tells us that at 17% risk (or when we are particular about fixing the risk at 17%), the best possible portfolio can achieve a return of 55.87%
- The worst possible portfolio (in terms of return) is 18.35%
- In simple terms, when you fix a level of risk you are comfortable, you should aim to maximize the return
- There are multiple other portfolios that are possible between 18.35% and 55.87% (when we fix risk at 17%) these would be represented as plots between the minimum and maximum return. All these portfolios are considered inefficient, the minimum return portfolio being the worst amongst the rest
- So as an investor, your aim should be to maximum the return, especially when you have some clarity on how much risk you are willing to bear
- You can notice the same behavior for risks at 18%, 19%m and 21%
- The best possible portfolios, or in other words, the efficient portfolio will always lie on the line above the minimum variance portfolio. This line is highlighted below

So, you as an investor, should always aim to create a portfolio, which lies on the efficient frontier, and as you may realize, creating this portfolio is merely a function of rearranging weights as per the results obtained in portfolio optimization.
Think about it – when you risk your money, you obviously want the best possible return, right? This is exactly what the curve above is trying to convey to us. Its prompting us to create portfolios more efficiently.
In the next chapter, we will take a quick look at a concept called “Value at risk” and then proceed to understanding risk from a trader’s perspective.
You can download the excel sheet used in this chapter.
Key takeaways from this chapter
- A portfolio with certain weights to each stock is considered unique
- When we fix the desired level of risk, we can optimize the portfolio to yield the minimum return and maximum return portfolios
- Between the min and max return portfolio (for a given fixed level of risk), we can have multiple unique portfolios
- The scatter plot of risk and return gives us the efficient frontier
- For a given level of risk, the best possible portfolio one can construct would lie on the efficient frontier, all other portfolios are deemed inefficient
I am working with 5 Stocks with latest 6month of data. All stocks have given return so my Expected Portfolio return is in negative. I using solver tool but for max and min return. But it giving same negative value after increasing the risk value and weights of stocks changing don\’t know why. Please help me out
Please take larger data set. Also, pls make sure your data is clean.
Is there any software or application avaliable where we can drag drop NSE stocks and see efficient frontier.? Or we need to do in excel only?
Ah, no. I dont think so 🙂
What is success rate ?
Does it work out in present market conditions sir ?
This is an optimization technique, Jaya. It works as good as your optimization model 🙂
You are awasome Karthik, thank you. mindblowing knowledge
Happy learning 🙂
Sir how did you calculate the daily avg in the Expected Stock Return.?
The simple average function of the daily stock returns will give you the daily avg price. I\’ve explained this in earlier chapters.
For a Minimum Variance Portfolio, is there only 1 possible return value? No max, min, range?
Yeah, just 1 portfolio.
1) Sir when the weight shows negative value you told to set a constraint saying min weight = x%. But when we put this limitation then excel might not calculate the max /min returns properly which is our primary objective.
2) what you personally do when you find a negative weight value. sell the negative weighted stock and increase weight in other stocks or any other way ???
1) Why do you think the calculations won\’t be proper? Assignment of weights will either be the min that you set or something else that the optimizer thinks is correct
2) When you put a min weight, there is no way you get a -ve weight right?
Sir when I am using the solver to get a optimal portfolio the weights are not getting distributed evenly among the portfolio only 2 or 3 stocks are getting maximum weightage and the rest are being allocated 0
You need to set a constrain wherein the minimum exposure to a stock is at least 10% or say 5%.
Fantastic, tutorial. Many thanks!
Happy learning, Mike!
And in Portfolio 3, the return is 25.69% in my case but 18.35% in yours. Same doubt.
PLease see my earlier reply. Btw, I think I\’ve made a mistake in selecting the cells while calculating the average. Maybe its because of that. We have discussed this in the comments.
Hey Karthik!
In the fixed variance part, I did it using the Excel sheet provided by you, but my expected portfolio return is coming out to be 53.34% whereas yours is 55.87%. What could be the reason for this difference?
Very hard for me to figure the reason, maybe some parameter could be off. Please do evaluate each step again.
Hi, I am getting negative weights for some risk return combination, is it possible to get negative weights??
Yes, hence you need to set a constraint saying min weight = x%.
Sir I am getting stuck while optimizing portfolio, in the 2nd part, I have 18 stocks in my portfolio and variance is coming 1.49, after optimizing in solver for minimum variance it is coming as 0.74. Now in the next step I am unable to do the plotting of efficient frontier curve, sir if you allow me should I send you my Excel sheet?? Plz reply..
Kallol, I\’m not sure if I can look at individual excel sheets, swamped with work 🙁
Please do a step by step analysis and I\’m sure you can spot the error. Let me what happens.
Solver Tool is not working on calculating Return based on Min. Variance
Dear Karthik sir,
In the table of unique portfolios (which are being generated). Some of the portfolios, shows weight assigned to certain stocks as 0%, those who were optimized for minimum return with fixed level of risk. Any insight on this sir 🙂
It just means that the optimizer is suggesting that the allocation of stock should be 0 🙂
Hi, Since we are taking the historical data to evaluate expected return, hence the weights for optimizing the portfolio will also be based on historical data. Dont you think we should add a disclaimer in the article to tell people that it is prone to errors as we are using historical data? What are your thoughts on this?
Yes, I agree with you. Btw, all market models are based on historical data, Gaurav. So one should accommodate for modelling errors.
Hi, first of all im really impressed of your work and the value of every lesson so far!
Heres my question, I want a portfolio with different assets. I also want to short some assets in the shorter perspective to maximise my overall portfolio return. How do I calculate this in excel? I mean how does that change my overall portfolio optimization and the weights which I assigned to the assets.
The Assets itself does not matter as long you have the data across the same dates. Shorting, you simply remove the constraint in excel solver where in you specify the weight of the asset = a non zero value.
Sure, will try with different time periods and reflect on the conclusions.
For efficient frontier, I am sharing the link again with full access. Please see if it works.
https://drive.google.com/file/d/1gsELZTt4rhbm6WIth-HghRsQftX6m-VB/view?usp=sharing
I will continue to fool around to figure out if something works.
Its really hard to debug this massive excel, but I did see the last sheet which has the EF. I can sense that you are more or less on the right track, except for a small deviation somewhere within the model.
Hi Karthik,
Thanks for such beautifully curated content. I feel the simplicity (you know it well enough 🙂 ) with which you have explained is unparalleled. Thanks again!
Could you please review my sheet as I am getting an absurd looking efficient frontier curve.
https://drive.google.com/file/d/1gsELZTt4rhbm6WIth-HghRsQftX6m-VB/view?usp=sharing
Also since the model is projecting historical risk return characteristics, are there any techniques to adjust for paradigm shifts like the one happening these days where the leaders of the market might not be the same as the leaders of tomorrow?
Example: The model continues to overweight banks and underweight pharma for max return objective ( or vice versa for min return objective). Current market analysis, however, maybe telling a different story altogether.
Thanks for the kind words 🙂
Unable to open that link. Anyway, you can run two models, one with 1 to 1.5 years of data and another one with 6 months data and check for overlaps and new trends.
Hi Kartik,
My bull call spread strategy on ITC is as follows:
Spot: 195.9
Lower Strike: 200 CE (BUY)
Higher Strike: 205 CE (SELL)
I selected the aforementioned strikes because I expect the move to happen in 12-15 days.
Now, the margin that I being charged is 22,278.
This is my first options strategy trade so my question is does one place buy and sell order one after the other in order to claim the margin benefit or it doesnt matter whether i place the order of buy or sell on the exchange first.
You need to place the buy order first and then the sell order to get the benefit. Good luck with the trade.
Dear Karthik,
I was just dejected. Now i removed all the negative values and now the solver gave the following results:-
Risk 24%, Return 4%, Marico 53%, Heidelberg 25%, KRBL 0%, Castrol 12%, GAEL 0%, Laopala 8%, VIP 0% and Jyothylab 0%.
As i said earlier suppose an investor has already entered into the stocks with the respective weights Castrol Industries – 10.34%, GAEL – 10.55%, Heidelberg – 8.14%, Jyothylab – 14%, KRBL – 16.29%, Laopala – 9.72%, Marico – 16.26% and VIP Ind – 11.97%. Now the no of shares to be added on Marico, Heidelberg, Castrol and Laopala. What should the investor do with KRBL, GAEL, VIP and Jyothylab.
Do ans at the earliest,
Sonjoe
So the model is suggesting you to sell KRBL, GAEL, VIP, and Jyothylab and increase exposure in other stocks in the given proportion.
This all i know….but i\’m using excel 2007 ya. Not ans to my specific question. If u don\’t want to ans its ok. Bye
Joseph, why are you getting upset 🙂
I don\’t have access to 2007 version. I can check and get back to you. But I don\’t think there will be much difference.
Karthik how to add the condition that the values should not be -ve. I\’m using the Excel 2007 version were the solver layout is completely different from your excel solver seems ur using Excel 2013 or higher versions.
Regards,
Sonjoe Joseph
Check step 4 here – https://zerodha.com/varsity/chapter/po2/
Hi Karthik,
Good Morning Karthik. How are you. Just had a doubt while i was just reading the chapter. Suppose just presume an investor has bought the following stocks Castrol Industries – 15 @ Rs.150, GAEL – 15 @ Rs.170, Heidelberg – 10 @ Rs.170, Jyothylab – 20 @ Rs.158, KRBL – 15 @ Rs.295, Laopala – 10 @ Rs.205, Marico – 10 @ Rs.380 and VIP Inds – 10 @ Rs.350. The weights of the stock Castrol Industries – 10.34%, GAEL – 10.55%, Heidelberg – 8.14%, Jyothylab – 14%, KRBL – 16.29%, Laopala – 9.72%, Marico – 16.26% and VIP Ind – 11.97%.
I have done the portfolio optimization calculations and finally i choose the Max risk @ 38% with a return of 57%. In order to achieve this return with the excel solver calculations done its telling to adjust the portfolio with the following % which are listed below:-
Castrol Industries 76%, GAEL -7%, Heidelberg 0%, Jyothylab -20%, KRBL 12%, Laopala 36%, Marico 76% and VIP Ind -20%
Now my question is how much no of stocks should i add in Castrol, KRBL, Laopala and Marico and the no of stocks which have to to reduced in GAEL, Heidelberg, Jyothylab and VIP Ind. How to do the calculations since with regard to this calculations its not there in this chapter. It will be helpful if you can explain the calculations so that we can know how many shares to add on and to be decreased.
Awaiting for your reply.
Thanks and Regards,
Sonjoe Joseph
Castrol Industries 76%, GAEL -7%, Heidelberg 0%, Jyothylab -20%, KRBL 12%, Laopala 36%, Marico 76% and VIP Ind -20% —-> -ve values suggests that you short stocks, which you cannot. Hence in the solver, you will have to add a new condition saying the values should not be -ve. I have explained the same in the chapter itself.
SIR , The solver is giving me 0% for certain stocks in my portfolio for Min Variance,and also while exceeding the var the % of 0% stocks increasing…..is the solver acting funny or I should believe it,,,but i want to really keep those stocks in my portfolio….kindly help….
This happened to me as well, I\’m not sure why it happens. Must be some syntax error. I restarted excel and it worked 🙂
Thanks Sir,
Is there any way we can find 5 stocks combination out of 500 stocks universe with best risk-return profile?
The easiest way is to track the volatility for each stock, could be cumbersome for 500 stocks, without programing.
Hi Sir,
How to get expected returns of a security?
By looking at its historical returns.
Can we follow Level 1 SD, 2 times SD , 3 times SD for minimum variance portfolio and find the range of returns ?
Yes, you can use SD for returns range.
Hey Karthik,
Thanks a ton for this module. I am coming across many things for the first time.
And I have a doubt, at the very start of the portfolio management, we take the historical price of a scrip. So, what\’s the ideal time range(1 month/6 months/1 year) to collect data depending upon how long I want to hold it,
for eg- If I want to hold my shares for 1 month, then what will be the preferable time I need to look back to take data?
I\’d suggest you take 2 years of data Vaishak and work around the model.
Hi Kartik. Thanks a lot for this kick-ass approach to teaching Portfolio Optimization. I am new to Zerodha and have explored the various offerings. I was particularly interested in Smallcase. Looking at the portfolios there, I assume similar optimization exercises would have gone behind the portfolios. However I was interested to know if Small case or others have plug and play tools to test out variances( risk ) and returns with inputs like stock selections, weights, duration of returns ( week,month, year etc) . I agree that it is a DIY exercise that one can do with the easy to follow steps you have shared. But for time constrained beginners like me, is there a feature available in the market? Thanks a lot again for the brilliant and exhaustive course that you have set up through Varsity
Thanks Rohit.
I\’m really not sure if folks at smallcase have this, maybe you should check with them directly 🙂
Firstly thanks for thr prompt response. I was pleasantly surprised 🙂
Actually i didn\’t intend to evaluate the portfolio of the fund. Rather I thought to apply this methodology to my portfolio of multiple funds (treating them as stocks). But I do get your point.
Just 2 followup questions. I\’m assuming that this evaluation will be on the day I run it and may change everytime when I update the daily close prices.
While this sheet captures how many stocks I\’ve of a company (via weightage), but it does not capture when (and in what qty) I bought the stocks. Does that not affect the outcome (because the cost and P&L of my portfolio will depend on when I bought the stocks). Might sound a dumb question, but then better ask and clarify rather than assume. Thanks again
Yes, Barkha. As the stock price changes, so would the model and its output.
\’When\’, does not really matter but the weightage does. The weights to change as and when the stock prices change, and this is taken into consideration every time you run the model.
Hi Karthik
You\’ve beautifully explained such complex mathematics to newbies like me. Definitely gives me a perspective on my portfolio and expectations. It\’ll surely do me good as I improve my understanding about investing.
Just wanted to know if these fundamentals can be applied for mutual fund portfolio optimisation as well. To me it seems since both vary with market, it should be possible. But your comments please. Thanks
Thanks for the kind words, Barkha. Technically, you can use the NAV of the MF just like the stock prices and do all of this on MFs also, but I dont know if it makes sense to do that. End of day, you invest in a MF because you want the fund manager to deal with all of this 🙂
Hi Karthik
How do I share the sheet with you? Can you please let me know?
Hmm, will be a bit tricky. Maybe you can try uploading on Google drive.
Hi Karthik
I\’m trying to get it working for my stocks – its seems to be having the below issues:
Data:
1. I\’ve taken 5 stocks as sample: ITC, GHCL, Reliance, IOC, ONGC
2. Took monthly returns data starting April 2010 till March 2020
Output Using Solver:
1. Its not able to solve anything less than 21% Variance
2. If i try for 22,22,23,25 percent variances for Min, Max, I see that the Min and Max returns are same for the same risk. Example: 22% Min and Max Portfolio returns and Stock Wise Weights are the same..
And for Annual Port Variance, I\’m using =R65*SQRT(12) (As i am converting monthly returns data into Yearly)
I couldn\’t figure out what the issue is. Can you please help?
1) Maybe max variance is 21%?
2) I need to look into this
Thats correct.
Hi Karthik.
You have presented all the very complicated material in the most understandable way. Thank you so much for that.
One doubt. The variance of my portfolio comes out to be 11.43% and the expected annual return is 23.84%. But when I use solver function, then at the same variance (11.43%) the max return works out to be around 20% and at 12 % variance the max returns comes out to be around 22%. How\’s that possible? Isn\’t solver method a fool proof method? Or I\’m doing some mistake? Please reply. Thanks.
At 11.43% risk, max expected return is 20% and at 12% risk, 22% max expected return seems intuitive for me. Is there something I\’m overseeing?
Hello,
For the optimisation of portfolio, We have to sell certain securities and buy others from our portfolio.That amount will not be the same So can it happen that overall return increases(Percentage vise) but absolute return will be lower compared to what we could have got without changing portfolio?
THANKS
Thats a possible situation.
I thank you for writing this! Varsity is very much helpful in learning.
But I notice that you wrote \’risk\’ in place of \’returns\’ multiple times including the excel sheet. We calculate max and min returns possible for fixed risk, yeah?
I initially got confused while reading.
Please correct these so other readers can understand easily.
Ah, thanks for highlighting this. Let me check this, Sugan!
hi kartik i have done same thing what you said in this module but when ever i m going for solver calculation it\’s solution show me 100% on only on one stock behalf of other stocks…….
also when i m trying to run on max variance its again show 100% on that particular stock…
i have tried multiple times with multiple stocks but the result remains same its just show me that i have to invest all my money on just one stock..
please help me out with it
Ah, Ricky, I exactly know what you are talking about. This is the problem with excel, it acts funny at times 🙂
The only way to do this is by redoing. I know it does not sound like a great solution, but that\’s the only way.
Btw,
1) How many stocks do you have in the portfolio?
2) Is one of the stocks trending very well/very bullish?
3) Have you put in a constraint saying the minimum weight in each stock should be at least x%?
i have 7 stocks in my portfolio.. and there is no such stocks which is very bulish and yeah in my 1st calculation i have put same weights but in 2nd calculation i have change the variation. but still got same error….
stocks are
ONGC.NS.
OIL.NS.
IOC.NS.
IGL.NS.
HINDPETRO.NS
GAIL.NS.
BPCL.NS.
Hmm, have you put the constraints per stock?
Hi Karthik,
First of all, thanks a lot for all the treasure trove of knowledge you have imparted through all your modules. I am definitely a much informed investor (and a would-be trader) now. I had one query regarding frequency of portfolio optimization. How often should we optimize the portfolio, as every new month, last 6 months returns data would change and hence, weights of the optimized portfolio would also change.
Is it ok if we do this exercise every 6 months or on a yearly basis ?
Regards,
Unmesh
Unmesh, I\’m happy to note that you found the content quite useful. Yes, you can run the optimization once in 6 months. Good luck!
Thanks Karthik 🙂
Cheers!
Mutual funds are doing this kind of analysis or they follow different methods ? This is mainly for small investor or for Big fund houses, I know any one can use,but fund houses really calculate like you have done ?
Depends on the fund house, some of them can go deeper.
Hi Karthik – I ran the solver on my portfolio and at Min risk returns are coming to be negative. Is it possible or there is some error in data series?
Thanks in advance
Hmm, this is not intuitive, unless your portfolio has a lot a lot of money in the past.
Thank you Kartik. You\’ve been always very helpful. I wanted to know that how do I start applying for firms in investment field? I want to learn trading with smart money.
Its best if you can target the Asset Management firms and try and get an assignment there. I\’m talking about firms like DSP, HDFC, ICICI Pru, Invesco etc. Good luck!
As far as I\’ve heard, getting into Hedge Fund is a highly tedious process in India. There are hardly any well established firms in Financial Markets of India. The market in India being highly uncertain, Hedge Fund managers are first to lose their jobs whenever there is an economic meltdown. Is that right?
I just needed some clarity in this domain of Finance, I\’ll be giving CFA this year for sure.
Thank you for all the inputs!
Sort of yes. Look for Alternative Investment Funds (AIF). I\’ve heard Futures First is a good company, maybe you could give it a shot. Good luck!
like hindalco and tata steel from metal sector and tata motors and TVS from automobiles and so on…thanx
Yes.
Karthik sir what if we select 2 to 3 companies from each sector including niftybees and gold etf also …all companies are major company in that sector. this will be good idea or ..????
Yes, since it is diversified.
if a stock has been in a downtrend for a long time .. the expected returns will be negative and in a extended bear cycle like in 2008 the whole portfolios expected return might be negative .. Is it normal ?
Plus the solver tends to assign a negative weight-age to some stock while increasing in others to get a net of 100, How do we solve this problem ?
Great job by the way . I was struggling to find such concise material on the net 🙂
You can put a constraint saying minimum investment to a stock is \’x%\’. In that way, we can ensure there is some sort of exposure to each stock that we have picked.
The insights provided by you is great and informative. Diving into stock market with this knowledge really helps. My sincere thanks to you and your team. Looking forward for more insights.
Glad to hear that, Pankaj. Good luck and happy learning.
Any plans to release this as a feature in kite ? Could save a lot of manual effort
Not at this stage, Sajith.
Hello Sir,
why smallcase portfolios are not optimized? I see all portfolios are equiweighted.
You will have to check with them 🙂
Respected Sir,
3 out of 4 stocks in my portfolio (taking 30 days data) have been bearish for past month, hence, getting bearish Equity Curve. That’s fine. But, the Efficient Frontier graph is not like the one described above. It is forming a curve which is (somewhat) horizontal mirror image of the one described here. In fact, it resembles numeral ‘7’, or ‘>’ sign.
Is it possible to have such graphs for Efficient Frontier? If yes, why does my curve looks like \’7\’; is it due to bearish stocks? If not, what possibly would have gone wrong, please suggest?
More importantly, does the Efficient Frontier always resemble (more or less) the pattern described above for any type of portfolio, although may be little skewed, of course?
Thanks in advance!!
Regards
James
I\’ve not come across such a graph, even if the entire portfolio is made up of losing stocks. Are you sure you are doing this right step by step?
Thanks for confirmation. I was thinking exactly same. Actually, I figured out that there is a technical issue in my Solver Tool (Excel 2007), giving weird data points for same set of equations. Guess, it\’s time to upgrade the version, or reinstalling may work.
By the way, thanks again for your help & for simplifying such advanced topics.
Regards
James
Good luck, James!
waiting for..
\”Understanding risk from a trader’s perspective\” Chapter
when will it publish ?
The next chapter is on Value at risk….will take it up after this chapter.
Hi karthik,
After completing all the modules i have become a big admirer of u. Hats of to u & ur team. Presently i am working in a psu since 6 yrs but after getting shares knowledge from ur website i am intrested in pursuing a career in share market. Is there any course which i can do without leaving my present job and get a entry in NSE or BSE.
Thank u
Arun, happy to note that you liked all the information here. I\’d suggest you take a look at the CFA certification offered by the CFA Institute, USA.
1. If i pursue it from CFA,USA Will i b eligible for a job in usa after completion of level 3 exmination?
2 What if i do it from NSFM WHICH IS BEING CONDUCTED BY NSE IN INDIA?
Thank u
1) CFA is recognized in US. However, I\’m not too sure about the job market there.
2) You cannot really compare NCFM and CFA.
Would you encourage people to pursue courses like NISM and NIFM? Are these courses helpful in establishing a career in Financial Markets?
Since CFA would cover the entire Financial Domain. What kind of courses should one pursue in order to restrict themselves for a career in Financial Markets?
If you are serious about a career in investment management, then I\’d strongly suggest courses such as CFA or FRM.
Dear Karthik,
I would be happy if you can brief the calculation of Min Risk say @17% since i\’m not getting the correct answer. Moreover I\’m using Excel 2007 version and i didn\’t find the check box \”Make Unconstrained Variables Non-Negative\” and the selection box \”Select a Solving Method GRG Nonlinear\”.
Do help me out in getting the correct answer. I\’m not able to attach any files since its not allowed here.
Regads,
Sonjoe Joseph.
I went through your excel sheet as well, but I was unable to figure out whats wrong. I\’d suggest you restart excel and check again. I\’ve had instances when solver has acted a little funny. Restarting usually works.
Well still the problem is not solved.
Hi Kartik,
All the tutorials are awesome. They reflect the trouble you have gone through in preparing them and your hard work.
Eagerly waiting for complete PDFs of module 9 and 10.(and further modules if you have planned them)
All the best!!
Thanks for the kind words, Yash 🙂
The PDF will be ready once the module is complete. My guess is that it will be ready by end of July 🙂
Hi Karthik,
Thanks for another insightful chapter.
In our example, if we look at Unique Portfolio table, Cipla & Wonderela seems to major contributors of risk and Idea & Alkem appears to major contributors of Reward. PVR looks neutral.
Is there anything more we can do to it as next step, like replacing risk stocks with some other better stocks?
Thanks & regards
Santosh shetti☺
Replacing stocks is more of a stock picking skill 🙂
Portfolio optimization is more of what can be done once you\’ve picked the stocks.