14.1 – Percentage Risk
Last chapter we looked at three important position sizing techniques, all of them were unique in their own merit. The three techniques were –
- Unit per fixed amount
- Percentage Margin
- Percentage Volatility
All three methods work differently and when combined with a certain equity estimation technique, they produce totally different results. Given this, it is really up to you to figure out the marriage of which position sizing technique with which equity estimation technique works best for you.
Before I proceed, I thought it is important to discuss another practical position sizing technique, called the ‘Percentage Risk’, method. I do know quite a few traders who use this and I myself find this quite simple and intuitive technique to use.

The percentage risk method, relies upon your own assessment of ‘loss’ that you are willing to bear for a given trade. This, as you may know is also called the ‘Stop loss’ for the trade. The stop loss for a trade is the price at which you decide to close the trade and take a hit. The percentage risk technique controls the position size as a function of risk defined by stop loss.
Let me take the example of a stock futures and explain how this works, in fact, I think this is a good trade setup –
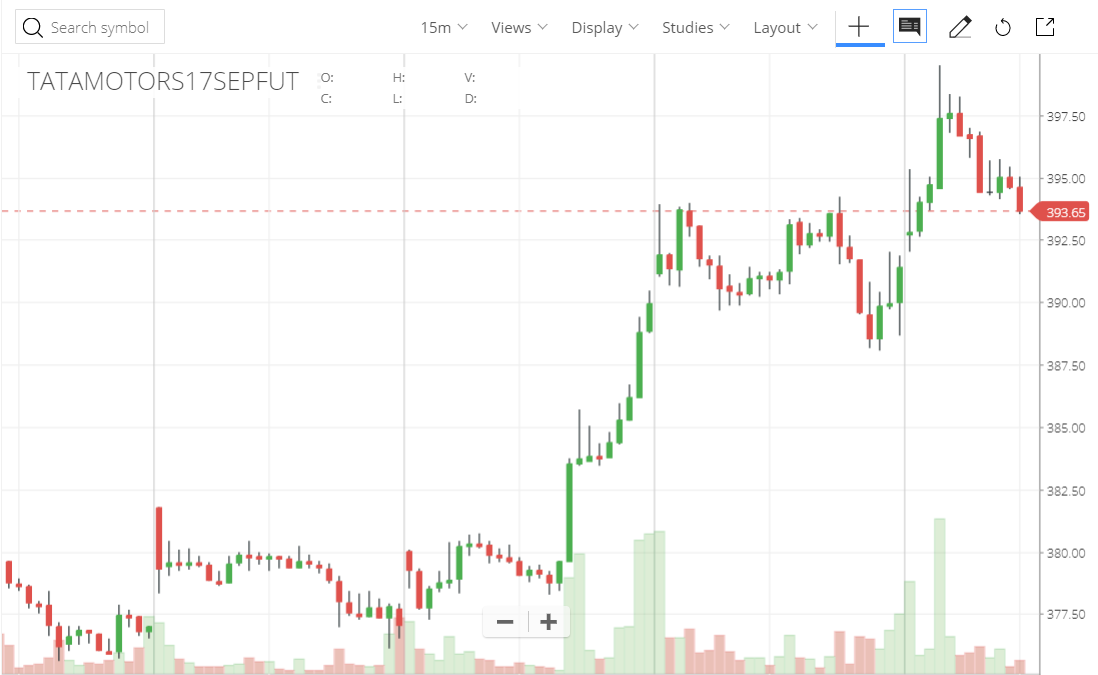
Here is an intraday chart of Tata Motors, the frequency is 15 mins (14th Sept 2017, around 11:30 AM).
Let me explain why this is a trade worth considering –
Tata Motors is at 393.65, which happens to be a price action zone, considering it tested the same level, twice in the past. So this makes 393.65, a support price for Tata Motors (on an intraday basis). Both the times in the past, the price declined of Tata Motors declined when the stock tested 393.65. Given this, there is a possibility that the price could again test 393.65 and react to bounce back to the price from which it started to decline i.e 400.
Also, do notice the low volume retracement between 400 to 393.65 – I’ve discussed why I like trades like these in the Technical Analysis module. If you’ve not read that module, maybe you should ☺
Considering these factors, a trader could be inclined to go long on Tata Motors Futures at 393.65.
What if the trade heads the other direction? What is the stop loss?
I notice some sort of support at 390/-, hence I’d be happy to set this as stop loss for the trade.
Nothing complicated, as you can see this is a very straightforward setup.
So the trade would be –
Stock: Tata Motors Limited
Trade: Long
Trade Price: 393.65
Target Price: At least 400
Target value 6.35
Stop loss Price: 390
Stop loss value: 3.65
Reward to Risk: 1.7 (which is great for an intraday trade)
Lot size: 1500
Margin Required: 73.5K
Now assume I have a capital of Rs.500,000/-, how many lots of Tata Motors can I buy considering the margin per lot is Rs.73,500/-?
Technically speaking one can buy up to 6.8 or 6 lots –
500000/73500
=6.8
However the question is – would you expose your entire capital to this one trade alone? Not a smart thing to do, if you were to ask me, because if the trade goes wrong, you would be losing Rs.32,850/- (3.65 * 1500 * 6) on this trade.
In other words, you would lose –
32850/500000
=6.57% of your capital on one trade.
However great a trade set up is, it is not a smart thing to expose so much capital to risk. As a thumb rule, professional traders do not risk more than 1 to 3% of their capital on any single trade, and this rule forms the core of the ‘Percentage risk’ position sizing technique.
Given this, let us define the maximum risk per trade as a percentage of overall capital – maybe 1.5% for now. This means on this trade, the maximum loss I’m willing to bear is
1.5% * 500000
Rs.7,500/-
In other words, I don’t intend to lose more than Rs.7,500/- on any single trade. This is the maximum loss threshold.
We know the stop loss for this trade is 390, from an entry price of 393.65, the stop loss in absolute Rupee terms is –
393.65 – 390
= 3.65
The loss per lot is –
3.65 * 1500
= 5475
In the event the stop loss is triggered I would be taking a hit of Rs.5475 per lot.
Now to identify the number of lots I could take for the risk I’m willing to bear, I simply have to divide the maximum threshold by the loss per trade.
= 7500/5475
= 1.36
Therefore, on this trade I can go ahead and buy up to 1 lot, which will cost me Rs.73,500/- as margin deposits.
For the next trade, it is prudent (or rather conservative in a positive way) to reduce the money blocked from the overall capital and re-work the maximum loss threshold. Let’s do that and identify the new max loss threshold –
500000 – 73500
= 426,500
1.5% * 426500
= 6397.5
Given this, for the next trade, I will work out the stop loss, multiply that with the lot size and divide the max risk i.e 6397.5 by loss threshold to identify how many lots I can transact in.
So on and so forth!
By the way, curious to know how the trade panned out? Here you go –
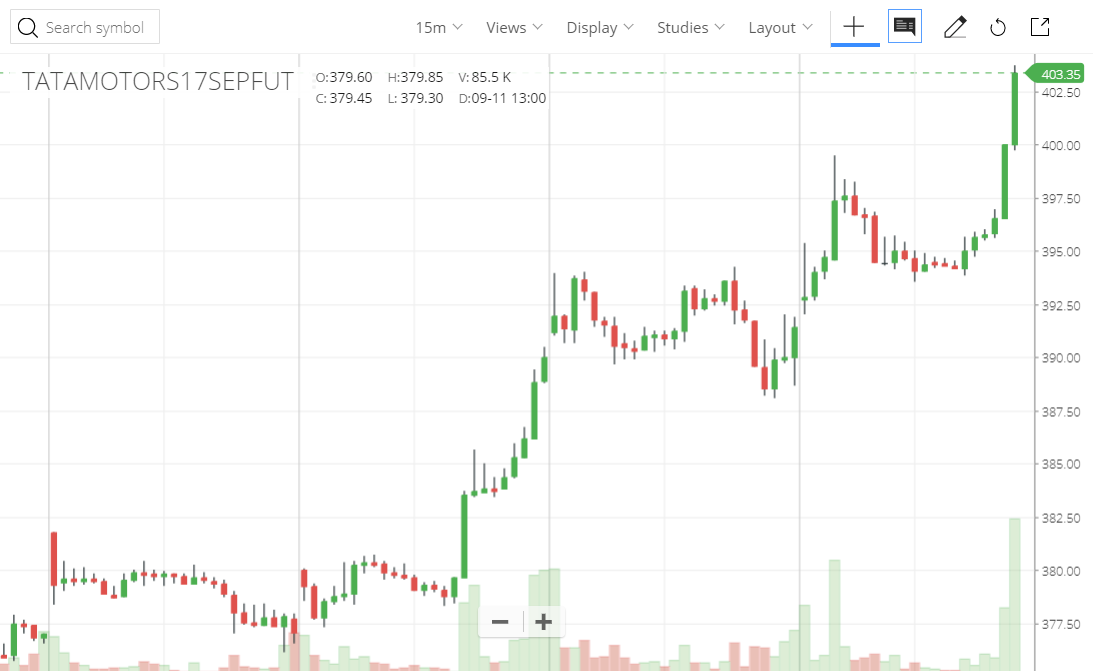
I like trades like these, when the price does not even approach close to the stop loss J. As I had pointed out earlier, I did have a great amount of conviction on this trade. This leads me to the next topic – how do I position size when my conviction on a particular trade is high? What in such situations I want to expose a slightly higher capital?
Well, say hello to Kelly’s Criterion!
14.2 – Kelly’s Criterion
Kelly’ Criterion has an interesting background. It was proposed by John Kelly in the 50’s who at that point was working for AT&T’s Bell Laboratories. He in fact, suggested the Kelly’s Criterion to help the telecom company with long distance telephone noise issues. However, the same theory was adopted by professional gamblers to identify the optimal bet size. This soon found its way to the stock markets as well, and there are many professional traders and investors who use Kelly’s Criterion for bet sizing. Perhaps, this is one of those very few tools that both traders and investors commonly use.
I still don’t know how the transition from Telecom to stock markets happened – I’m a Telecom Engineer by qualification (although I know nothing about Telecommunications now) and I’ve been involved in Stock markets for over 13+ years….but I just can’t wrap my head around how Kelly’s Criterion made its transition across these two different worlds J
Anyway, the Kelly’s Criterion essentially helps us estimate the optimal bet size (or the fraction of our trading capital) considering –
- We have a certain information on the bet we are about to take
- We have an edge taking that particular bet
Let’s jump straight to Kelly’s Criterion with an example. The Kelly’s Criterion is an equation, the output of which is a percentage, also known as a the Kelly’s percent. The equation is as below –
Kelly % = W – [(1-W)/R]
Where,
W = Winning probability
R = Win/Loss ratio.
- The winning probability is defined as the total number of winning trades divided over the total number of trades
- The win/loss ratio is the average gain of winning trades divided over average loss of the negative trades.
To understand this better, let’s take up an example. Assume I have a trading system which has produced the following results, for sake of simplicity, let’s assume this is a trading system to trade just one stock, Tata Motors.
| Sl No | Signal Date | Result | P&L (in INR) |
|---|---|---|---|
| 01 | 3rd Sept | Win | + 5,325 |
| 02 | 4th Sept | Win | +2,312 |
| 03 | 5th Sept | Win | +4,891 |
| 04 | 6th Sept | Loss | – 6,897 |
| 05 | 11th Sept | Win | +1,763 |
| 06 | 12th Sept | Loss | -3,231 |
| 07 | 13th Sept | Loss | -989 |
| 08 | 14th Sept | Loss | -1,980 |
| 09 | 15th Sept | Win | +8,675 |
| 10 | 18th Sept | Win | +4,231 |
Given the above data –
W = Total Number of winners / Total number of trades
= 6/10
=0.6
R = Average Gain / Average Loss
Average gain = Average of [5325, 2312, 4891, 1763, 8675, 4231]
= 4,532
Average loss = Average of [6897, 231, 989, 1980]
=3,274
R = 4532 / 3274
= 1.384
Do note, a number greater than 1 is always desirable as it indicates that your average gains are higher than your average loss.
Lets plug these numbers back to the Kelly’s Criterion equation –
Kelly % = W – [(1-W)/R]
= 0.6 – [(1-0.6)/1.384]
=0.6 – [0.4/1.384]
= 0.31 or 31%.
As per the original school of thought – Kelly’s percentage is a direct representation of how much capital one should expose for a trade. For example, for the 11th trade on Tata Motors, Kelly’s Criterion suggests a capital exposure of 31%.
But I think this can be a little tricky, imagine a trading system with great accuracy – the Kelly;s Percentage can turn out to be 70%, suggesting a capital exposure of 70% to the next trade. Not a very smart thing to do if you ask me. However, you may ask why not? After all a system with 70% accuracy is a great, so why not maximize the bet?
This is because, there is still a 30% chance to lose 70% of your capital!
Given this, here is a simple modification to Kelly’s criterion. Let us go back to the percentage risk position sizing technique we discussed earlier in the chapter.
We defined the percentage risk as a technique wherein the exposure to a trade is defined as 1.5% (or any percentage) of the capital. Given Kelly’s criterion, we can modify the exposure as ‘up to 5%’ (or any percentage you deem suitable).
What does this mean? This means for a given trade, I would not expose more than 5% of the capital. This also means that capital exposed could range from as low as 0.1% to all the way up to 5%. So how do I decide?
We can use Kelly’s percentage here. For example if the Kelly’s percentage is 30%, then I’d expose, 30% of 5% or in other words, I’d expose 1.5%. If the Kelly’s percentage is 70%, then I’d expose 70% of 5% or say 3.5% of the capital on the trade.
So higher the Kelly’s percentage, higher is the capital exposed and vice versa.
For a more Mathematical explanation on Kelly’s Criterion, I’d suggest you watch this video, if not for anything, watch from the 10th minute onward.
With this, I’d like to close the discussion on position sizing, hopefully the last 4 chapters has given you a fair understanding of the importance of position sizing and techniques to position size your bets.
Onwards to ‘Trading and Investing Biases’.
Key takeaways from this chapter
- Percentage Risk is an easy and intuitive position sizing technique
- One has to define the maximum amount of risk one as a percentage of capital, dividing this over the stop-loss gives us a sense of how much capital one should expose to a trade
- Kelly’s Criterion suggests how much capital one can expose for a given trade
- One can combine Kelly’s Criterion with percentage risk for optimal results
Hello sir, I am backtesting the supertrend buy/sell strategy and am stuck at the position sizing problem. I am adding 1 position for each 30-period high or low break for buy/sell signals. The problem is how to calculate the returns. each trade has a different position size and hence different capital. on what capital should I calculate returns %. I tried taking the maximum number of positions and using that as capital for all trades. Another way is average positions and using that as capital. BUY/SELL ENTRY DATE TIME EXIT DATE TIME ENTRY PRICE EXIT PRICE POINT Positions Total positions Capital Total Capital
BUY 2018-10-12 09:15:00 2018-10-15 09:15:00 25215.6 25201.7 -13.9 1 100000 0
BUY 2018-10-12 09:30:00 2018-10-15 09:15:00 25250.3 25201.7 -48.6 1 100000 0
BUY 2018-10-12 09:35:00 2018-10-15 09:15:00 25287.85 25201.7 -86.15 1 100000 0
BUY 2018-10-12 09:45:00 2018-10-15 09:15:00 25300.5 25201.7 -98.8 1 100000 0
BUY 2018-10-12 09:50:00 2018-10-15 09:15:00 25373.1 25201.7 -171.4 1 100000 0
BUY 2018-10-12 09:55:00 2018-10-15 09:15:00 25380.25 25201.7 -178.55 1 100000 0
BUY 2018-10-12 10:00:00 2018-10-15 09:15:00 25382.15 25201.7 -180.45 1 100000 0
BUY 2018-10-12 10:05:00 2018-10-15 09:15:00 25429.5 25201.7 -227.8 1 100000 0
BUY 2018-10-12 10:10:00 2018-10-15 09:15:00 25462.75 25201.7 -261.05 1 100000 0
BUY 2018-10-12 10:15:00 2018-10-15 09:15:00 25411.95 25201.7 -210.25 1 10 100000 1000000
SELL 2018-10-15 09:15:00 2018-10-15 13:15:00 25201.7 25380.5 -178.8 -1 100000 0
SELL 2018-10-15 09:20:00 2018-10-15 13:15:00 25200.25 25380.5 -180.25 -1 100000 0
SELL 2018-10-15 09:45:00 2018-10-15 13:15:00 25164.95 25380.5 -215.55 -1 100000 0
SELL 2018-10-15 09:55:00 2018-10-15 13:15:00 25169.05 25380.5 -211.45 -1 -4 100000 400000
BUY 2018-10-16 09:20:00 2018-10-17 10:30:00 25519.65 25656.15 136.5 1 100000 0
BUY 2018-10-16 09:25:00 2018-10-17 10:30:00 25563.35 25656.15 92.8 1 100000 0
BUY 2018-10-16 09:30:00 2018-10-17 10:30:00 25584.3 25656.15 71.85 1 100000 0
BUY 2018-10-16 09:45:00 2018-10-17 10:30:00 25619.5 25656.15 36.65 1 100000 0
BUY 2018-10-16 09:50:00 2018-10-17 10:30:00 25637.2 25656.15 18.95 1 100000 0
BUY 2018-10-16 09:55:00 2018-10-17 10:30:00 25611.5 25656.15 44.65 1 100000 0
BUY 2018-10-16 10:05:00 2018-10-17 10:30:00 25637.95 25656.15 18.2 1 100000 0
BUY 2018-10-16 10:20:00 2018-10-17 10:30:00 25657.5 25656.15 -1.35 1 100000 0
BUY 2018-10-16 10:25:00 2018-10-17 10:30:00 25669 25656.15 -12.85 1 100000 0
BUY 2018-10-16 10:30:00 2018-10-17 10:30:00 25683.3 25656.15 -27.15 1 100000 0
BUY 2018-10-16 10:35:00 2018-10-17 10:30:00 25696.35 25656.15 -40.2 1 100000 0
BUY 2018-10-17 09:15:00 2018-10-17 10:30:00 25824.9 25656.15 -168.75 1 12 100000 1200000
SELL 2018-10-17 13:00:00 2018-10-22 09:15:00 25545.45 25267.75 277.7 -1 100000 0
SELL 2018-10-17 13:05:00 2018-10-22 09:15:00 25526.5 25267.75 258.75 -1 100000 0
SELL 2018-10-17 13:10:00 2018-10-22 09:15:00 25501.05 25267.75 233.3 -1 100000 0
SELL 2018-10-17 13:25:00 2018-10-22 09:15:00 25431.05 25267.75 163.3 -1 100000 0
SELL 2018-10-17 13:30:00 2018-10-22 09:15:00 25437.4 25267.75 169.65 -1 100000 0
SELL 2018-10-17 14:30:00 2018-10-22 09:15:00 25346.9 25267.75 79.15 -1 100000 0
SELL 2018-10-17 14:35:00 2018-10-22 09:15:00 25349.65 25267.75 81.9 -1 100000 0
SELL 2018-10-17 15:00:00 2018-10-22 09:15:00 25241.95 25267.75 -25.8 -1 100000 0
SELL 2018-10-17 15:05:00 2018-10-22 09:15:00 25130.7 25267.75 -137.05 -1 100000 0
SELL 2018-10-19 09:15:00 2018-10-22 09:15:00 25033 25267.75 -234.75 -1 -10 100000 1000000
The return should be on the basis of capital employed at the trade entry and the capital released at trade exit.
The average of losing trades is incorrect in kelly calc
Sure, checking this again.
Hey there, Karthik
I have been reading your blogs at varsity, for a while now and I would love to ask you this question
What is the difference between a Trader and a Gambler? I am aware that they have similarities, or maybe I am wrong about them having similarities, what I would like to know is your viewpoint on this.
Is trading similar to gambling, if one person loses when the other wins over here, what is the whole point of trading, how do people achieve this and pursue it as a full-time profession?
How did you pursue trading for 20 years? Please do share your viewpoints.
I am a college student who aspires to become a trader one day and have had my fair share of losses, I stumbled upon this question, when I was finding my answer to the question \”WHY TRADING?\”
Thank you in advance
Jaisurya, I had actually written about this – https://zerodha.com/varsity/chapter/mindset-investor/ , please do check this 🙂
If Avg Gain is lower then Avg Lose, then Kelly will be negative%
Do we need to ignore Negative sign?
Dear Karthik,
I have gone through a book \”Dhandho Investor\”.
In this book, the author says, he calculates the odds of return, before making any investment for long term.
Odds he calculates like 90% chances of definite returns, 5% chances of breakeven, 4% chances of loss of 25%, and 1% chances of total loss in future.
But, he don\’t explain, how he does it.
Please suggest any way (or any book) to learn and implement this in practice.
Thanks in advance.
Mahendra
I dont know how he does that as well. But the process certainly involves a probabilistic estimate of earnings 🙂
Hello recently I was doing a Google search on Kelly criterion and came across your website, I also came across https://blogs.cfainstitute.org/investor/2018/06/14/the-kelly-criterion-you-dont-know-the-half-of-it/
Which states that Kelly % = W – [(1 – W) / R] is the formula that Gamblers should use and that the formula that traders and investors should use is Kelly % = W/A – (1 – W)/B.
I hope you enjoy reading the article, thanks!
Clifford
Thanks for sharing the link, Clifford. Let me check this.
Great content. Thank you very much. Is the content going to be free in future?
Yes, Content on Varsity will be free 🙂
Sir ,
I have fixed my stop loss in such a way that I lose 1% of my trading capital per trade and if I lose more than 2 trades in a day then , I don\’t trade for that day . like wise if if lose for 2 consecutive days then I reduce my risk to 0.6 % of my trading capital per trade and if I win consecutively for 2 successive days then I increase my risk to 1.5 % of the total trading capital. Is this position sizing technique logical sir
This sounds good Sahil. Also check this new feature – https://zerodha.com/z-connect/nudge/introducing-kill-switch you can deactivate the account anytime you want if you feel you are making a series of bad trades.
Or monthly performance
Top 10-15 stocks based on market cap or based on yesterday\’s performance.
Sorry, should have specified, by market cap I mean.
Please share some tips or ideas towards creating a intraday watchlist, like as you guided right now Nifty 50 is our watchlist or opportunity universe, so please tell me how to select stocks for intraday trading. I like your idea of momentum portfolio and I also try that strategy like select top 15-20 stocks from nse 500 on a 1 day scale.
Rajesh, for intraday, I\’d suggest you pick the top ten stocks from both Nifty 50 and Bank Nifty. This will give you a 20 stock watchlist. Apply the same check list and you\’ll find intraday opportunities. You can even expand this to top 15 stocks from both indices.
SIR, Does position sizing and portfolio optimization solve the same purpose….so why need two of them…?
Position sizing is an integral part of portfolio optimization. They two are connected.
So with a percentage rule, say if I have 1lac capital and I m willing to have 1.5% cap on my capital, in intraday with 5min or 15min time frame I can take a 15 or 20 point stoploss on my trade so it matches with my 1.5% rule. But what if I wish to take any positional trade on daily or weekly time frame it will be very difficult to find a small stoploss trade there to fit into 1.5%, sometimes even if we increase for 3% also it will be tough to get a trade because in the longer time frame stoploss will be big,in this case wats ur opinion sir.
Usually, for a longer time frame, you\’ll need deeper SL, Srinath. Something like 5 or 10%.
sir
what about \’Hedging With Options\’😊
I know thats pending. Will try and put up some content around that.
1) percentage risk method will not calculate the gap up /gap down risk in that case what will you suggest as a best method according to you …
1st for intraday trading
2nd positional future trade…
among the 4 position sizing technique
2) According to you which position sizing technique is best and fits all type of trades like stocks option sell /buy and futures ?
3) historical data is necessary for kelly\’s criterion application , is it possible to use backtesting data of particular strategy to calculate the bet size ?
1) Well, if you think about it, your strategy should incorporate these moves, after all this is an intrinsic market behaviour
2) There is no one size fits all philosophy, you will have to use basis the situation in the market and your capital availability
3) Yup, you can check https://www.streak.tech/ for this.
Hello, Kartik. I have already gone through the Technical Analysis module. But I did not understand how you concluded 393.65 as the support level in the Tata Motors trade. Could you please explain?
Based on support, the current price is above the support price.
But isn\’t kelly\’s equation taking into account the hot hand bias? My past winnings have little to do with the future trade as explained much elaborately in the book \”fooled by randomness\” suggested by you.
It does. In fact, if you realise every model has a bias to it 🙂
trading capital: 5000
max risk: 75rs
Stock price: 700
SL: 692
Trgt: 708
How many units should i buy?
i am into stock market from 2018 only..i started for investment purpose only, 2019 along with investment i started swing, short term trading also and continuing both. now i am into intraday trading (paper trading only from last 3 months), learned few strategies, following that. from march i started to real intraday trading with 5k capital to experience the real intraday market, because in paper trading i am a winner, because no emotion comes in play.
Lets say my capital = 5000
Max risk : 75
Stock price: 700
SL:792
Target: 708
How many units should i buy?
Mujeeb, there are multiple basis which you can quantify and buy the shares. I think I\’ve explained it in this and in the previous chapters. Can you please go through the explanation? Thanks.
Lot size: 1500
Margin Required: 73.5K.
i dont get how u have arrived @ 73.5K
hi karthik
if the risk reward ratio is 1:1 and the win to loss ratio is 0.6, what will be the position sizes to take in forex trading to achieve 25 percent compound interest monthly on 500 usd account which offers 1:100 leverage.could you please express it in a equation if possible
Nebu, 25% monthly return is not possible, even if you do, it is certainly not sustainable. You are essentially talking about 300% yearly return. By the way, as far as your question goes – identify the max loss per trade you are willing to take (not more than 1.5% of your capital), divide by the capital and figure the number of lots you need to initiate.
Hey Karthik,
Like above discussed in the article there is a case where the volumes do not matter that much.
1. So are there any other cases in which the volumes do not matter that much?
2. And what if all the other points in the Grand Checklist are checked but the volumes do not confirm?
Thanks in advance :))
Ram, for any active trade strategy, volumes do matter. I\’d suggest you have a look at it. (2) – It really depends on the trade opportunity. If everything looks compelling enough, your gut says to take the trade, but the volumes are prohibitive, then maybe you can risk it with lower capital.
why do u think 1:1 or 1:1.7 is good risk to reward
my concern in the 1:1 case there should be one right trade out of two
whereas 1;3 we can have one right trade out of 4
why is that
I not sure if I get your query completely. However, the risk-reward also depends on the time frame you are looking at.
Say if my capital is 5L,,How do I divide it between Equity Cash, Futures, Intraday & Options ? Say for example I want to buy Hindalco Fut,My stop loss is 8rs TGT is 20,but the Lot size is 3400 ie 3400*8=27200 should I enter the trade ?
I\’d suggest you place at least 70% for long-term EQ investment. The rest for F&O. Given this split, 27.2K will be a big hit on the capital allocated for F&O, hence I\’d suggest you do not initiate the trade.
Would not you Recommend Intraday trades,if yes what percent of capital margin?
It is quite challenging to trade intraday. Not recommended especially if you are starting new.
Hello Karthik,
I have been going through zerodha varsity from the last one month. Just wanted to spam this comment section with another thank you.
The best part about all of your teachings is that even if you are doing it for zerodha (a broker essentially), in no way I found you biased. You are giving the readers a fair view of the market and not just pushing them into trade(which usually a broker wants).
Keep up all the great work that you have been doing. Varsity has given me some sense of the market. Thanks for allowing me to take the first step in a domain new for me.
Nikhil, many thanks for the super kind words!
Varsity has always been a dear project for us and we will continue our efforts in giving out an unbiased opinion here 🙂
Keep learning!
You are a genius sir and with so simplicity you explain things
Happy learning 🙂
Hi Sir Karthik,
I have a few questions regarding the thought process behind the above TaTa Motors trade.
1) It seems like there is no candle stick pattern and resistance line, how were you able to tell that the price would bounce back up to 400?
2) As you have mentioned, stop loss should be placed at the lowest of the candle stick. For this case if the lowest is too close to the entry, does it mean that the stop loss should be the next closest support line like you had done?
3) Finally, have read the chapter on volumes twice but did not understand the following sentence: \”Also, do notice the low volume retracement between 400 to 393.65 – I’ve discussed why I like trades like these in the Technical Analysis module.\”
What I had understood mainly from volume chapter is that if it is higher than the 10 days average, it is a good indicator to buy/short. How does low volume indicate a good buy?
Hope you can take some time off your busy schedule to clear my doubts
Really really wanting to learn,
Thank you
1) There was a price action zone around – 393, I guess I\’ve mentioned this in the chapter
2) Yes, the next closest support assuming its not too far from the actual stop
3) A low volume retracement kind of indicates weak hands getting out – this is a contra indicator.
Good luck!
Hi!
3) Does that mean when going long on red candle day, that low volumes would be a good indicator? Is the rationale because the smart money is still there since only retailers are getting out and thus the price most likely will go up in the future?
Is this low volume retracement an exception to the buy weakness rule?
Thank you very much sir!
*buy strength*
Not really – you still should not buy on a red candle day. Watch for retracements with low volume but buy on a blue candle day!
Hi Kartik,
I would generally trade FnO and would love to know precise position sizing technique used in trading it.
I generally take an intraday trade with fixed 2% SL from entry point. How should I calculate position size for such trades? Please help.
Regards,
Chetan
I guess some of the techniques explained earlier in the modules – like total equity, reduced equity models helps. Have you looked at them?
Sir, when implementing options strategy, usually I have seen both legs going in loss in the short term (first 1-3 days) and then turn to profits ( probably).. now should I square off oweing to my stoploss or should I wait for more time, which means could be deep loss or profit too??
What do u do usually?
Well, if this is a pattern which is working consistently, then may you should tweak it give you better entry signals. Of course, holding makes sense 🙂
Sir,
A little bit off topic but please clarify me about gapup gapdown opening. Suppose today\’s closing price of a stoct is 100 and in the last minute of trading session, I place a gtc buy order at 97 which is not executed on that day. If on the next day market directly opens at 94, will my order have been executed?
No, for two reason –
1) All pending orders are cancelled at the end of the day
2) For a minute lets assume the orders are carried forward, even in this case the order will not really get executed as the price has gapped below your limit price.
Hi Karthik,
How do we do such calculations in the live market.We cannot obviously di it beforehand nor in live markets as the price may go further in the time we do the calculation.How should we manage to do this?
Well, all your trades have to be planned. These things are there to help you make that plan. Impulsive trades in markets often results in bad P&L.
I must say Sir, varsity has become an addiction?
Suppose, I have an innumerable no. Of trades, in that what no. Of past trades should i consider looking?
Also if I am investing in a particular stock which I have not previously traded/invested, will Kelly\’s criterion work?
I mean to say is it independent of the past types of stocks i have traded?
Learning is a good addition to have 🙂
You are right – Kelly\’s Criterion requires you to have a history of past trades. Does not work if you do not have a history. However, this reminds me – there is a technique to generalise this and make it independent of past trades. Will try and put this up.
Sure. Will Look forward to it.
Cheers!
Sir, you are doing a great work.
Sir, please tell me about the technique to generalise this and make it independent of past trades, as it would be really helpful to me, and hope all of us.
Kelly\’s criterion requires you to look into past trades. No workaround for this I guess.