6.1 – Overview
This is off topic – but a little digression hurts no one, I guess. Of all the chapters I have written in Varsity, I guess this one will be a very special one for me. Not because of the topic that I will be discussing. It is because of the place where I’m sitting right now and writing this for you all. Its 6:15 AM – surrounding me 360 degrees are misty mountains; the landscape I guess cannot get any better. There is only one shack here with a little music player, playing Bob Marley’s Redemption Song. Can it get any better? At least not for me I guess 🙂

Anyway, back to school ☺
We discussed Portfolio Variance in the previous chapter. It would be pointless to crunch all the numbers to extract the variance of the portfolio, unless we put that to good use. This is exactly what we will achieve over the next 2 chapters.
Over the next 2 chapters, we will try and do the following –
- Discuss Equity curve and an alternate method to calculate portfolio variance
- Estimate the portfolio’s expected returns over 1 year
- Optimize the portfolio for maximum returns and minimum variance
Note, this chapter is a continuation of the discussion panned out in the previous chapters. You need to know the context here. If you are reading this chapter without knowing what happened over the last few chapters, then I’d suggest you go back and read those chapters first.
6.2 – Equity Curve
We will use this opportunity to develop an equity curve for the 5 stock portfolio that we have. In a very lose sense, a typical equity curve helps you visualize the performance of the portfolio on a normalized scale of 100. In other words, it will help you understand how Rs.100/- invested in this portfolio would have performed over the given period. You can further use this to benchmark the portfolio’s performance against its benchmark – say Nifty 50 or BSE Sensex.
There are certain attributes which can be extracted out of the equity curve to develop deeper insights on the portfolio. More on that later.
Let us proceed to build an equity curve for the 5 stock portfolio. Remember, we had the following stocks and we also assigned random weights to these stock to form our portfolio. Here are the stock names along with the weightages –
| Stock Name | Investment weight |
|---|---|
| Cipla | 7% |
| Idea Cellular Ltd | 16% |
| Wonderla | 25% |
| PVR | 30% |
| Alkem | 22% |
So what does ‘Investment weight’ means? – It represents the percentage of your corpus invested in the stock. For example, out of Rs.100,000/-, Rs.7,000/- has been invested in Cipla and Rs.22,000/- has been invested in Alkem Lab. So on and so forth.
While developing an equity curve, the usual practice is to normalize the portfolio for Rs.100. This helps us understand how an investment of Rs.100/- in this portfolio behaved during the period of investment. I have incorporated this in the excel sheet (please note, the excel used here is a continuation of the excel used in the previous chapter)
Have a look at the image below –

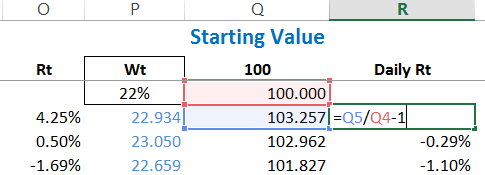
I have introduced a new column next to the daily return column and included the weight of the respective stock. At the end, you will find two new column being introduced – starting value pegged at 100 and total weight at 100%.
Starting value – this is basically the amount of money we are starting with. I have set this to Rs.100/-. This means, out of the 100 Rupees in total corpus, Rupees 7 is being invested in Cipla, Rupees 16 in Idea, Rupee 25 in Wonderla so on and so forth.
Now, if I add up the individual weights, then they should all add up to 100%, indicating that 100% of Rs.100 is being invested.
We now have to see how the investment in each stock has performed. To help you understand this better, lets take up the case of Cipla for now. The weight assigned to Cipla is 7%, which means out of Rs.100, Rs.7 is invested in Cipla. Based on the daily price movement of Cipla, our money i.e Rs.7/- either increases or decreases. It is important to note that, if on day 1, if Rs.7 becomes, Rs.7.5/- then the following day, our starting price is Rs.7.5 and not Rs.7/-. I’ve done this on excel for Cipla, and this is how the calculation looks.
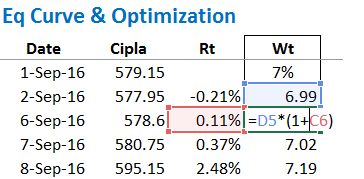
On 1st Sept, Cipla was trading at 579.15, this is the day we decided to invest Rs.7 in the stock. I understand that this is technically not possible, but for the sake of this example, let us just assume this is possible and proceed. So on day one i.e 1st Sept, 7 is invested, on 2nd Sept Cipla closed at 577.95, down -0.21% from the previous day. This also means we lose -0.21% on our investment of Rs.7/- making it Rs.6.985. On 6th Sept Cipla shot up by 0.11% to 578.6, hence we gain 0.11% on 6.985 to make it 6.993. So on and so forth the rest of the data points.
I’ve done this math for all the stocks in portfolio and here is how the table looks –
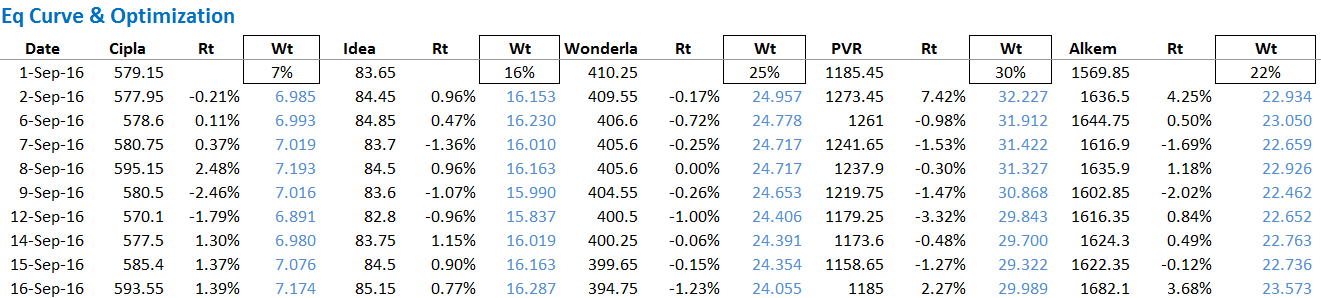
I’ve calculated the daily fluctuation in the invested price across all stocks and I;ve highlighted the same in blue.
Now, think about what is happening here – I’ve basically split Rs.100/- across 5 stocks and invested in different proportions. If I sum up the daily variation in each stock, I should be able to get the overall daily fluctuation of Rs.100, right? Doing this gives me the overall perspective on how my portfolio is moving. Let me add these up and see how Rs.100 invested across 5 stocks moves on a daily basis –

Adding up the values on a daily basis gives me the time series of the daily fluctuation of the portfolio.

An ‘Equity Curve’ (EQ curve) can be developed if you plot the chart of this – i.e the time series data of the daily normalized portfolio value. I say normalized because I’ve scaled down the investment to Rs.100/-.
So, here is the EQ curve for the portfolio that we have –
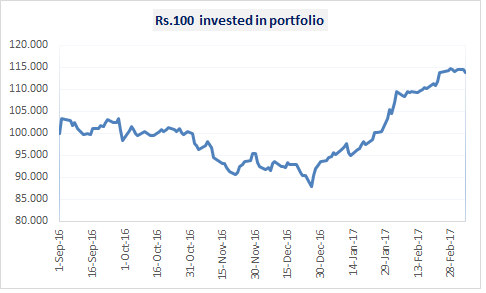
As easy as that. Eq curve is a very popular way of visualizing the portfolio performance. It gives a quick estimate of the returns generated by the portfolio. In this case, we started with and investment of Rs.100/- and at the end of 6 months the portfolio was valued at 113.84. Have a look at the image below –

So without much thinking, I know the portfolio has done close to 13.8% during the given period.
6.3 – Portfolio as a whole
Now, here is something I’d like you to think about. In the previous chapter, we calculated the portfolio variance. While doing so, one of the key things we had to calculate was the standard deviation of each stock. Standard deviation as you may know, represents the volatility of the stock which is nothing but the risk associated with the stock.
To calculate the standard deviation, we used the inbuilt excel function ‘=STDEV()’ applied on the daily return of the stock. Now, think about this – we anyway have the daily value of the portfolio (although normalized to Rs.100).
Now imagine the portfolio itself in its entirety, as a whole, as a single stock, and calculate its daily returns. Just like how we calculated the daily returns of the stocks in the previous chapter. Further, what if I apply the ‘=STDEV()’ function on the portfolio’s daily return? The resulting value should be the standard deviation of the portfolio which in other words should represents risk also called as Variance of the portfolio.
Are you able to sense where we are heading? Yes, we are talking about calculating portfolio variance using a different approach all together ☺
To help you comprehend this better, let me paste the portfolio variance value we calculated in the previous chapter,–
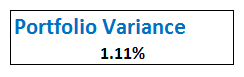
We calculated the above value using the matrix multiplication and the correlation matrix technique.
We will now look at the portfolio as a whole and calculate the daily returns of the normalized portfolio value. The standard deviation of the portfolio’s daily returns should yield us a value equal to or somewhere near the portfolio variance calculated previously.
I’ve included a new column next to the daily normalized portfolio value and calculated the Portfolio’s daily returns –
Once I have the returns in place, I will apply the standard deviation function on the time series data, this should yield a value close to the portfolio variance value we previously calculated.
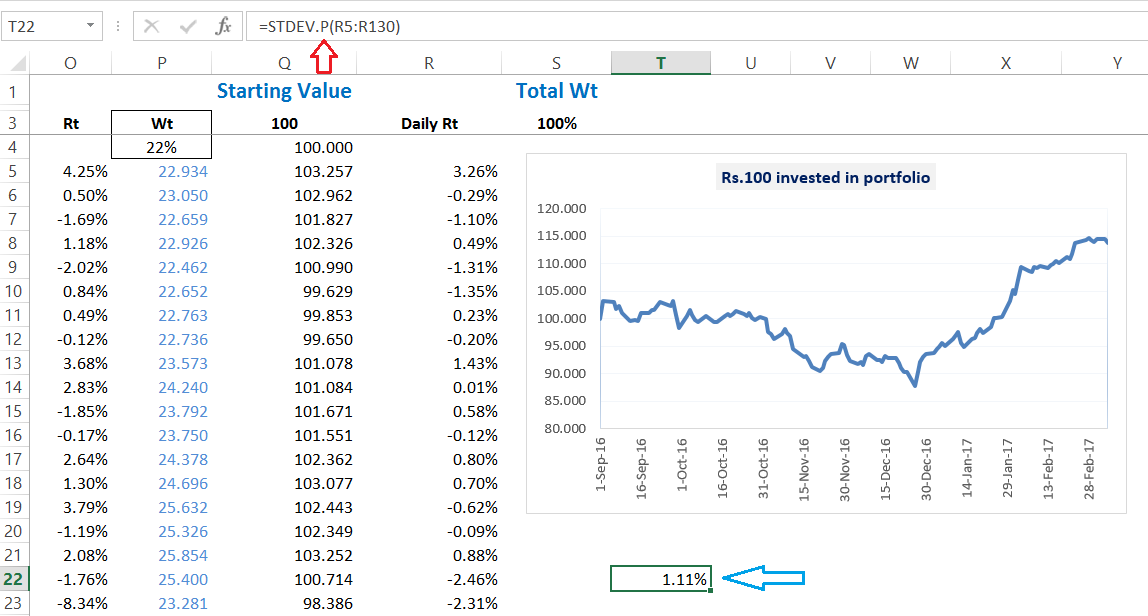
So there you go, the STDEV function gives us the exact same value!
You can download the excel sheet used in this chapter. In the next chapter, we will use the portfolio variance to estimate the expected returns along with optimization.
Quick Task – I’d like to leave you with a quick task here. We have assigned random weights to the stocks. Go ahead and change the weights of the stocks and see the impact on the overall returns. Do share your observation in the comment box below.
Key takeaways from this chapter
- An equity curve is a standard way to visualize the performance of a portfolio
- A standard industry wide practice is to normalize the portfolio to a starting investment value of Rs.100/-
- We assign weights and the respective investment to each stock
- We need to calculate the daily change in investment value in each stock
- The sum total of all the variation in each stock adds up to the variation of the entire portfolio
- The graph of the change in daily prices of the portfolio yields the equity curve
- We can look at the portfolio as a whole, as a single stock and calculate its SD
- The SD of portfolio also yields the portfolio variance
Thank you so much Karthik – had by error pegged the formula to the initial 100 amount instead of allowing it to run in sequence below. Its coming out correctly now. Many Thanks!!
There you go 🙂
Glad you got it working!
Hi, I replicated the portfolio optimisation, with a 10-stock combination and 1-year data from today, basis above procedure (including max return and min variance using solver, etc.).
However, while completing Equity Curve with 100 as start for this portfolio, I end up with the same level – between 99 and 101 or at the end of same 1-year period (I also applied a randarray and simulated weights upto 500 times).
Why is it that while the portfolio demostrates higher returns possibility but the Equity curve starts and ends almost at same level for the given 1-year period (with lot of fluctuations though)? Is it logically possible? Am I missing out on anything here? Please guide.
I think the problem is with the excel steps. You will have to evaluate each step properly and check if the math is adding up.
Hi Karthik
If you can sort the comments from NEWEST to OLDEST it would be great, as it would always be better to see the latest comments first rather than the oldest, also if there is an copy of the reply sent to the mail id it will be great
somesh
Noted about sorting. Copy of reply via email will be tough as you will start getting multiple emails as the comments tend to pour in.
Hi Karthik
I have done the portfolio analysis of my holdings, done it as per your instructions my observations are
I had allocated 26% to ITC and for a variance/covariance/correlation etc (april 1st 2018 to March 31st 2023)
my ITC has shown a down fall (on 2nd april 2018 ITC close = 258.25Rs, on 31st March 2023 ITC close = 383.5 Rs)
however as per portfolio value of ITC (start = 26 end = 22.56 Rs)
how is that possible as the ITC share rate has increased from 258 to 383 So ho can portfolio value fall ?
But what about other stocks in the portfolio, Somesh? That will have an impact too on the portfolio.
I am new in Share Market having Zero knowledge. How I can educate myself through zerodha varsity ?
Please start reading from module 1, that will help.
Hi,
Please implement this in Console. Doing this manually is impossible.
Thanks
I am unable to download the excel spreadsheet linked in the chapter above
Hello Sir,
1) suppose I am expecting my portfolio return to be 20 % in the next one year. I have calculated the portfolio variance to be 3 %. then how this 20 % and 3 % related according to the definition of portfolio variance ?
2) As the definition says \” Portfolio variance is a measure of the dispersion of returns of a portfolio \”, here returns of the portfolio considers which time period- 6 month return or 1 year return or 5 year return ?
3) In the previous chapter you have calculated portfolio variance to be 1.1 %. means suppose the expected return of the portfolio is 20 in the next one year , the returns may vary between 21.1 %(20+1.1) and 18.9 %(20-1.1). Am I right sir…if wrong kindly clarify.
1) So the variance from your expected returns will be +/- 3%
2) Returns are usually computed yearly
3) Yup, that\’s right.
One question? Wouldn’t it be supercool if kite could directly tell us the portfolio variance in one of its statistics in the portfolio? That would solve a lot off hassles. Just a suggestion.
Yes, that\’s right. But there are a lot of complications with that 🙂
Thank you. Will be waiting…..
Can give more details or share excel as you did in module to try more on this please.
I\’ll try and put up an excel on this one of these days. For now, I\’m really pressed for time.
how to calculate equity curve when there is change in portfolio like addition of stocks or changes in qty. Kinldy guide..
It gets a little tricky. But broadly speaking, let\’s say I sell stock 1 and buy stock 2, the value of liquidation in stock A = investment in stock B, so the only thing changes is the symbol name.
But if you liquidate stock A and invest a part of that in B, then you will have to maintain a cash component to your investment.
DEAR KARTIK, earlier you explained that square root of variance is standard deviation, so how come we can compare the standard deviation of portfolio(calculated here) to the portfolio variance calculated earlier?
thankyou for the resource.
Sorry dint get that, Akshay. Standard Deviation is a measure of volatility which and derived from variance.
Hello Karthik Sir!
First of all, thank you so much for publishing some amazing modules on Varsity.
I made the excel sheet of equity curve using both the methods but was quite intrigued when I came across two different answers (1.45% and 1.54%) of portfolio variance for the same set of stocks. Is this margin of difference too much or is it fine given that I took 10 stocks in my portfolio.
Thanks & Regards,
Sanjeev Jain
Thats ok, its a small difference which I guess you can ignore. As in the efforts you\’ll put in to narrow down the difference may not really be worth it 🙂
Sir
Thank you for this module.
My question is if I calculate any other stocks portfolio variance then the answer always same for variance covariance matrix and this one
No, the variance-covariance matrix will obviously change based on the stocks under consideration.
Hi Karthik sir! Don\’t you think the squre root we have done in the previous chapter for the calculation of the variance will give standard deviation ( Portfolio Variance = Sqrt (Transpose (Wt.SD) * Correlation Matrix * Wt. SD) ), since we have calculated std deviation using excel and it gave the same value as variance, also considering that std dev is the squre root of the variance?
Thats right. I think I\’ve mentioned that in the chapter itself.
Hello Karthik
I\’m glad to have such a great content to learn about stock market and thanks to you for helping.
I have lots of doubt on this risk management chapter regarding Variance and related topic. Is there any offline help available from you?
No offline help, Pradeep. PLease post your queries here and I\’ll be more than happy to help you with this.
Thanks for you\’re knowledge Karthik sir we all owe you !!. Have a blessed life sir
Thanks Harsha! I\’m glad you liked the content.
SHUDNT V TAKE BONUS AND STK SPLT INTO CONSIDERATION???
Yes, one has to do that.
Hi – can you please provide some guidance or example on historical power prices.
POwer prices?
I will try to illustrate the actual case here,
I am ploting 5 years data curve. On 31-may-2018 the price were trading at 3514 and the 100 Rs. Base price was increased upto 140.3 Rs.
And The ex-date for bonus was 1st july, it was 1:1 bonus. So the next day the price droped from 3,514 to 1,741 Rs. per share with 50.4% decline and the base price of yesterday which was 140.3 has fallen to 69.38 Rs. And this sharp fall is clearly visible in plotted line graph.
I agree that some price adjustment is needed to be done to get a smooth graph, but i am clueless as to what precise adjustment to be made ? Or get a price data which has already countered this effect like in MC, Kite.
Please help sir
I understand Vaishakh. The point is that this is not a sharp fall as it seems to be. This is a bonus issue, the value of your investment still remains the same. What happens is that once the bonus is issued, the historical share price of the company is readjusted to ensure the fall does not mislead investors. YOu need to e ensure that you are taking in the adjusted share price. You don\’t need to make any price adjustments, just ensure you download the adjusted data, NSE\’s historical data source may have this.
Sir,
I am trying to plot equity curve (100 as base price) for TCS, Nifty 50 & Nifty IT and compare all of them together. And all historical data were downloaded from NSE website. And TCS had declared Bonus on April 2018, and as a result the prices were reduced 50%. And this is reflected easily in the Equity curve as well. So, in comparison with benchmark indices the overall graph looks gloomy.
But when i saw the chart for TCS on Zerodha, Monycontrol, they were normal graph i.e. the chart didn\’t had effect of Bonuses & no big decline was seen.
Hence 2 questions i want to ask,
1) Why the bonus effect wasn\’t considered for price charts in zerodha or moneycontrol ?
2) what should I do further, Should i go with the initial case (bonus effect considered) or the later one ?
By looking at the equity curve, you should not be able to figure out the bonus. This means you are not using the adjusted data for the bonus. Zerodha/MC or any other charting software would have updated this. I suppose this answers both your queries.
Sir, shall we use Portfolio variance and portfolio Beta in the same context? What is the difference between portfolio beta and portfolio variance?? I have calculated the portfolio variance as described as per your guideline, which is very informative and relevant for the retail investor\’s point of view. We include stocks in our portfolio at different intervals. Should last 1 year 0r 6-month closing price is sufficient for calculating the variance? Kindly help us in this regard.
They both are somewhat similar in the sense that they convey portfolio risk. Beta is measure of market risk as a whole, while variance is a local to the risk of the stock held in the portfolio.
Hi Karthik,
This is a good source of knowledge, but i wonder, why would i have to calculate all these manually. If i have Mutual Funds, Stocks, US Funds and stocks, and all purchased from Zerodha then why not it calculate all these values itself on daily basis.
Thanks.
Yeah, it does. This helps in enriching your knowledge 🙂
Hello
I am unable to find the excel files
Regards,
Ajit Chandani
Ctrl+F \’Download\’ and you will find it
HI KARTHIK, IS THE STDEV IS THE PORTFOLIO VARIANCE OR WE HAVE TO SQUARE IT AS
SQRT OF VARIANCE=SD
Sqrt of Variance = SD.
sir
what number of variance can be considered as high risk or low risk ?
Depends on the assets in the portfolio. Large caps tend to have lower volatility whereas small caps have higher vol. So it is difficult to peg a number here.
Karthik Sir ,
In previous chapter Portfolio Variance was 1.11% that mean ST. DEV is sqrt(1.11%)=1.05% . Now as per your calculation STDEV is 1.11% that means Variance can be 1.2321% . Also when I tried to apply Variance formula directly on excel (i.e., on daily return of Portfolio ) why i am unable to match portfolio variance calculated through Matrix method ? Why STDEV is equal to Variance in equity curve ? It is confusing please explain above points
Raj, I guess this was sorted in earlier comments. Can you please double-check? Thanks.
Hello,
Technically standard deviation is square root of variance but in this chapter variance of portfolio and standard deviation are equal. So does it mean that portfolio variance is different from Variance(Statistics)?
THANKS
Technically standard deviation is the square root of variance —> yes, this is correct. Let me recheck of I have missed anything.
Hi Karthik,
I too have the same doubt. The calculation shows standard deviation being calculated of the equity curve but it is referred to as Portfolio variance.
Thanks in advance.
Jinesh, portfolio variance is nothing but the portfolio standard deviation.
Beta of a stock we know, Beta of a portfolio can be calculated by weight of stocks and average ? This is right approach ? Instead of calculating so many value as discussed in chapter, will it help?
Beta of the portfolio is the beta of individual stocks times the weight of the stock in the portfolio, all summed up. Or you can quickly calculate the equity curve of the portfolio and check the beta of the equity curve.
Greetings!!! Karthik,
First of all Thanks for sharing the In dept details on how to Manage our Portfolio. Coming to the point, there is a difference in my Portfolio Standard Deviation (3.71%) and Portfolio Variance (2.46%) though i am carrying 3 Stocks in my Portfolio. Let me know how to adjust the same.
Thanks
Ah, I need to see the excel for this.
Hi Karthik,
Let me know where to sent, i hope you have my mail id.
Thanks!
Dear Sir
Portfolio Variance calculation by VC Matrix and Equity Curve standard deviation method comes slightly different values. In my case it 0.10% Why so? Please explain.
Not sure, Sougata. Maybe a rounding off error? Can you check and reconfirm?
Is the portfolio variance value equal to the beta of the portfolio??
Hmmm not really, although both are somewhat a measure of risk.
Im waiting for the part in risk management – Hedging with Options.
Ah, I missed it again. Will add that as a separate note one of these days.
Can we check the equity curve and variance of our portfolio directly from Zerodha ?
No, we do not have this feature yet on our Platform.
Karthikji,
I have a doubt. We are calculating Variance of portfolio based on which we will can have an educated guess of expected returns.
I am not able to understand the timeframe for it. When do we realise the returns?
When do we do the trade?
Because the data goes on changing everyday thereby changing the returns.
A newbie here!
I need a bit more clarity on your question, Sanjay.
1) What do you mean by realise the returns? Are you talking about the look-back period?
2) Depends on the trading strategy itself.
What I mean is, we have calculated the variance, we also know the min. & max. expected returns using Variance.
I want to understand at what point or what should be the trigger so that I\’ll sell my shares and book profit which will be hopefully in the range as calculated above.
The trigger could be any portfolio event – for example, a drawdown of 10% at a portfolio level.
I m new to stock market and learn everything on zerodha varsity. Thank you guys for making this very simple.
U guys are doing awesome work.?
Happy learning, Manish!
Hii..you should compile a book of all these chapters..awesome teacher you are..could you please tell me how to download these chapters ..so that i can read them at my ease..i am not able to find download option like it was there before.
Thanks for the kind words, Mahek.
The download option is right below the module page where all the chapters are listed. However, the PDF for this one is not up yet. That will be available in over 15 days.
sir, it\’s my humble request to please tell how to select stocks for portfolio for a beginner? i am newbie here and read tech. and fund. analysis, but still can\’t find.. please help? how should i select a company to invest?
I;d suggest you take a look at the Fundamental Analysis module here – https://zerodha.com/varsity/module/fundamental-analysis/
Sir, can you please tell me how to draw the equity curve in excel. I have completed rest of the work very similarly and perfectly but i am unable to chart the equity curve. I guess there is some problem with axes. It would be great if u can help me out. Actually i am a newbie in excel
Thanks in advance sir.
Can you tell me where exactly you are going wrong?
The axis which is supposed to hold the values from 120 to 80 is not there as i am charting. The values are coming from 0 to 100. The axis with time is fine. And because of this the eq. Curve that I am getting is a flat line at 100. What can I do to fix it?
And also sir, my portfolio variance is coming at 1.40% how am i supposed to interpret it?
Port variance of 1.4% is alright. However, I\’m unable to figure out the exact problem. I have explained this step by step, can you please try doing this again?
Sir, in the charting of normalized equity curve X axis which contains the time is alright, but the Y axis which contains the values(in your chart it is 80-120) is not alright. It is coming from 0-100, and because of this the equity curve is like a straight line at 100. How can I fix it?
If you are getting the fixed value as hundred than I suspect you have not linked the portfolio values properly. You need to calculate the daily returns and then link it to the normalized values.
Hi! Any update on when the supplementary note regarding \’how to consider portfolio variance and maintain equity curve when shares are reduced or new shares are bought\’ will be updated? Eagerly looking forward to learn from it. Thank You!
Check this – http://zerodha.com/varsity/module/trading-psychology-and-risk-management/
Hi Karthik,
I am eagerly waiting for next chapter(s).
I also request you put a module on financial modelling.
Thanks ☺
Financial Modelling is next module, next chapter will be up this week.
Respected Sir,
Gratitude !!
This module seems like a boon for (neophyte) Investors. Unfortunately, I categorize myself as a Trader (my trades range mainly 0-6 days or so). I understand that it is valuable for both Investors & Traders, depending upon one’s ability to retrieve useful info from data for one’s use. But, a novice like me would like to have some clarity of ‘Risk Management’ section from a Trader’s perspective as well. Also, I wonder if ‘Trading Psychology’ section of this Module will also throw some light on psychology of a trader.
My experience –
Few years ago, I was apprised by a broker to put orders at, say, 189.95 instead of 190, or at 150.05 instead of 150. Nothing technical, he told some pure psychological reason (do not remember now) leading to a special order picking behavior in market depth. Later I browsed a lot but couldn’t figure this out. I wonder if such psychological scenarios exist. If yes, will these be included in this module? Or please provide any reference/ books for such insights that one (otherwise) learns from one’s experience only.
By the way –
Graph of typos has been above its 20DMA for last 2-3 Modules. It has formed Bullish Marubozu in last two chapters consecutively. I guess it\’s better to go Long on spell&grammar check tool, like Ginger, to crash such trends in few seconds. Sorry for pointing it out.
–
Coming soon in the awesome world of Zerodha 🙂 🙂
–
Regards
James
Thanks pointing this out. I understand the grammar and typos – there are way too many. I\’ll probably use one of thoes tools.
Anyway, I too use figures like 189.95 instead of 190 – I\’ve observed the fills are faster. As of now the module\’s focus is risk management from portfolio perspective. Will soon shift to the traders perspective.
Ohh !! Thanks a lot. I would be highly glad & obliged to see more such (traders\’) psychological tricks in this module so as to understand their mechanism insight – how these works. By the way, is/are there any book(s) for same??
Question – You have described two methods of return calculation in excel — \’=ln(c3/c2)\’ and \’=c3/c2-1\’. Which one is more practically preferable?
Thanks in advance
Best Regards
There are are quite a few books on this topic, unable to think of one though. Will keep you posted.
For more than 2 year of data, I\’d suggest you take the ln returns, otherwise regular rt should be alright.
Thanks a lot.
Welcome!
Dear Karthik,
Well Karthik all your classes are just equivalent to gold like me. Wonderful Job Karthik, One doubt.. when i have done the Portfolio SD its coming 1.12% instend of 1.11%. You have mentioned the formula in ur excel file as \”_xlfn.STDEV.P(R5:R130) didn\’t understand this formula. What\’s the problem if we give the formula stdev(R5:R130) which comes to 1.12.
Awaiting the doubt to get cleared.
Regards,
Sonjoe Joseph
\’=STDEV()\’ is a excel function, behind which is the mathematical formula to calculate standard deviation. 1.12% is good, I guess minor decimal difference. Are you doing this on the same portfolio?
Yes i\’m doing on the same portfolio.
Good luck!
Sir,
I have tried the above exercises but I am facing a problem. The the result of STDEV which has been calculated here is nowhere matching my portfolio variance. Also, since the SD would anyway vary with the changing weight of each share, how would the Stdev. then always match the portfolio variance ? BTW I am not using the above portfolio, I have developed a portfolio of my own. AND a TON of thanks for creating such a great resource :-).
Abhas, if it\’s a different portfolio, then the values will not match with what we have here. Btw, the portfolio variance won\’t vary drastically on a day to day basis.
Hi, Nice chapter!! Well I would like to know how to manage risk while trading in Commodities Derivative and about commodity position sizing, hedging position!!
Will that be covered in coming chapters, Sir??
Yes, we are currently discussing risk from a portfolio perspective, we will soon move to single and muti leg futures position.
The first is question – Where is that blissful place ? 🙂
Somewhere in the North East of India 🙂
Dear Karthik,
What if Quantity of Shares (i.e. Weightage %) is not constant, due to additional buy/ reduction by sell in any scrip?
Also what if we add/remove any scrips from portfolio in between?
How to take care of that while calculating the portfolio variance?
Thanks 🙂
Ah, good point. When you add remove shares, your weightages in each stock changes and you develop the EQ graph in the routine way. Anyway, will try and put out a supplementary note on this sometime soon.
Thanks a lot Karthik. Your webinars are also awesome. Zerodha Varsity is great source of knowledge for a novice like me. The subject is so vast and there is so much to learn, but the way you are feeding us spoon by spoon, it makes things simple and easy to grasp. I am really greatful to you.
Thanks once again 🙂
Hey, thanks for the kind words, Santosh. Its still a long way to go for all of us at Zerodha 🙂
Happy learning.
hiiii sir im krishna saud
palan
Great to meet you, Krishna!