13.1 The aspirational value of hotels
I was once talking to someone researching the brand position of five-star hotels in India. And it occurred to me that while people may not be able to use or afford to stay at luxury hotels, they are still aware of some names. These names carry aspirational value for them. They might want to visit such five-star hotels with their first salary, on a date, or for some special occasion.
In the previous chapter, I spoke of hotels selling experiences and not just rooms or food. The price they charge is for the richness of experience they provide. To be able to afford that experience is a matter of pride for most. Hotels have to live up to the feeling of pride customers expect to have.
You could form a judgement of how well a hotel company is delivering experiences by studying the key performance indicators of the industry.

13.2 – The checklist
Considering the industry’s peculiar features and the existing generally accepted standards, I have collated this checklist that one could use when analyzing the industry.
You will see in the table below that I have collated these numbers for different segments of hotels – five-star hotels, operators of five-star hotels, business or boutique hotels, and even a vacation seller. In your analysis, try comparing companies within the same segment.
Let me reiterate that this checklist must be used along with fundamental analysis and valuation models for holistic research of the hotel industry.

Number of properties – This is a good proxy for understanding how geographically distributed a hotel company’s operations are. A large number can help cushion the financial performance against seasonality. Seasonality bears on different regions at different times and in different ways. Impact on properties in one region can be compensated for by properties in other regions.
If a hotel company offers hotels in various categories, you can try to break this number down to understand its composition. For example, IHCL offers Taj branded luxury hotels, Vivanta branded premium hotels, Ginger branded business hotels, and Seleqtions branded experiential hotels. Such a hotel portfolio enables IHCL to cater to luxury tourism, business travel, wedding tourism, etc.
Number of keys – This is basically the number of rooms. So why not call it rooms? A suite or villa having multiple rooms for group travellers cannot be called a room. But such suites or villas are sold as a single unit. Hence, to avoid confusion, they are called keys.
Hotel properties with a larger number of rooms (or keys) have certain advantages – they can host conferences or weddings having large numbers of guests. Too many rooms can also become a fixed cost burden if there is not enough demand.
Having a large number of rooms also adds to the grandeur and aspirational value of a hotel.
Occupancy rate – If a hotel with 200 available rooms has guests in 150 rooms today, it is said to have a 75% occupancy rate today. The occupancy rates that hotels report are aggregated for the whole year for all properties collectively. Let’s go step-by-step.
-
- A hotel company has 50 properties.
- It has 2000 rooms across these properties. So, in a day, it can sell 2000 room nights.
- Throughout the year, it can have 7,30,000 room nights (2000 rooms * 365 days).
- Practically, it will have fewer room nights than that. Repairs, maintenance, seasonal shutdowns, etc., can make rooms unsellable.
- Let’s say 10% of the room inventory is usually unavailable. Therefore, available room nights will be 6,57,000 (7,30,000 – 10%).
- If the hotel company sells 5,00,000 room nights throughout the year, it will have a 76.1% occupancy rate (5,00,000 / 6,57,000).
A higher occupancy rate is better. It might be practically impossible to have a 100% occupancy rate. A hotel with 30-40% occupancy can also be profitable if it can charge a high price and control costs. However, comparison of occupancy with peers gives a better perspective on how well a hotel company is doing to attract customers.
Improving occupancy rates year after year could suggest improving brand strength. A declining occupancy rate could also result in deteriorating financial performance.
Average Daily Rate (ADR) – It is the total room revenues divided by the total number of rooms sold.
Let’s carry forward with the example of the occupancy rate. The hotel company had sold 5,00,000 room nights during the year. Assume that it earned ₹315 Cr in room revenues. So, its ADR would be ₹6,300 (₹315 Cr / 5,00,000 room nights).
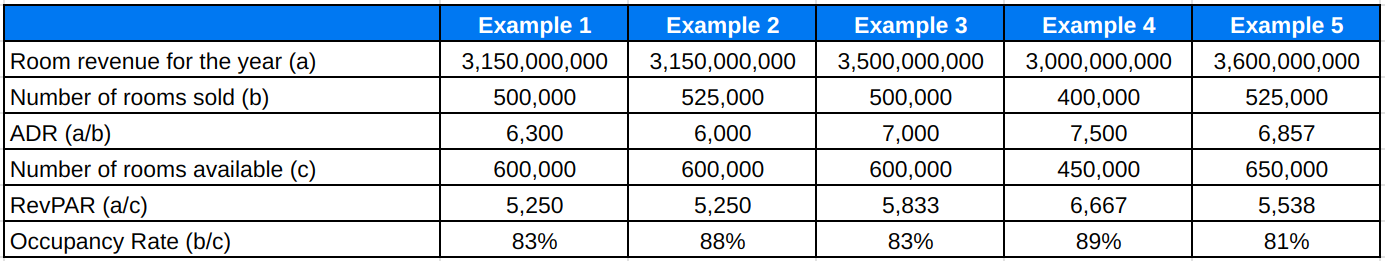
Improving ADR year after year implies improving revenue per square foot. How is ADR growth better than revenue growth? Revenues could grow by adding more rooms. In fact, revenues could improve even when ADR is falling. It will be using more assets to generate the same level of revenue. This may not be an optimal situation for the hotel. Let us look at a few examples in this table.

Example 1 is what I used to explain ADR. Let us take that as the base example, and we will build upon that.
-
- In example 2, revenues did not change, but the hotel had to sell more rooms to maintain the revenues. Therefore, ADR fell. Perhaps more discounts were offered.
- In example 3, revenues have grown, but the number of rooms sold has grown faster. As a result, ADR fell. Continuously declining ADR could suggest declining brand strength.
- Revenues have decreased in example 4, and the number of rooms sold has decreased further. The ADR is higher. Such a phenomenon can occur due to an external shock like economic slowdown, pandemics, or natural calamities. Fewer people are willing to spend on hotels, and those who do spend are affected little by higher prices.
- The best situation is in example 5. Revenues have grown, and the ADR has grown faster. Continuously improving ADR along with growing revenues could suggest improving brand desirability.
Comparing ADR with peers shows a hotel company’s pricing power. Stronger pricing power is usually an outcome of a strong brand. However, ADR must be analyzed deeper. Lemon Tree offers mid-priced rooms. Its ADR will be lower than that of EIH, which operates in the luxury segment.
For a hotel’s management, ADR can help make business decisions. A study of ADR across quarters can help identify the impact of seasonality. Accordingly, the management can devise promotional or pricing strategies.
Revenue Per Available Room (RevPAR) – It is the total room revenues divided by the total number of rooms available.
Let’s alter the previous example in the following table to understand RevPAR better.
Here again, example 1 is the base, and we will build scenarios on top of it. I have added the occupancy rate in this table to give more context.
-
- In example 2, the number of rooms sold increased, but ADR decreased. RevPAR did not change because the factors affecting it – room revenue and number of rooms available did not change.
- In example 3, the number of rooms sold and available were constant. The occupancy rate also did not change. RevPAR increased due to an increase in room revenues. Therefore, ADR was also higher.
- Revenues have decreased in example 4. Available rooms have decreased more. This could be due to external factors. Remember how hotels were ordered to operate at reduced capacity during Covid? The rooms that a hotel cannot sell are not included in the number of available rooms. A higher occupancy rate and higher ADR have resulted in higher RevPAR.
- The number of available rooms in example 5 has increased. Revenues have increased more. Therefore, RevPAR is higher. The effect of a lower occupancy rate was negated by a higher ADR.
In simple terms, ADR and occupancy rate positively impact RevPAR.
Note that RevPar will usually be lower than ADR because the occupancy rate is generally less than 100%. The number of rooms available will be more than the number of rooms sold.
The ratio of room revenue to other sources – Hotels charge their customers for the multiple services and experiences they offer. Restaurants, spas, salons, laundry, cabs, etc, are all sources of revenue on top of room revenues. A higher share of revenue from other sources indicates that customers like and are willing to spend on other services and experiences.
In dull seasons, a hotel may offer big discounts to attract customers. The idea is to earn revenues by getting them to spend on other services and experiences.
EBITDA – EBITDA is Earnings Before Interest, Tax, Depreciation, and Amortization. We have learned this is Fundamental Analysis. So why am I discussing this here?
We know that hotel companies use various combinations of portfolio ownership. Some properties are owned, and some are leased, managed, or franchised. A company having mostly owned/leased properties will tend to have a higher asset base and, hence, a higher depreciation charge on the P&L. A company using borrowed funds to acquire or develop properties will tend to have a higher interest charge on the P&L.
Let’s look at these two hypothetical companies, A and B.

While both A and B have the same level of revenues and expenses, B has higher profits because it does not own the properties. A’s profits are lower because it has taken loans to own properties.
This is a very simplistic example. B could have higher operating expenses due to the rent it would pay to acquire the property. It could also have a revenue-sharing arrangement with the property owner.
The point here is to establish an apple-to-apple comparison between peers and not just to compare their reported profits.
13.3 – Concluding remarks
Many moving parts work in tandem to deliver service in the hotel industry. Experiences are crucial but difficult to quantify.
Differentiated services improve brand strength. Brand strength improves KPIs. Strong KPIs should ideally lead to robust financial performance. This is where management acumen becomes important. As someone studying the industry, your ability to identify quality management will set your analysis apart.
Key Takeaways
-
- A hotel company’s network and capacity can be ascertained by the number of properties and keys.
- Its ability to sell rooms is determined by occupancy rates.
- Higher ADRs suggest higher pricing power.
- A higher RevPAR could be an outcome of an improved occupancy rate or ADR.
- Apart from rooms, hotels also make revenues from restaurants and other services.
- EBITDA is an important tool in comparing hotel companies with different asset-ownership models.
very insightful information. gald to be part of zerodha
Its my sincere request that if you give Information about how to analyse Retail and Fashion industry in the upcoming chapters
Thank you, Reethesh, for the suggestions. Will try to cover them soon. 🙂
This will be all our more sector will be coming up?
Yes, we will add a few more sectors 🙂
When will we get pdf from trading module
Hi, we will release the pdf version once the module is complete. We still have to add a few more sectors. 🙂
great initiative….
Thank you:)
Hello Vineet,
Just wanted to know if you will cover the Infra Theme & if so tentatively when?
And btw Thank You soo much for this beautiful module.
Thank you, Omkar. 🙂
I will be covering FMCG, retail, and energy sectors next. Can cover infrastructure after that. It will take a few months as there other projects running simultaneously.
Thank you for such insightful contents. Keep up the good work.
Thank you, Manish! 🙂
Hi Vineet,
Thanks for this awesome series.
Just wanted to know whether you are planning to cover the real estate and Pharma sector also. Very much excited to learn about that sector from you.
Hi Sagar, thank you for the validation. 🙂
I have these sectors in my to do, but it might take a little while.
Thanks team zerodha for this wonderful sereis and explanations.
Thank you, Mayur. Happy learning. 🙂
pleased to see this type of rich content thankyou so much.
but waiting from a long time for new chapters. when will it release sir
Thank you Reethesh. Yes, there a few more sectors we will cover, but occupied with another project for a few weeks. Will be back soon. 🙂
I am currently going through module 1 and the journey so far has been really fruitful and enjoyable. i know there are videos too but the modules itself are prepared so well that i can feel someone is talking to me in my head. I am looking forward for more sector analysis under this module. If i may request, then i would love to learn oil and gas sector and all industries within financial services sector
Thank you for the appreciation, Nikhil. Your suggestions are noted. 🙂
Thankyou varsity for such amazing content. If possible pls make a module on the wine industry
Thank you, Tanishq. 🙂 Your suggestion is noted.
Please upload pdf for previous modules
Hi Jay, we will upload the pdf modules once all the sectors are done. I have a few more sectors to add.
Amazing Sirji!!! Please continue the series.. I am learning a lot….
Thank you, Ayushi. More sectors are on the way. 🙂
Hi. May i know when next the sector analysis will come and which one will it be ?
Hi Nikhil, the next module will be Retail. 🙂
Hi
I see a row in the check list as “Owned/Leased and Managed Properties 50-50, 25-50”- can you please explain what this means? Does it mean that out of the total properties only 50% is owned by them? In case of Mahindra Club Hotels which has exchange agreement with many other hotels and chains, under which head are the revenues/commissions from exchange accounted? Is there a separate line item for commissions from the network hotel?
Thanks
Kalyan
Hi Kalyan,
Those numbers are ratios. 25-50 is a ratio, it means EIH roughly owns 10 hotels and manages 20.
As for Club Mahindra, revenue segments show contributions from subscriptions, room rents, food and beverages, etc. Revenues/commissions from exchange are unlikely to be laid out in the annual report since it might be perceived as sensitive information.
Thanks 🙂
Thanks for your response
🙂
A good comparison given of different hotel chains
Happy learning. 🙂
Dear author i am regular reader of Varsity. I am here to inform that i am waiting from a long long time for Sector analysis articles. No articles are published regarding sectoral analysis. Why when will it be Published.
I am so sorry Reethesh for this delay. We will post new chapters soon.
Please continue this module with all other sectors, it is very helpful for us! 🙂
Thank you Souvik, we plan to add more soon. 🙂