
5.1 Introduction
In the previous chapter, we studied the parameters unique to the insurance industry. Here, we will explore the performance metrics specific to the Information Technology (IT) industry. While insurance was tricky due to the regulations in the sector, IT is tricky because of its global nature.
Among all sectors, Indian IT was perhaps the first to achieve global prominence. From exporting IT services worth a little over $6 billion in 2000-01 to about $245 billion in 2022-23, Indian IT has come a long way. Interestingly, while the sector has grown 40x in USD terms, it has grown ~80x in INR terms. This is because the INR has depreciated against the USD over these decades. For a business engaged in exports, a depreciating currency is like a cherry on the cake – earn foreign exchange and then convert it to extract even more value in INR.

The IT sector had its humble beginnings in the 1990s when it mainly exported services such as insurance claim processing, payroll and HR maintenance, and call centers. Fast forward two decades to 2023, and the sector has become a behemoth. Digitalization, cloud computing, AI-driven insights, consulting, and cybersecurity are some of the many sophisticated services the IT sector provides. From less than 2% about two decades ago, India’s share in global IT revenues has soared to about ~35%.
The IT sector is also a major employment generator. Indian IT employed over 51 lakh employees in 2021-22. This figure does not include the lakhs of employees working at the foreign offices of prominent players like Tata Consultancy Services and Infosys. Remuneration is, in fact, the biggest cost for IT companies.
Over the years, automation and AI have largely replaced repetitive services like call centers and payroll maintenance. A key driver for the success of Indian IT firms in the face of automation is their ability to stay relevant. They have constantly spent on new technologies, upskilled their workforce, and focused on innovation.
5.2 Features of Indian IT
Service business: Indian IT is almost entirely service oriented. They hardly sell any hardware. Software used to be a product, but the cloud transition has made it a service. Remember SaaS or Software as a Service? Previously businesses would buy software packages from IT companies to digitalize their processes. Now they buy subscriptions for regular payments so that the IT company can continuously improve and update the product. IT companies also prefer this arrangement as it is not just a one-time software sale but a subscription service that brings regular revenues.
Tethered to global events: About three-fourths or 75% of the total revenues of Indian IT come from outside India, with the US alone commanding ~60% share. An economic boom in these countries triggers IT spending, and Indian IT gets a boost in revenues. An economic downturn, on the other hand, hits revenues. A large part of IT has become essential to the operations of many businesses. During a downturn, the demand for augmented or experimental services mainly declines while that for essential services remains stable. Therefore, a significant revenue decline due to a recession may be rare.
Exposure to foreign exchange: You may call this feature a derivative of the previous one, as both are mostly related. Forex exposure is mostly seen as a good feature for an Indian exporter. India is a developing country witnessing a steady depreciation in INR.
How does an exporter benefit from a depreciating currency? Let’s say Infosys sold a service for US$ 1,000 in 2013 when the USD/INR exchange rate was ~₹50. When converted into INR, Infosys made ₹50,000 in 2013. If the same service were sold for US$ 1,000 today when the exchange rate is ~82, Infosys would make ₹82,000. Effectively, Infosys made more money simply on account of INR depreciation.

The INR could depreciate for reasons internal or external to India. If high inflation has caused INR depreciation, it is mainly an internal issue. But when the Russia-Ukraine war pushed up the demand for USD, the INR depreciated due to external factors.
Please also be mindful of any INR appreciation, which could show muted growth. The point to take home is that the slow growth could be due to currency fluctuations rather than a slow business.
Regulations: Every country or region is developing its version of laws around cyber security, data management and ownership, and digital privacy. Since IT companies cater to customers in tens or even hundreds of countries, they must navigate each of these laws. The cost of compliance can be high. Monitoring an IT company’s litigations in foreign countries might be prudent.
5.3 Key Performance Metrics of IT Companies
As a sector, IT is mostly organized, formalized, and structured. The value chain is also not too big – the company hires talent to develop products that business clients consume. Therefore, a basic fundamental analysis should ideally be adequate for studying the IT sector or its companies. However, I also seek the following information to gain deeper insights.
-
- Growth and constant currency growth: Here is a snapshot of TCS’ investor presentation for FY2023. The graph on the right shows revenue growth in two terms – Reported and CC. CC means constant currency. Constant currency growth shows business performance without any effect of exchange rate fluctuations. Reported growth accounts for currency fluctuations. As you can see in this particular fact sheet, CC growth of 10.7% is lower than the reported growth of 16.9% in Q4FY23. The difference between CC and reported growth numbers is indicative of INR depreciation over the year. And if you actually check the exchange rates, the INR depreciated 8.2% against USD, 6% against EUR, and 1.6% against GBP. By implication, the actual business grew 10.7%, but it was magnified to 16.9% due to INR depreciation.

-
- Order book: Let’s assume you are a baker. You sell each cake for ₹500. Today, you received orders for 25 cakes. Of those, you have to deliver ten cakes today, five tomorrow, and the rest the day after that. Today, your revenue will ₹5000 (₹500*10), but your order book will be ₹12,500 (500*25). Similarly, IT companies have an order book. They receive projects that have to be delivered over time. The total value of the project goes into the order book. The part that was delivered during the reporting period is recorded as revenues. In the case of TCS in FY23, it earned revenues worth $27.9 billion and received orders worth $34.1 billion. Here, the order book is 1.2x the size of FY23 revenues. An order book size larger than revenues suggests strong demand.
-
- Unearned revenues: Certain customers might make advance payments. Just like orders can be placed in advance, customers can also make advance payments. If the work against these payments was not delivered when the payment was received, those payments could not be recorded as revenues. Therefore, they make a separate liability item on the balance sheet.
-
- Unbilled revenues: A project, or a part of it, could be delivered in advance. The invoice for such projects is not raised yet, and the client has not paid up. Such revenues are recorded as assets in the balance sheet. Unbilled revenues from time-based contracts are classified as trade receivables. Unbilled revenues from fixed-price contracts are classified as non-financial assets.
Part or all of these unbilled revenues may or may not be recovered. Therefore, there is credit risk. The size of unbilled revenues also gives visibility into future revenues.
- Unbilled revenues: A project, or a part of it, could be delivered in advance. The invoice for such projects is not raised yet, and the client has not paid up. Such revenues are recorded as assets in the balance sheet. Unbilled revenues from time-based contracts are classified as trade receivables. Unbilled revenues from fixed-price contracts are classified as non-financial assets.
-
- Number of clients / new clients: IT companies offer B2B services. Their clients are primarily other businesses. Businesses spend massive amounts of money on IT. Therefore, each new client is a big boost to the revenues. And every client lost is a dent in the revenues. A good measure of growth is finding the number of new clients added in a given quarter or year. You could further understand the quality of these additions from the value brought by these clients. A client billing $10 million annually is surely more profitable than a client billing $1 million. This snapshot from Infosys’ FY23 year-end results shows that $1 million+ clients increased from 853 in Mar-2022 to 922 in Mar-23. Similarly, $100 million+ clients grew from 38 to 40. Concentration risk seems high given that only 25 out of 1872 clients make up ~35% of total revenues. Losing any of these top 25 clients could perhaps hurt more than losing all of the bottom 25 clients.
- Number of clients / new clients: IT companies offer B2B services. Their clients are primarily other businesses. Businesses spend massive amounts of money on IT. Therefore, each new client is a big boost to the revenues. And every client lost is a dent in the revenues. A good measure of growth is finding the number of new clients added in a given quarter or year. You could further understand the quality of these additions from the value brought by these clients. A client billing $10 million annually is surely more profitable than a client billing $1 million. This snapshot from Infosys’ FY23 year-end results shows that $1 million+ clients increased from 853 in Mar-2022 to 922 in Mar-23. Similarly, $100 million+ clients grew from 38 to 40. Concentration risk seems high given that only 25 out of 1872 clients make up ~35% of total revenues. Losing any of these top 25 clients could perhaps hurt more than losing all of the bottom 25 clients.

- Attrition rate: The attrition rate is the percentage of employees who left the organization in a given period. Every organization has an attrition rate. But why is it a critical metric for IT? Talent is the primary input at IT companies. Employees are their highest cost. Employees leaving the organization are an even higher cost.

When employees leave, expenses that the organization must have incurred on training and upskilling them become a sunk cost. The management has to find their replacement. Finding, training, and inducting replacements costs time and money. A high attrition rate could make IT companies desperate to fill positions by offering higher salaries, thereby increasing costs.
A high attrition rate across the industry, as was seen in 2022, suggests high demand for talent. Increased digitalization after Covid-19 led to higher demand for IT services. IT companies, in turn, hired more employees. Higher demand led to employees switching jobs for higher salaries. Organizations started poaching each other’s employees, thereby pushing up the overall industry attrition rate.
Attrition rates might differ across sectors or industries. A 10% attrition rate might be too high for one sector but acceptable for another. Therefore, studying the attrition rate is more meaningful when compared with other IT companies.
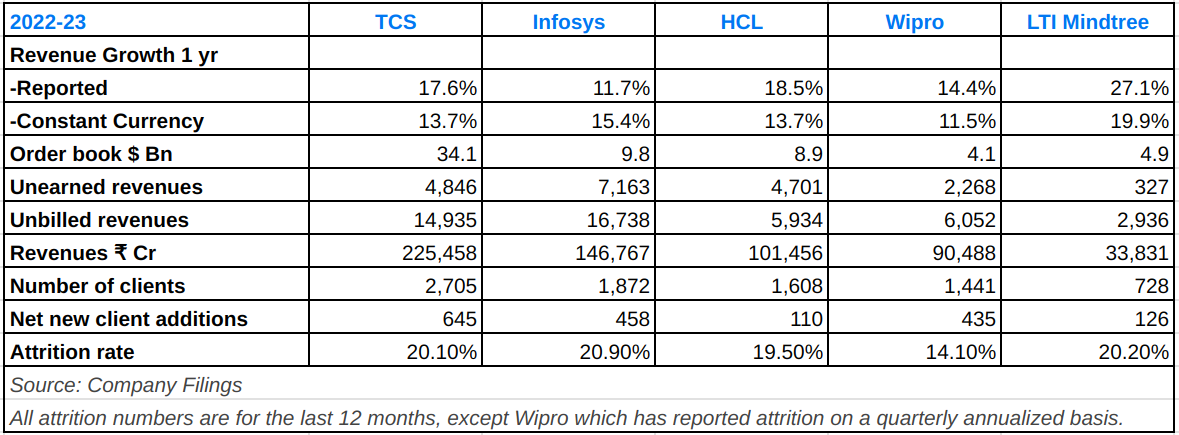
You could use the following table as a guide for the Key Performance Metrics for IT companies.
Apart from the KPIs mentioned above, some IT companies might also mention net recurring revenues (NRR), which measures how much the repeat customers of last year spent this year. An NRR of more than 100% suggests that repeat customers have spent more on the company’s services this year than they did last year. It basically shows customer loyalty. It is a good measure to highlight revenue growth when decent and consistent profitability may not have been achieved.
5.4 – Risks
In the previous chapters on cement or insurance, studying the value chain and ratios helped identify risks. Certain risks, which are qualitative, have a higher probability of occurrence in the IT sector. This is perhaps because of the B2B nature of the business. Insurance, cement, or toothpaste can be sold to millions and millions of consumers. However, IT services are generally sold to organizations. The global nature of the sector also adds to the complexity. Let us explore the risks thus associated.
-
- Concentration risk: Concentration risk arises when there is excess dependence on something to run the business. In the case of IT, concentration can be of at least three types:
- Region: Indian IT is global but has excess dependence on countries or regions where it makes most of the revenues. For most IT companies, the US is a large source of revenue. An economic downturn in the US or a negative regulation could seriously dent the business.
- Client: Excess dependence on a few clients could reduce the business to being at the mercy of those clients. As we saw earlier, only 25 clients contributed to 35% of Infosys’ business in the fourth quarter of FY23. Infosys’ revenues could be badly hit if any of these top 25 clients go bankrupt or decide to look for another service provider.
- Sector: You will see that IT companies disclose segment-wise revenues in their filings. This snapshot shows TCS’ revenue break-up based on the sector their clients are from. Here, concentration risk comes from excessive dependence on a sector. A sector cannot go bankrupt like a client. However, a slowdown in a sector could cause clients from those sectors to curtail their IT spending.
- Concentration risk: Concentration risk arises when there is excess dependence on something to run the business. In the case of IT, concentration can be of at least three types:

-
- Foreign exchange fluctuations: Excess concentration of revenues in one country or region also exposes the business to their currency. So there is a risk of concentration in one foreign currency. Additionally, excessive currency rate fluctuations can impact the profitability of the business. We know that appreciation in foreign currency is favorable for Indian IT companies, but depreciation could cause an adverse impact.
Let’s say a customer has agreed to pay $1,000 for a project. When entering the contract, USD/INR was at ~82. So the expected collection was ₹82,000. By the time the project was completed, INR had appreciated, and USD/INR was at ~78. The actual collection turned out to be just ₹78,000. This will impact profitability. While IT companies have dedicated teams to use derivatives to manage the impact of currency fluctuations, maintaining the teams is also a cost. And extreme fluctuations might be hard to insulate from.
- Foreign exchange fluctuations: Excess concentration of revenues in one country or region also exposes the business to their currency. So there is a risk of concentration in one foreign currency. Additionally, excessive currency rate fluctuations can impact the profitability of the business. We know that appreciation in foreign currency is favorable for Indian IT companies, but depreciation could cause an adverse impact.
-
- Technological obsolescence: IT companies are in the business of technology. One thing that is constant in technology is change. Technological changes can be fast. AI has given a power boost to these changes. Still, their offerings could become obsolete. There are also legacy issues – while a cheaper technology might be available, replacing the older one with a newer one might be expensive and cumbersome.
IT companies maintain enormous budgets to train and upskill their employees to keep up with the latest advancements. However, there is always a risk of these efforts falling short. If you are an investor in the sector, watch how companies react to and participate in technological changes.
- Technological obsolescence: IT companies are in the business of technology. One thing that is constant in technology is change. Technological changes can be fast. AI has given a power boost to these changes. Still, their offerings could become obsolete. There are also legacy issues – while a cheaper technology might be available, replacing the older one with a newer one might be expensive and cumbersome.
-
- Cybersecurity: The entire business of IT companies is digital. Everything is connected. Therefore, everything is also facing cyber threats. IT companies themselves offer cybersecurity solutions to their clients. Cyberattackers often want to attack cybersecurity providers. If they strike an IT company, it could open access to all their clients. The consequences of such a mishap could range from small to tremendous.
IT companies might create redundancies to protect themselves, their data, and their clients. For example, they could maintain a data warehouse that exactly copies every data and action of the main business operations. So if the primary operations are under attack, the backup at the data warehouse could be used to revive operations.
Backups are called redundancies because extra resources are employed just to copy and store the data. But redundancies are important in the face of extreme events. Some organizations also maintain redundancies of redundancies.
Edit 2026: Is AI the newest threat to India’s IT sector?
5.5 – Conclusion
Indian IT is largely an organized sector. It draws a significant part of its business from foreign clients. Therefore, whether good or bad, the impact of geopolitics, regulations, and foreign exchange fluctuations is more pronounced. Being a service business, it is heavily dependent on its human resources. Due to its B2B nature, client addition is a critical factor.
In this chapter, we studied the IT sector, which is service oriented and where new clients are an important indicator of business performance. In the next chapter, we will examine the automotive sector, which is mainly product-oriented and where volume sales are an important performance indicator.
Key Takeaways:
-
-
- The Indian IT industry has grown from $6 billion in 2000-01 to $245 billion in 2022-23. India’s share in global IT revenues is 35%.
- Indian IT is mostly a service-oriented business.
- About 75% of the Indian IT industry’s revenues come from outside India. The industry is largely impacted by global economic conditions, especially the US economy.
- Most of the revenues are earned in foreign exchange. So, INR depreciation is beneficial for IT companies.
- Due to their global presence, Indian IT companies must comply with several regional laws and regulations.
- Key performance metrics of IT companies include revenue growth, order book, unearned revenues, unbilled revenues, new client addition, and attrition rate, among others.
- Concentration risk, foreign exchange fluctuations, technological obsolescence, and cybersecurity are major risks for the sector.
-
HI Vineet, can we have a sector analysis on the Health Care Sector.
Very nicely covered. Crisp & clear. Please do Power / Renewable energy sector analysis.
Thank you for the kind words, Kiran. Your suggestion is noted. 🙂
This module is like a treasure trove. Thank you Vineet Rajani🙌. Please add the real estate sector analysis
Very insightful
Hi Vineet, great article.
How can we know about the new clients that an IT company signs, and the revenue that new clients are going to bring? How frequently do IT companies publish this information and where can we get to know about this kind of information?
Hi Amit, most IT companies give this information with their quarterly earnings presentations. I have attached the latest quarterly presentations by TCS and Infosys here for your reference.
TCS: https://www.tcs.com/content/dam/tcs/pdf/discover-tcs/investor-relations/management-commentary/ir_presentations/tcs-investor-relations-presentation-3q24.pdf
Infosys: https://www.infosys.com/investors/reports-filings/quarterly-results/2023-2024/q3/documents/fact-sheet.pdf
Thank you, this article was helpful
Happy learning 🙂
Great work Varsity team, I really enjoyed and understood the IT sector.
Thank you, Pratik.
Happy learning. 🙂
Why so much of lull for so long. No new content since long !
Hi Nikkhil. We have published two new chapters today. Happy Reading! 🙂
Dear Vineet,
Hats off to your analysis. I\’m grateful. In my investing journey, I have learned the most from Zerodha Varsity and the credits go to Ranga sir. After completing this module (up to the IT sector), I owe you.
Tremendous efforts from your side. Eagerly waiting for the next sector.
Thank you, Sanjay, for the validation. Readers like yourself keep us motivated. Happy reading!
Request you to please create a chapter on banking and NBFC , basically lending sector.
Noted Girish. Thanks 🙂
Vineet-ji, it\’s been a long time since the last chapter. Are the chapters in pipeline?
Answering on behalf of Vineet, yes, we will be uploading the chapter this week 🙂
Please Provide Option For Downloading It As PDF… You Used To Do Before
Hi Devesh, we will surely offer PDF downloads once the module is complete. We are still in the process of publishing more chapters.
Hi Vineet, when we can expect analysis of auto Sector
Hi Raghu Ram, it is in the final stages of review. So you can expect it soon.
When can we expect the sector analysis on banking?
Hi Pavan, we will try to publish it in the next week or two.
Another great module.
Would you please consider covering hotels and resorts industry?
Thank you.
Thank you Prathamesh. Good idea. Adding it to the list.
Dear zerodha varsity team am whating energy moudel
Hi, we will cover the energy sector after the 3-4 other sectors that are in progress.
Hello sir
Please provide which sector needs which valuation or multiples.It helps us complete knowledge
Hi, there is no definite answer to this. You will see that a research report on a single company could be using 3-4 valuation methods.
Within the same sector, you could value a mature company using DCF, dividend discount model (DDM), or multiples. A new or growing company in the sector could be assessed using revenue growth, solvency, operating cash flow etc.
Why this difference between companies of the some sector? Because new companies may not have free cash flow or pay dividends. Therefore DCF or DDM does not work on them. If a new company does not have earnings, you cannot even use Price-Earnings (PE) multiple.
Similarly, a mature company might see a very steady revenue growth but could be generating a lot of free cash flow. Mature companies are also likely to pay dividends regularly. So DCF or DDM works on them.
Excellent work by Zerodha, Practical always in an easy to understand language. Kudos!
Thank you, Girish!
Thank You So Much Varsity Team, For Such a Wonderful Module, My Question May Be Slightly Off Track,I Wanted To Know If There Are Any Intern Positions Available In Zerodha As Financial Analyst,As I Am So Eager To Work With Zerodha Team 🙂
Hi Vamsi Kaushik. Thank you for reaching out. We do not have any opportunities now, but will get back if there is any.
Love you Vineet and kartik for delivering great content .Actually i am not habitual reader but your intriguing content made me a reader.I am pursuing Msc finance for me this is gold mine for understanding basics of sector analysis.Please keep writing about more sectors.Once again love you both of them
Thank you, Gaurav, for such a sweet message. So glad that our work could make a difference. More sectors in the pipeline.
Wipro\’s revenue figure of Rs. 904,876cr needs to be corrected in the table for key metrics.
Thank you, Ritik, for pointing it out. The figure is now corrected.
First I appreciate your initiative on this regard…. secondly I think there are still many gaps to understand /grab the whole concept of share market….. like if you go deeper into share market first we need to understand country and their businesses with respect to their role in Indian economy and how they fluctuated from internal and external factors.. there after industrial distribution and company performance….. demand & supply chain…..at the end we reached on market place whare we directly correlate actual indian market…in short we can say share market is direct reflection of indian economy…
Thank you so much, Kapil.
A lot of your points are discussed in this module\’s first chapter, Sector Analysis Overview and Varsity\’s third module, Fundamental Analysis 🙂
Any book suggestion on this Module…
.
Hi Kapil, we have not come a cross a comprehensive book on sector analysis so far. It is also the reason why we wanted to launch this module. 🙂
Will you post a draft/content/index of this module so that we know what come after this chapter….
We plan to add several sectors, Kapil, but there is no definite list. We have automobile, banking, and steel in the pipeline for now. 🙂
Excellent content.Thank you so much for such nice & short informative analysis of the technology sector. KUDOS to team of zerodha!!!
Thank you, Bhavik!
Sure thanks Vineet…✨🙏
Such complex sector explained with such simplicity. Thanks much. Some more light on how hedging is done practically to overcome currency fluctuations will be helpful. Thanks 🙏
Hi Nikkhil, thank you.
You could check out the Currency, Commodity, and Government Securities module on Varsity to understand currency trading and hedging.
Highly insightful and useful. Would suggest to add sector specific valuation metrics and benchmarks.
Hi Anup, thank you.
Firstly, valuation approaches are subjective. you might want to do DCF, I might want to do relative valuation. Even when we agree on a model, our assumptions could vary. Also, sector averages keep changing over time. 🙂
Hello, Vineet Rajani. When we can expect sector analysis on AUTOMOBILE, my desire is that video series, in addition to varsity, be used to acquaint knowledge further.
Hi Raghu Ram, Automobile sector is under works. Should be released in a few days.
Thanks for this much anticipated chapter on the IT sector. Hard to believe that such quality material is available for free. Varsity is essentially like a free business school.
Thank you, Saumya, for the validation. Messages like these keep us going. 🙂
Incredibly useful module as always. My query might be a bit digressive, but I\’ve wanted to ask when will the previous module (Integrated Financial Modelling) go live on the Varsity app and will it have certification quizzes if it does? Thank you for the amazing modules and making them available for free:)
Hi Harshwardhan, the app is undergoing a revamp, post which all modules will be available on the app. Yes, we will eventually add quizzes too.