
4.1 – Studying the Different Types of Insurance Companies
The previous chapter set the tone for the overall insurance industry. It spoke of the market structure, sales channels, and the risks involved. In this chapter, we will understand the industry with the help of two insurers – HDFC Life and ICICI Lombard.
Just like stock broking or banking, insurance is a highly regulated sector; insurance companies have to disclose many data points and financial ratios on a regular basis. These data points and ratios are calculated using IRDAI-prescribed formulas. There are two advantages here –
-
- The scope for data manipulation is low as the disclosure formats are fixed
- You, as an investor analyzing the sector, don’t have to crunch numbers 🙂
You only have to know how to interpret these numbers and ratios mean and figure out if they are good or bad. And that’s exactly what we will discuss in this chapter!

4.2 – How to Study a Life Insurance Company?
To help you understand the insurance sector better, I’ll work with the numbers of HDFC Life and explain the same. Note I’ve got the fourth quarter (FY 2023) numbers here. You can download the entire presentation from HDFC Life’s website; look for it in the investor relation section.
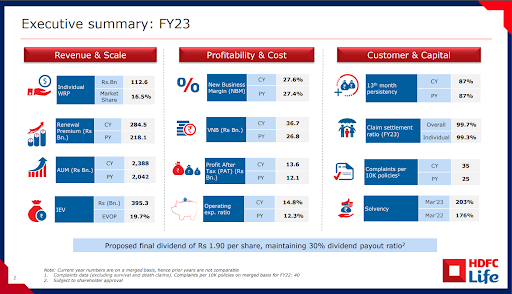
The executive summary gives a glimpse of the most critical parameters to be reviewed. The subsequent pages will show insights into some of these metrics. Let us dig.
Premium income: This one is straightforward. If you’ve ever bought insurance in your life, then you’d have paid a premium. The premium you pay becomes the ‘Premium Income’ for the insurance company. One might wonder if the premium income is the same as revenues because an insurance company’s business is primarily collecting premiums. The answer is no because the insurance company also earns other income which comes from investments.
Do note that total premium income is of two types: gross premium and net premium. Gross premium is the premiums that policyholders pay. Net premium is the premium an insurance company is left with after reinsuring part of its issued policies. Further, premium income is of two types: New business premiums and Renewal Premiums.

-
- New business premium: It is the premium earned from issuing new policies. Continuous growth in new business premiums indicates the sales team’s continuous ability to attract new business.
- Renewal Premium: It is premium earned when policies issued in the previous years were renewed. Why is this metric important? A higher share of renewal premiums in total premiums suggests that the company has been able to retain old customers. Retaining old customers is always cheaper than acquiring new customers. Effectively, if selling expenses go down, the insurer can get higher profits.
I’ve taken this snapshot from HDFC Life’s presentation. It shows the trend in new business premiums and renewal premiums.
Annualized Premium Equivalent (APE): When you buy an insurance policy, you can pay premiums every month, quarter, or year. There is another option – you pay one lumpsum premium to get coverage on a multi-decade basis. For example, check the insurance plan by HDFC Life in this snapshot – here, I will have to pay ₹2.4 lakhs for ₹1 crore insurance for 40 years.

The lumpsum premium has to be annualized in order to make it comparable with the regular premium receipts, and also give a perspective on premium collection. Conventionally, APE is calculated by summing all the annualized first-year premiums with 10% of all single-premium policies.
In this snapshot, you can see how different the total premium and APE figures are.

Value of New Business (VNB): VNB measures the profitability from the new policies sold during the year. It is the present value of expected future profits from new policies issued during the year. You can learn how to calculate PV. But for studying insurance companies, you do not have to compute VNB, as they declare it with their quarterly results. Each insurer will have its own actuarial assumptions around expected policy life, future profits, and the discount rate applied to arrive at the present value. More conservative assumptions could lead to understatement of VNB, while loose assumptions could overstate the VNB. Therefore, comparing the VNB of two life insurers might not be helpful.
However, comparing with the previous year’s performance could show how an insurer has been able to grow profitability. This snapshot from HDFC Life’s presentation shows VNB has nearly doubled between FY20 and FY23.

I used the term “actuarial” in the previous paragraph. Insurers hire “Actuaries” who employ statistical techniques to measure and manage risks. Accordingly, they decide on the right premium price for all policies. The techniques and assumptions used to measure risks and premiums differ across insurers.
New Business Margin / VNB Margin: VNB is divided by APE for a given year to arrive at the VNB margin. It is similar to the profit margins of any business. Again, since this is based on each insurer’s subjective management assumptions, comparing with peers may not help, but comparing with past performance could be useful.
An insight to draw from these metrics would be to check the growth of APE and VNB. For example, an increasing APE with a declining VNB suggests that new business is coming at lower margins. You could further dig to find out if the lower margins are due to higher selling expenses or due to selling low-margin policies.
The expense of management ratio / Operating Expense Ratio: It is the ratio of operating expenses to gross premiums received. Operating expenses include all expenses incurred as part of normal business operations – selling and distribution, administrative, servicing claims, bad debts, depreciation, etc. Interest expense is excluded.
Since this is an expense ratio, the smallest possible ratio is more desirable. And when I said earlier that the regulations are tricky, I was referring to how regulations can alter a formula. For example, IRDAI has stipulated limits on the expenses made toward selling policies. Expenses in excess of that limit have to be borne by the shareholders/owners of the business.
Underwriting profit: It is the profit generated from the core insurance operations. Out of the premium collected, the insurer has to pay commissions, brokerage, other selling expenses, and claims. What remains after paying all that is underwriting profit. The underwriting profit ratio is calculated by dividing the underwriting profits by gross premiums.
For an insurer to make underwriting profits, it must have strong underwriting practices. In simple words, the insurance seller must sell policies where the chances of claims are minimal. They cannot just reject high-risk customers, but they can charge higher premiums to accept high risks. Insurance companies also have to avoid getting defrauded.
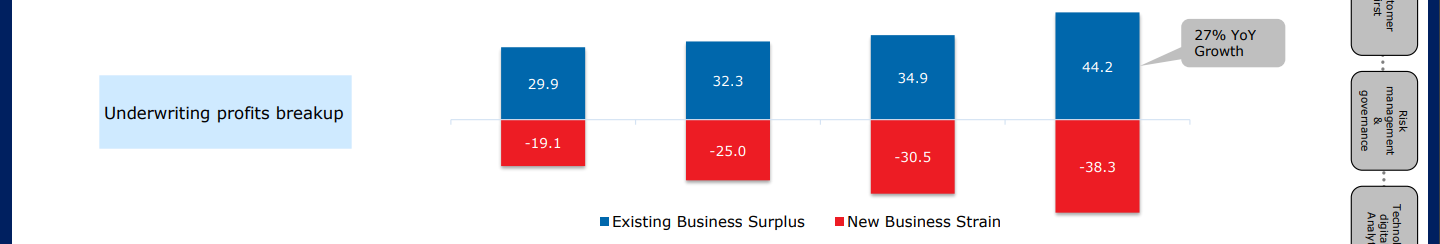
Shareholder surplus: It is the part of profits that can be assigned to shareholders / added to equity after paying all the benefits to policyholders and setting aside a provision for future appropriations. Appropriation is used to allocate profits to specific purposes. For example, splitting profits to share with policyholders and shareholders is an act of appropriation of profits.
I got this snapshot from the FY2022 annual report of HDFC Life to show the appropriation of shareholder surplus.

Assets under management (AUM): It is the current market value of all investments made by the insurer. Remember, this is not just the surplus from the most recent P&L, it is the accumulation and growth of all investments made so far in all previous years. AUM is made up of both shareholders’ and policyholders’ funds.
This slide from HDFC Life’s presentation shows a break-up of the AUM on two parameters:
-
- Asset allocation: it shows the ratio of debt to equity
- Beneficiary composition: it shows the ratio of unit-linked plans to traditional plans. Basically, unit-linked AUM belongs to policyholders; it comes from ULIPs. The share of traditional comes from all other types of insurance policies.

Growth in AUM could be because of large surpluses during the year or a growth in the market value of the investments. Similarly, a decline in AUM could mean a loss in the market value or redemption of investments to service claims. If the premiums earned in a period were inadequate to service the claims, funds from investments could be used. A larger reservoir of AUM can help the insurer stomach losses for several quarters or years. Therefore, the larger the AUM, the better.
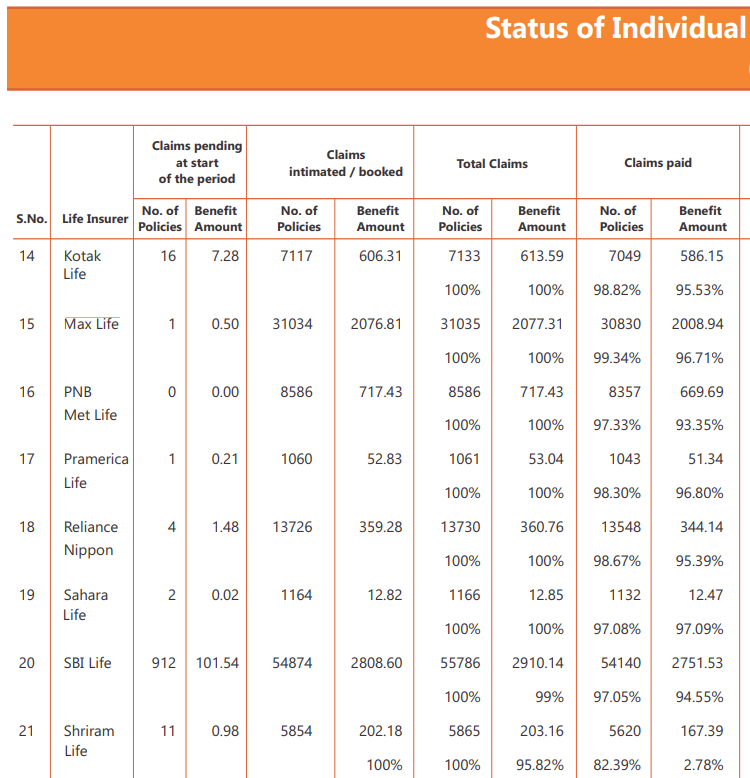
Claims settlement ratio: Claims settlement ratio speaks of the credibility of the insurer. The approach to understanding the claims settlement ratio is a bit nuanced. A high ratio could mean either poor underwriting or strong business practice. Insurers always market their claims settlement ratio. A high claims settlement ratio instils a sense of trust among the customers – they believe when the time comes, their claims will be honoured. As an investor, you need to dig deeper, though.
Let’s say there are two insurers: A and B. A has a 97% claims settlement ratio, while B has 95%. Is A the better insurer? Not necessarily. If A is a small insurer and has settled 97000 claims out of 100,000 claims received while B has settled 95 lakh claims out of a crore received, perhaps B is a better insurer because of its size and experience.
This snapshot is from IRDAI’s annual report for FY22. You can find the annual reports on IRDAI’s website. You can see how Pramerica has received ~1000 claims while SBI Life has received over 50000 claims. The larger size of business operations comes with a greater number of claims. What matters is the organization’s ability to honour claims.
Solvency ratio: The solvency ratio checks the ability of the insurer to be able to pay all its liabilities. It is calculated as the ratio of the Available Solvency Margin to the Required Solvency Margin.
-
- Required Solvency Margin (RSM) is the expected total payable amount arising from insurance claims.
- Available Solvency Margin (ASM) is the excess of AUM over all the liabilities, including claim-related liabilities.
You do not have to compute this as it is part of every insurer’s quarterly financial results. IRDAI mandates all insurers to have a minimum solvency ratio of 150%. The following snapshot from IRDAI’s FY22 annual report shows the solvency ratios of life insurers.
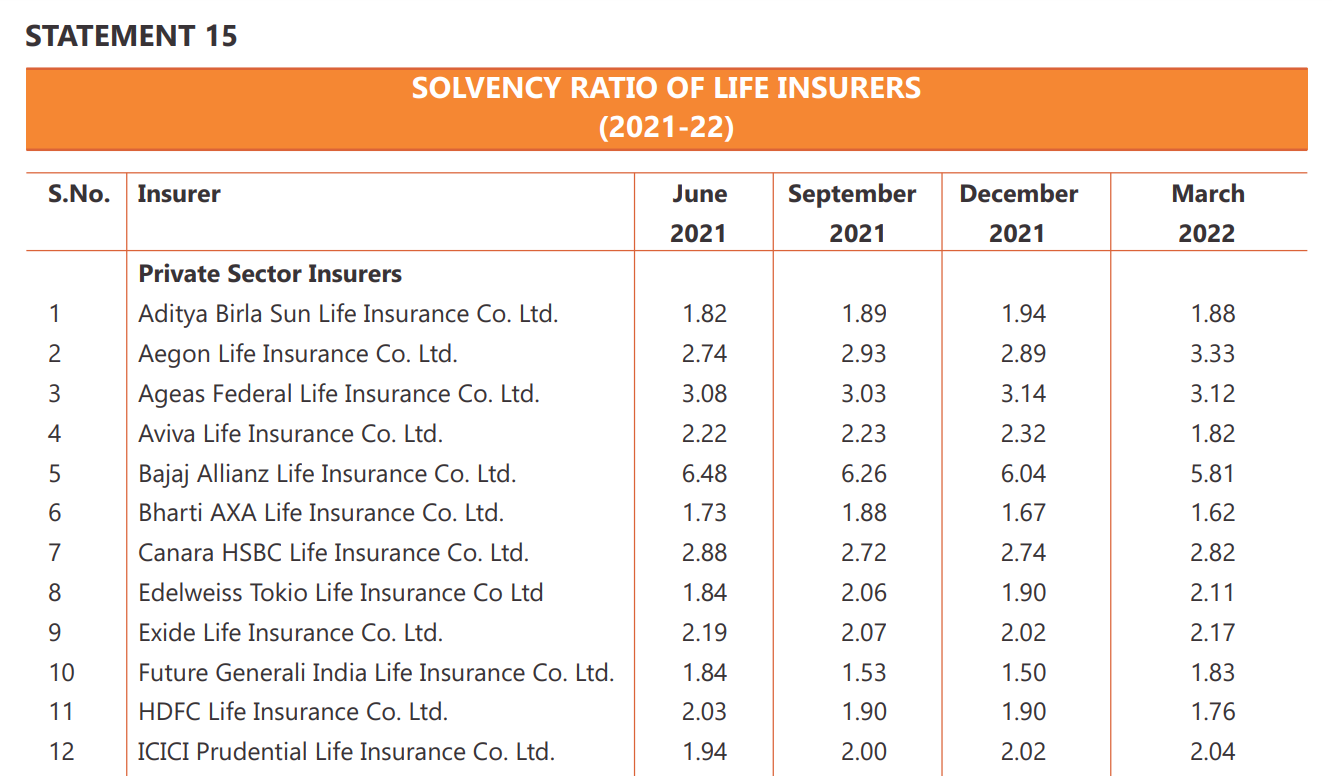
Let me elaborate on the concept of solvency ratio using this snapshot from HDFC Life’s presentation. The “Mar 31, 2023” column shows the Required Solvency Margin (RSM) worth ₹72.1 billion. This is also the size of liabilities. The regulatory requirement of a 150% solvency ratio means its needs a cover of ₹108.2 billion (₹72.1 billion * 150%). The red-colored part of the column is this additional mandatory cover.
Further, the grey-colored part of ₹38.4 billion is extra cover HDFC Life has over the regulatory requirement. The total of the three portions is the available solvency margin of ₹146.6 billion against the required solvency margin of ₹72.1 billion. The ratio of ASM to RSM is the solvency ratio of 203%.

Persistency Ratio: Persistency depicts the percentage of policies that continue to be active after a certain period of time. Persistency is generally checked for the 13th month or the 61st month. Let me simplify this with an example.
Suppose an insurer sold 1000 policies in one year. If only 800 of those policies were renewed or held on after one year, i.e., 12 months, the persistency ratio for the 13th month would be 80%. If 550 policies were renewed for the sixth year, the 61st-month persistency ratio would be 55%. If you noticed, the 13th month is the beginning of the second year, 61st month is the beginning of the 6th year. Insurance companies disclose persistence for several periods. Make sure you compare them with peers for the correct period.
In this snapshot from HDFC Life’s presentation, it is evident that about half of the total policies are abandoned by customers by the 61st month or after five years.

The persistency ratio might also be calculated for the total premium earnings and not just the number of policies. A higher premium-based persistency ratio than that based on the number of policies suggests that higher premium-paying customers are being able to hold on to their policies. Or that low-income customers are falling back on their premium payments.
This table is a summary of the metrics one must look at when analyzing companies in the life insurance sector.

4.3 – How to study general insurance companies?
We have so far looked at a life insurance company. Let’s move our attention to general insurance companies. General insurance companies include – health, auto etc.
The concepts of solvency ratio and claims settlement ratio are applicable to general insurers too.
I will use snapshots from ICICI Lombard’s fourth-quarter investor presentation for FY23 to discuss other key concepts of general insurance companies.
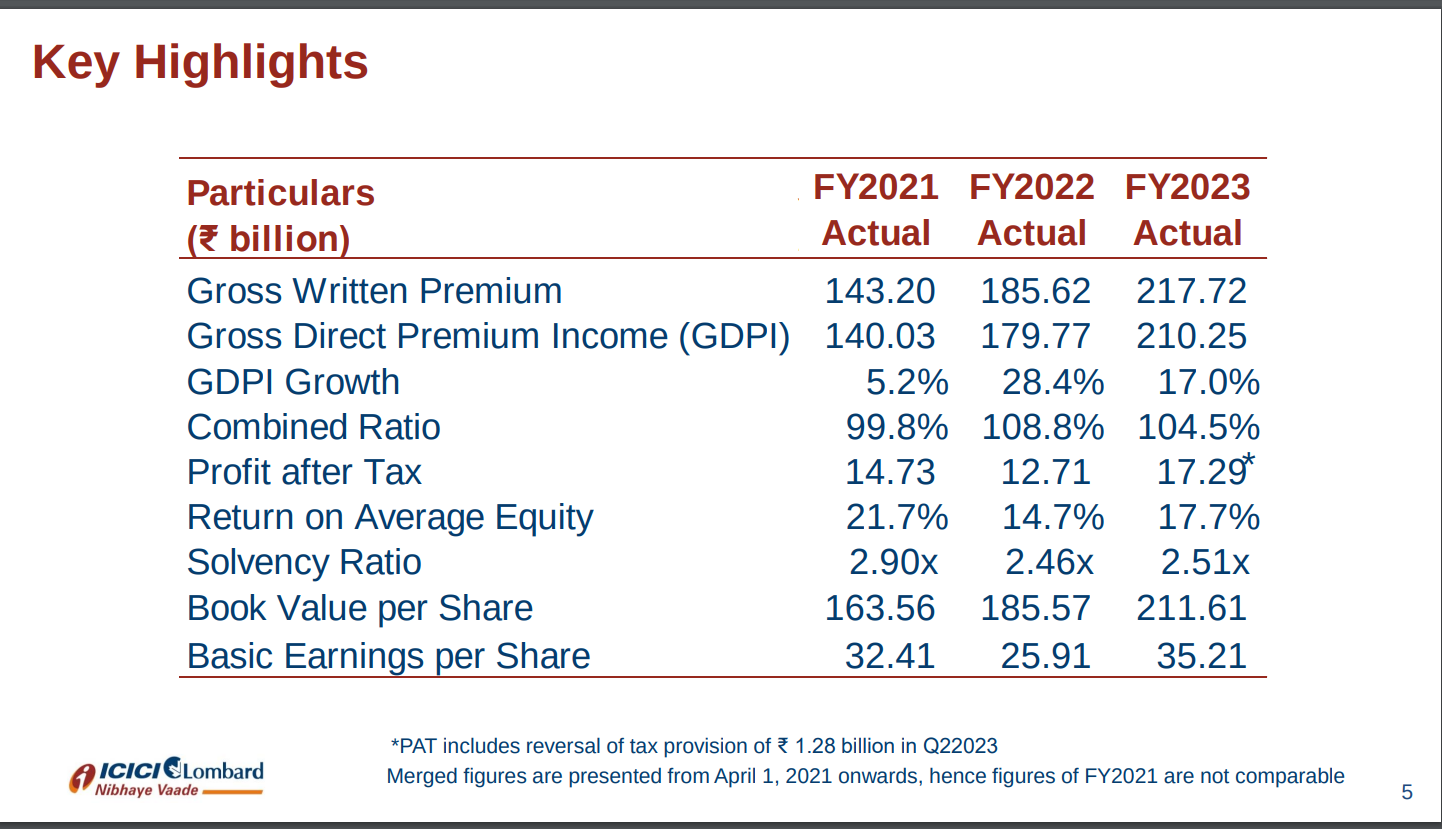
Premium Income
-
-
- Revenue from the insurance business is also called Gross Direct Premium Income (GDPI). It consists of the actual premiums collected from selling insurance policies.
- Gross Written Premium (GWP) is the sum of GDPI and reinsurance inward premium. It includes the premium received for reinsuring the obligations of some other insurer.
- Net Written Premium (NWP) is calculated as GWP minus the premium paid for buying reinsurance.
-
Underwriting expense ratio: Underwriting expenses are incurred while selling or renewing policies. Commissions, brokerage, incentives, processing, verification, etc are all part of underwriting expenses incidental to selling or renewing policies. The ratio is calculated by dividing underwriting expenses by gross premium collections. A lower underwriting expense ratio is important to achieve better profitability.
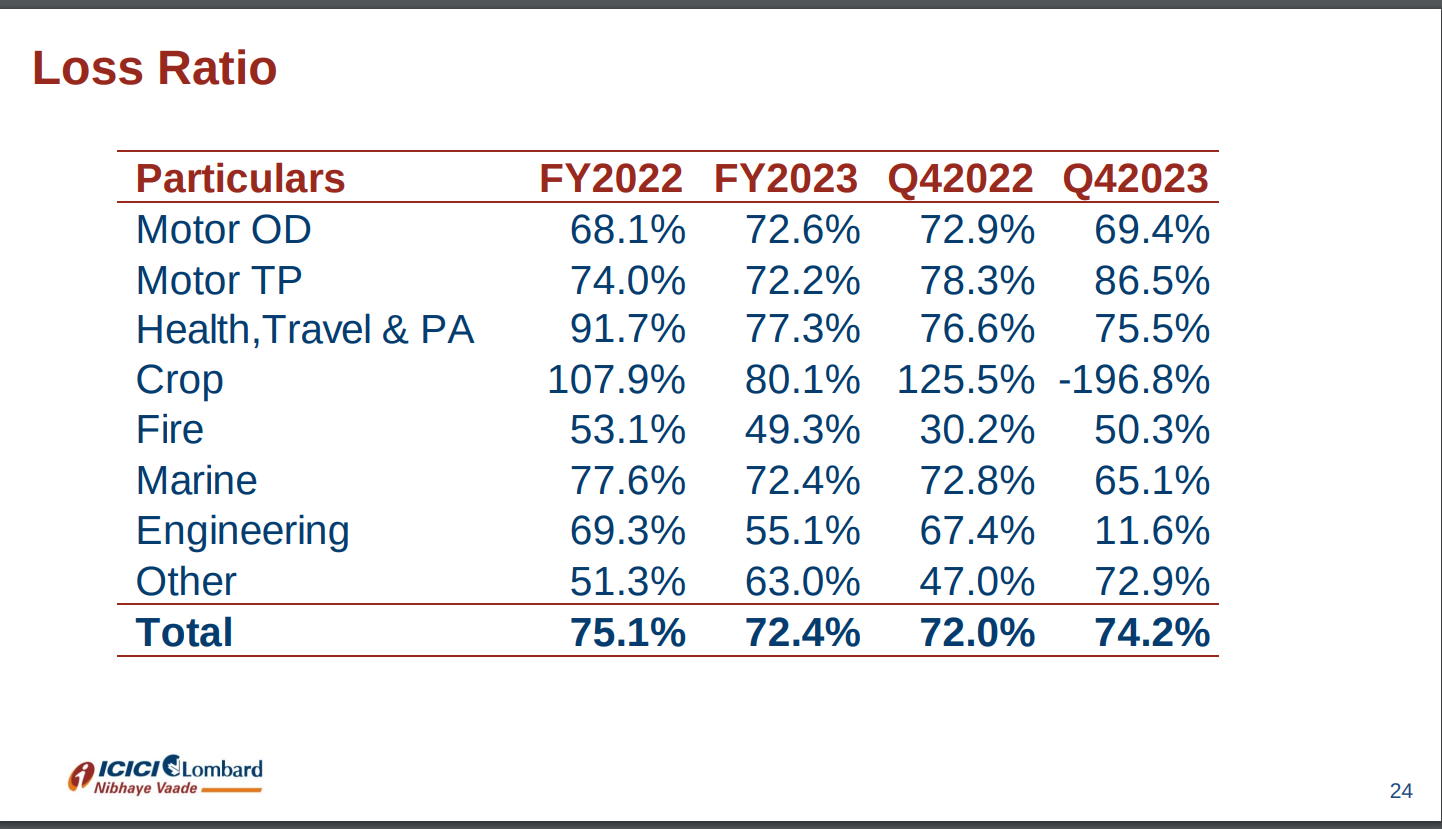
Loss Ratio: The ratio of total claims payout to gross premium. A smaller Loss Ratio is desirable. A high loss ratio suggests that maybe the premiums are priced too low or the basket of policyholders is not adequately diversified.
Combined Ratio: Combined ratio is the sum of Underwriting expense and Loss ratios. A combined ratio of less than 100% suggests that claim payouts are less than the premiums received. Therefore, a smaller combined ratio is preferable. A combined ratio of more than 100% suggests underwriting losses – claim payouts are higher than the premiums received. This is the case for ICICI Lombard too.

However, this does not necessarily mean net losses for the insurance company. The company could be making gains on investments, thereby having a positive bottom line. A combined ratio of more than 100% for several quarters, however, could be a red flag. You could also compare the combined ratio of a company with the industry average to understand its position with respect to peers.
This table summarizes the metrics one could look at while studying non-life insurers.

Key Takeaways:
-
- Life insurance companies have to manage long-term risks and liabilities. Therefore, the critical metrics are also long-term – renewal premium, persistency, AUM, the value of a new business, and embedded value.
- General insurance companies have to manage short-term liabilities. Therefore, the critical metrics are related to revenue and cost components.
- Solvency and Claim Settlement Ratios are critical for both types of insurers.
Really great chapter.
However, the embedded value was missing from the Life insurance companies section, which is one of the most important metrics. Also, can you please let us know what the right way to value life and general insurance companies is?
Thank you!
Sir please uplode one brief explaintion on NBFC company.
Bro this is awesome! Keep adding more readings
Happy learning 🙂
Hi Team,
Great work. I enjoyed reading. I have few queries and suggestions
1. What is debt/equity ratio in terms of insurance asset allocation?
2. Explanation of reinsurance business may be incorporated to make it wholesome
3.There are many factors in life insurance business which are company specific. What more can we do to compare two insurance companies.
Thank you, Aman. Let me try to address each point. 🙂
1. The float and cash reserves held by insurance companies have to be invested. Together they are called AUM. In the HDFC Life example shared, as of 31 March 2023, 70% of the AUM is invested in equity and 30% debt. It is the same as the asset allocation you would have for your own investment portfolio. Please note that this debt/equity is not the capital structure of the insurance company, it is the allocation of their investment portfolio.
2. As far as risk ratios of reinsurers are concerned, they are the same as those for insurers. Beyond this, when comparing reinsurance companies, you may look at their reinsured portfolio to assess the composition of assumed risk.
3. Company-specific factors cannot be generalized. This is where you will have to wear an analyst\’s hat. Also, each analyst will assign a subjective importance to the various company-specific factors.
Hey! Wonderful write-up explaining the insurance sector. I have a couple of questions. Can you please clarify whether we should include claims in calculating Underwriting profit? In the second part where you explained about general insurance business, you didn\’t mention claims for calculating underwriting expense ratio. Please clarify whether I am missing something. And how do they calculate the underwriting profit if they include claims? Can you explain with numbers? The slides which you have attached bifurcates the profits into two parts as existing business surplus and new business strain. Ideally, if we include the claims, it will be a strain on the part of existing business right? Kindly look into this and resolve my query
. Thanks
Thank you, Gowtham.
Yes, claims are considered when calculating underwriting profits.
Underwriting profit = Gross premium collection – Combined expenses (derived from combined ratio)
Underwriting profit = Gross premium collection – Underwriting expense – Loss expense
This is because combined ratio is the sum of underwriting expense ratio and loss ratio.
In the general insurance section that you have mentioned, claims are part of loss ratio and not underwriting expense ratio.
As for the second part of your question on the bifurcation of underwriting profits, you are right that claims are a burden. But picture this, who would the insurer be more comfortable paying claims to? Someone who has been paying premiums for the past five years or someone who has been paying only for 6 months?
Claim liability against a new insurance policy is comparatively a bigger burden in the initial years when only a few premiums have been paid. Hence, new business creates more strain. A policy\’s profitability grows with every additional premium earned against it over the years.
Pleasure is all mine. Thank you so much😊
I am sure after going through all of the sector module, I would be more than ready to become a research analyst myself. 😃
It is so visible that writer has put all his might to ensure that readers of the module become atma nirbhar by themselves and can take informed decisions and avoid the general scam by tipsters.
Standing Ovation Vineet 👏👏
Thank you so much, Nikkhil. Your message has made my day, and motivated me for the month. 🙂
Hello varsity team,
Thanks for these valuable info your team is doing fabulous job to aware investors to make informed decision before buying and selling. Please cover manufacturing sectors and realted industry groups so can make out of recent capex cycle of this and upcoming bull run
Thank you, Mayank. Auto and steel sectors are in the pipeline. We shall cover some more manufacturing industries after that.
Dear zerodha varsity team we are waiting your next module. I like your teaching behaviour so please share your valuable time .
Dear Kishan Singh, the next chapter will be released in a few days. 🙂
Sir, any guidelines do to sector analysis for very niche segments like the wedding industry or like the shrimp industry?
Hi, the effort here is to enable investors to understand sectors of listed companies. If there are enough listed companies in any sector, I will try and cover that sector.
Hi, looking forward for the BFSI. thank you
Thank you, Paul. The chapter on banking will be out in a few weeks. 🙂
Hi Team,
Thanks for putting extensive efforts to write the content.
Few pointers from a reader perspective.
1. We are not using PESTLE framework mentioned in the 1st chapter to analyze each industry. Reader will be confused on why a frame work is introduced with out further use. I understand the PESTEL factors change over time but at least at the time of writing your article you can explain the impact of PESTLE on each industry.
2. Please post the source of your information, specially the ratios of ICCI and HDFC presentations. Are they available to common audience?
3. I liked the cement chapter, easy to understand and few metrics to assess but taking insurance as a next topic kind of became information overload for reader. Too many metrics to comprehend for a beginner learner. We should have started with lean metrics industries to stir interest.
4. Its good to understand these metrics but are there any screeners available either in Zerodha or in other tools to compare a sector companies with these metrics.
5. We should also add some case studies or point of view at the end to give a over view of the sector analysis. For e.g. While we write this article we can perform analysis of sector using both fundamentals and sector metrics to give a bird view about how companies are faring in the sector. Learners can use this as a frame work for future use.
Thank you, Shiva, for your elaborate feedback.
1. You will see I have mentioned PESTLE only after discussing all the factors and not before. I did not want the chapter to appear like an MBA curriculum.
2. This chapter mentions that you can download the entire presentation from HDFC Life\’s website. 🙂
3. Point taken.
4. Most screeners will have financial figures and ratios as filters. Sector-specific screeners are unlikely to be found as sector analysis is largely qualitative. You may want to use more or fewer parameters in studying the sector.
5. The aim is to enable the readers to have their own view and not anchor it to our view. Also, the first chapter mentions that sector analysis must be combined with fundamental analysis.