15.1 A story
Legend has it that beer and diaper sales go up on Friday nights in the US. Wait what?
Apparently, a retail company ran some data analytics on its sales data and found this correlation between the sales of beers and diapers. Parents did not buy many diapers throughout the week because the babysitters would take care of their kids. They would only spend the weekend with their kids, which is when they had to buy diapers. And they needed beers for themselves because it was a weekend.
They say that the retailer, upon finding this correlation, placed diapers and beers next to each other, and sales of both items went up. Others argued that both items should have been placed far apart. A shopper would buy both items no matter what. You might as well make them pass through other shelves between beers and diapers to lure them into buying other products.
Anyway, I am sharing this story because I found it interesting when I first heard it in my retail sector class, which was my minor in post-graduation. 🙂
Let’s pick where we left the Part-1 of this sector and start discussing the Key Performance Indicators (KPIs) of a retail business.
15.2 Key Performance Indicators for the companies in the retail sector
The efficiency of a retail business is commonly judged at a per-square-foot level. This is because:
- Retail stores offer several products in multiple categories and sizes.
- The price points of the products also vary considerably. A ₹1 chocolate with a 50% margin may not be as important to a retailer as a ₹500 chocolate with a 20% margin.
- Two retailers offering the same products through similar stores might see a difference in revenues and profits simply because one of them uses the available space more optimally than the other.
Having said that, there are several other key performance indicators (KPIs), too.
15.2.1 Average Daily Footfall: It is the average number of people visiting a store in a day. A higher footfall could suggest that people are interested in what the store offers.
If you were looking at a digital store, average daily visitors could be considered an equivalent of footfalls. Since checking something online is easier, web stores might see a much higher number of average daily visitors.
15.2.2 Average Conversion Rate: This is expressed as a percentage of the average daily footfall. If a store sees an average footfall of 1000 people, and 750 people actually buy something from the store, it has a 75% conversion rate.
Grocery stores are likely to have a higher conversion rate than apparel stores because of the very nature of their products. If you want to buy rice and dal, you won’t go looking for them in five different stores; you will mostly buy them from the store you are visiting. But if you want to buy clothes, you might visit five stores before buying from one.
The website conversion rate can be lower as people might visit the web store multiple times before buying.
15.2.3 Average Bill Value: Let’s say a store sold goods worth ₹1.5 lakh in a day. In total, 750 people bought from the store that day, or the store issued 750 receipts that day. So, the store has an average bill value of ₹200 for the day (150,000/750).
A store with a high conversion rate but low average bill value could be selling low-priced products or attracting customers who can afford to buy smaller packs or pay smaller sums.
A consistently increasing average bill value suggests that customers are spending more in the store.
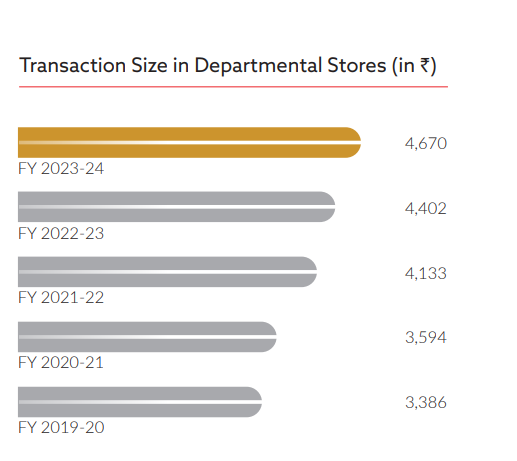
If you are analyzing a retailer, you could compare the GDP per capita growth with the average bill value growth. If the ABV is growing at a rate similar to the GDP’s, perhaps the business’ economics have not improved. It is just keeping up with the economy’s level. A faster growth in ABV could suggest that the store is offering a better variety of products, running offers or the general spending power of its customers is rising.
This is how Shoppers Stop has reported average bill value or transaction size in its FY24 annual report.
15.2.4 SKUs: It covers the width and depth of a retailer’s product portfolio. The product range is wide if it includes everything from shampoos and soaps to groceries, clothes, and furniture. Width represents the variety of products. Depth is the number of options available for a particular product. For example, a retailer sells shampoos of 10 different brands, each with five flavors, each in 5 sizes. So, the retailer has 250 (10*5*5) unique packs of shampoos. It could have an inventory of 10 units of each pack. That’s a total of 2500 (250*5) SKUs of shampoos alone.
15.2.5 Number of stores: More stores can cater to a larger market and increase sales. Adding more stores is useful if profitability or the path to profitability is visible. One also needs the capital to set up new stores.
Each retailer could have a different strategy for growing their stores. Dmart started its stores in Mumbai, then in neighboring cities and towns, then in neighboring states. Starbucks began its outlets in the metro cities before going to tier-2 and tier-3 cities. This depends on the type and nature of the products a retailer is selling.
The product portfolio can also influence the number of stores. Consider this example. Shoppers Stop stores house multiple brands and cater to all kinds of clothing needs under one roof. So it has large but fewer stores. Van Heusen stores sell a single brand and cater to a few clothing needs. So they have small but many stores. In a metro city, you could have 8-10 Shoppers Stop outlets but 25 Van Huesen outlets. Smaller cities might have just one Shoppers Stop and perhaps 3-4 Van Huesen stores.
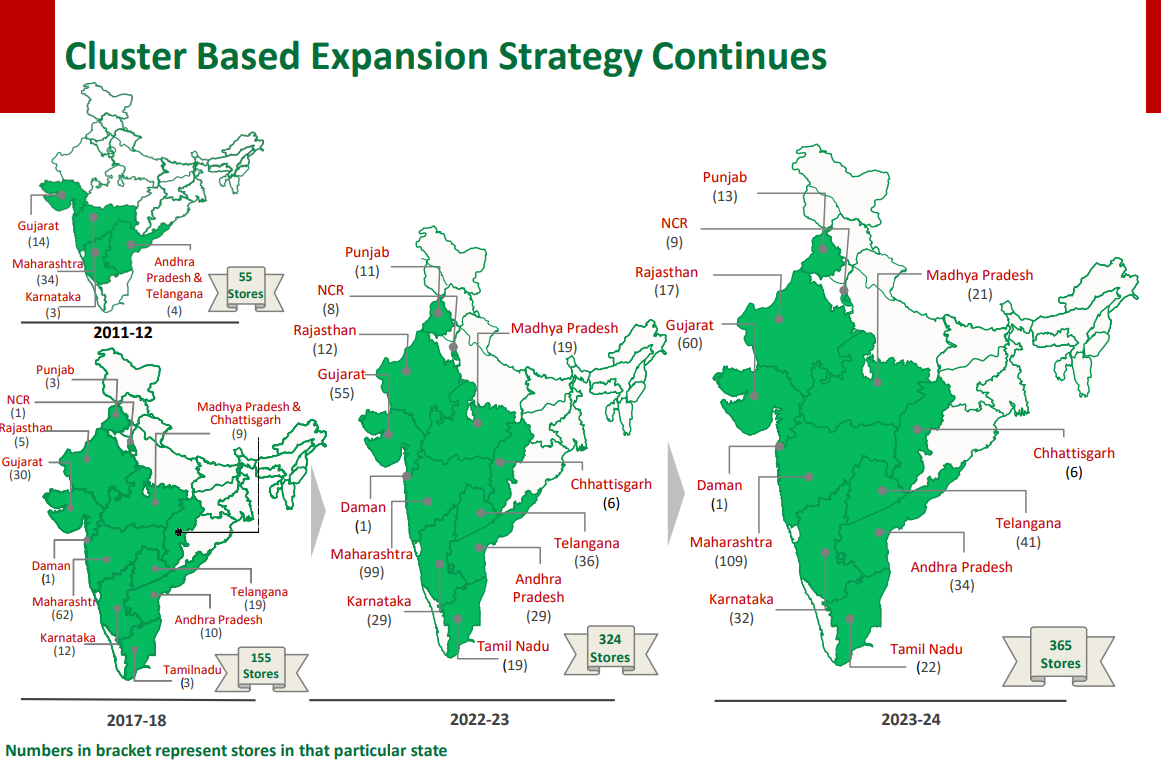
Look at this snapshot, which shows D-mart’s comprehensive approach to showing store counts. It also shows the cluster approach that they have used to expand their footprint over the years. They initially started with Maharashtra, then moved to its neighboring states, and then further.
15.2.6 Same-store sales growth: At the organization level, sales growth can be on account of sales at new stores and sales growth at existing stores (same-store sales growth).
Same-store sales growth is tracked also to see if new store sales are adding to overall sales or just compensating for a decline in the existing stores’ sales.
Let’s understand with an example. Assume that a retailer company registered a 20% sales growth.
- If same-store sales grew 10%, the other 10% came from new stores
- If same-store sales declined 10%, sales from new stores compensated for the decline in existing store sales and also added to it
- If same-store sales grew 25%, the company may have shut some old stores, which would have led to a smaller number of company-level sales growth.
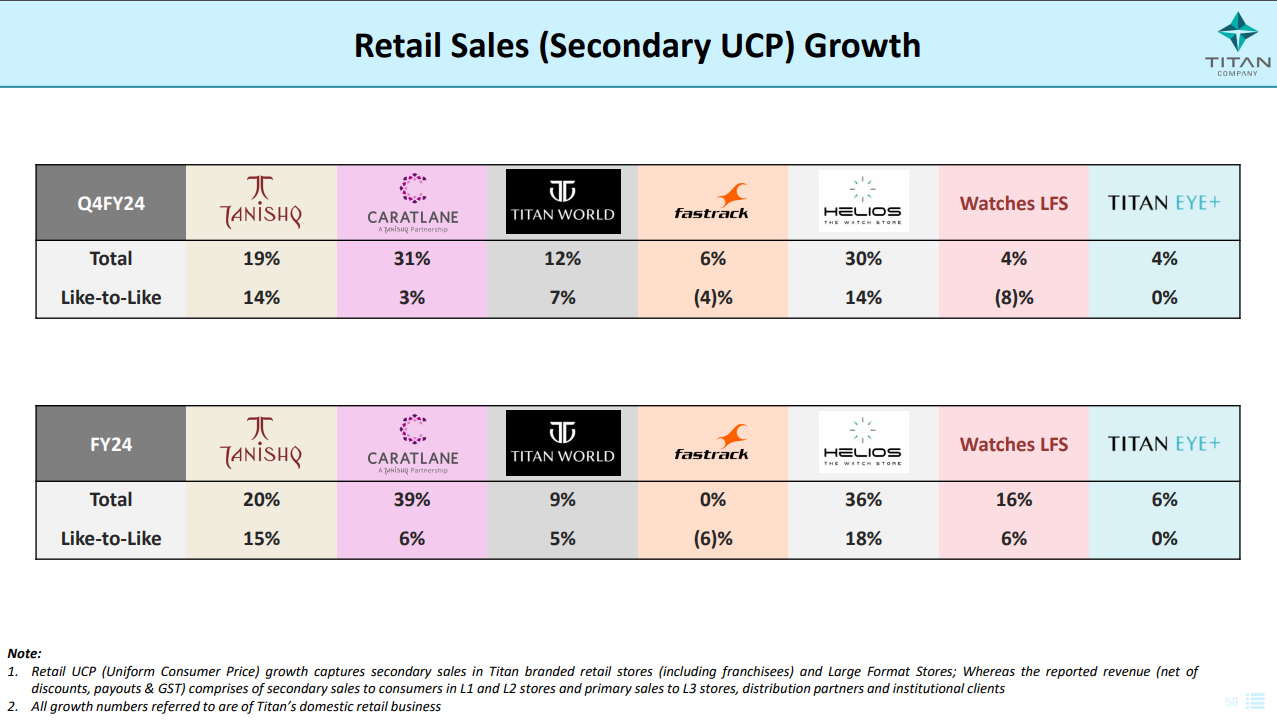
Look at this snapshot of Titan’s Q4 presentation. Like-to-like sales growth represents same-store sales growth.
15.2.7 Revenue per square foot: Whether purchased outright or taken on rent, a retail store is a fixed cost for the company. Let’s say a store’s monthly rent is ₹1 lakh. This rent usually won’t change whether its revenues are ₹5 lakhs or ₹10 lakhs. But naturally, the company is more efficient at ₹10 lakhs in revenues than at ₹5 lakhs.
However, every store size is different, and the rent paid is different. Therefore, you look at the per-square-foot matrix. That way, you can compare two stores of different sizes equitably.
How do you calculate a store’s revenue per square foot? Divide a store’s total revenue by its total square foot area. At the company level, you calculate it by dividing the total revenues by the total collective square footage of all its stores.
Since e-commerce is becoming an increasingly crucial part of a retail business, revenue per square foot should ideally be total revenues divided by the total square footage of its retail stores and warehouses.
Adding retail stores and warehouses in this calculation is necessary because retailers could service e-commerce orders from their stores as well as warehouses. Do note that the warehouse area information is not easily available for all retail companies.
Growth in per-square-foot sales suggests improving sales efficiency. This could come from higher sales volume or a larger share of higher-priced products in the overall sales.
15.2.8 Net profit per square foot: You calculate net profit per square foot by dividing the total net profit by the total square foot area of the stores and warehouses.
If net profit per square foot is rising faster than revenue per square foot, you could say that costs are coming down. This could be because inputs are generally cheaper or because the management has figured out ways of controlling costs. A lower tax rate could also increase net profit per square foot faster than revenue per square foot.
15.2.9 EBITDA per square foot: Wonder why we need to look at EBITDA per square foot when we have already explored revenue and net profit per square foot? We know EBITDA enables easier comparisons between two companies with different asset and capital structures.
Look at the table below. It compares two retailers, A and B. Assume they have the same square footage. A has a higher EBITDA per square foot than B but a lower net profit per square foot. Perhaps A has more owned stores, leading to a higher depreciation. And B has more rented stores, leading to a higher rent expense. Moreover, A’s higher interest expense suggests it borrowed funds to acquire assets.
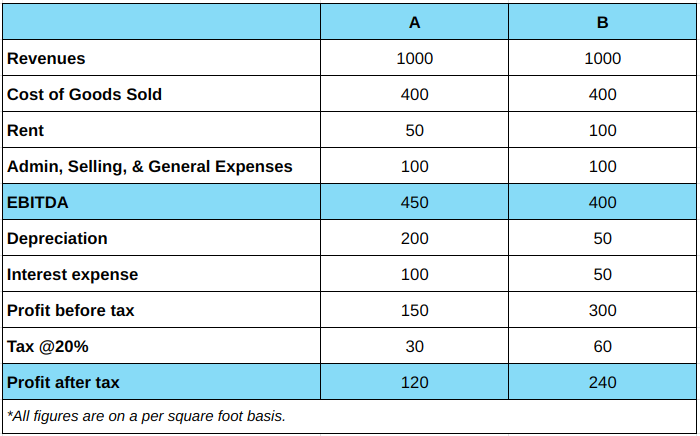
While the core business operations of both retailers are quite similar, their profitability differs due to their different asset bases and capital structures.
In fact, if you talk to a store manager at a supermarket near you, they will probably tell you that achieving positive store-level EBITDA is the key performance metric for their job. EBITDA profitability indicates cash profits. Non-cash expenses may still not be covered, but a store manager cannot be held responsible for the depreciation charge on the store purchased by the company. Even the rent expense is not in their control. But it is a cash expense, so they have to manage it.
Once EBITDA profitability is achieved, scaling up the business can lead to net profitability. Also, EBITDA profitability gives room to pay for administrative and marketing expenses at the corporate level.
15.2.10 Inventory turnover:
This ratio is useful for any sector or business that sells goods. However, it gives some additional insights into the retail sector.
First things first, the inventory turnover ratio has two formulae:
- Total Sales / Average Inventory
- Cost of Goods Sold / Average Inventory
I prefer to use the second one because the first one can seriously distort the ratio depending on the pricing power a business commands. You may choose to use either or both.
Inventory turnover is a useful metric when comparing different companies within a sector or industry. In the retail sector, you could compare the inventory turnover of Titan Industries with Kalyan Jewellers or of Reliance Retail with Trent.
Grocery retailers will have a higher inventory turnover as they mostly sell perishable, fast-moving goods. And by the same logic, an electronics or jewellery retailer will have a slower inventory turnover.
A grocery retailer having a low inventory turnover could suggest that:
- It does not have the right product mix – more capital is stuck in the not-so-fast-selling products
- It is unable to sell its goods maybe because it is inconveniently located or lacks quality, or does not have adequate options for shoppers
- It is maintaining a much larger inventory than it needs to maintain, leading to inefficient capital allocation
15.3 Comparing the KPIs of some retailers
Of all the KPIs I mentioned above, not all will be reported by a company. Perhaps it does not make sense for an apparel retailer to report SKUs. Apparels entail fashion. Fashion is non-standard and constantly evolving.
Anyway, I have tried to compile some standard information that all retail companies report. Here goes.
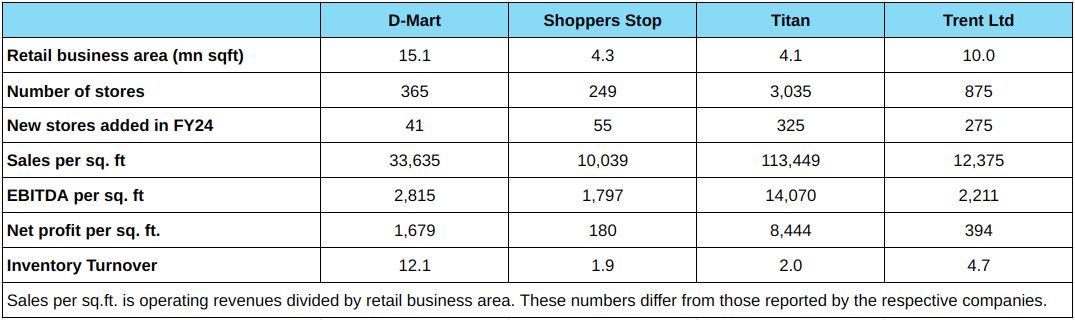
If you examine the numbers above closely, it is natural for D-mart to have more retail business areas because it sells a much wider range of goods. Jewellery, eyewear, and watches perhaps explain Titan’s large number of stores.
D-mart’s high inventory turnover is on account of its grocery-focused operations, although it also sells kitchen appliances and other consumer durable goods. A consumer does a lot of thinking, planning, research, and trials before buying clothes or jewellery. That’s why Shoppers Stop, and Titan have a low inventory turnover. Trent’s Star Bazaar competes with D-mart and its Westside and Zudio compete with Shoppers Stop, and hence, has an inventory turnover ratio somewhere in the middle.
I usually mark the business showing the biggest or strongest numbers in tables like this. But I refrained this time because Titan outperforms the others specifically on these metrics. Titan sells jewellery and watches, which are large-ticket or high-value products. But if you compare its profit margins with the rest, they are all at a comparable level. It is for this reason that you should:
- Always compare retail businesses within their categories – a jewellery business with another jewellery business and a grocery business with another grocery business.
- Complement sector analysis with fundamental analysis – net margins, inventory turnover, ROE, etc are indispensable.
Now, that is a wrap for the retail sector.
I will next cover the FMCG sector, which draws many parallels with retail. Stay tuned. 🙂
Key Takeaways
- The efficiency of a retail business is commonly judged at a per-square-foot level because retail stores offer several products in multiple categories and sizes in stores that again vary in size and layout. Scaling every metric to a per-square-foot level makes comparison easier.
- Revenue per square foot equitably compares the revenues of retailers of different scales. Net profit per square foot and EBITDA per square foot are profitability measures. A retail store manager’s primary job is to achieve and maintain a positive EBITDA per square foot.
- Average daily footfall, average conversion rate, and average bill value are good measures to judge the kind of customer interest a store can attract.
- A Stock Keeping Unit or SKU represents a unique product specific to its size and variant.
- Retail businesses grow by growing the number of stores as well as the sales in the existing stores.
- The inventory turnover ratio gives insights into the speed of sales, types of products being sold, customer behavior, a retailer’s capital management efforts.
when will you resume articles on more sectors. we are waiting from a long time
PLEASE BRING CONTENT HERE PLEEEEASE
Hi PS, we regularly post content here. https://zerodhavarsity.substack.com/
For the last 1 year you people didn\’t post anything. What happened? Can we expect anything or just leave this space.
Sivranj, we are posting a lot of new content via Newsletter, check this – https://zerodhavarsity.substack.com/
And also our Youtube channel.
Sir,
Can we have the industry analysis for AI, Data Centre and Semi conductor besides few other sunrise sectors like Solar? It will be of immense help.
Do keep an eye out on our YT channel 🙂
major segment of your countries is pharma industries after IT which is missing kindy include it as well
Thank you for the suggestion 🙂
Hi Team,
It seems like conservative businesses are only included in this module. Please include a few more top emerging sectors analysis.
Such as? Are there any suggestions?
If possible please include – digital payment sector, evergreen pharma sector, renewable energy sector, etc. Thanks.
Waiting for real estate sector
mutual funds industry next amc , proptrading firms
Sir, we are awaiting new module
Sir pls is module ka hindi me intejar hai
Hi Sir, please try to cover primary sales, secondary sales, margins to retailers and distributors and net realisation in your FMCG module. It will be of great help.
I shall try that, Simran. Thank you. 🙂
Hello Vineet,
Pharma, Hospitals and FMCG sectors will be good as all are secular growth companies.
Thank you. They are on my list. 🙂
Pharma and chemicals sector analysis of this level would be awesome.
Sure, will try my best to add as many as I can. 🙂
waiting for pharma……..
Thank you, will add it to my list. 🙂
Waiting for pharmaceutical sector!!
Thank you for the detailed sector analysis. Wanted to request if sector analysis for Pharma and FMCG could also be released here.
Hi Krishma, FMCG is in the works. Shall add pharma to the list. 🙂
super grateful to you Karthik for crash courses on businesses