7.1 – Expected returns

The next two chapter will be very insightful, especially for people who have never been familiar with portfolio techniques. We will venture into the realms of expected return framework and portfolio optimization. Portfolio optimization in particular (which we will discuss in the next chapter) is like a magic wand, it helps you decide how much to invest in a particular stock (within a portfolio) so that you achieve the best possible results in terms of risk and return. These are topics which the high priests of finance prefer to keep for themselves, but today we will discuss them here and truly work towards democratizing quality financial knowledge.
But please note, to best understand the discussion here, you need to have a sense of all the things we have discussed over the previous couple of chapters. If you have not read them yet, please, I’d urge you to read them first. This is good quality information and you would be a better market participant if you simply spent few hours reading them. The excel sheet used here is a continuation of the one used in the previous chapters.
So assuming you are all set, let us get started.
It is time we put the portfolio variance to good use. To begin with let us take a good look at the portfolio variance number calculated in the previous chapters –
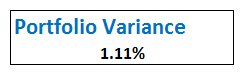
What does this number tell you?
The number gives you a sense of the degree of the risk associated with the portfolio. Remember, we worked on the daily data, hence the Portfolio Variance of 1.11% represents risk on a daily basis.
Risk or variance or volatility is like a coin with two faces. Any price movement below our entry price is called risk while at the same time, the same price movement above our entry price is called return. We will soon use the variance data to establish the expected range within which the portfolio is likely to move over the year. If you’ve read the Options module you will probably know where we are headed.
However, before doing that, we need to figure out the expected return of the portfolio. The expected return of the portfolio is simply, the grand sum of the average return of each stock, multiplied by its weight and further multiplied by 252 (number of trading days). In simple terms, we are scaling the daily returns to its annual return, and then scaling it according to the investment we have made.
Let us calculate the expected return for the portfolio that we have, I’m sure you will understand this better. To begin with, I’ve lined up the data as follows –
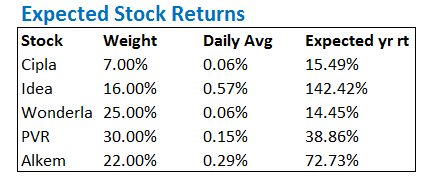
The first 3 columns are fairly easy to understand I suppose. The last column is simply the multiplication of the daily average return by 252 – this is a step to annualize the return of the stock.
For example (Cipla) – 0.06% * 252 = 15.49%.
What does this mean? For a moment assume, I have invested all the money in just Cipla and not other stocks, then the weight of Cipla would be 100% and I can expect a return fo 15.49%. However, since I’ve invested only 7% of my capital in Cipla, the expected return from Cipla would be –
Weight * Expected Return
= 7% * 15.49%
=1.08%
We can generalize this at the portfolio level to get the expected return of the portfolio –
Where,
Wt = Weight of each stock
Rt = Expected annual return of the stock
I’ve applied the same formula for the 5 stock portfolio that we’ve got, and here is what we have –
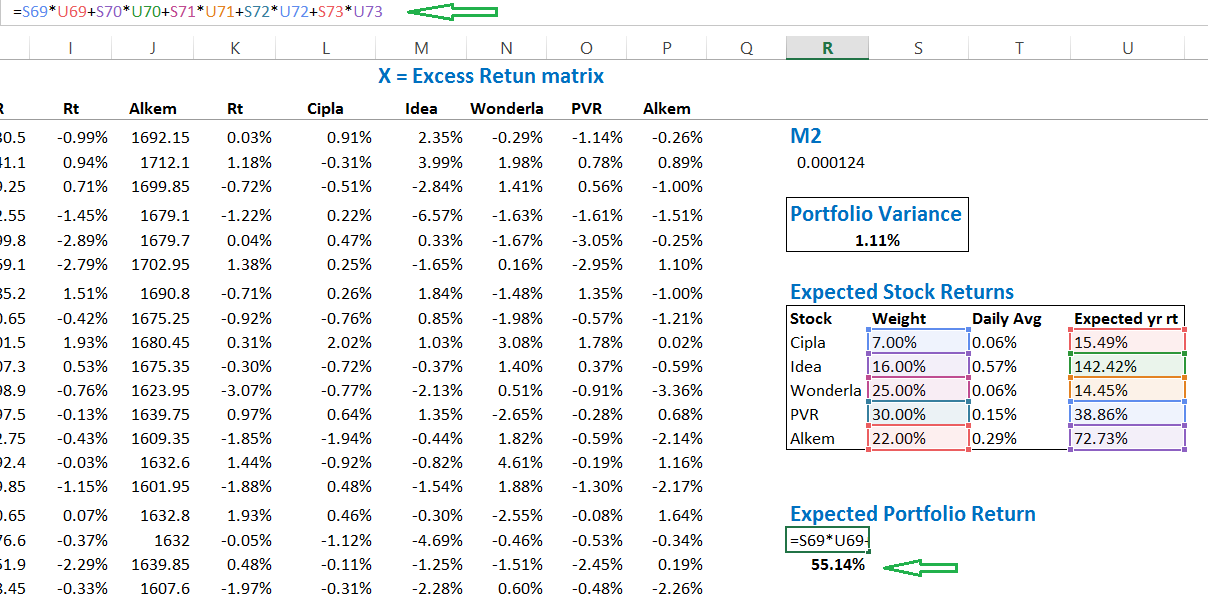
At this stage, we have arrived at two extremely important portfolio parameters. They are the expected portfolio return which is 55.14% and the portfolio variance which is 1.11%.
In fact, we can scale the portfolio variance to represent the annual variance, to do this we simply have to multiply the daily variance by Square root of 252.
Annual variance =
= 1.11% * Sqrt (252)
= 17.64%.
We will keep both these important numbers aside.
It is now time to recall our discussion on normal distribution from the options module.
I’d suggest you quickly read through the ‘Dalton board experiment’ and understand normal distribution and how one can use this to develop an opinion on future outcome. Understanding normal distribution and its characteristics is quite crucial at this point. I’d encourage you to read through it before proceeding.
Portfolio returns are normally distributed, I’ll skip plotting the distribution here, but maybe you can do this as an exercise. Anyway, if you do plot the distribution of a portfolio, you are likely to get a normally distributed portfolio. If the portfolio is normally distributed, then we can estimate the likely return of this portfolio over the next 1 year with certain degree of confidence.
To estimate the return with certain degree of confidence we simply have to add and subtract the portfolio variance from the expected annualized return. By doing so we will know how much the portfolio will generate or lose for the given year.
In other words, based on normal distribution, we can predict (although I hate using the word predict in markets) the range within which the portfolio is likely to fluctuate. The accuracy of this predication varies across three levels.
- Level 1 – one standard deviation away, 68% confidence
- Level 2 – Two standard deviation away, 95% confidence
- Level 3 – Three standard deviation away,99% confidence
Remember, variance is measured in terms of standard deviation. So it is important to note that the annualized portfolio variance of 17.64% is also the 1 standard deviation.
So, 17.64% represents 1 standard deviation. Therefore, two standard deviation is 17.64% * 2 = 35.28% and 3 standard deviation would be 17.64% * 3 = 52.92%.
If you are reading this for the first time, then yes, I’d agree it would not be making any sense. Hence it is important to understand normal distribution and its characteristics. I’ve explained the same in the options chapter (link provided earlier).
7.2 – Estimating the portfolio range
Given the annualized variance (17.64%) and expected annual return (55.14%), we can now go ahead and estimate the likely range within which the portfolio returns are likely to vary over the next year. Remember when we are talking about a range, we are taking about a lower and upper bound number.
To calculate the upper bound number, we simply had to add the annualized portfolio variance to the expected annual return i.e 17.64% + 55.15% = 72.79%. To calculate the lower bound range we simply have to deduct the annualized portfolio variance from the expected annual return i.e 55.15% – 17.64% = 37.51%.
So, if you were to ask me – how are the returns likely to be if I decide to hold the 5 stock portfolio over the next year, then my answer would be that the returns are likely to fluctuate between +37.51% and +72.79%.
Three quick question may crop up at this stage –
- The range suggests that the portfolio does not lose money at all, how is this even possible? In fact, the worst case scenario is still a whopping +37.51%, which in reality is fantastic.
- True, I agree it sounds weird. But the fact is, the range calculation is statistics based. Remember we are in a bull market (April – May 2017, as I write this), and the stocks that we have selected have trended well. So quite obviously, the numbers we have got here is positively biased. To get a true sense of the range, we should have taken at least last 1 year or more data points. However, this is beside the point here – remember our end objective is to learn the craft and not debate over stock selection.
- Alright, I may have convinced you on the range calculation, but what is the guarantee that the portfolio returns would vary between 37.15% and 72.79%?
- As I mentioned earlier, since we are dealing with level 1 (1 standard deviation), the confidence is just about 68%.
- What if I want a higher degree of confidence?
- Well, in this case you will have to shift gears to higher standard deviations.
Let us do that now.
To calculate the range with 95% confidence, we have to shift gears and move to the 2nd standard deviation. Which means we have to multiply the 1 standard deviation number by 2. We have done this math before, so we know the 2nd SD is 35.28%.
Given this, the range of the portfolio’s return over the next 1 year, with 95% confidence would be –
Lower bound = 55.15% – 35.28% = 19.87%
Upper bound = 55.15% + 35.28% = 90.43%
We can further increase the confidence level to 99% and check the return’s range for 3 standard deviation, recall at 3 SD, the variance is 52.92% –
Lower bound = 55.15% – 52.92%% = 2.23%
Upper bound = 55.15% + 52.92% = 108.07%
As you may notice, the higher the confidence level, the larger the range. I’ll end this chapter here with a set of tasks for you –
- Plot the frequency distribution for this 5 stock portfolio – observe the distribution, check if you see a bell curve
- We are dealing with the range for a year, what if you were to estimate the range for 3 months, or maybe 3 weeks? How would you do it?
It will be great if you can attempt these tasks, please do leave your thoughts in the comment box below.
You can download the excel sheet used in this chapter.
Key takeaways from this chapter
- The returns of the portfolio is dependent on the weights of the individual stocks in the portfolio
- The calculate the effect of an individual stock on the overall portfolio’s return, one has to multiply the average return of the stock by its weight
- The overall expected return of the portfolio is grand sum of the individual stock’s returns (which is scaled by its weight)
- The daily variance can be converted to annualized variance by multiplying it by square root of 252
- The variance of the portfolio which we calculate is by default the 1st standard deviation value
- To get the 2nd and 3rd SD, we simply have to multiply it by 2 and 3
- The expected return of the portfolio can be calculated as a range
- To get the range, we simply have to add and subtract the variance from the portfolio’s expected return
- Each standard deviation comes with a certain confidence level. For higher confidence level, one has to look at moving higher standard deviation
Hi Karthik, I\’m a beginner in stock markets and thanks for the Varsity. I haven\’t seen anything like this platform explaining in a very simple and easy way.
I have tried to calculate the task given by you at the bottom of this chapter, The range that you told to calculate for 3 months is Upper bound = 26.29% and Lower Bound = 15.83%. Is it Correct?
Thanks for the kind words, Aashish. I\’m glad you liked the content. Yes, that seems about right 🙂
We are adding/subtracting the variance to the annualised expected return. But I believe we should have used Standard Deviation in the process = sqrt(17.64%). But I dont get the logic on why sqrt was used for 252 while calculating annual variance
Sqrt because SD is inversely proportional to time.
Did not get this step of calculating Annual variance?
Which step? Please do share more context, thanks.
1.11% sqrt 252 = 17.64 %
Sure.
Hey karthik, thanks for all your replies!
I have another query I need your help with:
These days I’ve been extensively researching and trying out some option strategies. Recently I learnt that one way of finding out S&R levels of Nifty is to go to nifty option chain and look at the highest OI OTM puts for the support and highest OI OTM calls for the resistance – these levels were 17800 for the support which was the highest OTM put OI and around 18000-18100 for the resistance which was the highest call OI. So karthik my question is for them to be the relevant S&Rs they need to be short positions right? But nowhere it is specified that these are specifically call and put shorts it just says normal OI. Do we just assume them to be shorts is that how it works?
I’ve seen people do this for formulating theher option strategies and buying and selling option outside these levels
They also use sensibull OI where again it doesn’t say specifically shorts but people assume it is call or put short
Really confused with this topic! Please clear my confusions in your free time!
Thanks and have a great week!
Yes, that is on way, but works only for F&O stocks which are highly liquid. I\’d rather learn the classic way of identifying S&R 🙂
Hey karthik, my apology for the repeated questions! But I have another doubt:
What time frame did you select for the nifty returns while you calculated the prediction for the nifty range in the options course volatility part? Was it 1 year?
I did the same calculation now first usijg the past 3 months data- here the avg for the next 15 days was greater than the STD for the next 15 days so both the upper and lower range turned positive! Such a range is hardly possible for the nifty to be ( it predicted a range of 18200-19400) in so I calculated using the past 7 months, this time the average was negative – given the volatility we have seen in the past 7 months
Now the range is 17076 – 18787. Now given this if I have to short some CE for aug 25 expiry would I short somewhere around 18400-600? And short puts around 16900?
What range would you recommend for doing this SD calculation analysis ?
Yeah, at least 1 year of data.
Also karthik in the same volatility applications module of Risk management course, you mentioned in the option writing strategy part that – do the SD calculation 1 week before the expiry and write the strike that is “1SD” away from the market price – what does 1SD away mean exactly here? Does it mean that while found the SD calculation we have used only 1SD or let’s take the example where the market price was 8462 and the 1SD range you calculated was 8214 – 8818 so any strike bw 8462 (CMP) to 8818 would be 1SD away anything outside 8818 or 8214 would be 2SD/3SD away?
I mean any strike outside the range. If you are doing this, you will have to be quick else the effect of theta will eat away the premiums.
Hey karthik hope you are doing well. Long time!
I have a small question:
I was going through the normal distribution and prediction of NIFTY range part, there you mentioned that the returns were log returns as you calculated them using LN formula in excel, so you converted them to actual % using 8337 * e(26.67) – I believe these were the numbers.
Karthik what if I were to use the normal formula : (today value – previous value)/ previous value * 100 – which is an actual %.
If I do this way then I essentially work around the conversion back to actual percentage and do not have to do the whole e*(26.67%) process right?
Thats right, Hardik. Its not required to convert normal % to exponential.
Hello karthik,
Yes so this OI is only for the short positions created in the CE and PE or for any long position or short position created?
I am asking this because I read somewhere that sometimes the Oi shown for the CE and PE is for the short positions created not longs
Can you please confirm that it’s for both long and short position or just short.
I’m really confused
Check this, Hardik – https://www.youtube.com/watch?v=xMTG8gzen3Q&list=PLX2SHiKfualFUupnwJajd2DQhSvvvUwTe&index=7 basically every new position creates 1 OI.
Hey karthik, hope you are well.
I have a general question: on the kite platform when we click on nifty we see an option for the “option chain”. When I click on that it also shows “see ful option chain” which opens sensibull. I just wanted to know that the OI part of this option chain on sensibull shows the call short/put short position OI or just general OI ?
Its for both CE and PE.
sir one question
1) for range calculation why we are using the variance value( 17.64 %) not the standard deviation value 4.2 % ( which is square root of 17.64 %)
2) on the above comments you have told that for stocks range calculation use standard deviation and for portfolio range calculation use portfolio variance. why so ??
3) when to use standard deviation and when to use variance for calculating ranges (68, 95, 99).
Excellent
Very motivating
Not able to download excel sheet though
Happy reading. Let me check on the excel sheet.
Hello karthik, I hope you are doing well.
I actually need a bit of career advice from you:
I am currently going to be staring undergrad this year, and I have 2 options:
Option1: leave to canada to get a degree in finance and economics/ financial economics then get CFA and move to the US market – I am considering this because my long term aim is to enter the US markets. And I’ve chosen canada, particularly Toronto because it’s cheaper that the states and hosts opportunities for students who want to intern at US banks.
Option2: I have an option to study here in India at the Indian school of business and finance in New Delhi- it’s fairly new. The degree they are offering is bsc economcs and finance( 3 year ). Now if I stay here, after graduating I’ll go for a CFA and then eventually masters abroad but the problem is that getting a break in the US markets may get harder this way, firstly as it’s a 3 year degree so good unis for masters may be hard to get and there’s obviously a lot of uncertainty.
I really want your opinion on this so According to your professional opinion, what path should I choose? Given my main aim is to get into finance domains- mainly investment banking, Quantitative trading, and price equity in the US on a long term scale.
Looking forward to hearing from you soon.
Thanks and regards,
Hardik phagotra
Hardik, I\’m not really cutout to give career advice. But based on what you\’ve said, I\’d probably opt for the 2nd option. My reasons for that –
1) Its cheaper here in India compared to US.
2) I get 3 more years to fully understand and figure out what exactly I need. Finance is a vast area
3) After 3 years, I can still try to crack the US market buy doing a CFA and applying for masters in US
4) Use the 3 years in India to do other off beat things to make the resume look stronger both for university application and job application post that
Of course, these are just few things on top of my mind. I\’d suggest you speak to people who know better. Good luck.
How you calculate the value of daily average? And I\’m so confused about the figure
Sai, you can use the \’=Average()\’, on the daily returns.
Hello karthik,
I wanted to ask you if I’ll be receiving a reward/prize for winning the quiz, I just saw that there are some prizes as well, so just curious to know that will I be reviewing them soon?
Yes, you will 🙂
Hello karthik!
Thank you so much!
Looking forward to participating again next month!
Hello karthik!
I would like to thank you for organising the zerodha varsity quiz today evening.
I feel very delighted and euphoric to inform you that I finished at the first position in the quiz at 13199 points out of around 200 players.
This would not have been possible without all these modules that you so diligently created on varisty and I owe you this win.
The questions in this quiz were very witty, interesting and some were hard, but thanks to the in depth explanation in varisty, i was in a good position to answer them correctly.
I am looking forward to keeping on learning and improving my financial knowledge.
I also look forward to taking part in these quizzes.
Thank you so much!
Regards,
Hardik phagotra
Congratulations on the win, Hardik. I was watching you climb up the leaderboard 🙂 Superb play…and I\’m glad you liked the content on Varsity! We have got a great response for the quiz, guess we will do this again next month 🙂
So karthik what I gather is that currently the NIFTY FEB 17900 CE is trading at 175, and has surged from around 145-150 to 175 yesterday as the index went a little up during the last couple of hours. So you think that I should avoid buying this option due to the volatility rise right, and it would be better to perhaps initiate a spread like bull call or call ratio?
Hardik, I\’ve always liked spreads over naked options. Volatility will increase when important events are lined up. So plan accordingly 🙂
Okay Karthik, thanks for your response.
I was talking about the premiums for the 17700-17900 CE’s, they have fallen quite a lot in the past 1 week. Do you think it will be a good strategy that I go long on these strikes a day before the budget outcome, and wait for the index to rise and profit from the increase in premiums?
Also, what is your take on the budget? Is it going to affect the market and make it surge or is it nuetral?
Hardik, the premium would have shot up quite a bit given that the volatility is high. Not sure if buying option is the right thing to do. It is always better to trade spreads than naked options. About the budget, your view is as good as mine. We will know only when the FM reads it out, everything else is just speculative.
Hello karthik! Hope you are doing well.
I actually have a trade related question.
As you may know that due to the sell off on Wall Street and the fears of the fed hiking interest rates the Indian markets have taken a toll and nifty and Sensex have plunged a lot.
Now I note that the union budget is to be presented on Friday. Given this, do you think that shorting options and then waiting for volatility to increase as we near the budget date is a good strategy? Keeping in mind that FPIs and US are bearish right now and that the plunge may not be transient for a while.
I also want to execute a trade now on NIFTY 17900/17700 CE for feb 24 expiry just to buy and sell the option hoping that the market goes up, making delta and gamma surge as nifty approaches ATM of 17800. Because the premiums are so low I think with a small surge in nifty I can pocket the difference in the premium. do you think this is a sensible trade or will luck play a huge factor in it?
The volatility in the market is quite high with multiple factors at play. If at all you want to short, I\’d suggest you go far OTMs. Btw, Feb premiums are not low right?
Hello Karthik!
I understand now.
Thank you so much for your reply.
I wish you safety in these uncertain times.
Talk to you soon
Happy learning 🙂
Hello karthik! Hope you are doing well.
This month I have started trading derivatives for the first time. I started with the NIFTY JAN 17800 CE and made 7k In a week by buying and selling this option. I owe all this to you and varsity for equipping me with the knowledge to employ my skills in the markets.
Karthik when I was trading this derivative, I noticed that the delta was 23, which meant that 1 ruppe change in NIFTY would change premium by 23. I wanted to ask you why isn’t it between 0-1 range? And how can I transform this into the 0-1 range?
Thanks for the kind words, and I wish you all the success in the years to come 🙂
The range of delta is just a convention. It can either be considered as 0 to 1 or 1 to 100. Here, 0.23 on the 0-1 scale is the same as 23 on the 1 to 100 scale.
niceGO
GO
I would like to ask a few questions
1) While I implemented this I got Negative ranges of percentage returns for my portfolio is it possible?
2)If I have only 6 months of Data for stocks is it that instead of 252 for annual variance I will take half-year variance(that is sqrt(126))
1) Yes, especially when the returns trend downwards on a prolonged basis.
2) That\’s right.
Hello karthik!
Thank you so much for considering to meet with me! I am honoured.
Moreover, I live in Bangalore so it will be more feasible for us to get in touch.
My email is: [email protected]
(I would leave my number also but since it’s a public view chat box I wouldn’t want to risk it)
When ever you are free please email me and I would be honoured to meet with you.
Since you are doing me a huge favour, it is at your sole discretion to provide me your contact, if you want, so that I can only contact you directly whenever you are free.
Otherwise, whenever you decide to meet up we can just discuss on this chat box itself.
Thank you so much!
Thanks, Hardik. Good luck for your future.
Hello Karthik, thank you. I will keep an eye out for that.
I have a slight unbecoming request:
I know this is completely out of line but if anytime possible, could I get a chance to meet up with you and pick your brain? As I’m figuring how to make it big in the finance field, my head is just filled with questions to the brim.
I know it’s a tad uncanny but I have learnt a lot from zerodha and I trust your judgment, so if ever you can spare some time to Discuss and clear my mind it would really be life changing for me.
If you can not do this, not a problem at all! Just let me know.
My email is : hardikphagotra2807gmail.com
Hardik, we are all still working from home. Will be happy to meet you once office resumes fully 🙂
Hello karthik, thank you so much for your reply.
Sad to know that Zerodha does not offer any internship programs.
However, could you let me know how one can get a job at zerodha to work as an analyst or finance related job?
What would be the necessary qualifications one would need to get a job at Zerodha in the finance department?
Looking forward to hearing from you soon
Hardik, I\’d suggest you keep an eye on this portal, gives you a sense of the job requirements and the kind of qualifications we look for – https://careers.zerodha.com/. There is nothing listed here though.
Hello karthik! Thank you for your reply.
I have another query:
I have just completed my 12th this year and I will be soon heading off to college in a couple of months.
I have been amassing knowledge in finance from the past 2 years through various websites, mainly ZERODHA, and subsequent to this I have started trading on ZERODHA as well.
Can you please let me know if there are any internships available at ZERODHA Bangalore for me to apply/join as I am very eager to get hands on experience at a trading firm.
Plus until I head to college I want to gain experience and employ my time to good use.
Please consider my case and let me know if I am eligible to intern at ZERODHA at any available positions for the sole reason of gaining hands on experience.
Looking forward to hearing from you soon.
If you want to get in touch with me through email, my email is [email protected]
Hardik, I really appreciate your enthusiasm to learn and such a young age. Unfortunately, we don\’t have internship opportunities/programs at Zerodha. Good luck.
Hi Karthik! It’s hardik here. Thanks to all the knowledge I was able to amass through zerodha’s varsity program and helpful tips from you in this comment section Along the way, I have started to trade. I have opened my trading acc though zerodha itself and bought my first shares last week! I am very excited to go through and happy to have started trading at 18.
Now I have bought shares through the long term option, could you let me know how the intraday trading works on zerodha since the securities come in demat after 2 days, does it matter while doing intraday trade? And is there a penalty if u don’t square off a position by the end of the day?
Hardik, in intraday you buy and sell within the day. I\’d suggest you experience this by actually buying a stock say quantity of 1 or 2 and selling that off in the same day. You will get a sense of how it works.
Thanks a lot Karthik, will get started on this.
According to your professional opinion, given this is my first time investing, do you think I should solely rely on a brokers advice on which stocks/derivatives to buy or should I perform my due diligence and make an intricate analysis by using excel and the knowledge provided in the technical analysis and risk management modules of Zerodha by not investing a large capital at once but only investing slowly and diligently?
Thanks
Its always a better idea to do this yourself rather than rely upon other\’s opinions. It will be a slow start, but a much better foundation for a your investing and trading journey.
Hi karthik,
I would like to start trading , I’m just 18 years of age and have managed to organise sufficient funds to trade.
I choose zerodha as my broker. Now I have all the documents including PAN Card and a bank account- are these sufficient to start trading at zerodha or do I need to mandatorily get a demat account? (Do note I just want to buy/sell not enter the f & o segment as this is my first time) if a demat is required please let me know how I can open one with zerodha itself.
Thank you so much.
Happy to note that you are starting your investing journey early in life 🙂
You can open a trading and demat account online itself by following the instructions here – https://zerodha.com/?ref=varsity
No worries! Thanks a lot for your help!
Thanks Karthik! I have taken commerce in 12th grade. What universities/ colleges would you recommend here so as to have a good start to a career in finance and exactly which degree should I look to do?
It would be a huge help if you could give me your insight to this.
Thanks!
Hardik, I\’m really not glued in on colleges and University options. I may not be the best person to comment on it. I just laid down the generic direction for you 🙂
Thanks a lot Karthik! I had another query…
I am currently in 12th and I’m extremely interested in getting into finance as a career from some time. Now I have been amassing finance knowledge from various places ( zerodha being the best) like Khan academy, investopedia, YouTube and zerodha and Its been really exciting to get know how the financial systems work. For my undergraduate degree I’m considering going to the states and entering the American markets after my bachelors and masters but the matter is still being decided at my home. What would your view be of a student like trying to get into finance, should I go study abroad and then try getting in states or European markets or should I stay in India, study here and try getting into finance here?
Hardik, if you are super clear about Finance as a career path, then you can try exploring options here itself –
1) Basic undergrad + CFA
2) You can think about FRM and CQF
3) Plan well from now only for an MBA in finance at a premier institute
Options are plenty. But on the other hand, US is a far more mature market and has plenty of opportunities, but can be very expensive to get started.
Hi Karthik! Huge fan! To get the expected return of each stock you have multiplied their daily average by 252 for ex Cipla has 15.62 which is calculated by multiplying 0.06 by 252 . I have created a portfolio but I have considered a years data; now to calculate the expected return should I still multiply daily avg of returns by 252 or should I not? Given I have taken a years data into consideration.
Thanks! Looking forward to your reply
Yes, to scale the expected return over any time period, multiply the daily return with the time period under consideration.
Hi Karthik.
I cant thank you enough for all these articles, as these are quite essential for me and everyone to embark on their investing journey.
I was trying to download the excel but there is no response after clicking the link. Could you please assist me here?
Thanks, Srikanth. Let me check this.
how can we multiply daily return by 252 to get annualized return. A 100% gain on first day will double your money but a 50% loss on 2nd day will wipe out all the gains. By the multiplication formula above, in this case we get an average daily return of 25% and annualized return of 50%(lets assume a year is only of 2 days). But actually, annual return is 0% as a 50% loss has wiped out 100% gains
Hence you can use log returns for this, Sarang.
hey, great article thanks. So I took 1 year of nifty 50 stocks data and select the top 15 stocks based on their market-cap . Now weights are also assigned based on its market-cap so the highest market-cap has the highest weight value and the lowest has the lowest weight value. when I calculated the expected year returns, the value is negative (-23.75%). so what does it mean? is it mean it will lose the money over next year? and so then how to calculate range from it? another thing I want to discuss is that my annual variance is 22.13% which is already close to the expected annual return so multiplying annual variance with 2 or 3 (95% confidence ) doesn\’t make sense. is it because I\’m using 1 year of data?
Hmm, why did you market weight the investments? I\’d suggest you check the next few chapters on content related to portfolio optimization. Optimization will give you better insights into the kind of weights you need to assign.
Hii sir 🙂
Is The expected returns displayed in smallcase funds or any Other Mutual funds are average expected return of portfolio or they are the returns with more confidence level i.e returns by considering 2nd S.D. ?
All sorts of \’expected returns\’ are indicative returns and not real returns. Btw, are you sure they publish expected returns?
Daily average return calculated is wrong. I downloaded the worksheet and noticed that there is an error in the Average function used. The data used for average is from cell 51:130 for all stocks but should have been from 4:130. As a result it is turning out to be much greater than the actual. Please make this correction as someone might be using the same worksheet and same no. of data points for actual trading.
Hey Sahib, thanks for pointing this. Let me check this.
Hi,
My question is, say I do this exercise and now I can statistically say with 95% accuracy that my portfolio returns would be between 19 and 90% but the range is so wide here. How does this number, I mean this range, help me in making a real life decision about my portfolio in any way? Thanks in advance :\’)
Ganesh, clearly the range is wide and quite useless. These are times you can reduce the SD to say 66% and see if you can deal with the numbers.
So here we forecast the future based on historical data
Is this right or wrong?
Yes, thats right.
Sir,to calculate expected returns you multiplied daily avg with 252 but instead it should be with SQRT(252)!!As discussed in earlier chapters!!! Would you enlighten me on this??
You are the best source of knowledge for stock markets. Really Appreciable.
No, return should not be multiplied by Sqrt of time, that\’s only for volatility.
Good Day,
Thank you so much for this amazing content!
Just wanted to know, being a long term investor (3-5 years) approx, is it okay to gauge the risk by considering weekly avg. returns instead of daily returns?? or will it cause too much change in the confidence levels ??
Great module Mr. Karthik. Firstly id like to commend you on the clarity of content that you ve provided.
I have a question: to plot the freq distributioon curve, what variables must i consider/ is it the returna and date?
Thanks, Guru.
You need to consider returns and the frequency of returns i.e. the number of times it occurs.
wow
thank you sir
Welcome!
sir ,
can we take it as ,till 5th chapter (risk part 4) as one method and 6th and 7th chapters as another method to find out portfolio variance and expected returns?
were in 6th and 7th chapters we can find out portfolio variance and expected returns from daily returns of the weights of the stocks?
Hmm, maybe you can 🙂
my annual ROI is 107% average maintained. Now, my next target is 150%. 🙂
Good luck!
Sir I have calculated annual return of Infosys and I got 40% negative return but when I use kite platform the info of Infosys shows positive return of 18%. Have I calculated it wrong?.Because it cannot give positive return as price of share has dropped over the period.
Maybe you should double check the dates again.
I downloaded data from NSE of 365 days and I doubled check regarding dates.On 23 May 18 price of share is 1184.9 and on 22May 19 it is 709.75.So 709.75/1184.9-1 = – 40.10% and info says 20.18% 1 year return on kite platform.
Ah, then you need to clean up the data for bonus/split 🙂
Thank u so much sir.So for calculating portfolio variance also I have to clean up bonus split
Yes, thats right.
Hi Karthik,
Just wanted to confirm the answer for your question – How would we estimate the same for range of 3 months/ 3 weeks?
We would convert daily returns to appropriate range and proceed with similar calculations.
Is that correct?
Thanks
Yes, you can convert the daily return to the desired time frame.
Hello sir
In the 44th page of 7th chapter, the daily average return is different from the daily average return that we got in chapter 3 14th page. I have downloaded the excel sheet that has been used in 7th chapter. It shows that you have taken average from C51 to C130 while you took C1 to C130 in chapter 3. Is there a reason behind this or this is a calculation mistake?
I must have taken the latest data set. The technique remains the same though.
Hi Karthik,
Regarding Return of the stock for past data will available in NSE, If i need the Dividend information of past data, where can i get with free. Whether it will available for free?
Thanks in Advance.
You will have to dig up the dividend history. This is available on money control I guess.
Very Helpful. Pls document this in PDF format.
It is already available. Please feel free to download the same.
Sir, thank you for your great work.
My question is that, standard deviation and variance are different things.So why you have used variance instead of standard deviation.
The 68-95-99 rule applies to standard deviation,I think…
They both are the same – square root of variance yields standard deviation.
Ok..but have we done the square root in the above example..,if not, why??
I guess we have.
And sorry to bother you..but I have one more question,I have read somewhere that stock prices do not follow normal distribution. Please clear my confusion on this.
Is it like that ,that stock prices do not follow normal distribution but their daily return follow, normal distribution??
Thank you in advance for your help.
Yes, stock prices don\’t – remember the prices can trend either upwards or downwards for an extended period of time. But the stock returns does, somewhat, display a normal distribution.
Hi Sir,
In the above discussion, our expected return from Cipla is 15.49% (leave errors). But the base price consiered to calculate this return changes on daily basis.
Suppose, if on 1.10.17, Cipla\’s closing price is 500 and on 2.10.17, it is 400, then our return is (20%). Suppose on 3.10.17, closing price is again 500, then our return would be 25%. If we consider the above formula, our avg daily return would come 2.5%, but in actuals, our return is 0% and vice-versa.
Therefore, our return of 15.49% would be baseless, when calculated on our purchase price.
Well, for this exact reason you may want to consider taking log returns!
Hi Karthik,
It is said that more than 90% traders lose money in intraday. In my opinion the reason could be due to low risk and high reward ratio strategy. What, if the ratio is reversed. For example, I picked up a stock after studying it carefully and I buy Qty- 1 for 100/- and put stop loss at 94/- and target at 102/-. This way, if price goes down 2 or 3 points my stop loss would not be triggered and and target would be achieved when trend changes. But, If I put stop loss at 98/- and target at 105/- then chances of stop loss triggering are extremely high than hitting the target. Needless to say one must be mentally ready for 6/- loss for a risk of 2/-. Do you agree with my point ?
I\’d attribute lack of discipline as the main cause of the losses. Risk reward etc can be adjusted based on position sizing.
I think the values calculated are wrong here.
I have a screenshot of the error but I will try to explain it here.
The very first thing is that the average taken of each individual stocks is wrong.
Example: if we look at the excel as shared in this varsity (downloadable attachment) shows average of stocks as thus
Cipla in Cell C 131 = 0.06%, Idea in cell E131 = 0.57%, Wonderla in cell G131 = 0.06%, PVR in cell I131 = 0.15% and Alkem in cell K131 = 0.29%.
However, actual values upon calculation are Cell C 131 = 0.02%, cell E131 = 0.26%, cell G131 = -0.05%, cell I131 = 0.12% and cell K131 = 0.23%.
The Portfolio Variance is 1.11% and Annualized = 17.57%
Expected return = 29.70%
Confidence Interval as follows
SD 1 SD 2 SD 3 SD
Upper 47.27% 64.84% 82.41%
Lower 12.13% -5.45% -23.02%
*The error was in calculating the average at the first step i.e for example for Cipla = average(C51:C131) instead should be average(C5:C131).
The same for all the other 4 stocks.
Hope you will ratify the error and repost.
Absolutely agree, Himanshu. I\’ve missed calculating the average for all cells but by mistake calculated only for few cells. Someone pointed this earlier as well (check the comments). I; ve not really rectified this as these calculations would have to be changed across many chapters. I regret this mistake.
However, I\’d suggest you download the excel and make that small correction, the model will self-correct.
Hi,Kartik I am learning a lot from you.Every thing you provide here in an unique and easy way..i would like to ask you a question here..you have used portfolio variance instead standard deviation because standard deviation would give us a wide range,am I right?
Can I know,where should I exactly use standard deviation instead variance and variance instead std..?because in option the same approach was done with standard deviation to use confidence level.Do you mean for single stock std used and for over all portfolio variance used to interpret confidence level.
For a single stock, its best to use the standard deviation…but like you mentioned, for portfolios use the port variance.
First of all would like to appreciate you for your kind replys to all comments..
Then thank you for making such a clear theory on all the topics..
Now I feel I have wasted my 5 years of trading session with other brokerages..
Really appreciate your team for all your work.. User friendly system !!! Simply great..
I have one question, after knowing all chard reading method I am confused applying all of them on intraday trading.. Could you please suggest few charts which I can follow up for intraday ?
why not you provide ADX indicator in ZERODHA Pi.
Its there.
Sir I\’m reading all your modules thoroughly please make sure you post the trading strategies module as soon as possible I\’m very eager to start trading with your platform….
Sure, will do as soon as the current module is through.
Thanks a lot for such a great initiative. I\’ve never seen so much information about finance in such easy to unterstand language at one place.
This might be a slightly uncorrelated quoestion but I want to start learning algo trading and quant finance.
I\’ve engineering background and have 6-7 years experience in investing in stock markets. Is it feasible to someone like me to get started in these fields, or is it a domain of those have advanced degrees in math, comp sc. etc(as many would have you believe).
What is the best place to get started. Want to set up my own algo trading desk someday.
Quants is a highly specialized field and is heavily dependent on maths. I\’d suggest you check out CQF certification to get an idea of how intense this can get.
Went to CQF course. The course is quite on expensive side.
Is there any other cheaper course that teaches this from Indian markets perspective.
Do we need to know advanced math if we just want to do algo trading from home?
Math is good to know…and if Qants is the direction you want to head, then there are no other good options.
Great
Cheers!
Thanks a lot for initiating such a nice Varsity. I would like to know, do you have any plan to launch a mobile app for Varsity? That would be a great interface to learn on the go.
Varsity is already mobile friendly, the site itself adjusts to the mobile device.